VCP-dependent muscle degeneration is linked to defects in a dynamic tubular lysosomal network in vivo
- University of California, San Francisco, United States
Figures
Figure 1
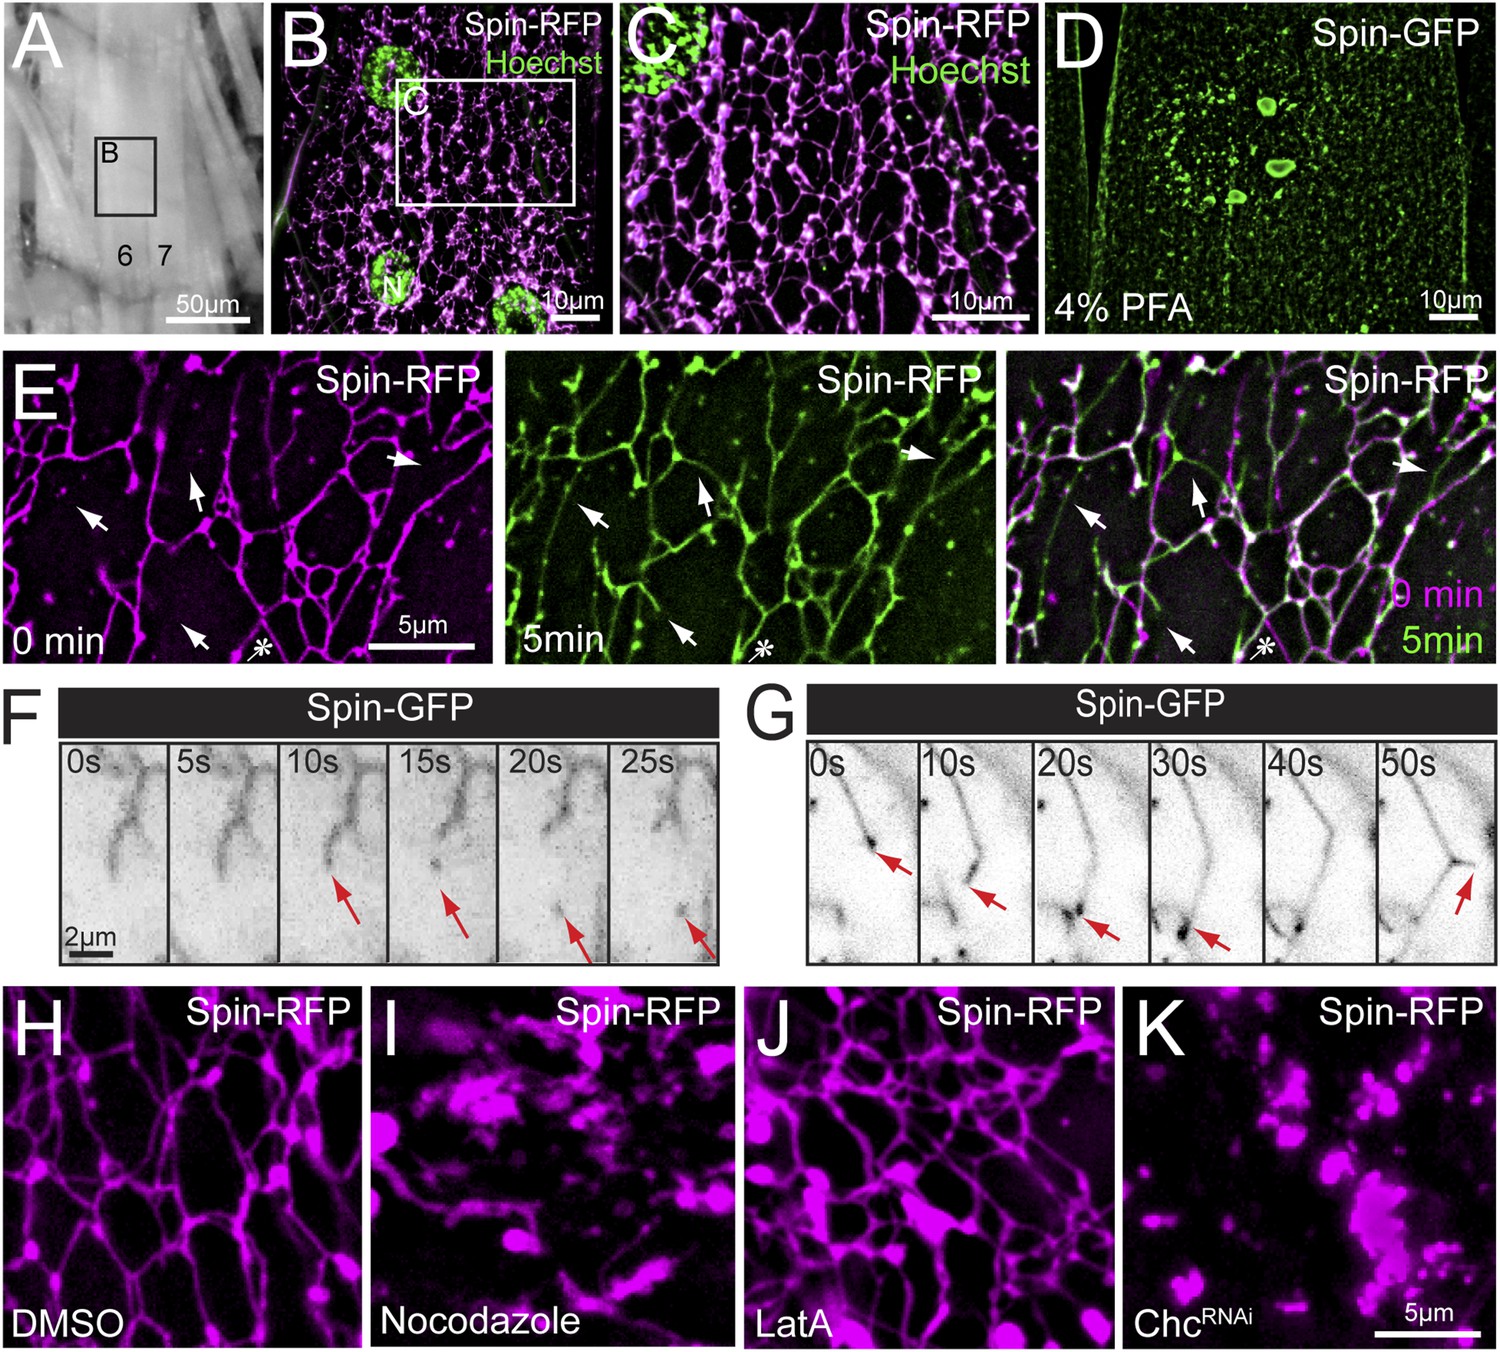
Lysosomes adopt an extended dynamic tubular array in Drosophila sarcoplasms.
(A) Muscles of third instar larvae from segment A2. (B) Representative live image of Spin-RFP expressed in muscles at 63× magnification. Muscle 4 (B) is shown. DNA was stained with Hoescht. (C) Representative live image of Spin-RFP expressed in muscles using the muscle-specific MHC-Gal4 driver. DNA was stained with Hoescht. (D) Representative image of Spin-GFP localization in a muscle that was fixed with 4% PFA prior to imaging. (E) Time-lapse images of the Spin-RFP network. Time 0 is represented in magenta, and the 5 min time-point is represented in green. The 2 time points were merged to show new and lost tubule formations over the course of 5 min. Arrows indicate examples of de novo tubule formations and the asterisk indicates a retracted tubule. (F) Representative time-lapse sequence of a Spin-GFP tubule fission event. (G) Representative time-lapse sequence of a Spin-GFP tubule fusion event. In the last frame, a de novo tubule can be seen extruding from the middle of a pre-existing tubule. (H–J) Spin-RFP localization in muscles treated with DMSO (H), Nocodazole (I) or LatA (J). (K) Spin-RFP localization in muscles expressing Clathrin heavy chain (Chc) RNAi.
Figure 2
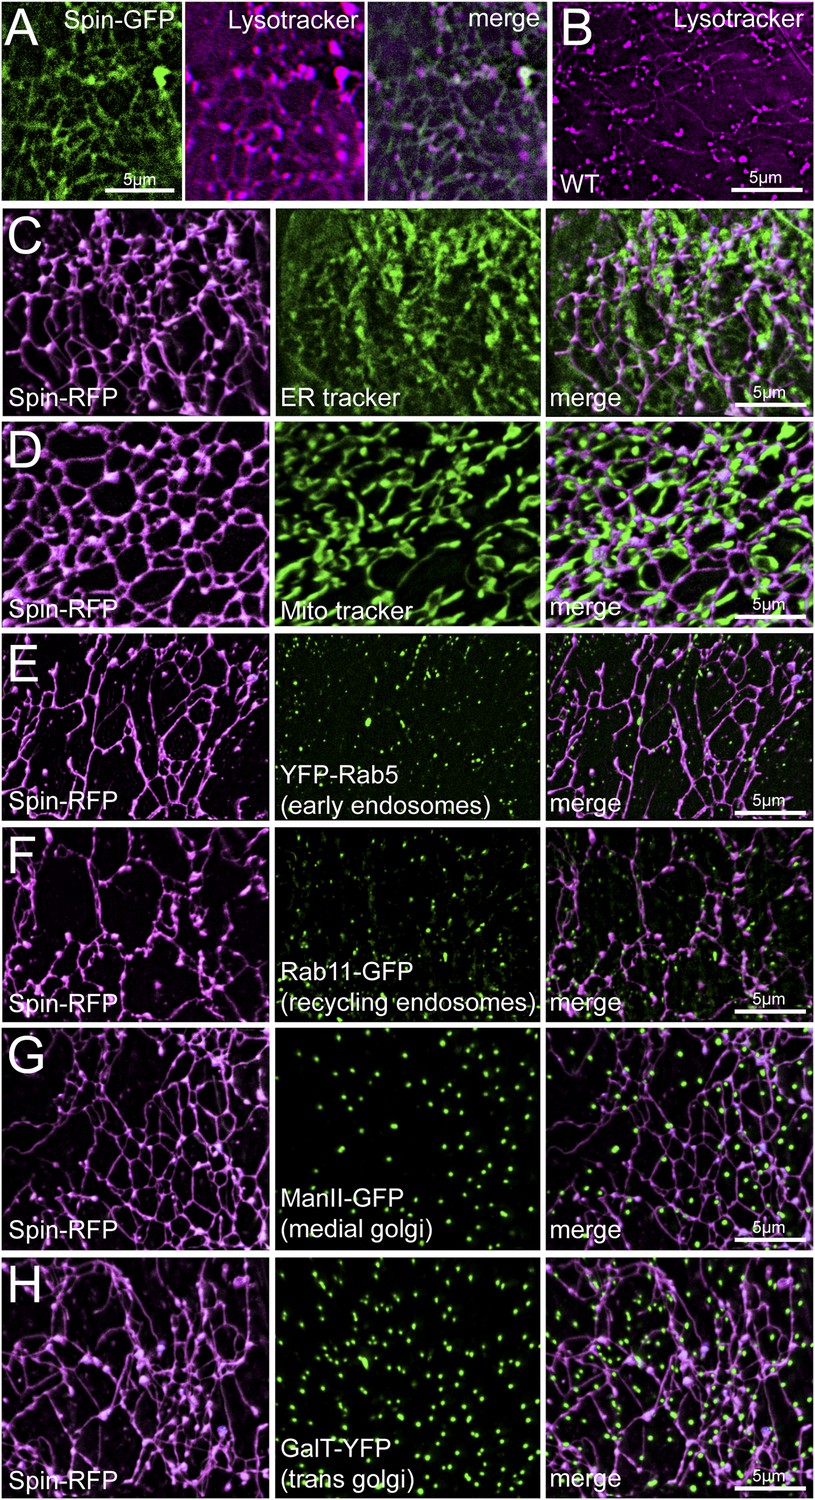
Spin-RFP tubules do not co-localize with mitochondria, ER, golgi or early endosomes.
(A) Co-imaging of Spin-GFP and Lysotracker Red staining. (B) Lysotracker staining of wild type muscles. (C–H) Co-imaging of Spin-RFP with ER tracker (C), Mito tracker (D), YFP-Rab5 (E), Rab11-GFP (F), ManII-GFP (G), GalT-YFP (H).
Figure 3

VCP inhibition disrupts the lysosome tubule lattice and human VCP rescues this defect.
(A) Representative live image of Spin-RFP expressed in muscle using the muscle-specific BG57-Gal4 driver. (B) Live image of Spin-RFP in muscles expressing VCP-RNAi using the muscle-specific BG57-Gal4 driver. (C, D) Live images of Spin-RFP expressed in muscles that were treated with DMSO (C) or the VCP-specific inhibitor DBeQ (D) for 4 hr. (E) Live image of Spin-GFP expressed in muscles using the muscle-specific BG57-Gal4 driver. (F) Live image of Spin-GFP in muscles expressing VCP-RNAi using the muscle-specific BG57-Gal4 driver. (G) Live image of Spin-GFP in muscles that co-express VCP-RNAi and human VCP (hVCP) using the muscle-specific BG57-Gal4 driver. (H–J) Lysotracker staining in wild type (H) muscles or muscles expressing parkin-RNAi (I) or tbph-RNAi (J). (K, L) Spin-RFP localization in muscles treated with DMSO (K) or tunicamycin (TM) (L). (M) Western blot analysis of total Hsc70/BiP protein levels. Tubulin serves as a loading control.
Figure 4
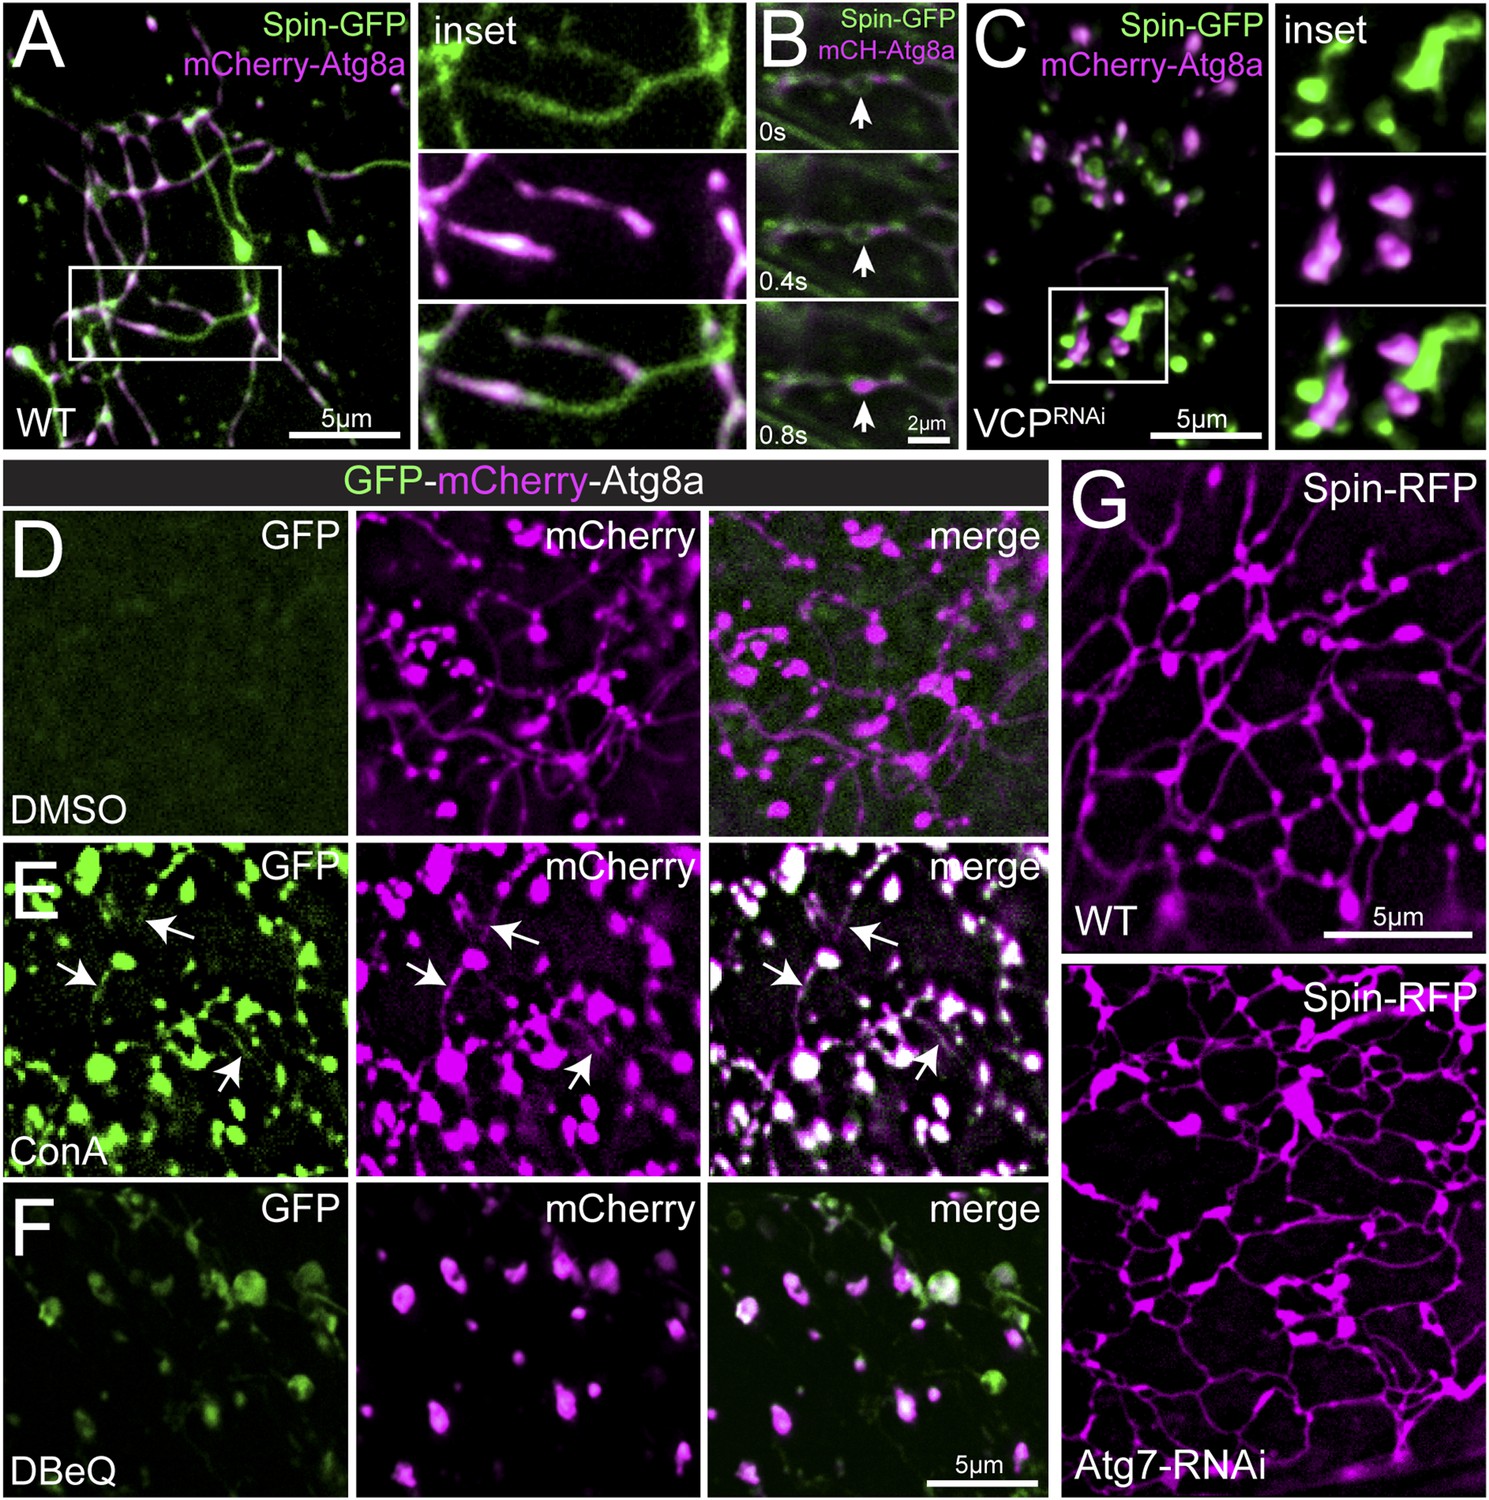
Autophagosomes co-localize with the tubular lysosomal network.
(A) Representative live image of Spin-GFP and mCherry-Atg8a co-expressed in muscles using the muscle-specific BG57-Gal4 driver. (B) Representative time-lapse sequence of Spin-GFP and mCherry-Atg8a in muscle. The arrow follows a mCherry-Atg8a positive puncta trafficking along a Spin-GFP tubule. (C) Spin-GFP and mCherry-Atg8a no longer co-localize in muscles expressing VCP-RNAi. White box indicates region shown at higher magnification and separate channels at right. D. Live image of GFP-mCherry-Atg8a in muscles treated with DMSO for 3 hr. Note the lack of GFP signal. (E) Live image of GFP-mCherry-Atg8a in muscles treated with the V-ATPase specific inhibitor Concanamycin A (ConA) for 3 hr. Note the presence of GFP-positive tubules. (F) Live image of GFP-mCherry-Atg8a in muscles treated with the VCP-specific inhibitor DBeQ for 3 hr. Note the presence of GFP-positive vesicles. (G) Spin-RFP localization in WT muscles or muscles expressing Atg7-RNAi using the muscle specific BG57-Gal4 driver.
Figure 5 with 1 supplement

VCP co-localizes with the tubular auto-lysosomes.
(A) Representative live image of VCP-Venus and Spin-RFP expressed in muscles using the muscle-specific BG57-Gal4 driver. White box indicates region shown at higher magnification and separate channels at right. (B) Representative live image of VCP-Venus and mCherry-Atg8a expressed in muscles using the muscle-specific BG57-Gal4 driver. Inset as in A. (C, D) VCP-Venus and mCherry-Atg8a localization in muscles treated with the VCP inhibitor DBeQ (C) or the proteasome inhibitor MG132 (D) for 3 hr. (E) Western blot analysis of total VCP protein levels from muscles in the treatments indicated. Tubulin serves as a loading control. (F) Representative time-lapse sequence of VCP-Venus and mCherry-Atg8a after MG132 was washed out. The arrow indicates a tubule extending from a mCherry-Atg8a positive vesicle.
Figure 5—figure supplement 1
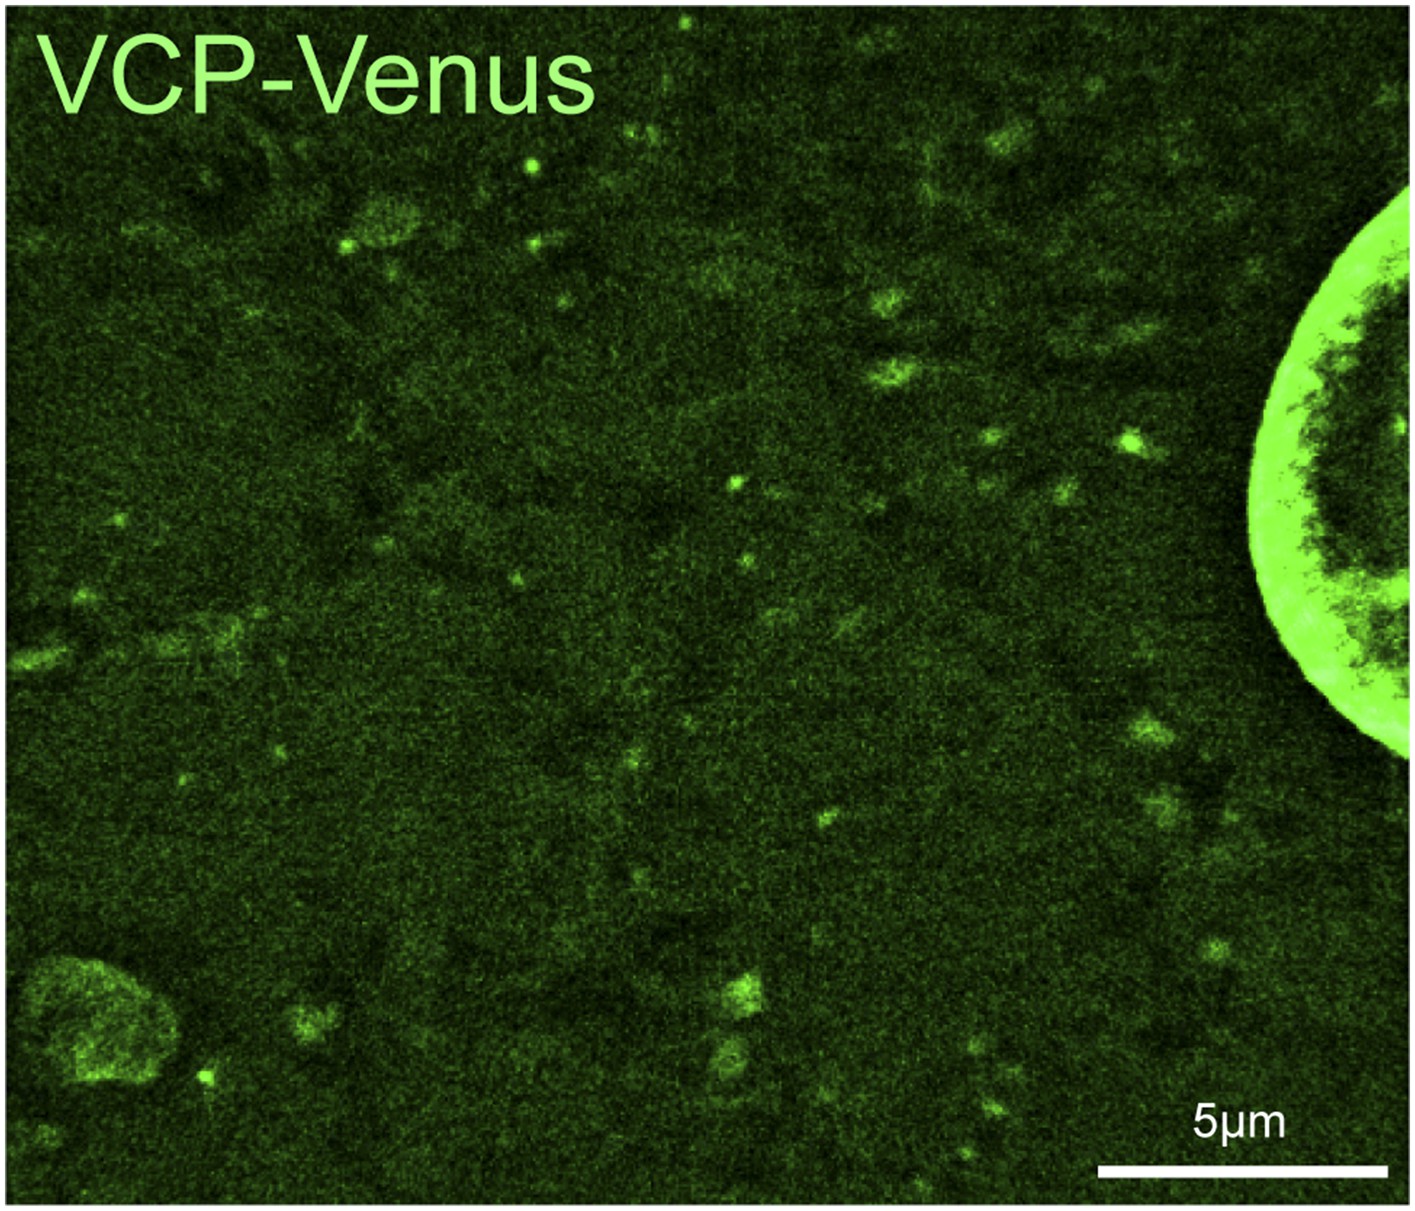
VCP-Venus localization in Drosophila muscle.
https://doi.org/10.7554/eLife.07366.013
Figure 6 with 2 supplements

Disruption of the tubular auto-lysosomal network correlates with increased poly-Ubiquitin aggregates, impaired mitochondria and increased lipofuscin granules.
(A, B) Wild type (A) and VCP-RNAi (B) expressing muscles were fixed and stained with a poly-Ubiquitin antibody. Nuclei with localized poly-Ubiquitin staining are apparent in A. Nuclei are indicated (dashed circle) in B. (C, D) Wild type animals were treated with DMSO (C) or the VCP-specific inhibitor DBeQ (D), fixed and stained with a poly-Ubiquitin antibody. (E) Quantitation of the number of poly-Ubiquitin aggregates per 50 µm2 from wild type muscles treated with DMSO for 4 hr or DBeQ for various times (n = 9, *p < 0.05, **p < 0.01). (F) Localization of Spin-GFP and poly-Ubiquitin in muscles expressing VCP-RNAi. (G, H) Mitotracker-C2TMRos staining in control (G) and VCP-RNAi (H) muscles. (I–K) Autofluoresence at 488 nm and lysotracker staining in wild type (I), muscles expressing VCP-RNAi (J), and wild type muscles treated with the VCP-specific inhibitor DBeQ for 4 hr (K).
Figure 6—figure supplement 1
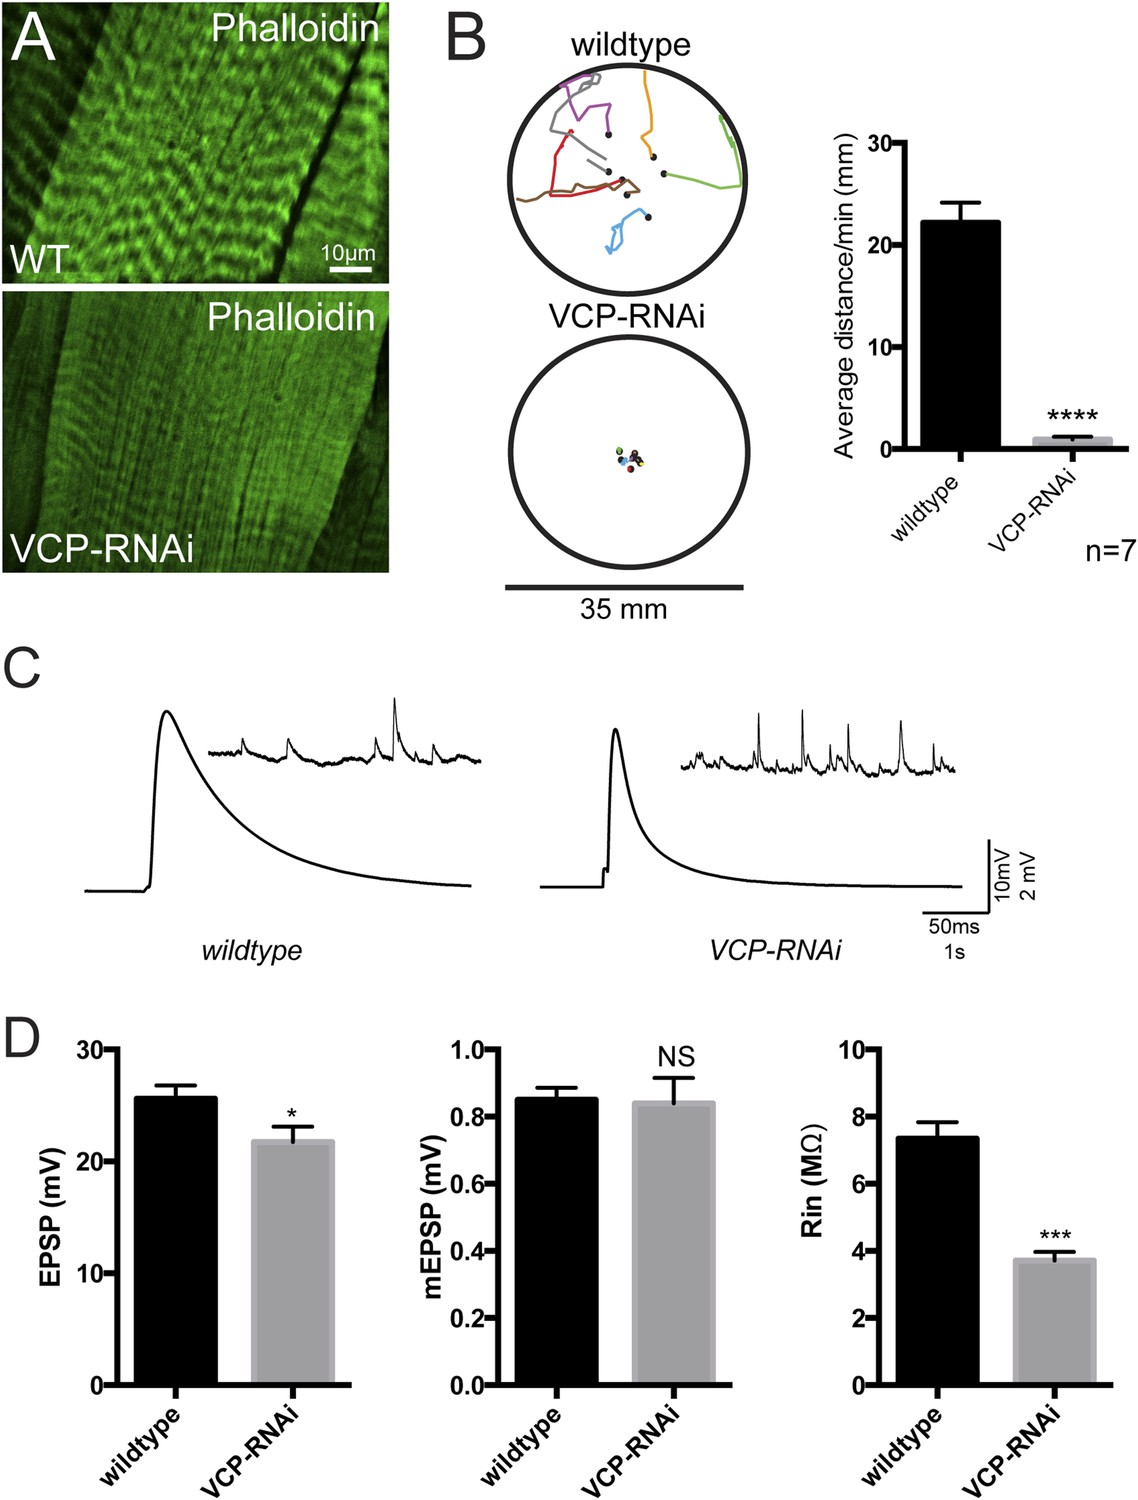
Loss of tubular lysosomes correlates with impaired muscle function.
(A) Wild type and VCP-RNAi gross muscle morphology. (B) BG57-Gal4 control animals and animals expressing VCP-RNAi in muscles were assessed for their crawling ability on a petri dish. (C) The total distance traveled in 1 min was measured for each animal and averaged (n = 7, **p < 0.01). (C) Representative traces for wildtype muscles and muscles expressing VCP-RNAi. (D) Quantitation of EPSPs, mEPSPs and resistance input (n = 10, *p < 0.05, **p < 0.01).
Figure 6—figure supplement 2

Lysosomal acidity and Cathepsin processing are maintained in VCP-RNAi expressing muscles.
(A) Spin-GFP co-imaging with lysotracker in muscles expressing VCP-RNAi. (B) Western blot analysis of Cathepsin L processing in the genotypes indicated. Tubulin serves as a loading control.
Figure 7
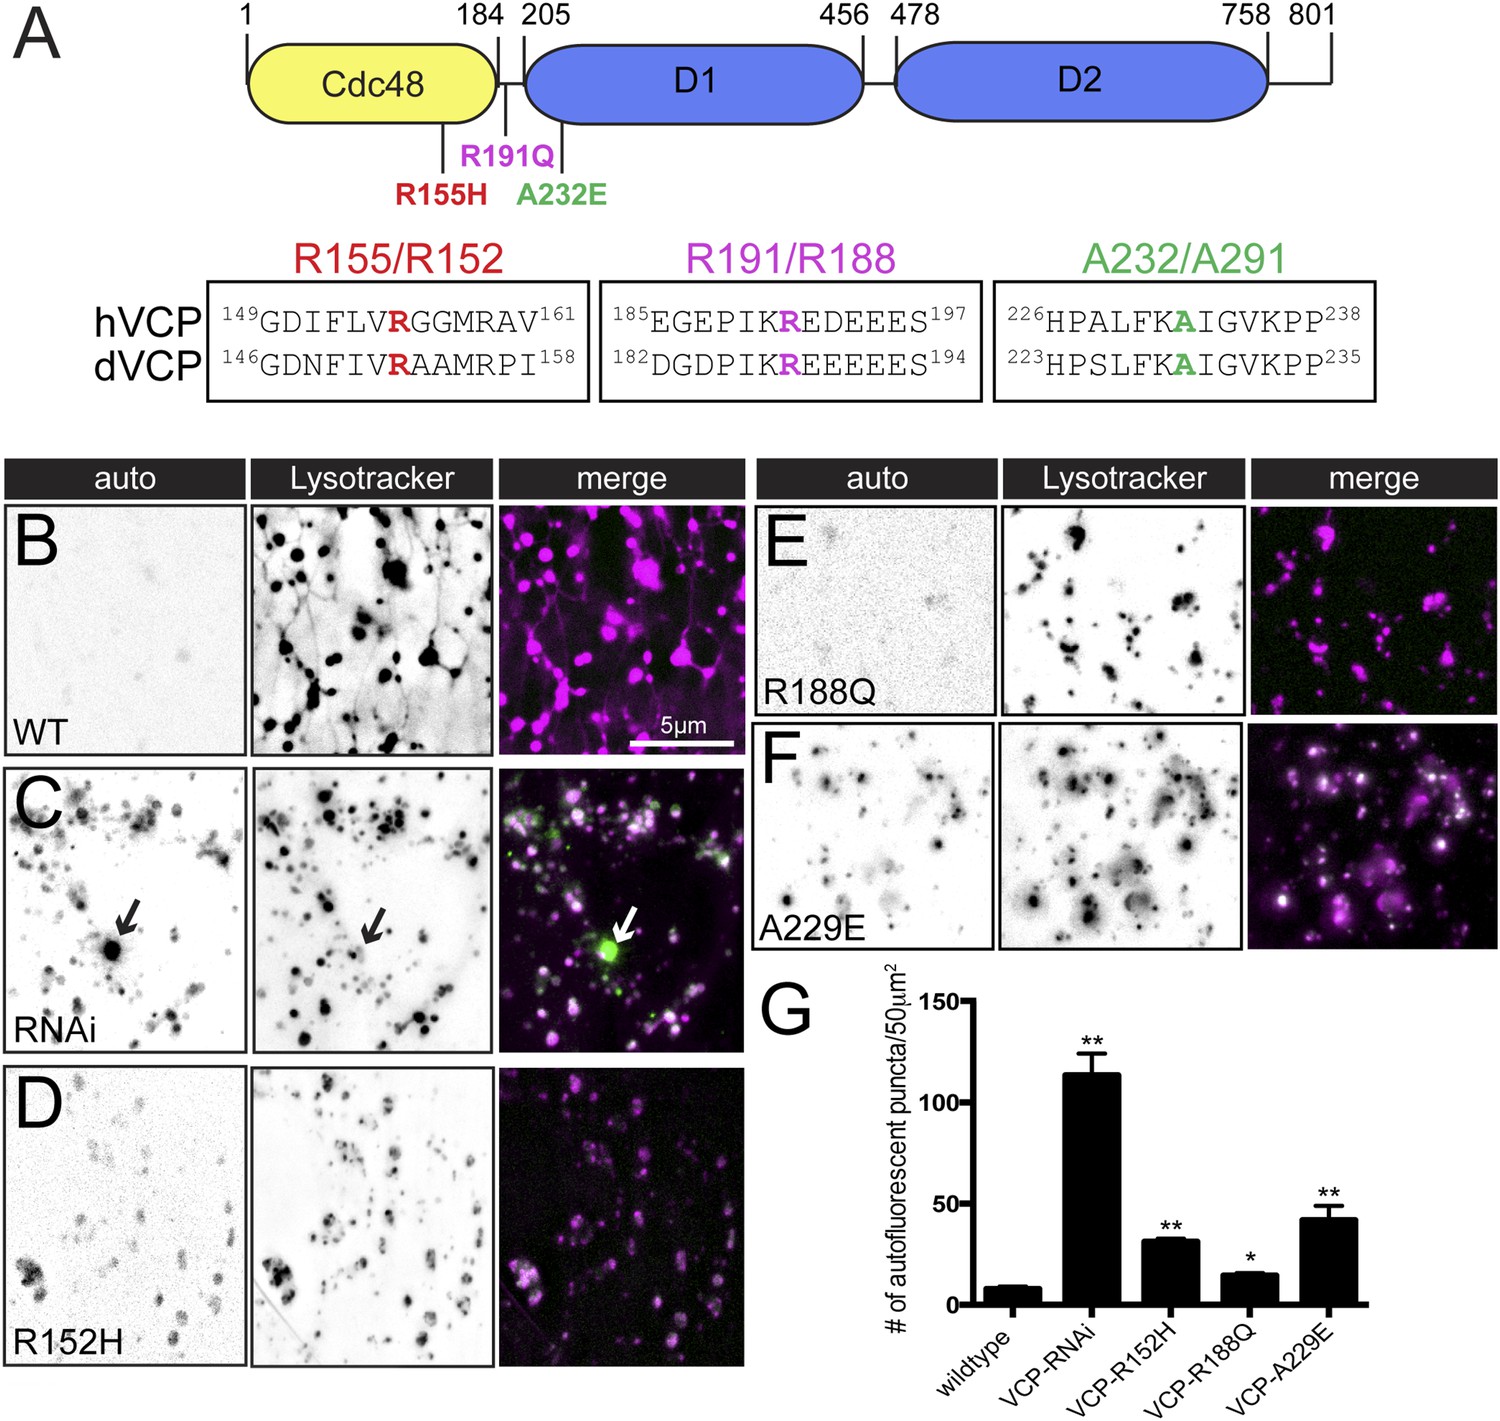
Pathogenic VCP alleles disrupt the tubular auto-lysosomal network.
(A) Schematic diagram of VCP protein. Top: Human pathogenic VCP mutations are labeled on the cartoon. Bottom: sequence alignment of human VCP and Drosophila VCP/Ter94 pathogenic mutant regions. (B–F) Autofluoresence at 488 nm and lysotracker staining in wild type muscles expressing VCP-WT (B), VCP-RNAi (C) VCP-R152H (D), VCP-R188Q (E) or VCPA-229E (F) transgenes. (G) Quantitation of the number of auto-fluorescent puncta per 50 µm2 in the genotypes indicated (n = 9, *p < 0.05, **p < 0.01).
Videos
Video 1
Spin-RFP tubular network in Drosophila muscle.
Spin-RFP was expressed in muscles and imaged live. Average Z-stacks were assembled to produce a 3D volume projection and various angles of the projections are shown.
Video 2
Spin-RFP tubule dynamics in Drosophila muscle.
Representative time-lapse video of Spin-RFP expressed in muscles. Frames were taken at 10 s intervals.
Video 3
Spin-RFP tubule dynamics in an intact larva.
A whole un-dissected larva was immobilized in a mircrofluidics chamber and Spin-RFP was imaged in the body-wall muscle through the transparent cuticle. Frames were taken at 10 s intervals.
Video 4
Spin-GFP dynamics in muscles expressing VCP-RNAi.
Representative time-lapse video of Spin-GFP in muscles expressing VCP-RNAi. Frames were taken at 10 s intervals.
Video 5
Spin-GFP and mCherry-Atg8a dynamics in Drosophila muscle.
Representative time-lapse video of Spin-GFP and mCherry-Atg8 co-expressed in muscles. Frames were taken at 10 s intervals.
Video 6
VCP-Venus and mCherry-Atg8a dynamics after MG132 wash out.
Muscles co-expressing VCP-Venus and mCherry-Atg8 were treated with the proteasome inhibitor MG132 for 3 hr. MG132 was washed out and time-lapse images were taken every 10 s.
Download links
A two-part list of links to download the article, or parts of the article, in various formats.
Downloads (link to download the article as PDF)
Open citations (links to open the citations from this article in various online reference manager services)
Cite this article (links to download the citations from this article in formats compatible with various reference manager tools)
VCP-dependent muscle degeneration is linked to defects in a dynamic tubular lysosomal network in vivo
eLife 4:e07366.
https://doi.org/10.7554/eLife.07366


