TRIP13 is a protein-remodeling AAA+ ATPase that catalyzes MAD2 conformation switching
- Ludwig Institute for Cancer Research, San Diego Branch, United States
- The Scripps Research Institute, United States
- University of California, San Diego, United States
Figures
Figure 1 with 1 supplement
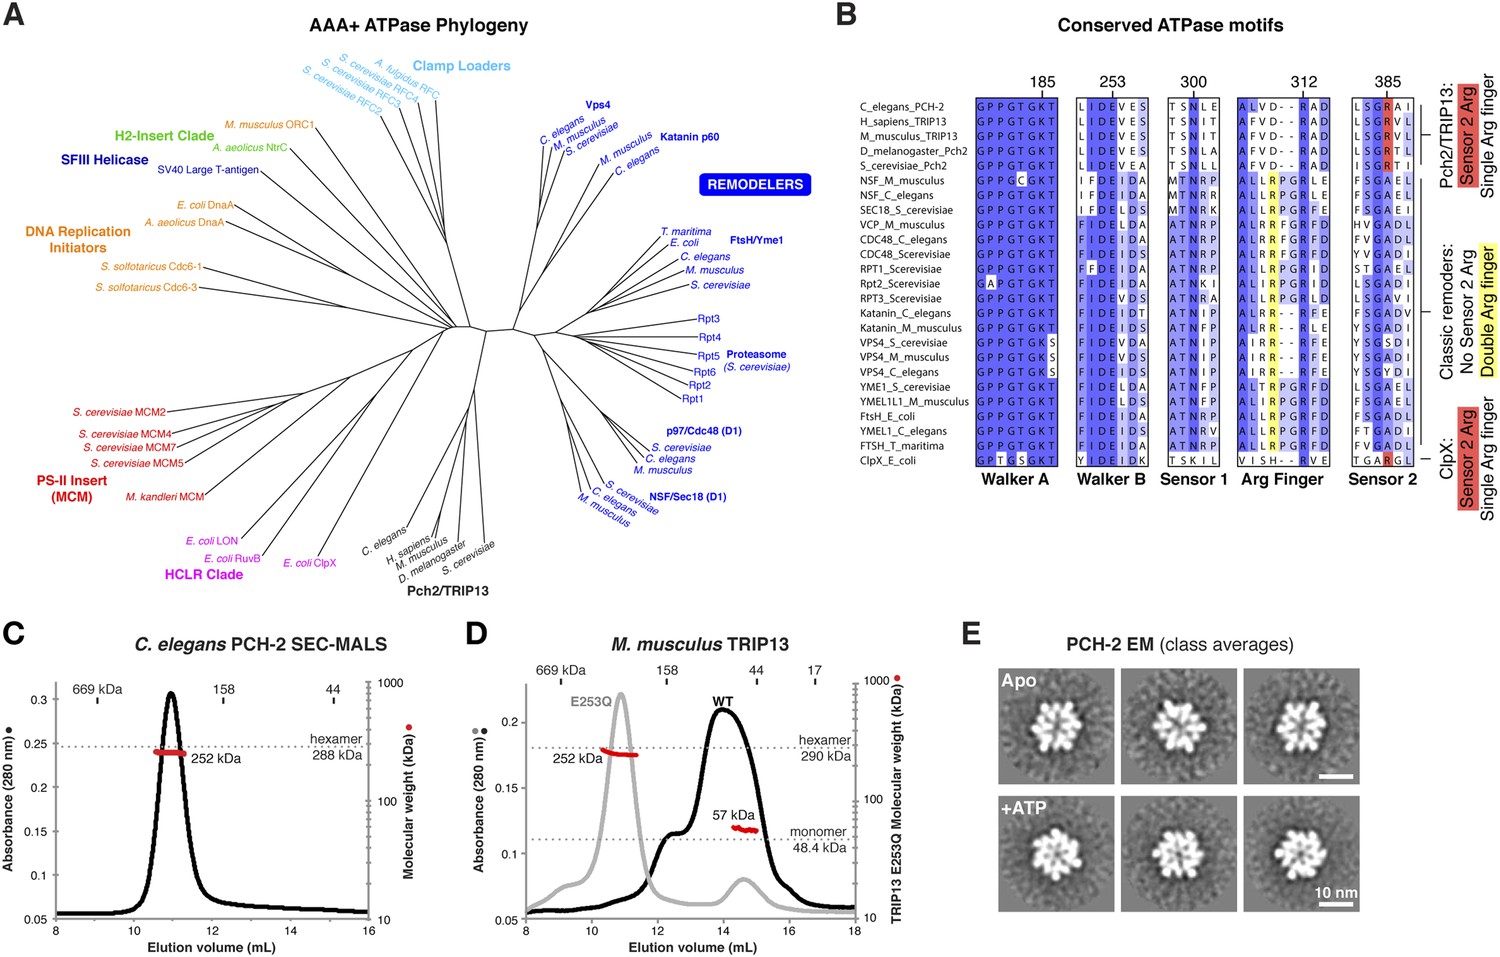
PCH-2/TRIP13 is a distinct class of hexmeric AAA+ ATPase.
(A) Phylogenetic tree of selected AAA+ ATPases, colored by clade (Erzberger and Berger, 2006). (B) Conserved AAA+ sequence motifs in Pch2/TRIP13, the ‘classic remodelers’, and E. coli ClpX. Pch2/TRIP13 and ClpX lack the first of two conserved arginine residues in the Arg finger region (yellow), and possess a Sensor 2 arginine (R385, red), which the classic remodelers lack. (C) Size-exclusion chromatography coupled to multi-angle light scattering (SEC-MALS) analysis of C. elegans PCH-2 in the absence of nucleotides. Hexamer molecular weight = 288.1 kDa; measured molecular weight = 252 kDa (red line). (D) SEC-MALS analysis of M. musculus TRIP13 in the absence of nucleotides. The wild-type protein (black) adopts a mixture of oligomeric states from monomer to hexamer, consistent with findings from S. cerevisiae Pch2 (Chen et al., 2014). The proportion of higher-molecular weight oligomers increases upon the addition of ATP or non-hydrolyzable analogs (not shown). The ATP hydrolysis-defective TRIP13E253Q mutant (gray, molecular weight measurements red) is predominantly hexameric both in the presence (shown) and absence of ATP. Molecular weight measurements by SEC-MALS (red) are shown for TRIP13E253Q; WT measurements (not shown) are consistent. (E) Selected negative-stain EM class averages of C. elegans PCH-2 without added nucleotides (Apo) or with added ATP. For example raw images, see Figure 1—figure supplement 1.
Figure 1—figure supplement 1
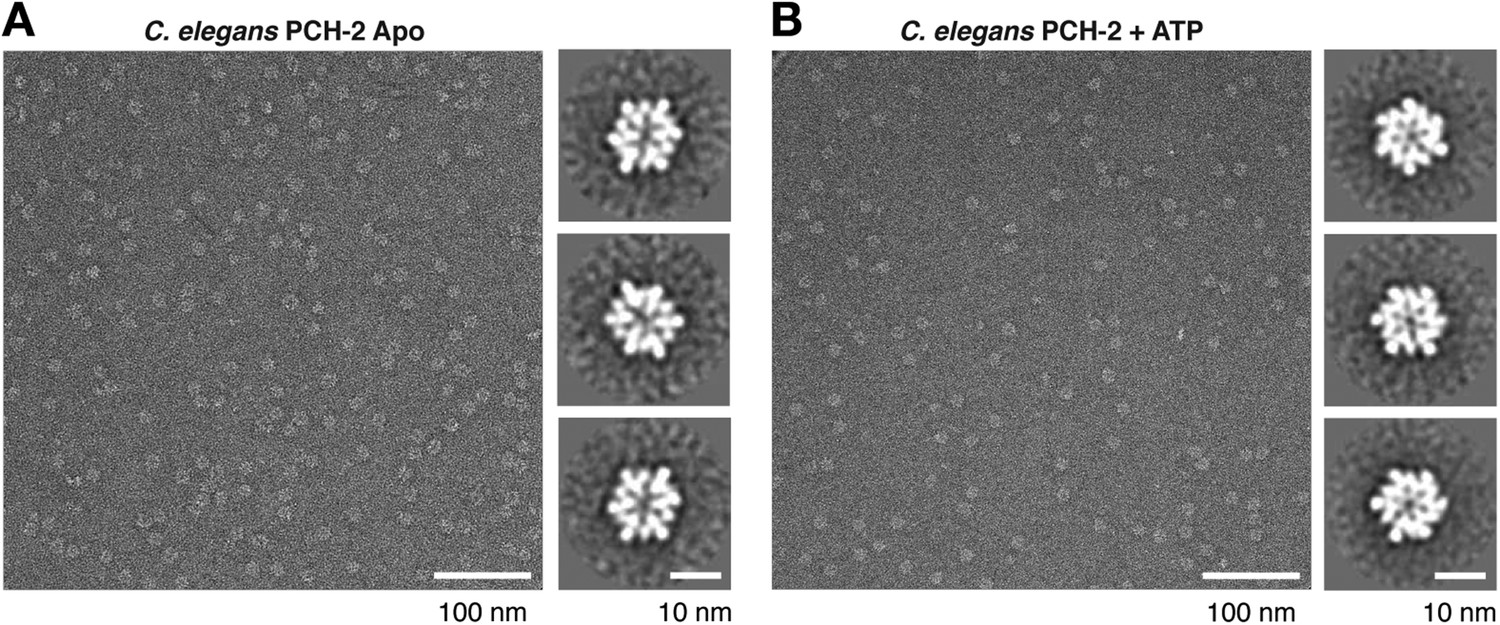
Negative-stain electron microscopy (EM) of C. elegans PCH-2.
(A) Example negative-stain EM image of C. elegans PCH-2 without added nucleotide (Apo), and selected class averages from XMIPP clustering 2D alignment (from 32 classes, 5916 total particles). (B) Example negative-stain EM image of PCH-2 in the presence of 1 mM ATP, and selected class averages (from 16 classes, 4297 total particles). PCH-2 hexamers adopt a more compact and sixfold symmetric conformation after ATP addition. Because of the strong bias toward top-down views of the hexamer, 3D reconstructions were not attempted for either state.
Figure 2 with 1 supplement
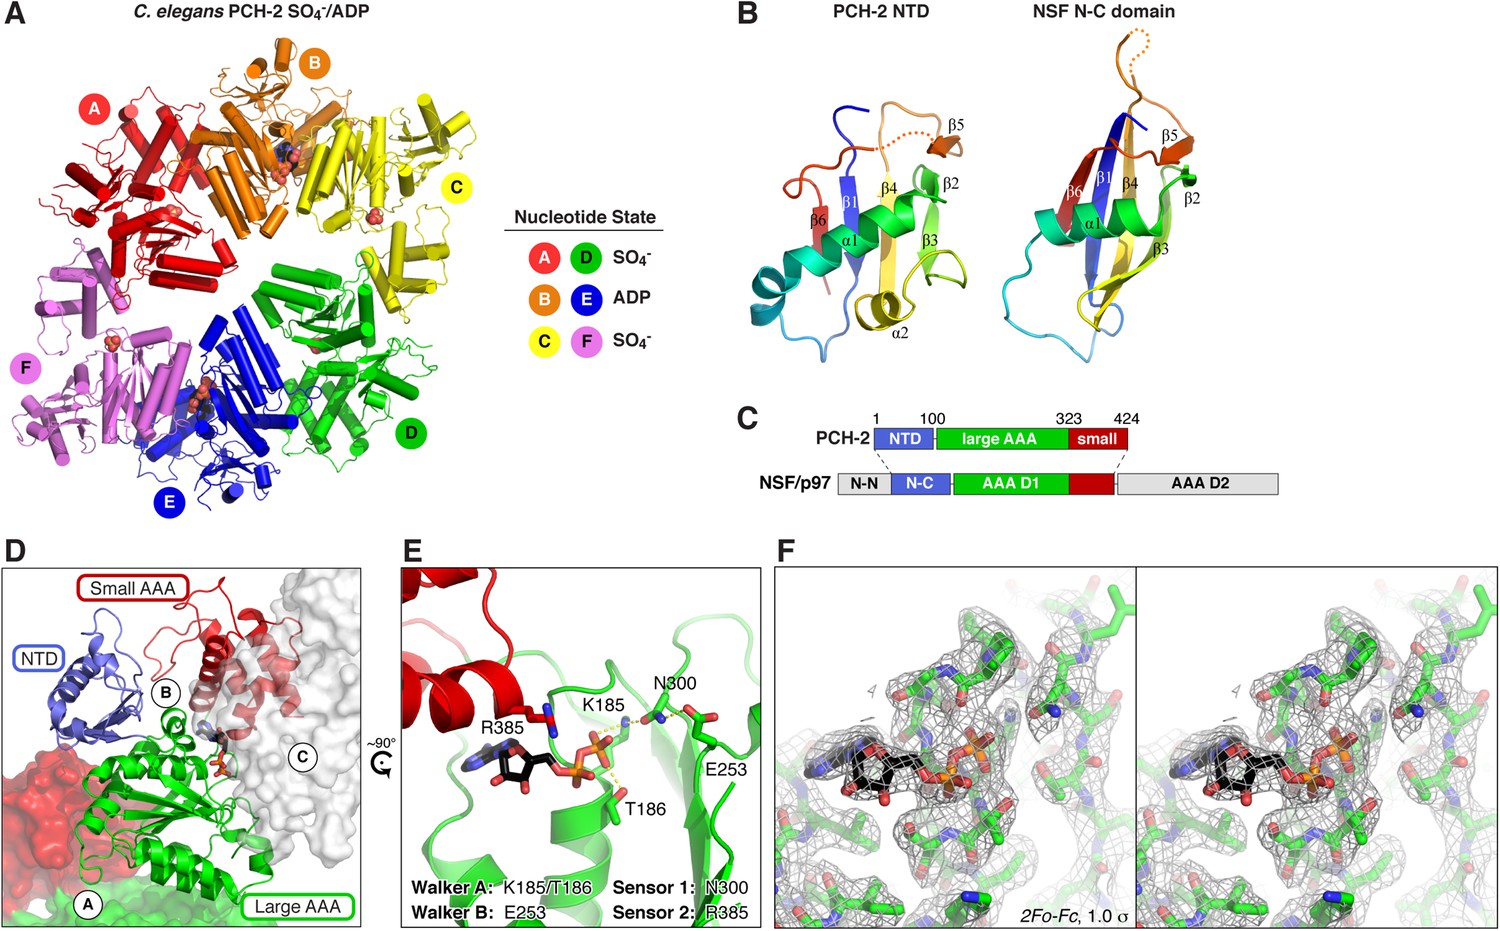
Structure of C. elegans PCH-2.
(A) Overall structure of PCH-2. The hexamer shows a ‘dimer of trimers’ symmetry with chains A/B/C equivalent to chains D/E/F. Chains A/D and C/F are bound to SO4− in the ATPase active site, and chains B/E are bound to ADP (space-fill representation). For data collection and refinement statistics, see Table 1. (B) Structural comparison of the PCH-2 NTD (residues 1–99) with the NSF N-C subdomain (residues 92–189; [May et al., 1999]); Cα r.m.s.d. 1.94 Å over 55 residues. (C) Schematic of Pch2/TRIP13 domain structure vs NSF/p97. Pch2/TRIP13 shares these proteins' N-C subdomain (blue) and one of their tandem AAA+ ATPase regions (green/red). (D) Close-up view of PCH-2 chain B, with domains colored as in (C), showing its packing against subunits A and C. (E) Close-up of ADP bound to PCH-2 chain B, with AAA+ motifs shown as sticks. For close-up views of all six active sites, see Figure 2—figure supplement 1. (F) Stereo view of refined 2Fo − Fc electron density at 2.3 Å resolution, contoured at 1.0 σ, for the bound ADP and surrounding residues in PCH-2 chain B. View is equivalent to (E); the small AAA domain has been removed for clarity.
Figure 2—figure supplement 1

X-ray crystallographic analysis of C. elegans PCH-2.
(A) Mean diffraction intensity divided by standard deviation (I/σ) (left axis, dotted lines) and the half–set correlation coefficient (CC1/2) (right axis, solid lines) for PCH-2 native diffraction data (see Table 1) along the three principal axes a* (red), b* (yellow), and c* (blue). Resolution cutoffs corresponding to an I/σ of 1.0 and a CC1/2 of 0.5 for c* (3.2 Å) and a*/b* (2.3 Å) are shown as dashed lines. (B) Simulated-annealing Fo − Fc electron density map, contoured at 3.0 σ, calculated from a model missing all bound nucleotides and SO4− ions. Views roughly equivalent to Figure 2E are shown for each chain in the PCH-2 hexamer.
Figure 3 with 1 supplement
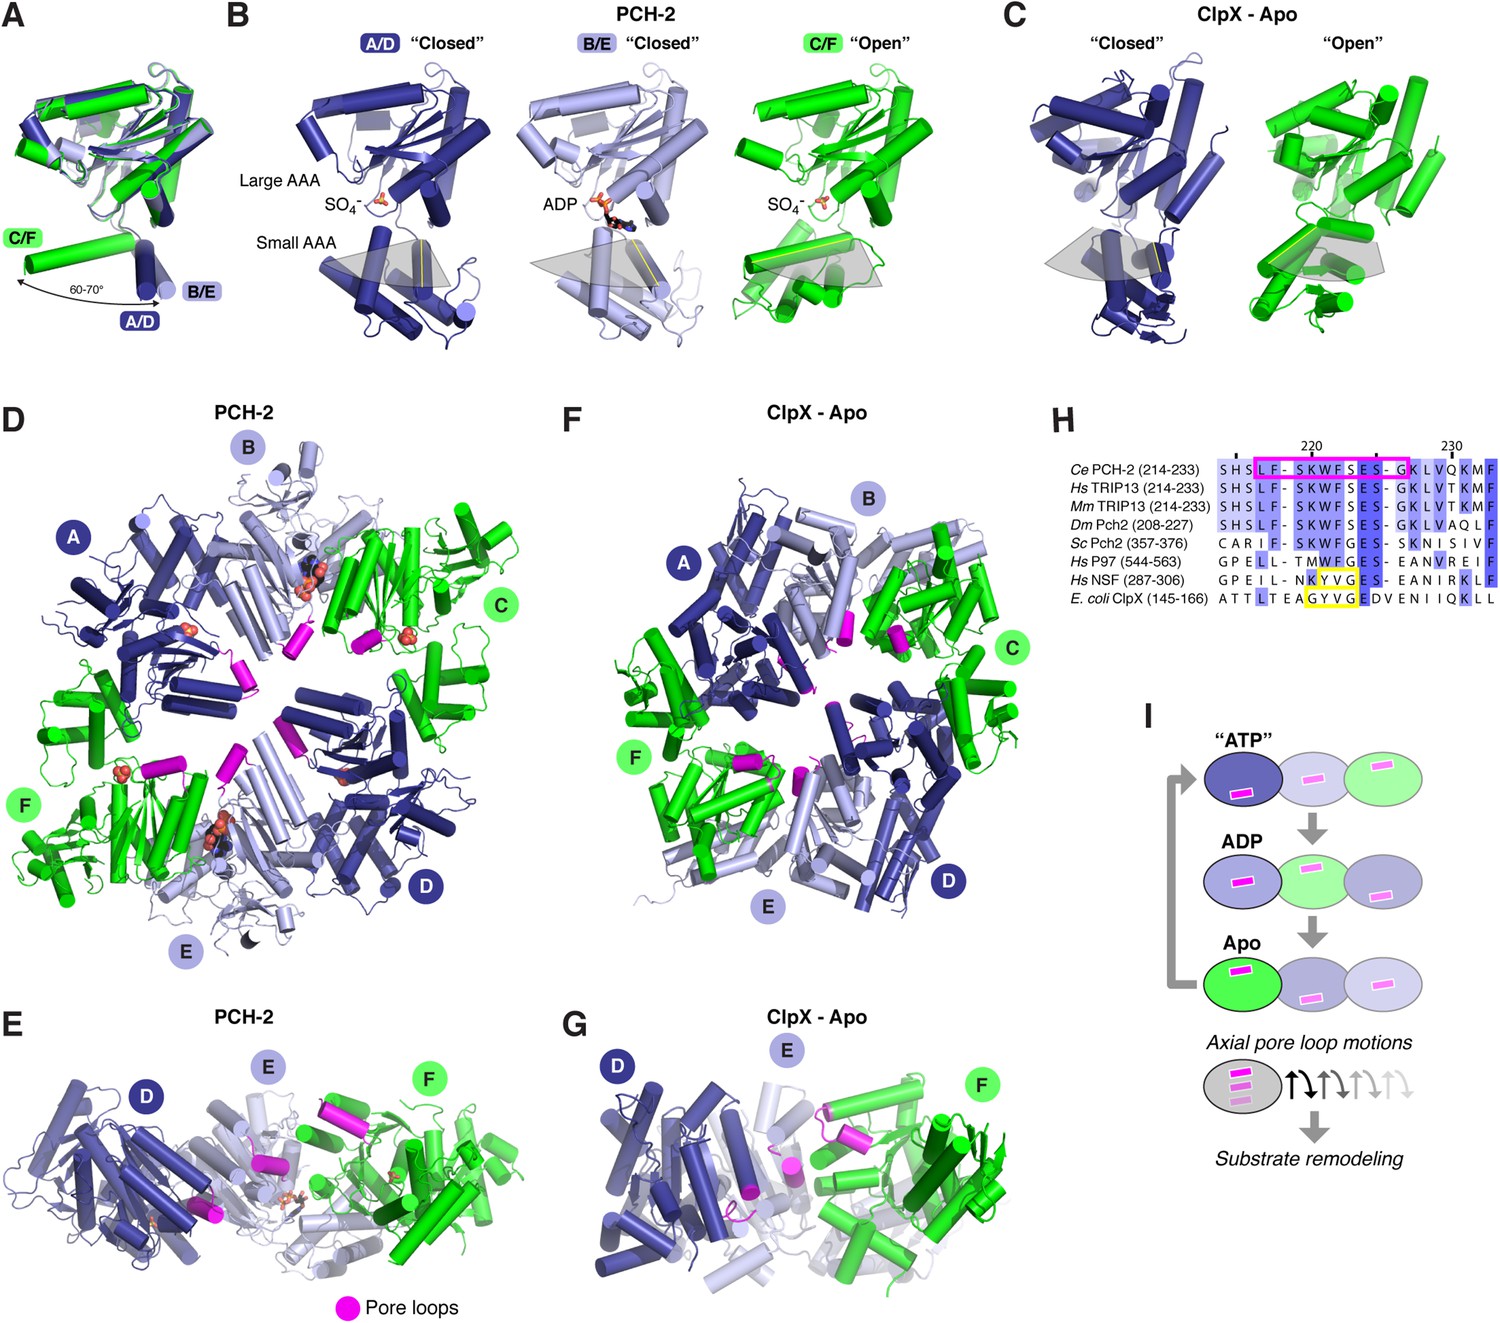
Conformational changes within the PCH-2 hexamer.
(A) Structural basis for nucleotide binding-dependent conformational changes. All six subunits (A/D dark blue, B/E light blue, C/F green) are overlaid based on their large AAA domains, and their small AAA domains are represented by a single α-helix, residues 323–342. (B) Relative orientation of large and small AAA domains in different subunit types. Bound ADP and SO4− ions are shown as sticks. While the small AAA domain position varies widely between subunits, all six subunit–subunit interfaces are equivalent, forming six rigid-body units within the hexamer (see Figure 3—figure supplement 1). (C) ‘Closed’ (blue) and ‘open’ (green) ClpX monomers in the nucleotide-free ClpX hexamer (PDB ID 3HTE; [Glynn et al., 2009]). Later work showed that the ‘closed’ conformation is compatible with nucleotide binding (Stinson et al., 2013). (D) Top view of the asymmetric PCH-2 hexamer, with subunits colored as in (A) and (B), and pore loops (residues 217–226) colored magenta. (E) Pore-side view of PCH-2 D/E/F chains (A/B/C chains removed), showing the axial staggering of these subunits' pore loops. (F) Top view of the nucleotide-free ClpX hexamer (Glynn et al., 2009), with ‘closed’ and ‘open’ subunits colored as in PCH-2 and pore loops (residues 145–153) colored magenta. (G) Pore-side view of ClpX D/E/F chains (A/B/C removed), colored as in (F). (H) Sequence alignment of pore loop region in PCH-2 orthologs, and equivalent region of human p97 and NSF, and E. coli ClpX. Magenta box: PCH-2 pore loop; Yellow boxes: NSF ‘YVG’ and ClpX ‘GYVG’ motifs. (I) Schematic model for ATP-driven conformational changes in PCH-2, with pore-side view equivalent to panel F. As the left-most subunit binds ATP (blue; represented by the closed ‘ATP’-like state in chain D), hydrolyzes ATP to ADP (light blue; represented by PCH-2 chain E), then releases hydrolyzed ADP (green; represented by PCH-2 chain F), its pore loop (magenta) undergoes axial motions that drive substrate remodeling.
Figure 3—figure supplement 1
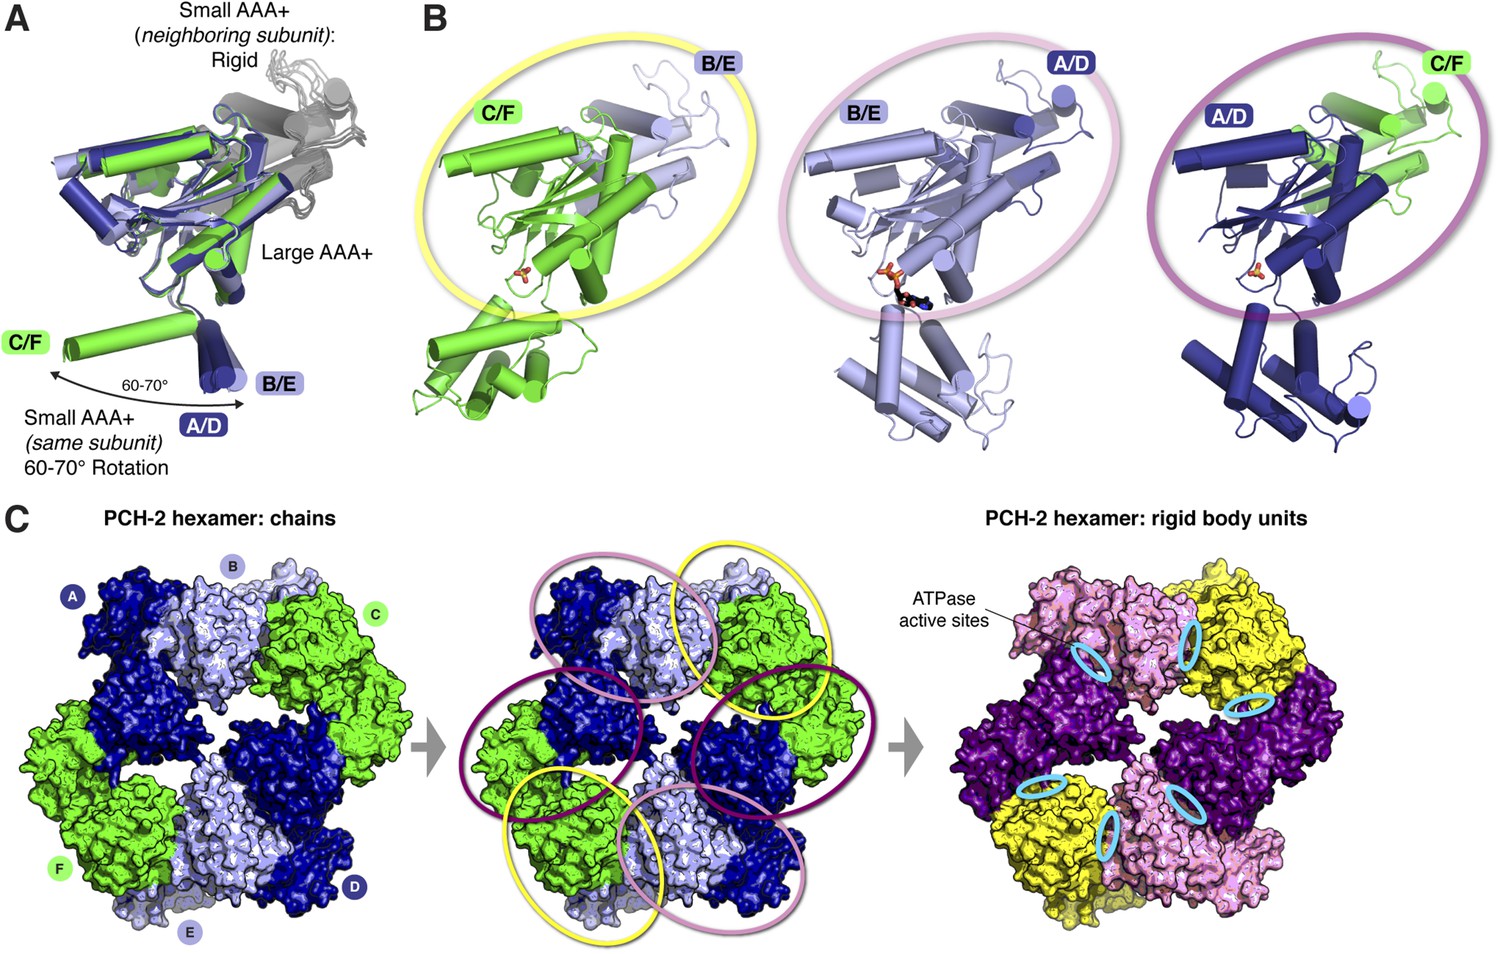
The asymmetric PCH-2 hexamer is composed of equivalent rigid-body groups.
(A) Overlaid large AAA domains of the six protein chains in the PCH-2 hexamer, as in Figure 3A, with associated small AAA+ domains from each neighboring subunit. While the small AAA domains of each subunit show significant conformational differences, the interface between each large AAA domain and the neighboring small AAA domain remains fixed. (B) Views as in panel (A) of each subunit type. Outlines in yellow, pink, and purple illustrate rigid-body rotation units within the hexamer, with NTDs removed for clarity (see below). Each rigid body is proposed to rotate as a unit in response to the nucleotide-binding state of its ATPase active site. (C) Left: top view of the PCH-2 hexamer (NTDs omitted for clarity), colored by protein chain as in Figure 3. Center: PCH-2 hexamer colored as in (A), with outlines in yellow, pink, and purple as in (B) highlighting rigid-body rotation units in the hexamer. Right: PCH-2 with rigid-body units colored as in (B). Each rigid-body unit comprises the large AAA domain from one chain (e.g., chain B) and the small AAA domain from its neighbor (e.g., chain A). Cyan ovals indicate the locations of ATPase active sites, positioned between each rigid-body unit.
Figure 4
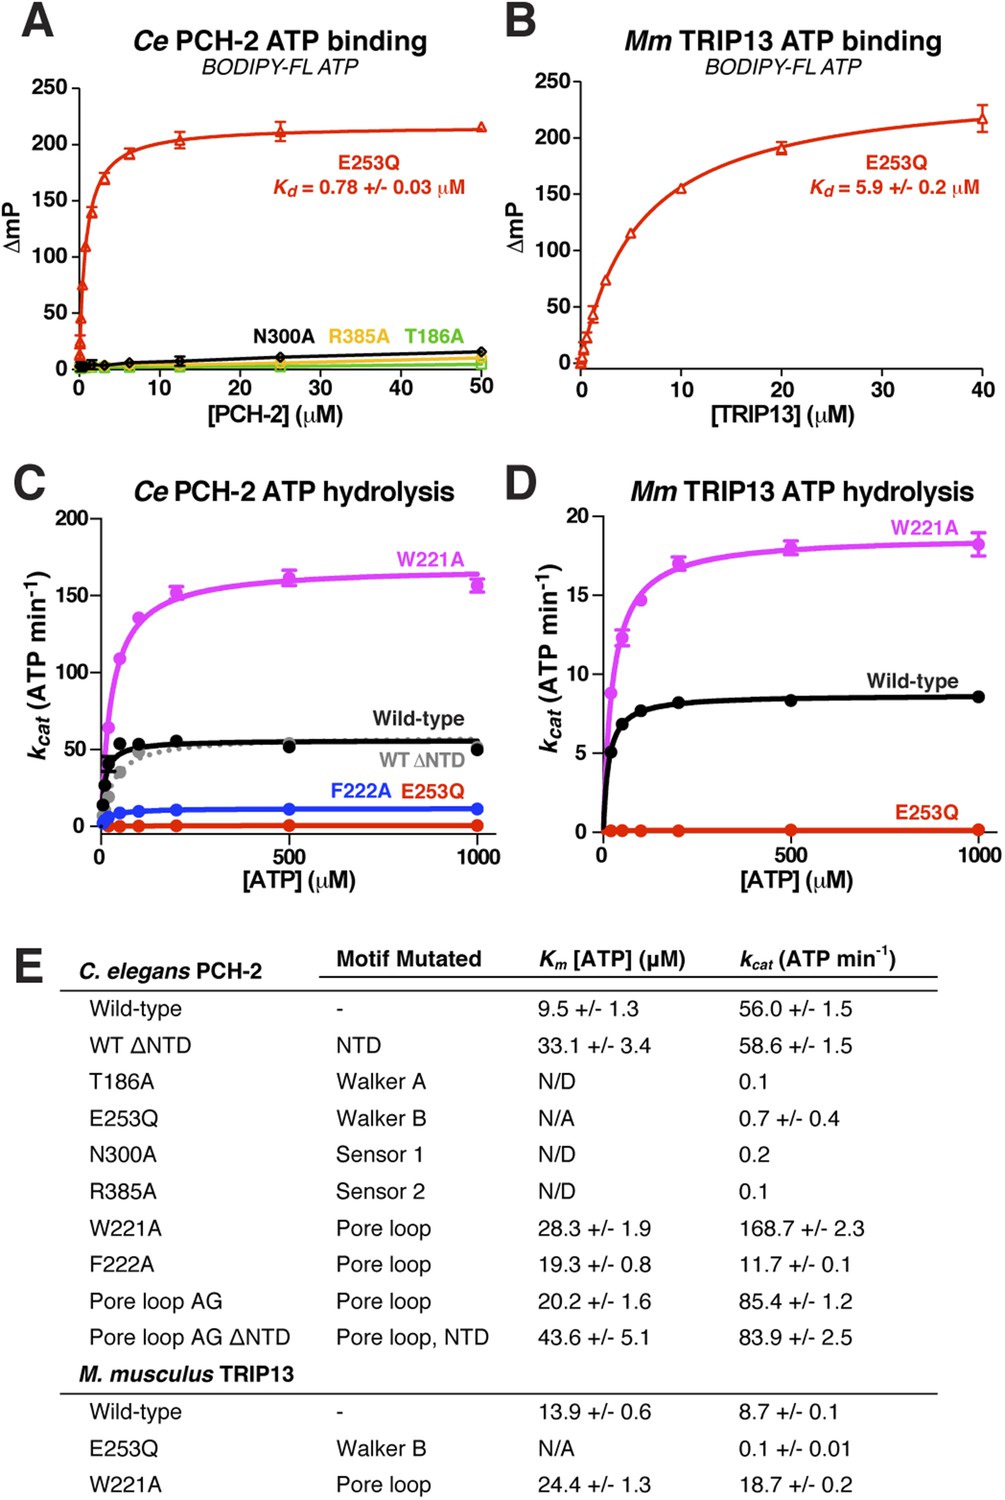
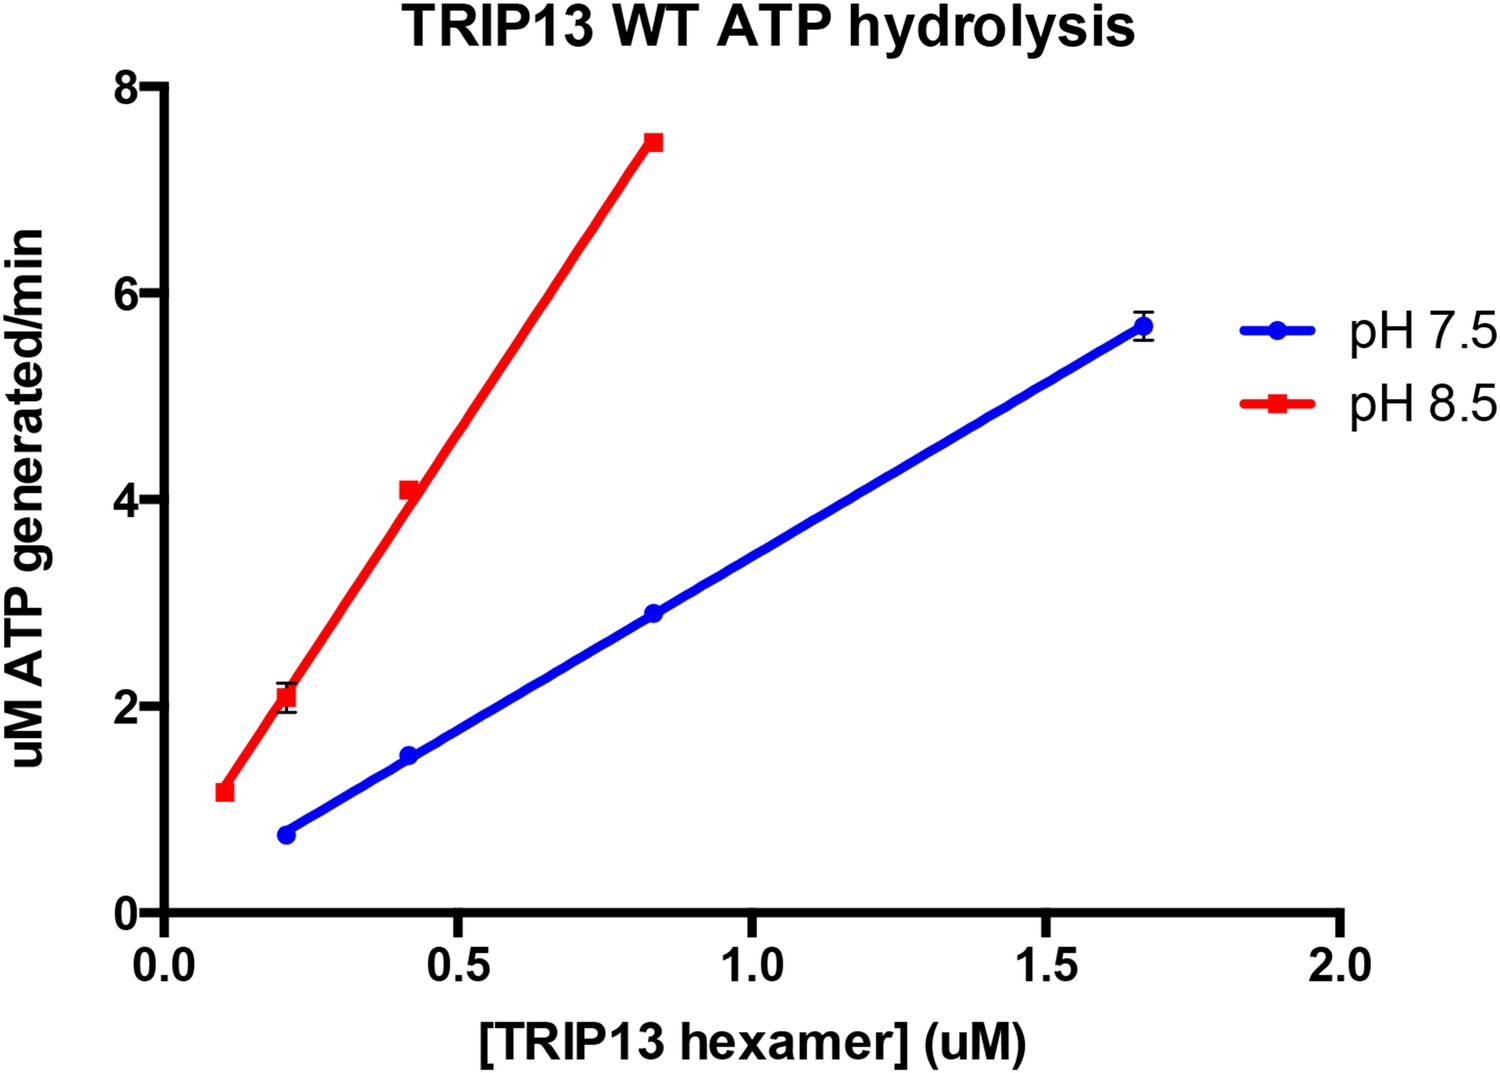
Nucleotide binding and hydrolysis by PCH-2 and TRIP13.
(A) Binding of PCH-2 active-site mutants to BODIPY-FL ATP. (B) Binding of M. musculus TRIP13E253Q to BODIPY-FL ATP. (C) Basal ATP hydrolysis rates of wild-type and mutant C. elegans PCH-2 at pH 8.5 (optimal for ATPase activity; ATPase stimulation assays (Figure 6) were performed at pH 7.5, where basal activity is lower but stimulation is more robust). E253Q: Walker B ATPase mutant; W221A/F222A: pore loop mutants; WT ΔNTD: residues 100–424. (D) Basal ATP hydrolysis rates of wild-type and mutant M. musculus TRIP13 at pH 8.5. Residue numbering for mutants is identical to C. elegans PCH-2. (E) Km/kcat values (reported as ATP min−1 per hexameric enzyme) for wild-type and mutant PCH-2 and TRIP13. For PCH-2T186A, PCH-2N300A, and PCH-2R385A, rates were measured at a single ATP concentration of 2 mM, so Km was not determined (N/D). For PCH-2E253Q and TRIP13E253Q, very low ATPase activity precluded a reliable Km determination (N/A).
Figure 5 with 2 supplements
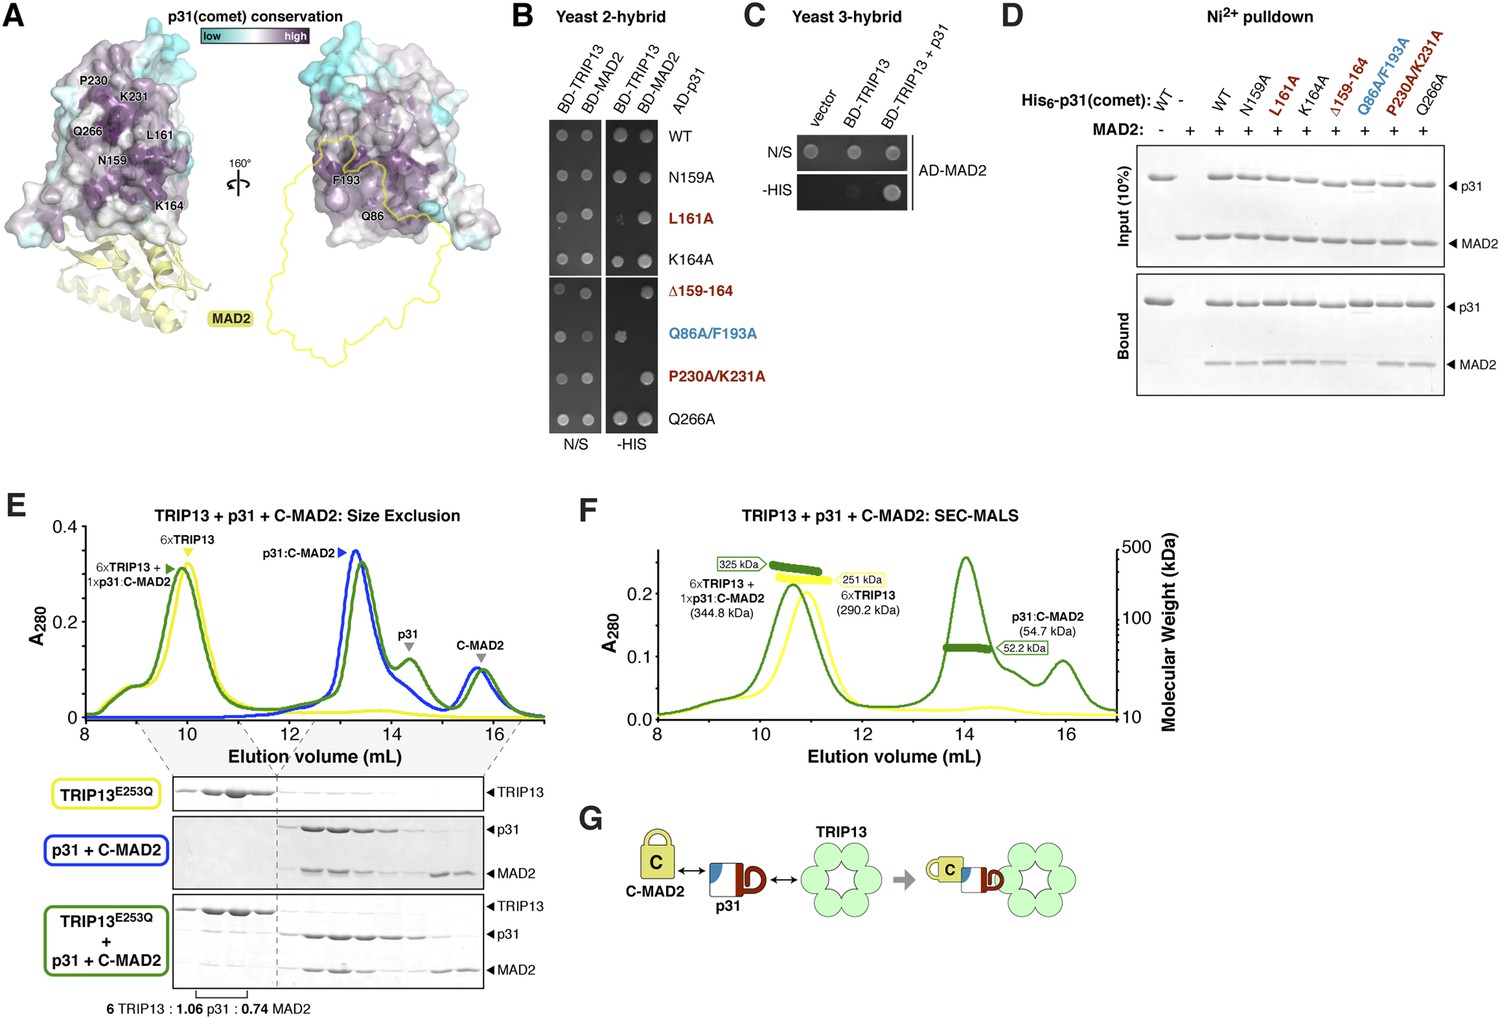
p31(comet) functions as an adapter between TRIP13 and MAD2.
(A) Two views of the crystal structure of human p31(comet) (colored by conservation) bound to MAD2 (yellow) (Yang et al., 2007). Residue numbers shown are of M. musculus p31(comet) (76% identity with Homo sapiens p31(comet); all noted residues are conserved). (B) Yeast two-hybrid assay for M. musculus p31(comet) binding to TRIP13 and MAD2. The p31(comet)-MAD2 interaction can also be detected using purified proteins (panel D). BD: Gal4 DNA-binding domain fusion; AD: Gal4 activation domain fusion. N/S: no selection; -HIS: selection for interaction between BD- and AD-fused proteins. (C) Yeast three-hybrid assay showing interaction of BD-TRIP13 and AD-MAD2 in the presence of untagged p31(comet). (D) Ni2+-pulldown assay using purified His6-tagged M. musculus p31(comet) pulling down untagged M. musculus MAD2. (E) Size exclusion chromatography traces and gels from M. musculus TRIP13E253Q (yellow), p31(comet):C-MAD2R133A (blue), and an equimolar mixture of TRIP13E253Q + p31(comet):C-MAD2R133A (green). Quantitation of Coomassie-stained bands in bottom gel (lanes 2 and 3) show an ∼6:1 molar ratio of TRIP13E253Q to p31(comet):MAD2 (6 copies of TRIP13, 1.06 copies of p31(comet) and 0.74 copies of C-MAD2R133A). See Figure 5—figure supplement 1 for full gels and analysis of different protein combinations including p31(comet) mutants, and Figure 5—figure supplement 2 for purification of p31(comet) and MAD2. (F) SEC-MALS analysis of TRIP13E253Q (yellow) and TRIP13E253Q:p31(comet):C-MAD2R133A (green). TRIP13E253Q migrates as a single peak with measured molecular weight of 251 kDa, close to the calculated hexamer molecular weight of 290.2 kDa. Upon the addition of p31(comet) and C-MAD2R133A, the measured molecular weight shifts to 325 kDa. The shift of 74 kDa is close to the weight of a p31(comet):C-MAD2R133A complex (54.7 kDa). Excess p31(comet):C-MAD2R133A elutes after the complex with TRIP13. (G) Schematic illustrating p31(comet) functioning as an adapter between C-MAD2 (via blue surface) and TRIP13 (via red surface). See Figure 8—figure supplement 1C for the p31(comet) crystal structure colored equivalently.
Figure 5—figure supplement 1
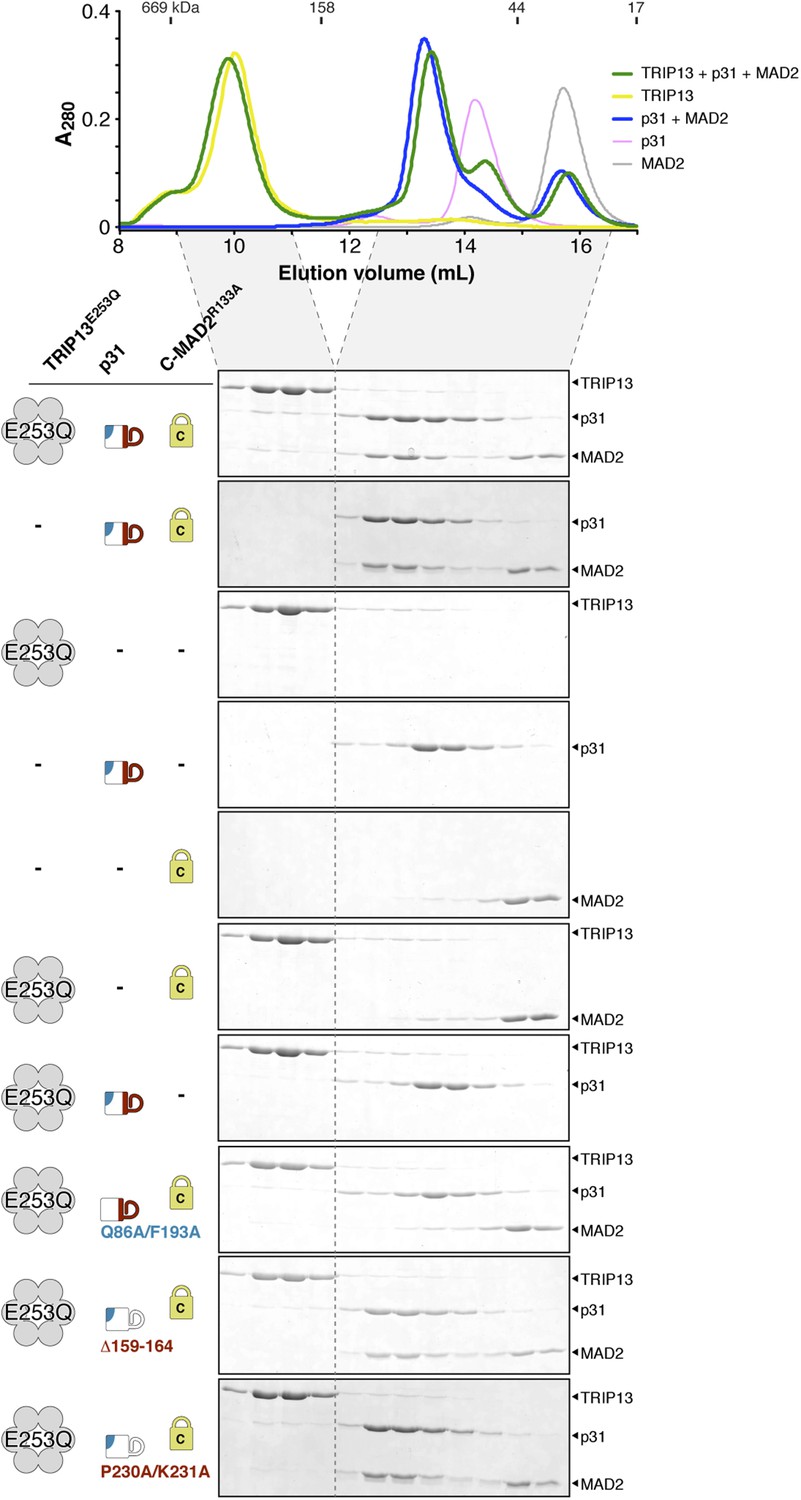
Interactions between M. musculus TRIP13, p31(comet), and MAD2.
Size exclusion chromatography traces and gels from mixtures of separately purified M. musculus TRIP13E253Q, p31(comet), and C-MAD2R133A.
Figure 5—figure supplement 2
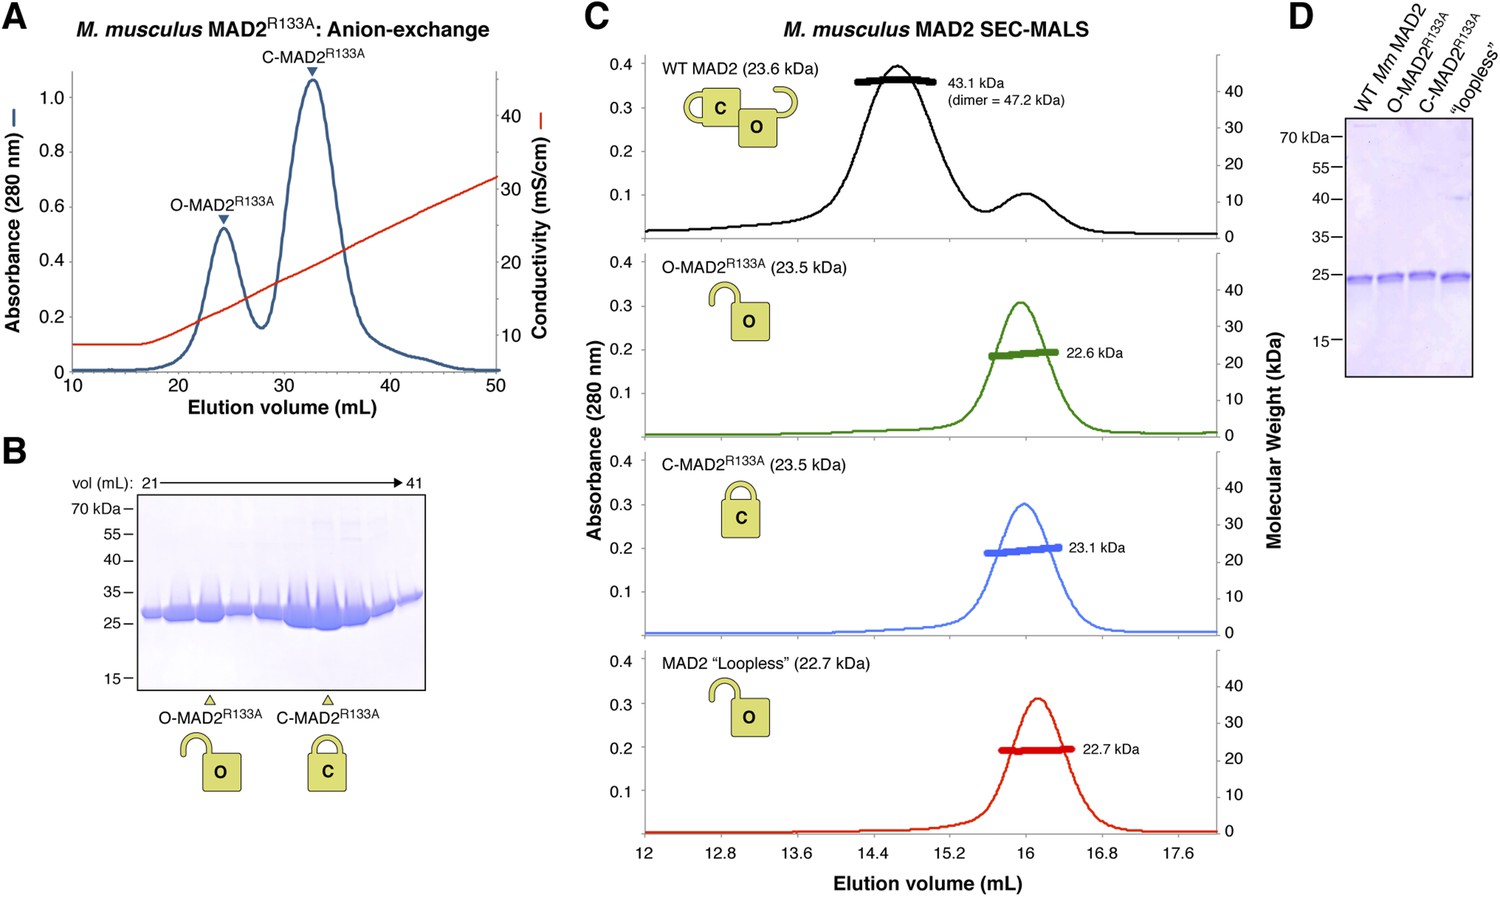
Purification and characterization of M. musculus MAD2 and p31(comet).
(A) Anion-exchange purification of M. musculus MAD2R133A. O-MAD2R133A and C-MAD2R133A peaks are noted. The MAD2 ‘loopless’ mutant (residues 109–117 replaced by GSG (adopts monomeric open form) [Mapelli et al., 2007]) eluted at the same salt concentration as the O-MAD2R133A peak (not shown). (B) SDS-PAGE analysis of fractions from (A). (C) SEC-MALS analysis of M. musculus MAD2. Wild-type MAD2 (top, black) is predominantly dimeric, while O-MAD2R133A (green), C-MAD2R133A (blue), and ‘loopless’ MAD2 are predominantly monomeric. (D) SDS-PAGE analysis of final purified MAD2 WT, O-MAD2R133A, C-MAD2R133A, and ‘loopless’ MAD2.
Figure 6 with 1 supplement
ATP hydrolysis in PCH-2/TRIP13 is stimulated by p31(comet) + MAD2.
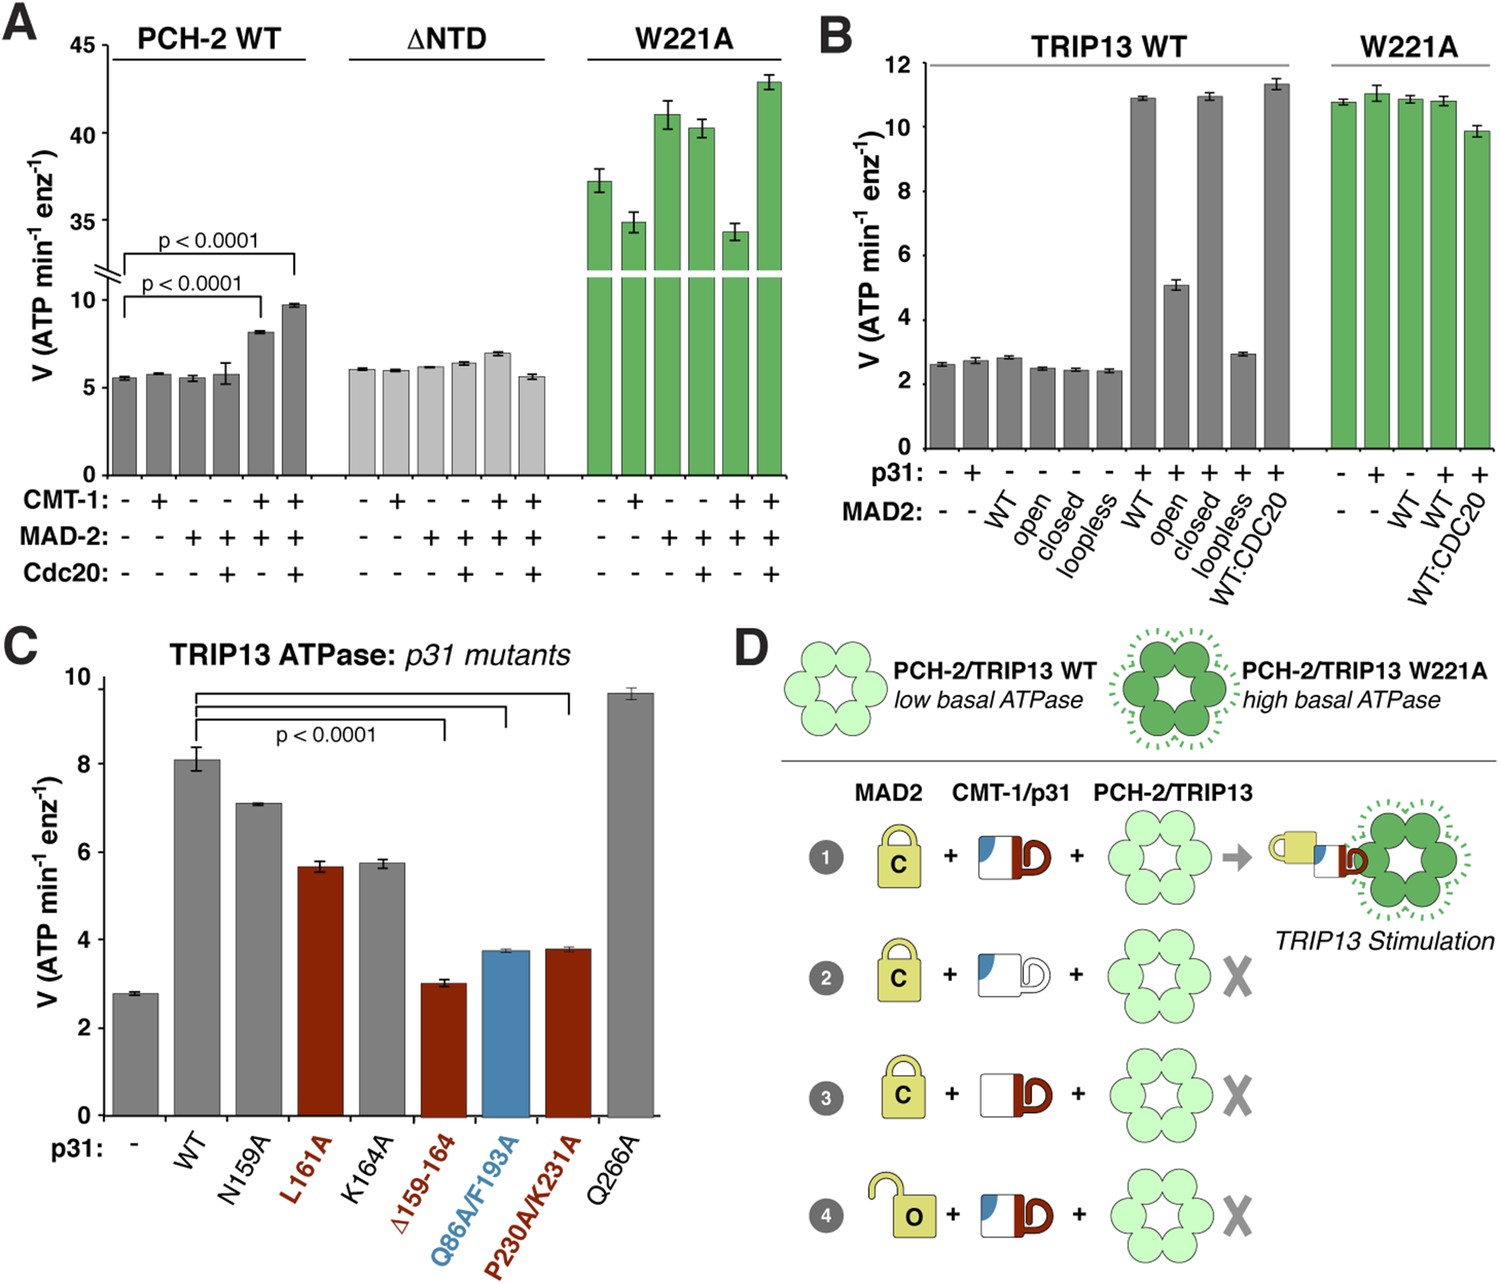
(A) Stimulation of C. elegans PCH-2 ATPase activity by CMT-1 (p31(comet)) and MAD-2. See Figure 6—figure supplement 1 for purification of C. elegans CMT-1 and MAD-2. Cdc20: N-terminal MBP fusion of C. elegans FZY-1 residues 98-140. Substrates were in sixfold molar excess of PCH-2 hexamer. (B) Stimulation of M. musculus TRIP13 ATPase activity by p31(comet) and MAD2. WT: wild-type MAD2 dimer; ‘open’: O-MAD2R133A monomer; ‘closed’: C-MAD2R133A monomer; ‘loopless’: residues 109–117 replaced by GSG (adopts monomeric open form) (Mapelli et al., 2007). CDC20: N-terminal MBP fusion of CDC20 residues 111–150, sufficient for MAD2 binding (Luo et al., 2000). Substrates were in sixfold molar excess of TRIP13 hexamer. (C) Stimulation of TRIP13 ATPase activity in the presence of p31(comet) mutants. (D) Schematic illustrating requirements for TRIP13 stimulation. PCH-2/TRIP13 is stimulated by the combination of C-MAD2 and p31(comet) (scheme 1); mutation of either binding surface of p31(comet) (schemes 2 and 3) eliminates stimulation, as does replacement of C-MAD2 with O-MAD2 (scheme 4). p-values in (A) and (C) were calculated using an unpaired Student's T-test.
Figure 6—figure supplement 1
Purification and characterization of C. elegans MAD-2 and CMT-1.
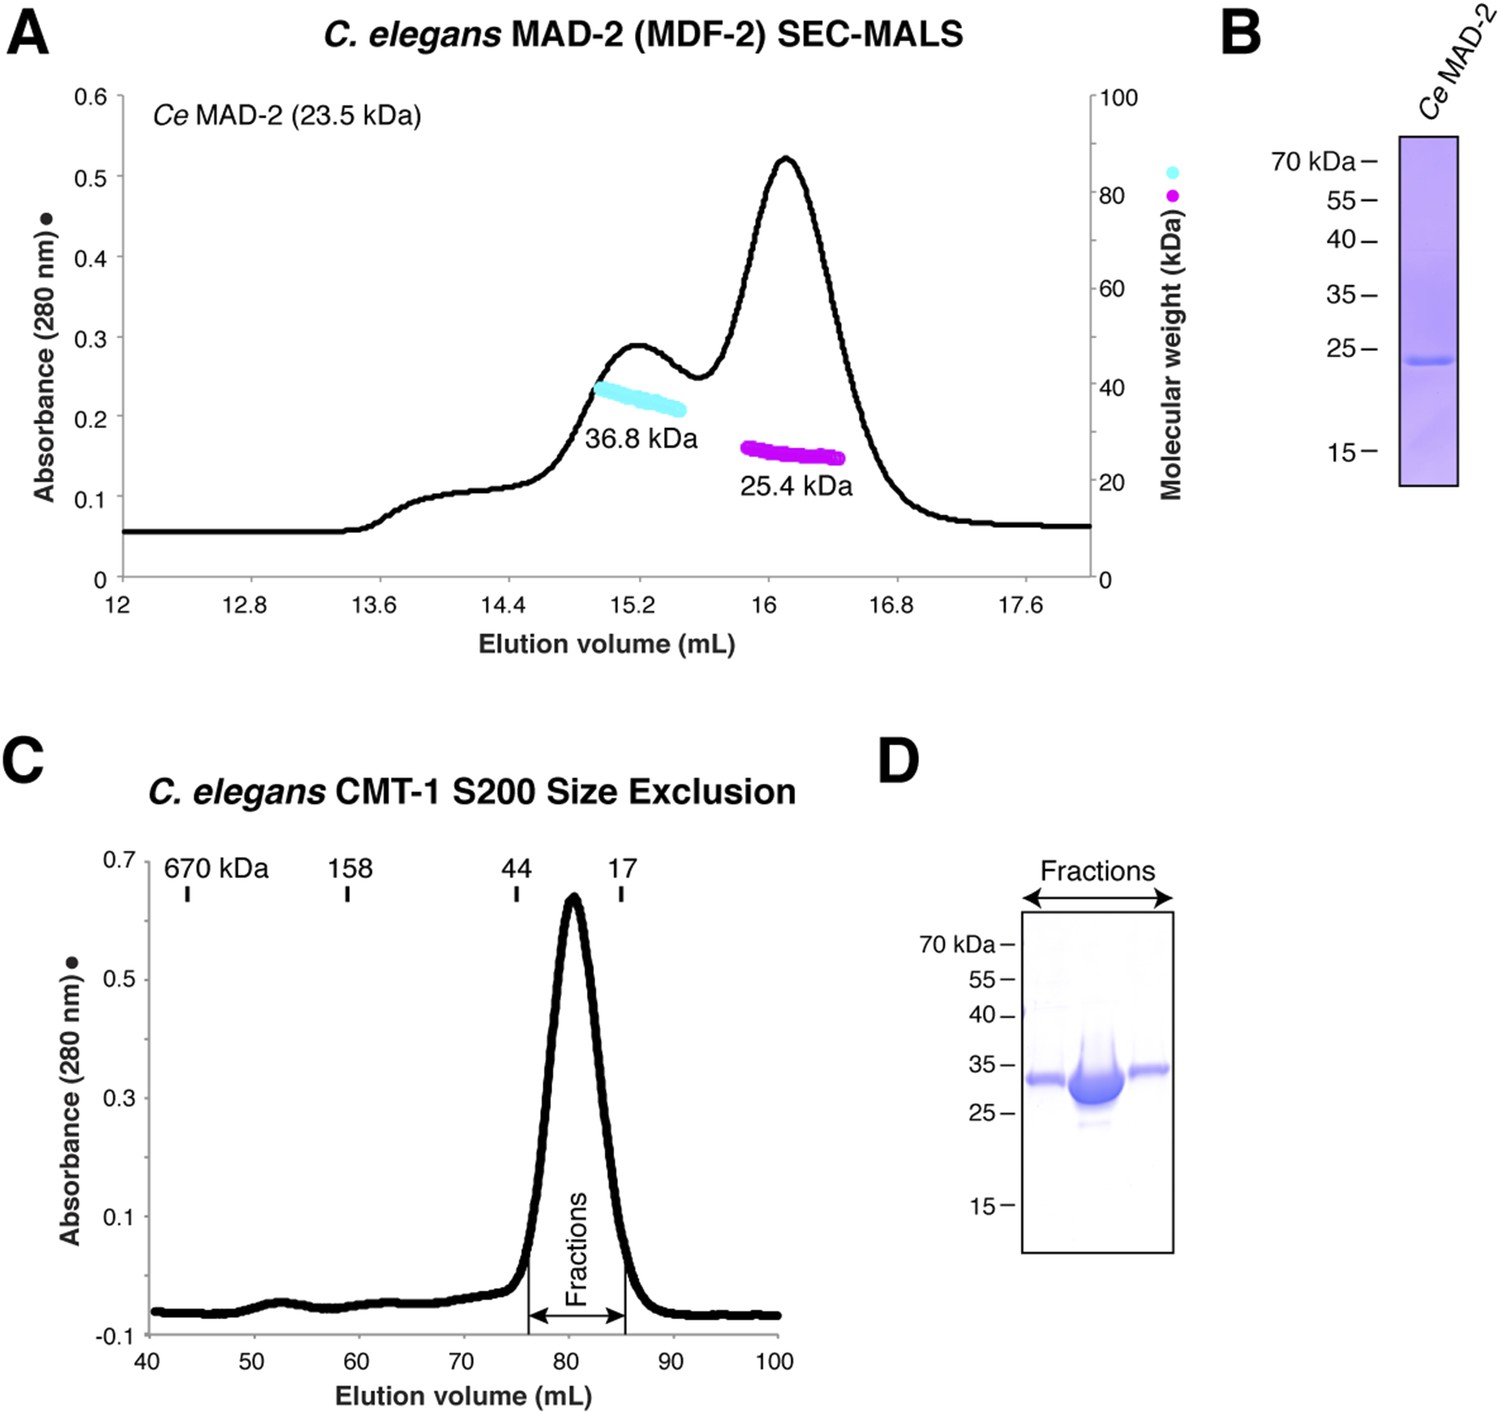
(A) SEC-MALS analysis of C. elegans MAD-2 shows a mixture of monomer and dimer states. These were separately pooled for PCH-2 ATPase stimulation assays; while both pools stimulated PCH-2 in the presence of CMT-1, the dimer peak more strongly stimulated PCH-2 (not shown). (B) SDS-PAGE analysis of purified C. elegans MAD-2. (C) Size exclusion chromatography and SDS-PAGE analysis of C. elegans CMT-1, showing that the protein is monomeric (elution volume of size standards shown for comparison). (D) SDS-PAGE analysis of fractions from (C).
Figure 7 with 1 supplement
TRIP13 converts C-MAD2 to O-MAD2.
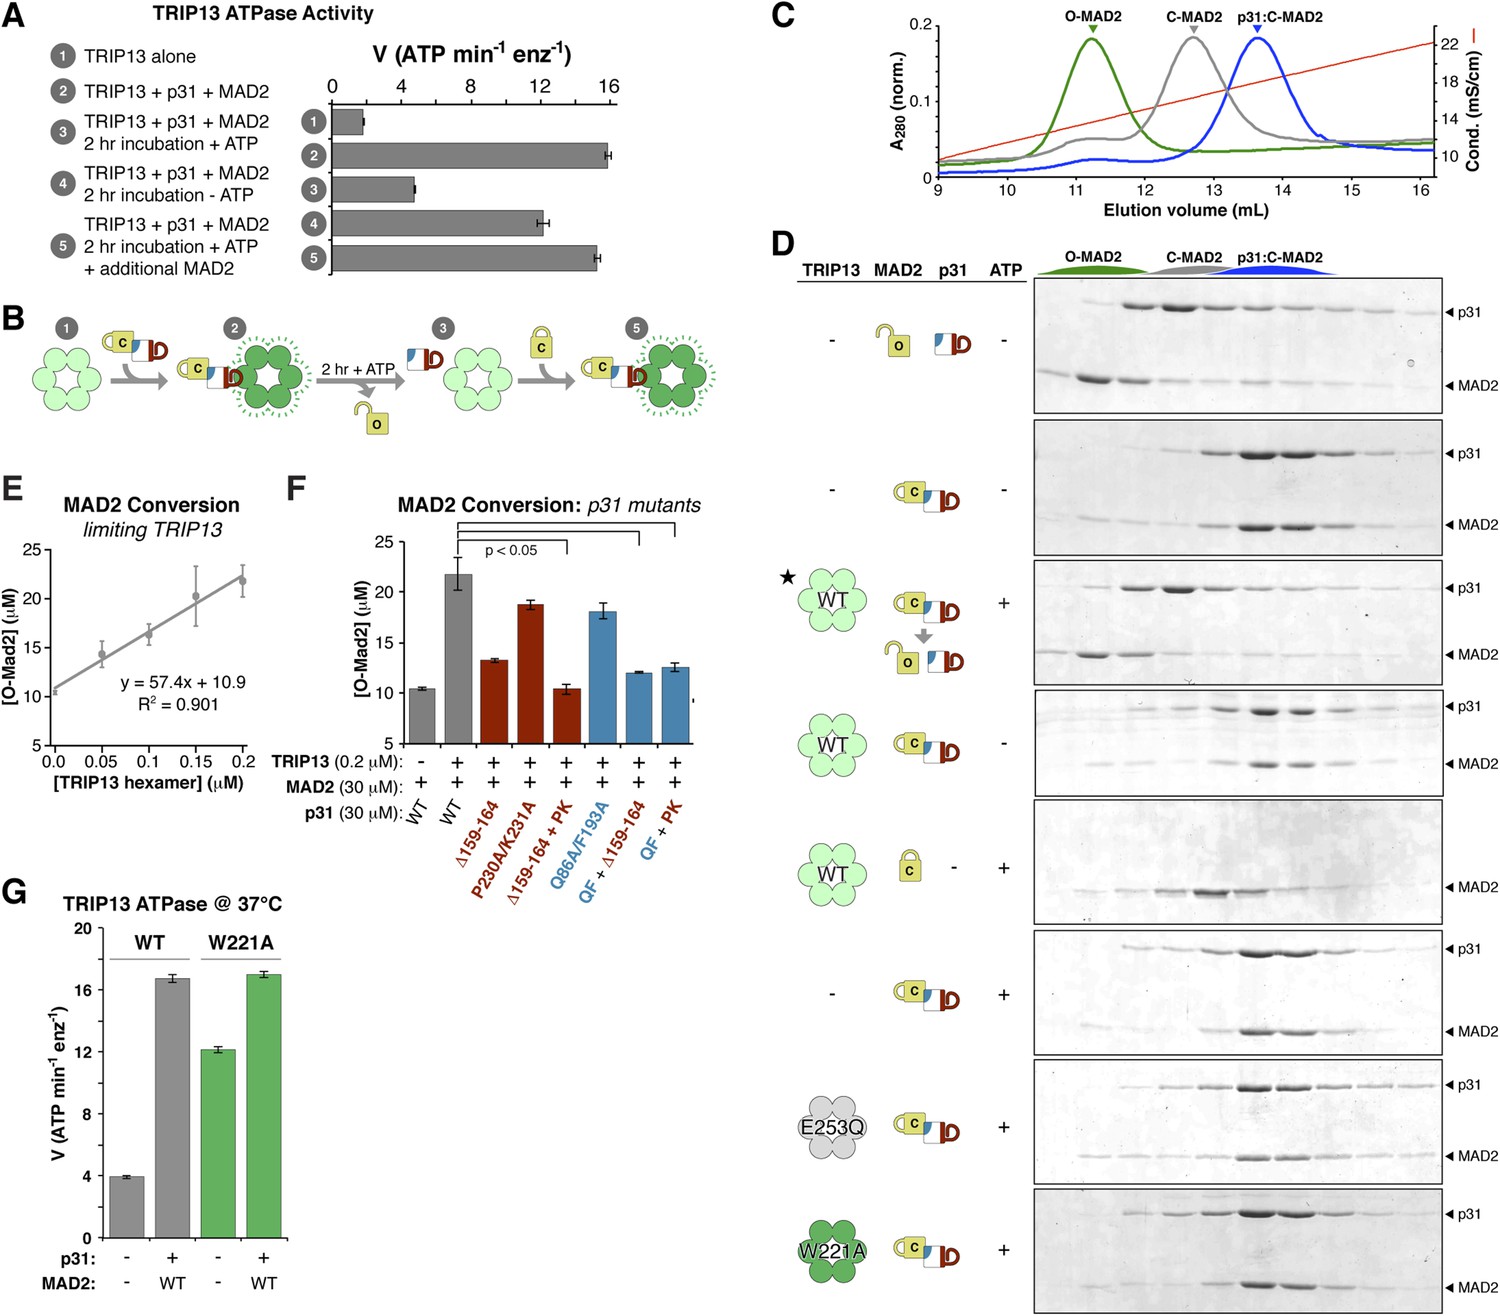
(A) Stimulation of TRIP13 ATPase activity by p31(comet ) + MAD2, before (samples 1–2) or after (samples 3–5) a 2-hr pre-incubation period. All proteins were at 4 μM (sixfold molar excess of substrate:TRIP13 hexamer). For sample 5, an additional 4 μM MAD2 was added after the pre-incubation period. (B) Schematic illustrating results from (A) in terms of complex formation and TRIP13 stimulation. (C) Anion-exchange elution profiles for O-MAD2 (green), C-MAD2 (gray), and the p31(comet):C-MAD2 complex (blue). (D) p31(comet) and MAD2 in anion-exchange fractions from the indicated pre-incubated reaction mixtures. p31(comet) and MAD2 were at 30 μM, and TRIP13 at 5 μM (hexamer concentration) except for starred sample (third from top), where TRIP13 was at 1.25 μM. The observed C-MAD2 to O-MAD2 conversion requires active TRIP13, ATP, and p31(comet). Neither TRIP13E253Q nor TRIP13W221A supported MAD2 conversion. At equilibrium, MAD2R133A is predominantly in the C-MAD2 state (Figure 7—figure supplement 1), further supporting that the observed C-MAD2 to O-MAD2 conversion is an active process. (E) Rate of TRIP13-mediated C-MAD2 to O-MAD2 conversion in limiting TRIP13. Reactions with 30 μM p31(comet) + MAD2R133A (initially ∼10 μM O-MAD2 and ∼20 μM C-MAD2) were incubated at 37°C for 30 min with the indicated amounts of TRIP13, and separated by ion-exchange as in (D). SDS-PAGE band intensities were quantified, converted to [O-MAD2], and plotted. Linear regression fitting indicates a rate of 57.4 ± 6.7 MAD2 conversions in 30 min per TRIP13 hexamer, or ∼1.9 ± 0.2 min−1 (F) TRIP13-mediated MAD2 conversion in the presence of p31(comet) mutants. The high concentration of p31(comet) + MAD2 in this assay (30 μM) allowed single mutants to support limited MAD2 conversion, but mutant combinations effectively eliminated MAD2 conversion. PK: P230A/K231A; QF: Q86A/F193A. (G) ATPase activity of M. musculus TRIP13 at 37°C (all other ATPase assays were performed at 27°C).
Figure 7—figure supplement 1
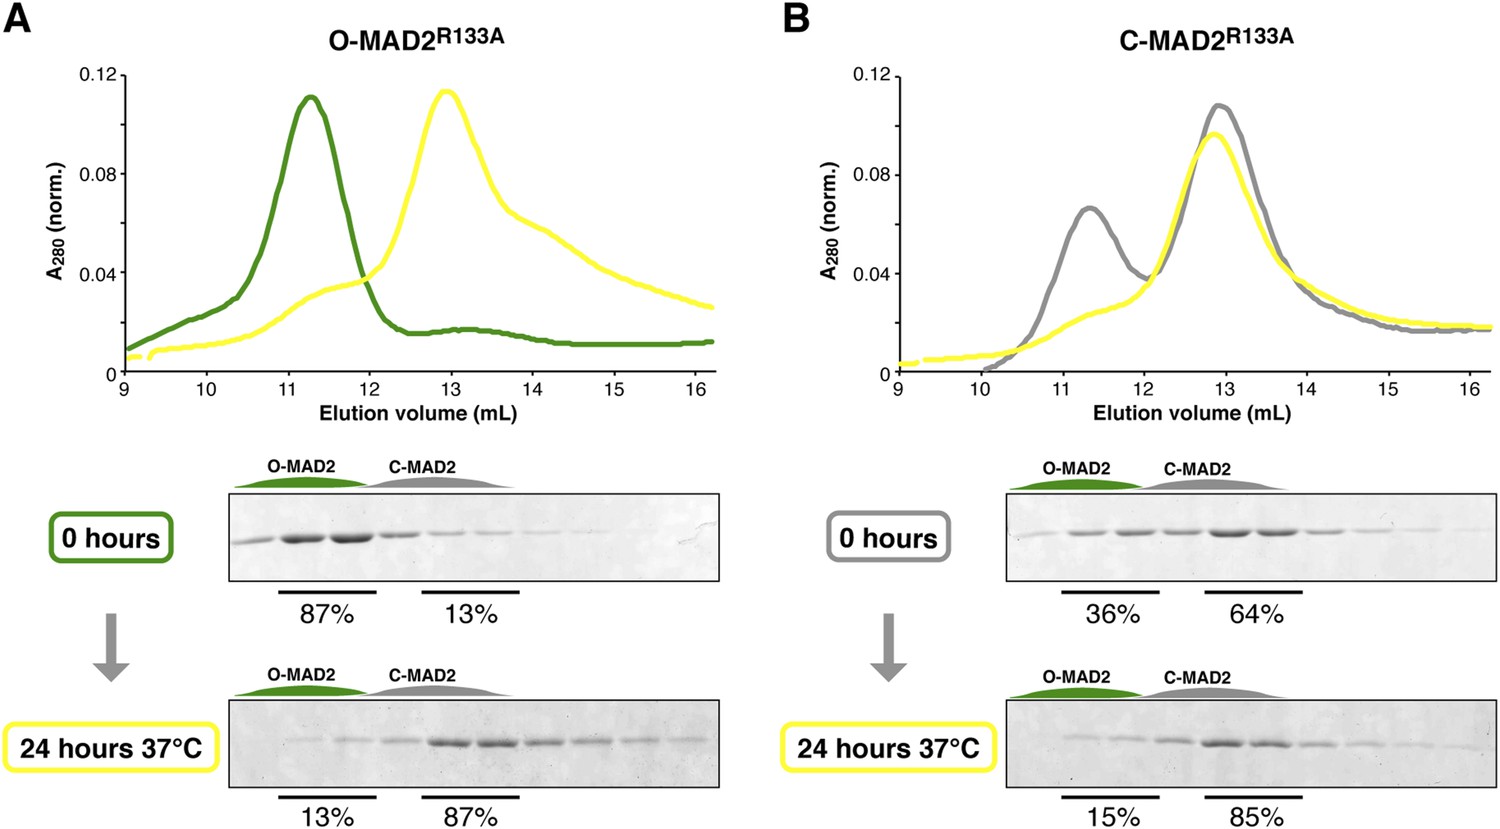
MAD2R133A is predominantly in the C-MAD2 state at equilibrium.
(A) Purified samples of O-MAD2R133A (30 μM total concentration) were separated by anion-exchange chromatography as in Figure 7C–D, either as purified (0 hr) or after a 24 hr incubation at 37°C. Quantitation of SDS-PAGE bands in fractions 2–3 (O-MAD2) vs fractions 5–6 (C-MAD2) indicate that the sample is 13% C-MAD2 prior to incubation, and 87% C-MAD2 after incubation. (B) Purified samples of C-MAD2R133A were analyzed as in (A). The sample is 64% C-MAD2 prior to incubation, and 85% C-MAD2 after incubation.
Figure 8 with 1 supplement
Model for SAC inactivation by p31(comet) and TRIP13.
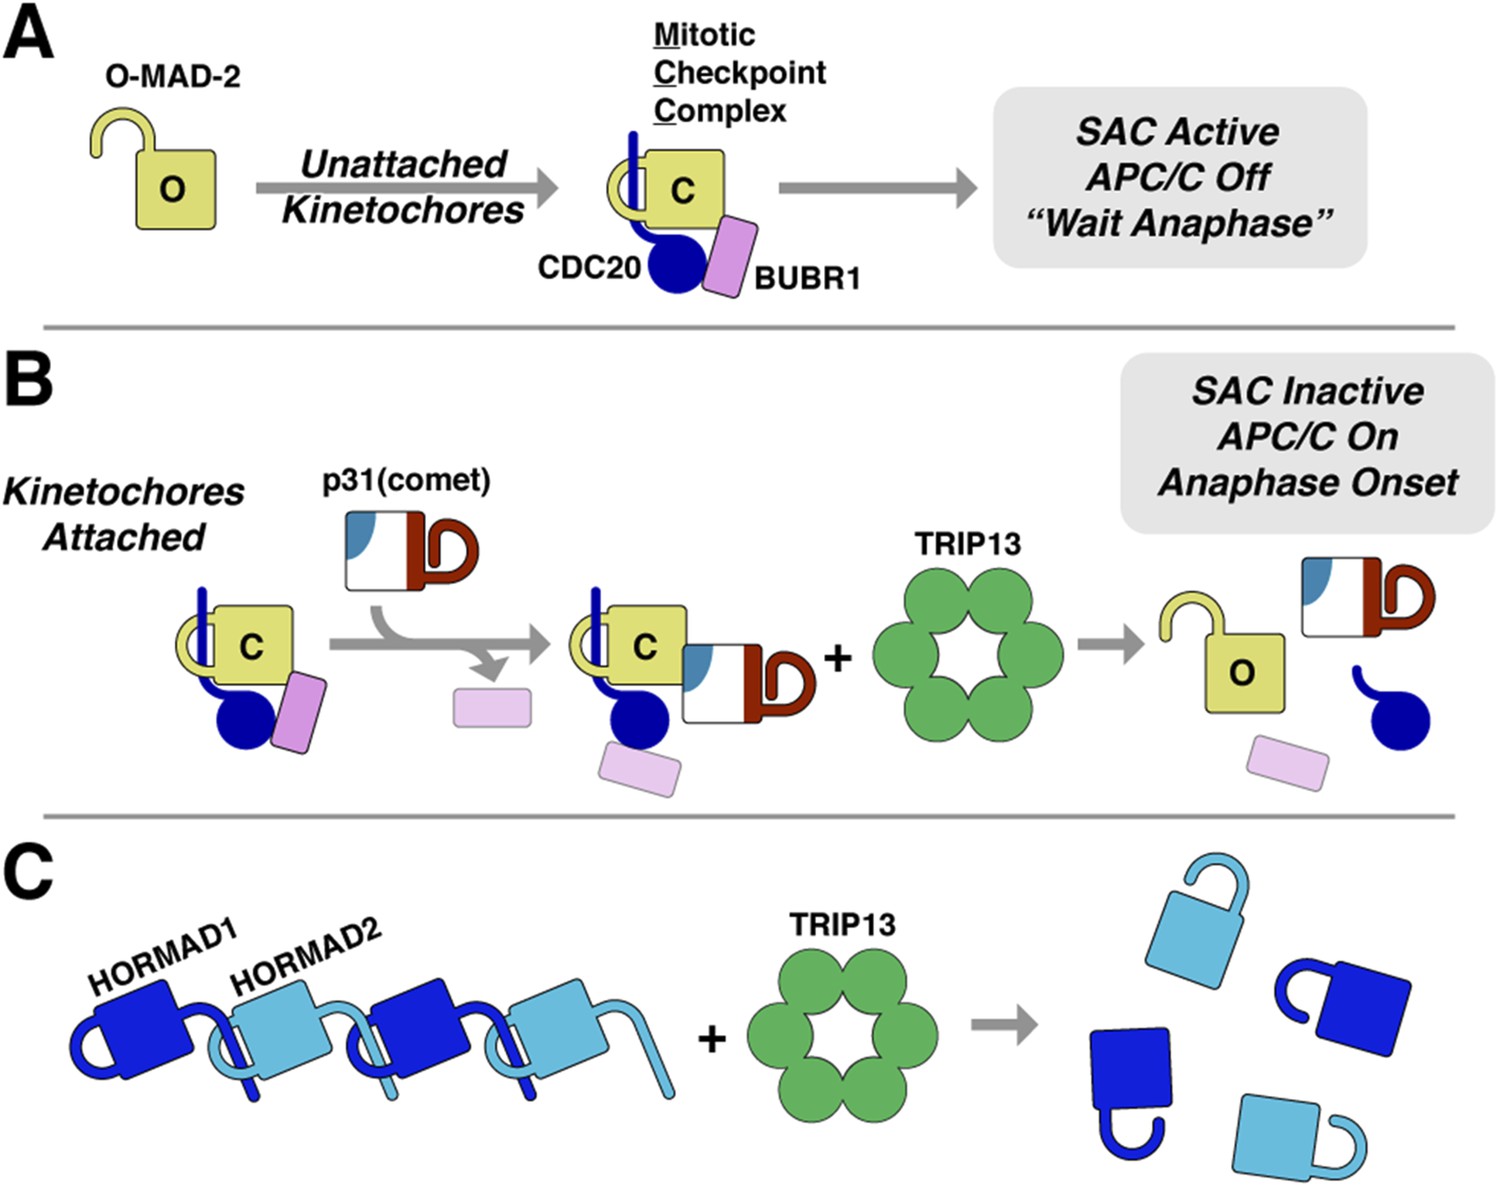
(A) Unattached kinetochores catalyze the assembly of the mitotic checkpoint complex (MCC) through the conversion of O-MAD2 to C-MAD2 and assembly with CDC20 (blue), BUBR1 (pink), and BUB3 (not shown). (B) After kinetochore-microtubule attachment, MCC assembly is halted. p31(comet) binds existing MCC and displaces BUBR1, then delivers C-MAD2:CDC20 to TRIP13 for conformational conversion and disassembly. The CDC20:BUBR1 interaction may be disrupted directly by p31(comet) or at a later point. (C) Scheme for TRIP13-mediated disassembly of HORMAD oligomers (blue) in meiosis. It is unknown whether HORMADs possess an open state analogous to O-MAD2. See Figure 8—figure supplement 1 for structures of O-MAD2, C-MAD2, C-HORMAD, and p31(comet) showing the safety-belt conformation in each state.
Figure 8—figure supplement 1

HORMA domain structures in open and closed conformation.
(A) Structures of human MAD2 in the open (left panel; PDB ID 1DUJ; [Luo et al., 2000]), closed (middle panel; PDB ID 1S2H [Luo et al., 2004]), and closed/peptide bound (right panel; PDB ID 1KLQ [Luo et al., 2002]) conformations, with MAD2 in yellow, MAD2 safety belt (residues 160:205) colored dark green, and the MAD2-binding peptide (MBP-1) in blue. MAD2 residues 109–117, replaced with ‘GSG’ in loopless MAD2 (Mapelli et al., 2007), are shown in blue in the O-MAD2 structure (left panel). (B) Structure of a meiotic HORMAD in the closed conformation (C. elegans HIM-3 bound to a peptide from HTP-3; PDB ID 4TZJ [Kim et al., 2014]). The safety belt is colored dark green as in panel (A). (C) Structure of human p31(comet) (PDB ID 2QYF [Yang et al., 2007]), with safety-belt motif (closed around its own C-terminus) shown in red, and the MAD2 binding surface (with residues 86 and 193 (numbering according to M. musculus p31(comet))) shown in blue. Side-chains for residues involved in TRIP13 binding (159–164 and 230–231) are shown in stick view. Cartoon representations of all structures are shown for reference.
Author response image 1
Author response image 2
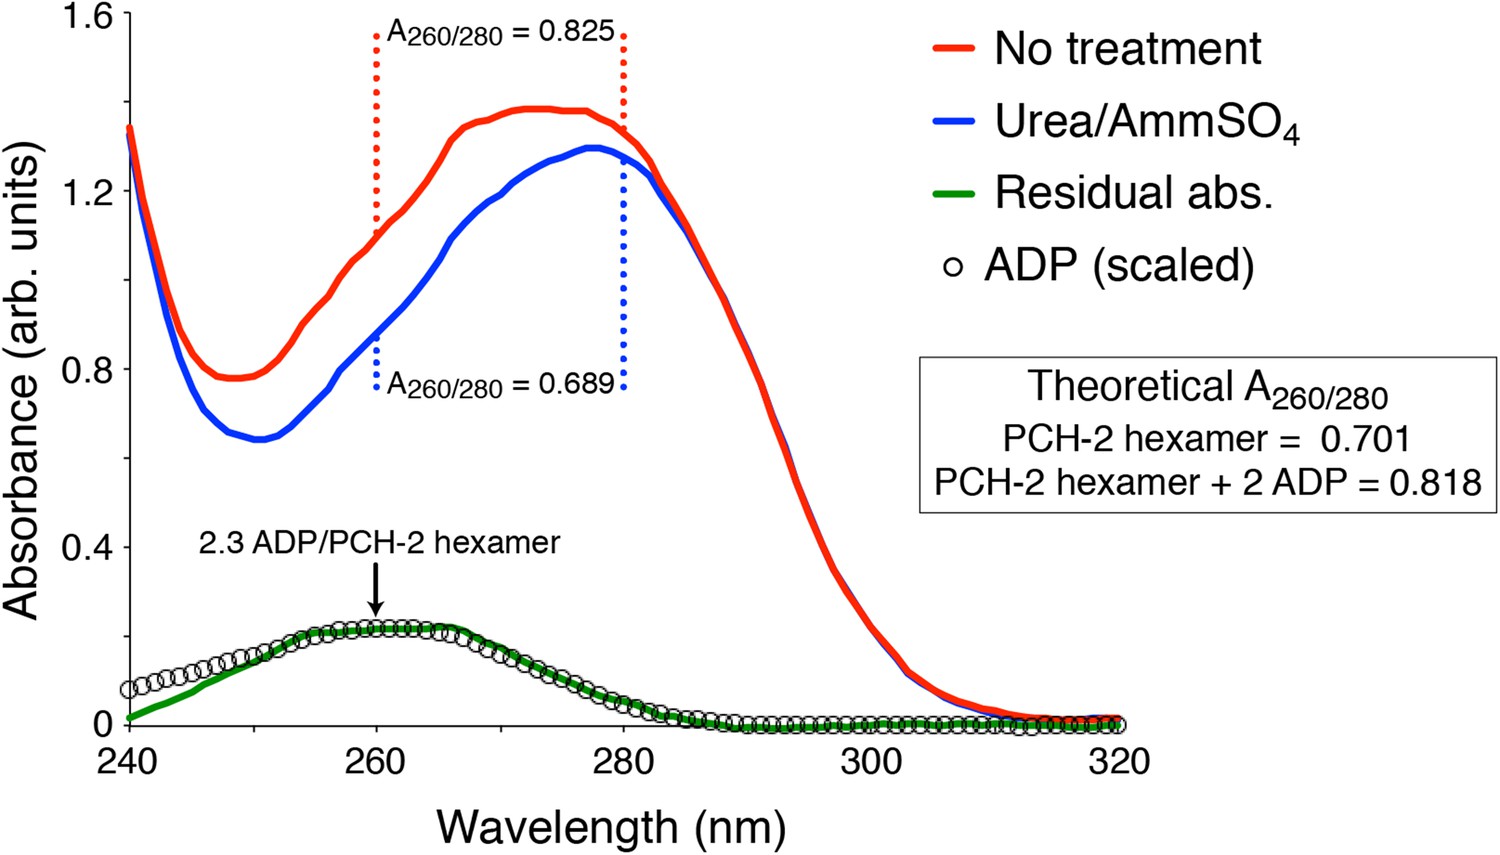
UV Absorbance Spectra of PCH-2.
The denatured UV absorbance spectrum of full-length PCH-2E253Q was collected after standard purification from E. coli overexpression (red line), or purification with a transient 0.8 M urea wash followed by stabilization of the protein in buffer containing 50 mM ammonium sulfate (blue line). The A260/280 ratios of the urea-treated sample agreed with the theoretical value calculated for PCH-2 protein based on amino acid content (0.689 measured versus 0.701 theoretical), and the ratio for untreated PCH-2 matched the theoretical value calculated for a PCH-2 hexamer bound to two ADP molecules (0.825 measured versus 0.818 theoretical), as observed in our crystal structure of untreated wild-type protein. We normalized the two spectra in the 295-300 nm range, which is not affected by bound nucleotides, then subtracted them to obtain a residual spectrum (green), which closely matched a scaled spectrum of ADP (black circles). Quantitation of ADP amounts from the residual spectrum using the molar absorbance of ADP (15,400 M-1cm-1 at 260 nm) and PCH-2 (38,400 M-1cm-1 at 280 nm) indicated that urea treatment removes ∼2.3 ADP molecules per PCH-2 hexamer.
Tables
Table 1
Data collection and refinement statistics
| PCH-2 SeMet | PCH-2 native | |
|---|---|---|
| Data collection | ||
| Synchrotron/Beamline | APS 24ID-E | SSRL 12-2 |
| Resolution (Å) | 3.23 | 2.3 |
| Wavelength (Å) | 0.97921 | 0.9795 |
| Space group | C2221 | C2221 |
| Unit cell dimensions (a, b, c) Å | 126.1, 239.5, 198.2 | 126.7 241.0 197.9 |
| Unit cell angles (α, β, γ) ° | 90, 90, 90 | 90, 90, 90 |
| I/σ (last shell) | 9.3 (1.0) | 17.9 (0.8) |
| * Rsym (last shell) | 0.198 (2.166) | 0.098 (3.143) |
| † Rmeas (last shell) | 0.213 (2.326) | 0.102 (3.297) |
| ‡ Isotropic CC1/2, last shell | 0.592 | 0.275 |
| § Directional CC1/2, last shell (Å) | ||
| a* | – | 0.498 (2.3 Å) |
| b* | – | 0.532 (2.3 Å) |
| c* | – | 0.608 (3.2 Å) |
| Completeness (last shell) % | 99.9 (99.9) | 99.5 (90.8) |
| Number of reflections | 33,462 | 1,808,343 |
| unique | 4410 | 134,133 |
| Multiplicity (last shell) | 7.5 (7.6) | 13.5 (10.6) |
| Number of sites | 68 | – |
| § Anisotropic scaling B-factors (Å2) | ||
| a* | – | −8.09 |
| b* | – | −8.02 |
| c* | – | 16.11 |
| isotropic B-factor correction | – | −19.65 |
| Refinement | ||
| Resolution range (Å) | – | 40 - 2.3 |
| No. of reflections | – | 96,084 |
| working | – | 91,200 |
| free | – | 4884 |
| # Rwork (%) | – | 22.97 |
| # Rfree (%) | – | 26.42 |
| Structure/Stereochemistry | ||
| Number of atoms | – | 18,017 |
| ligands (ADP, SO4) | – | 89 |
| solvent | – | 55 |
| r.m.s.d. bond lengths (Å) | – | 0.004 |
| r.m.s.d. bond angles (°) | – | 0.730 |
| ¶ PDB ID | – | 4XGU |
-
*
Rsym = ∑∑j|Ij − 〈I〉|/∑Ij, where Ij is the intensity measurement for reflection j and 〈I〉 is the mean intensity for multiply recorded reflections.
-
†
Rmeas = ∑h [√(n/(n − 1)) ∑j [Ihj − 〈Ih〉]/∑hj 〈Ih〉 where Ihj is a single intensity measurement for reflection h, 〈Ih〉 is the average intensity measurement for multiply recorded reflections, and n is the number of observations of reflection h.
-
‡
CC1/2 is the Pearson correlation coefficient between the average measured intensities of two randomly-assigned half-sets of the measurements of each unique reflection (Karplus and Diederichs, 2012).
-
§
High-resolution native data were anisotropically scaled and elliptical data cutoffs were applied according to directional intensity and CC1/2 data (see ‘Materials and methods’ and Figure 3—figure supplement 1A for details on data anisotropy and resolution cutoffs).
-
#
Rwork, free = ∑||Fobs| − |Fcalc||/|Fobs|, where the working and free R-factors are calculated using the working and free reflection sets, respectively.
-
¶
Coordinates and structure factors have been deposited in the RCSB Protein Data Bank (www.pdb.org).
Download links
A two-part list of links to download the article, or parts of the article, in various formats.
Downloads (link to download the article as PDF)
Open citations (links to open the citations from this article in various online reference manager services)
Cite this article (links to download the citations from this article in formats compatible with various reference manager tools)
TRIP13 is a protein-remodeling AAA+ ATPase that catalyzes MAD2 conformation switching
eLife 4:e07367.
https://doi.org/10.7554/eLife.07367


