Chemical activation of the mechanotransduction channel Piezo1
- Howard Hughes Medical Institute, The Scripps Research Institute, United States
- University of California, San Diego, United States
- Genomics Institute of the Novartis Research Foundation, United States
Figures
Figure 1 with 1 supplement
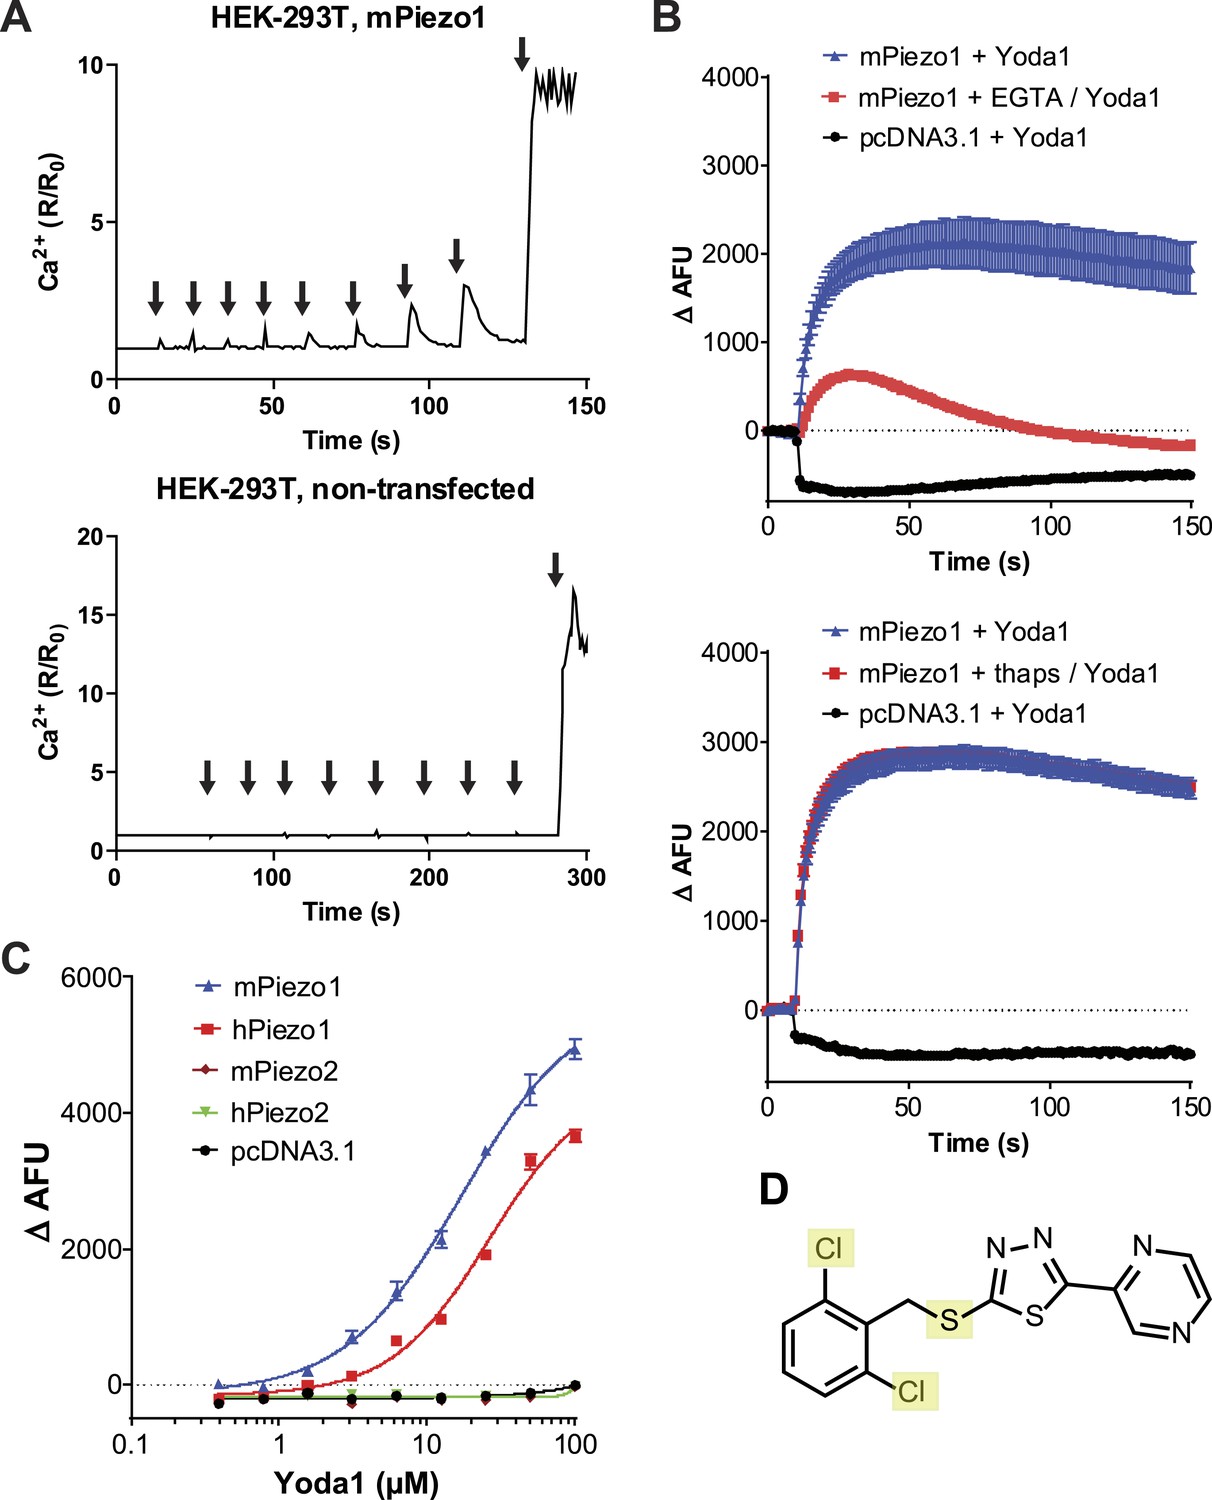
A high-throughput screen identifies a Piezo1 activating chemical, Yoda1.
(A) mPiezo1 mediates Ca2+ influx upon mechanical activation. Ratiometric Ca2+ imaging (Fura-2) of human embryonic kidney (HEK) 293T cells transiently transfected with Piezo1 or untransfected. Cells were subjected to a series of mechanical stimuli, by pressing a glass probe briefly onto the cell surface for 150 ms (arrows). For each consecutive stimulus, the travel distance of probe was increased by 1 μm (B) Yoda1 (25 μM) mediates Ca2+ responses (384-well FLIPR) in HEK cells transiently transfected with mPiezo1. When indicated, extracellular calcium was chelated by addition of EGTA, or cells were pretreated with thapsigargin to deplete intracellular calcium stores. Traces represent average ± SEM fluorescence of four wells. (C) Concentration-response profiles of mouse and human Piezo1 and Piezo2, transfected HEK293T cells assayed using FLIPR suggesting apparent EC50 of 17.1 and 26.6 μM for mouse and human Piezo1, respectively (95% confidence interval: 13.4 to 21.9, and 20.6 to 34.4), however, compound (in) solubility precludes meaningful conclusions with respect to EC50 (see text). (D) Chemical structure of Yoda1. The functional groups tested chlorines and thioether are highlighted.
Figure 1—figure supplement 1
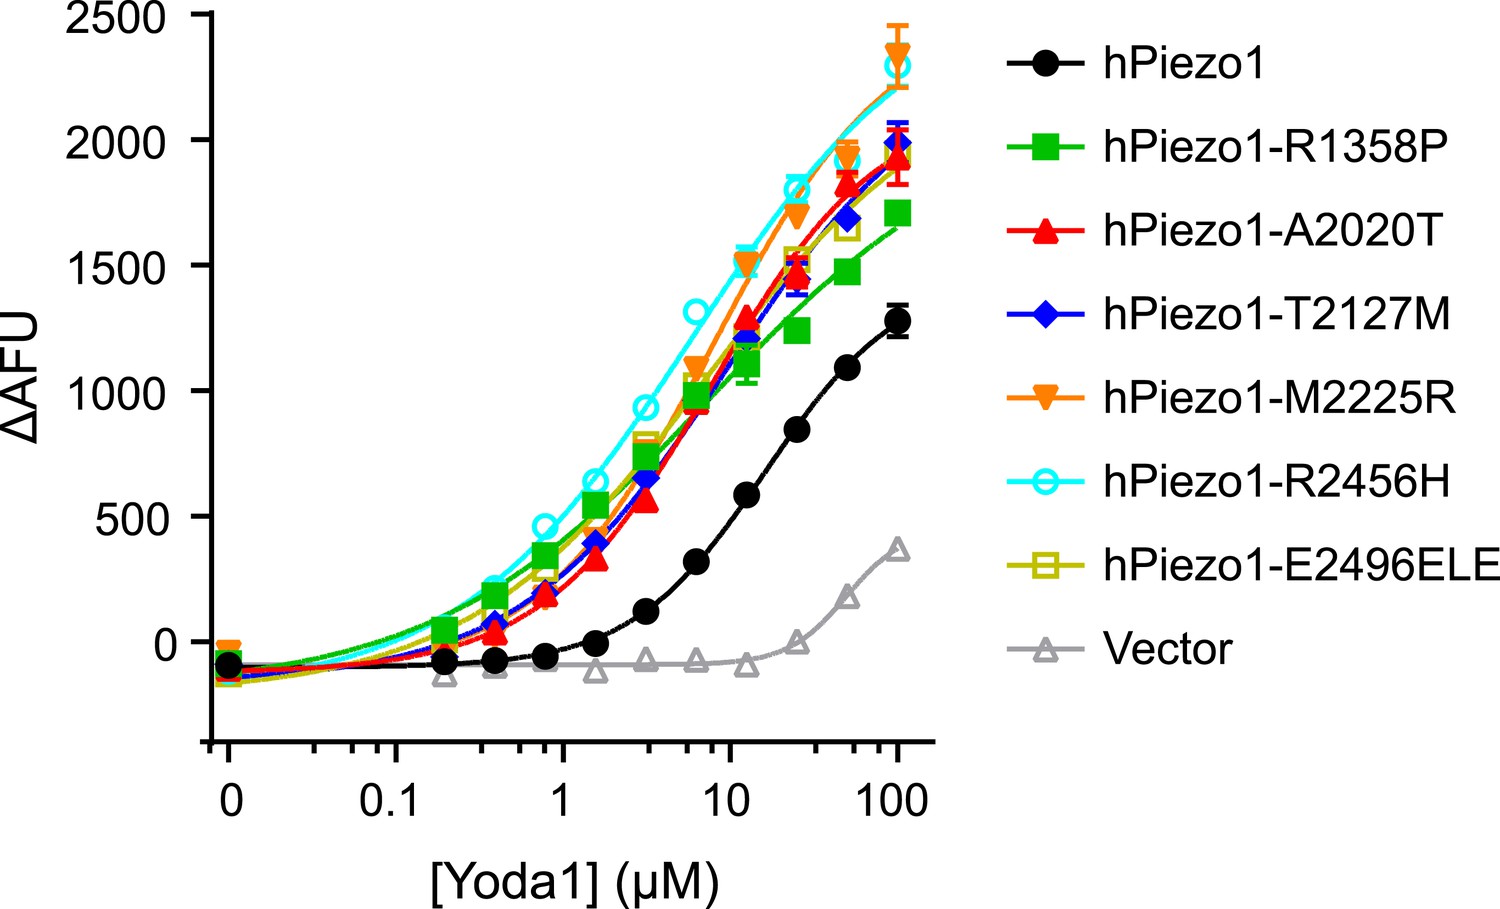
Piezo1 gain-of-function mutations show increased Yoda1 responses.
Dose-response curves of HEK293T cells transiently transfected with hPiezo1 and indicated mutants (Albuisson et al., 2013). Calcium responses were determined in response to increasing concentration of Yoda1 by means of 384-well FLIPR. Average fluorescence change ± SEM in four wells is plotted and fitted to a sigmoidal dose-response curve. Please note that, compared to Figure 1C, HEK cells here exhibited a more pronounced background response to Yoda1 (see vector control) at higher concentrations. We do not know the cause of such variation in responses.
Figure 2
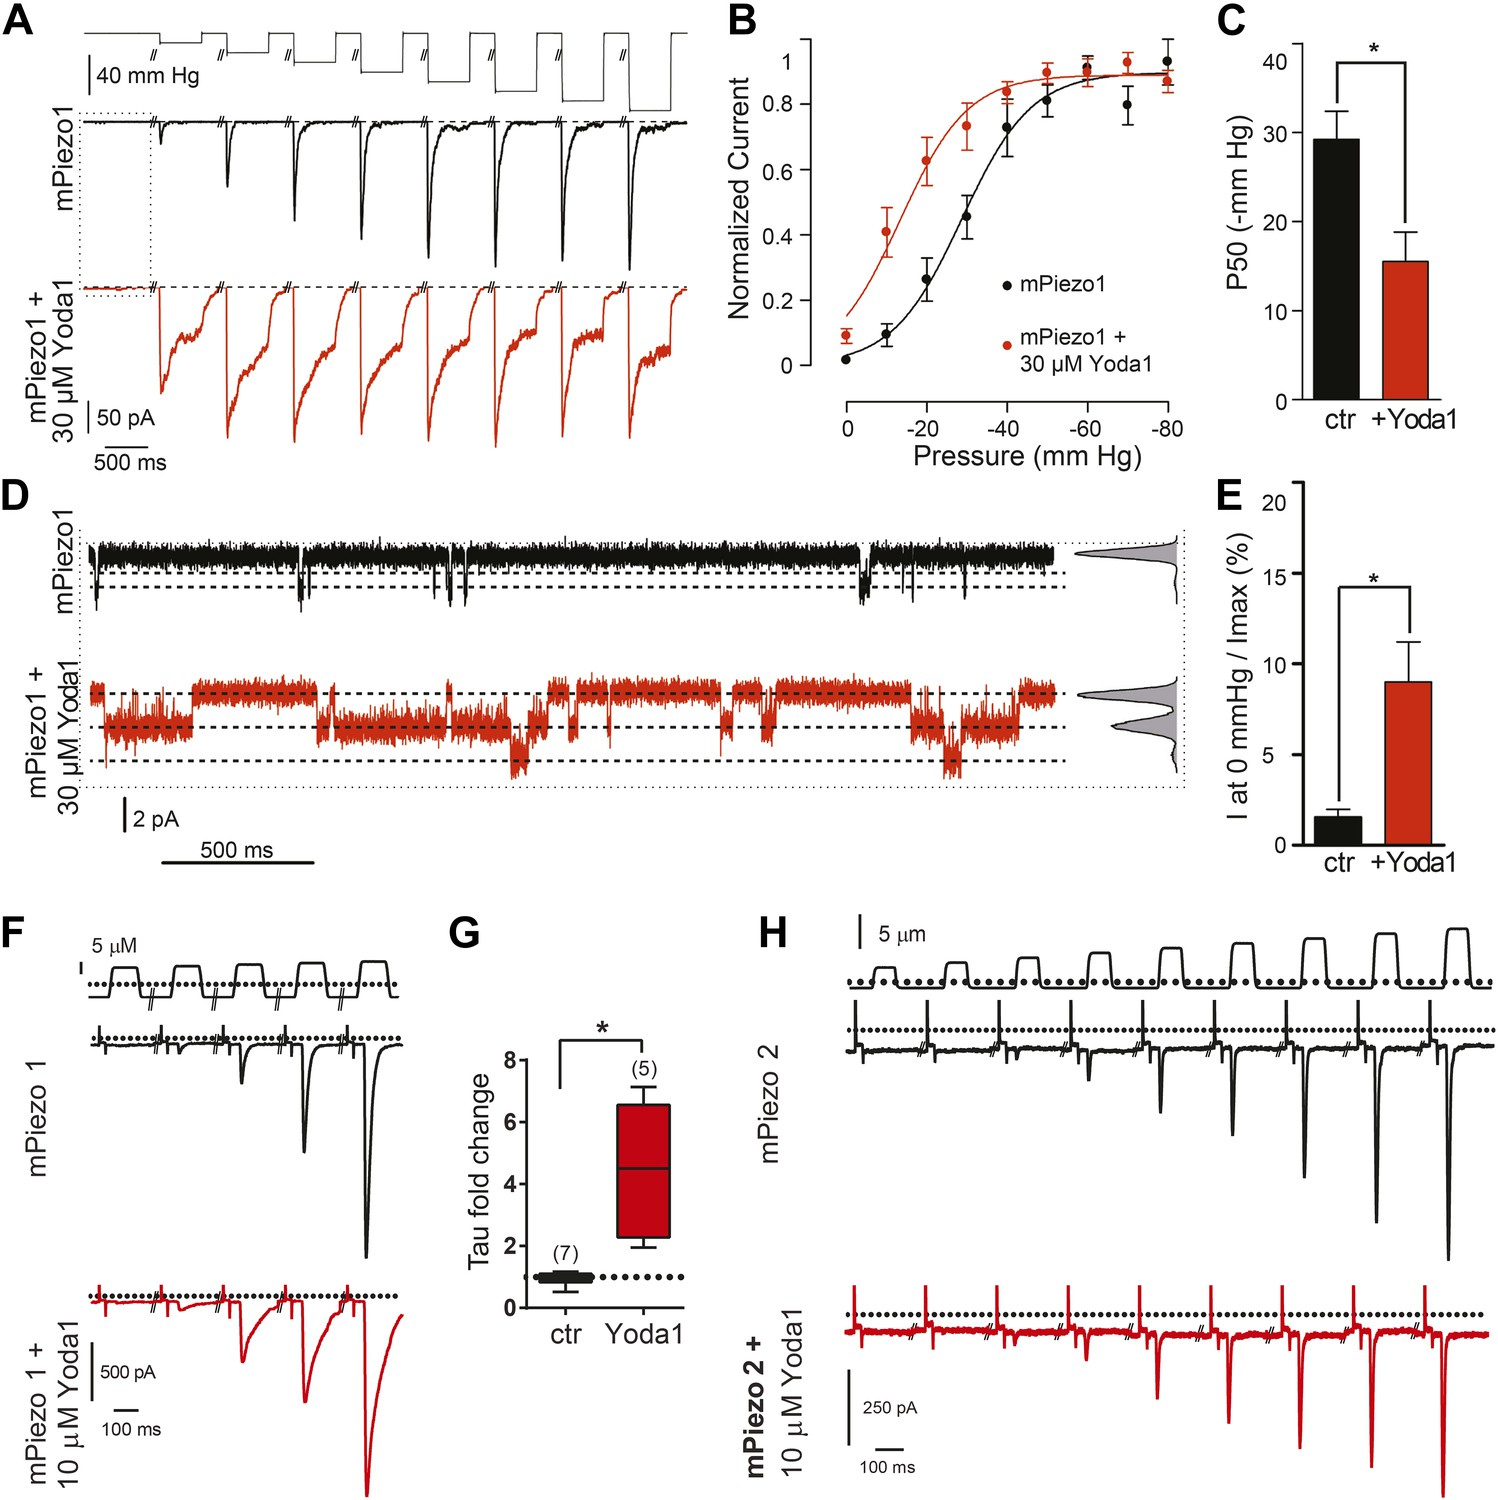
Yoda1 functions as a gating modifier of Piezo1.
(A–E) mPiezo1-transfected HEK293T cells, cell-attached patch configuration. (A) Typical recordings of stretch-activated currents at −80 mV in two mPiezo1-transfected cells with or without 30 μM Yoda1 in the patch pipette. Negative pressure pulses from 0 to −80 mm Hg are applied for 500 ms every 15 s. (B) Average normalized current–pressure relationships from mPiezo1-transfected cell recordings with or without 30 μM Yoda1 in the patch pipette (n = 8 and 12, respectively). (C) Average P50 values from individual cells used for panel B (p < 0.05, Mann–Whitney t-test). (D) High magnification of recording traces shown in panel A in the absence of stretch stimulation. Left panels are full-trace histograms. (E) Average current without stretch stimulation normalized to maximal stretch-activated current from mPiezo1-transfected cells recorded at −80 mV with or without 30 μM Yoda1 in the patch pipette (n = 8 and 12, respectively; p < 0.05, Mann–Whitney t-test). (F–H) mPiezo1- and mPiezo2-transfected HEK293T cells, whole-cell configuration. (F) Stimulus displacement in 0.5-μm increments every 10 s before (black trace) and 1–2 min after bath application of 10 μM Yoda1 (red trace). A 20-mV step was applied in the beginning of each sweep (sweeps are concatenated and hack marks indicate ∼10 s) to monitor membrane (Rm) and access (Ra) resistance. (G) The fold change in the inactivation time constant indicates a significant slowing of inactivation during Yoda1 exposure. The effect was completely reversible (not shown). The baseline tau prior to Yoda1 exposure was 16.5 ± 1.5 ms (n = 5) (H). No effect was observed upon Yoda1 exposure (up to 5 min) to the mechanically activated currents elicited in a cell expressing mPiezo2. Fold change in inactivation time constant was 0.89-, 1.19-, and 1.25-fold (n = 3). Dotted lines indicated 0 current level (current traces) and displacement at which cell was visibly touched (top). *p < 0.005, Mann–Whitney t-test.
Figure 3
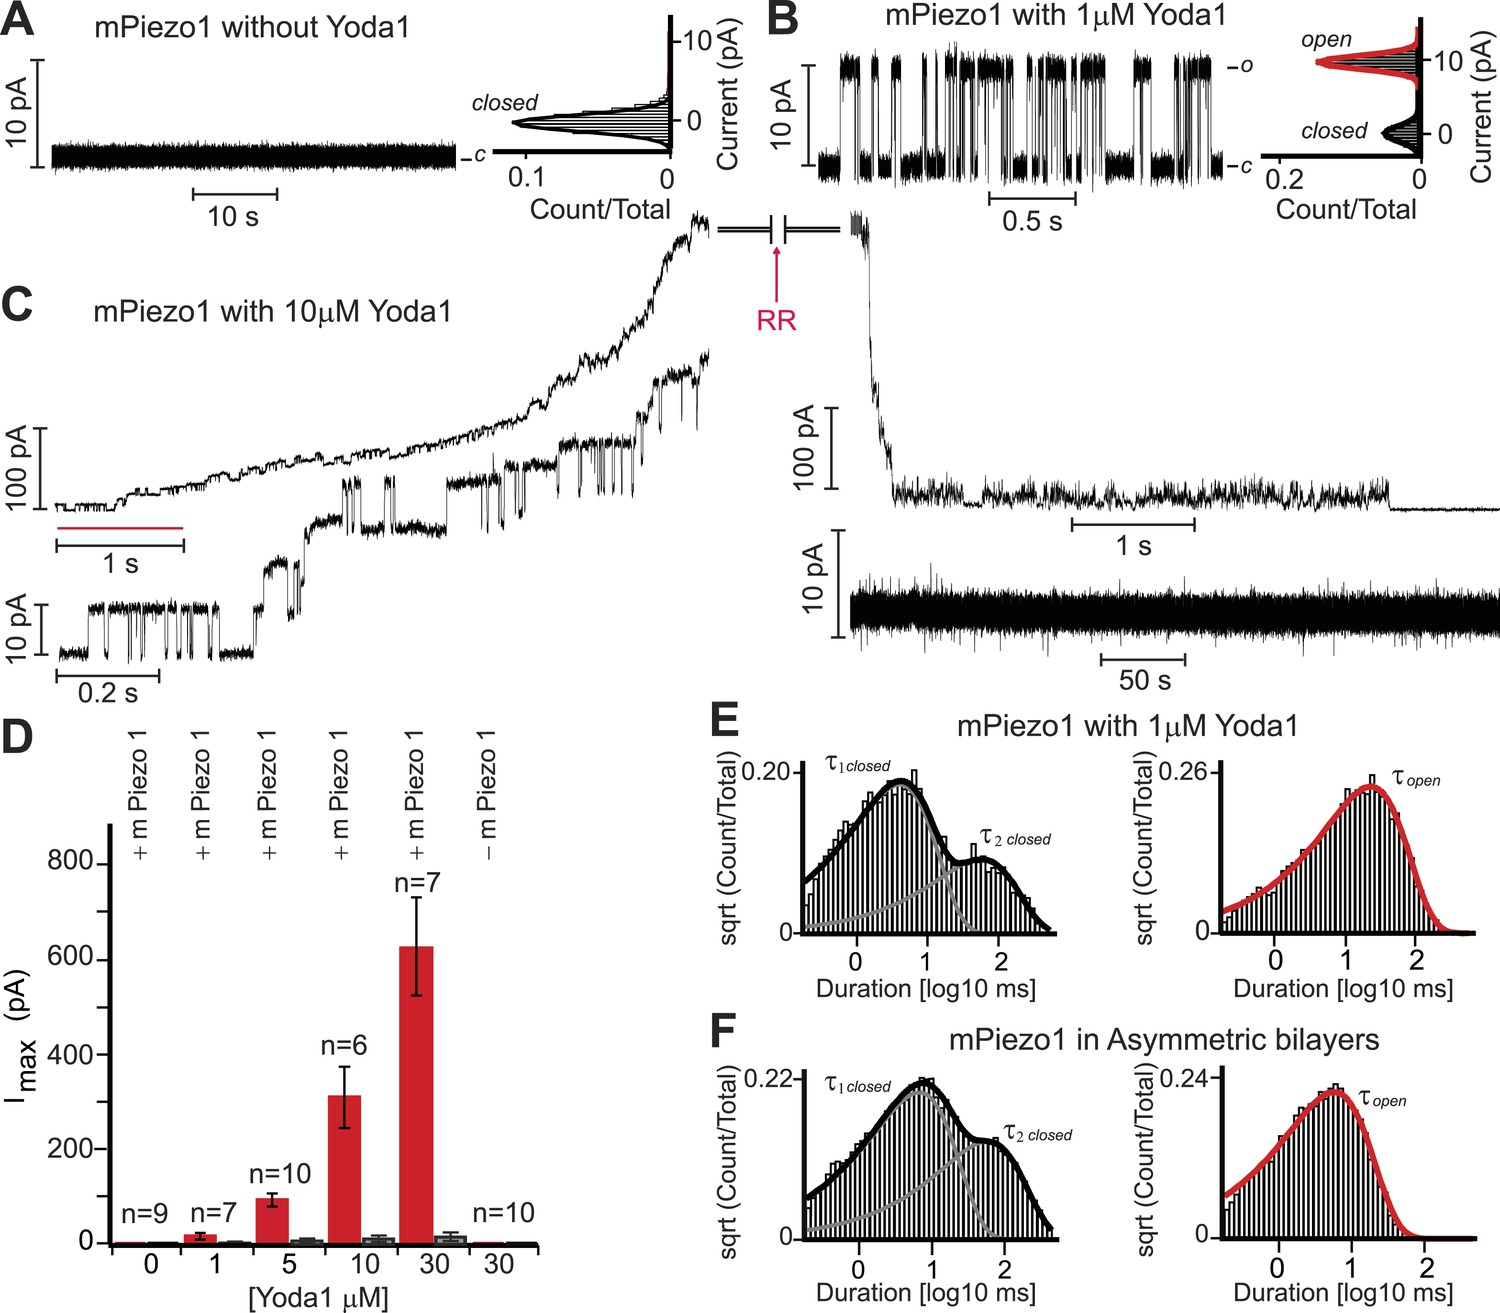
Yoda1 activates mPiezo1 in a membrane-delimited fashion.
(A) Electrical recordings of reconstituted mPiezo1 in the symmetric DiPhytanoyl-sn-glycero-3-PhosphoCholine (DPhPC) bilayers and corresponding all point current histograms without the application of Yoda1. (B) Single-channel electrical recordings of reconstituted mPiezo1 in the symmetric DPhPC bilayers in the presence of 1 μM Yoda1. The calculated single-channel conductance of outward currents from the corresponding all point current histograms is 98 ± 9 pS in 0.5 M KCl, 20 mM HEPES, pH 7.4 at V = 100 mV. (C) Macroscopic currents of mPiezo1 in the presence of 10 μM Yoda1 (upper left panel) followed by the injection of 30 μM blocker RR (upper right panel). The lower left panel is an expansion of the record (red line) to highlight multiple-channel openings. The lower right panel shows a complete block of channel activity after 6 s of RR injection. (D) Maximum current obtained at the indicated concentrations of Yoda1 (red bars) and the subsequent block by RR (black bars). Each concentration point is plotted (red bars) as the function of maximum currents obtained in an ‘n’ number of experiments at V = 100 mV. Error bars indicate standard deviation. Note the lack of Piezo activity either without Yoda1 (n = 9) or without mPiezo1 (n = 10) in the bilayers. When indicated, Yoda1 is reconstituted in the DPhPC liposomes prior to the bilayer formation. (E) Representative histograms of closed (left graph) and open (right graph) dwell times extracted from single-channel analysis of mPiezo1 in the presence of 1 μM Yoda1; τ1 closed = 3 ± 1 ms, τ2 closed = 57 ± 15 ms, and τ open = 55 ± 9 ms. (F) Representative histograms of closed (left graph) and open (right graph) dwell times extracted from single-channel analysis of mPiezo1 reconstituted in an asymmetric bilayers (without Yoda1); τ1 closed = 5 ± 1 ms, τ2 closed = 47 ± 9 ms, and τ open = 13 ± 4 ms.
Download links
A two-part list of links to download the article, or parts of the article, in various formats.
Downloads (link to download the article as PDF)
Open citations (links to open the citations from this article in various online reference manager services)
Cite this article (links to download the citations from this article in formats compatible with various reference manager tools)
Chemical activation of the mechanotransduction channel Piezo1
eLife 4:e07369.
https://doi.org/10.7554/eLife.07369


