Piezo1 links mechanical forces to red blood cell volume
- Howard Hughes Medical Institute, The Scripps Research Institute, United States
- University of California, San Diego, United States
- Genomics Institute of the Novartis Research Foundation, United States
Figures
Figure 1 with 2 supplements
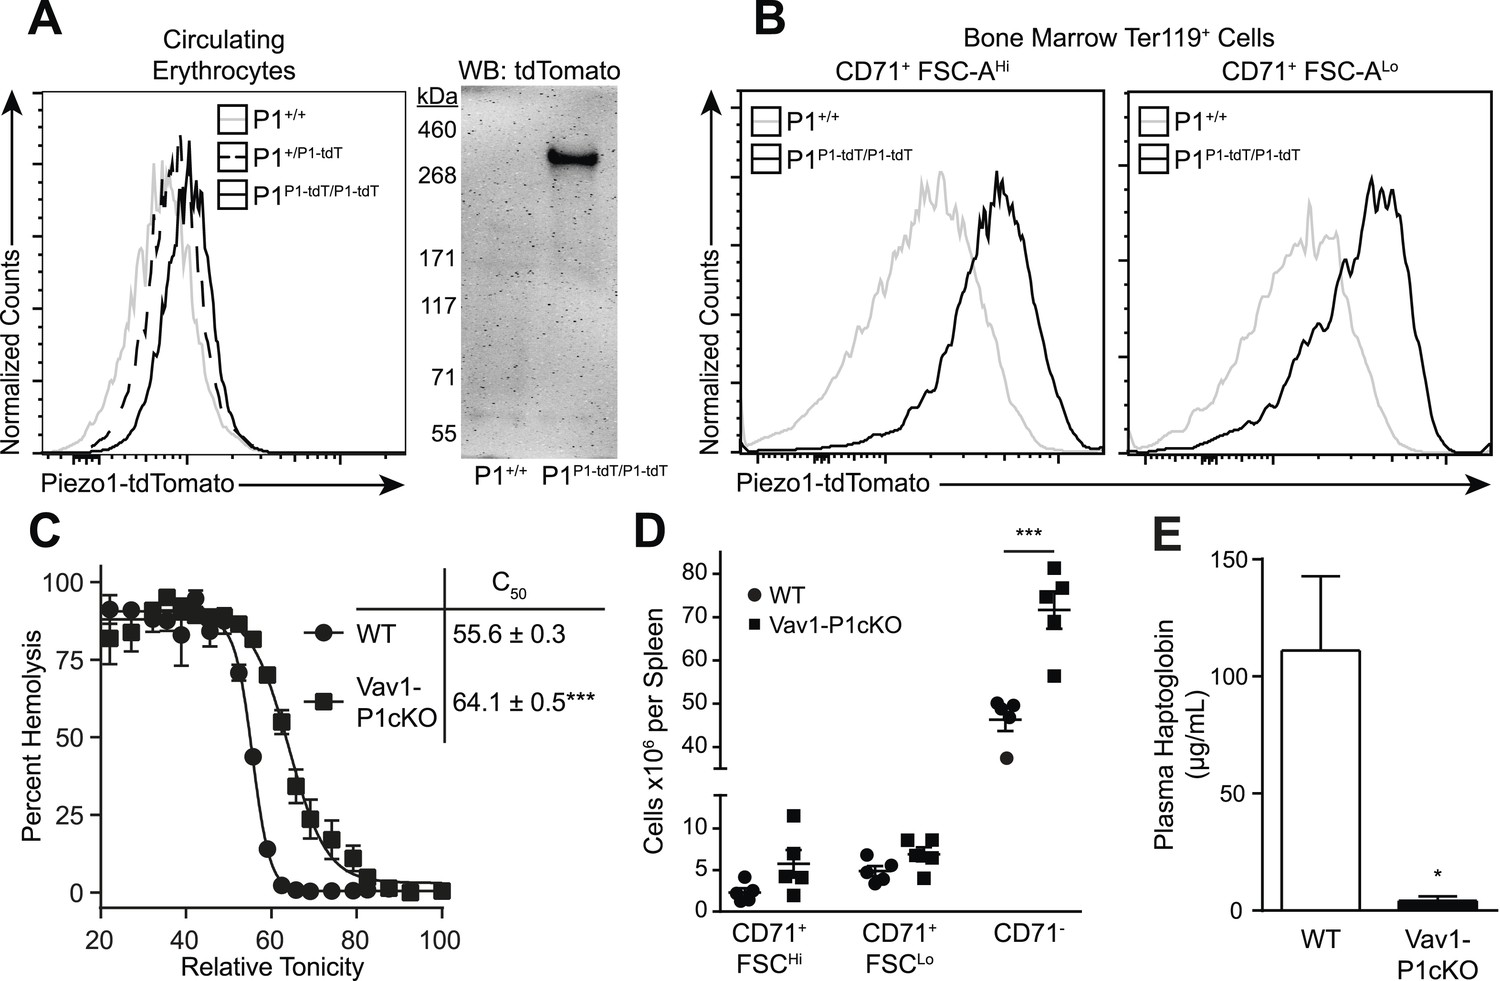
Deletion of Piezo1 in blood cells causes RBC fragility and splenic sequestration.
(A) Left: flow cytometry histograms of tdTomato fluorescence on Ter-119+ peripheral blood red blood cells (RBCs). Rightward shifts indicate increased fluorescence. Right: Western blot for tdTomato from lysates of packed RBCs. (B) Flow cytometry histograms of tdTomato fluorescence from less (CD71+ FSC-AHi) and more (CD71+ FSC-ALo) mature RBC progenitor cells. (C) Percent hemolysis of blood of WT and Vav1-P1cKO mice when exposed to hypotonic solutions of indicated relative tonicity. C50 values (relative tonicity at half maximal lysis) were calculated by fitting the data to a 4-parameter logistic sigmoidal curve. (D) Total number of Ter-119+ erythroid cells found in the spleens of WT and Vav1-P1cKO mice. (E) Plasma haptoglobin concentrations of both WT and Vav1-P1cKO mice as determined by ELISA. A and B are representative histograms and blots from three individual mice per genotype. Graphs in C and E result from individual experiments consisting of at least 3 WT and 3 Vav1-P1cKO mice each, with each experiment repeated 2, 3, and 3 times for C, D, and E, respectively. *p < 0.05, ***p < 0.001 by unpaired Student's t-test.
Figure 1—figure supplement 1
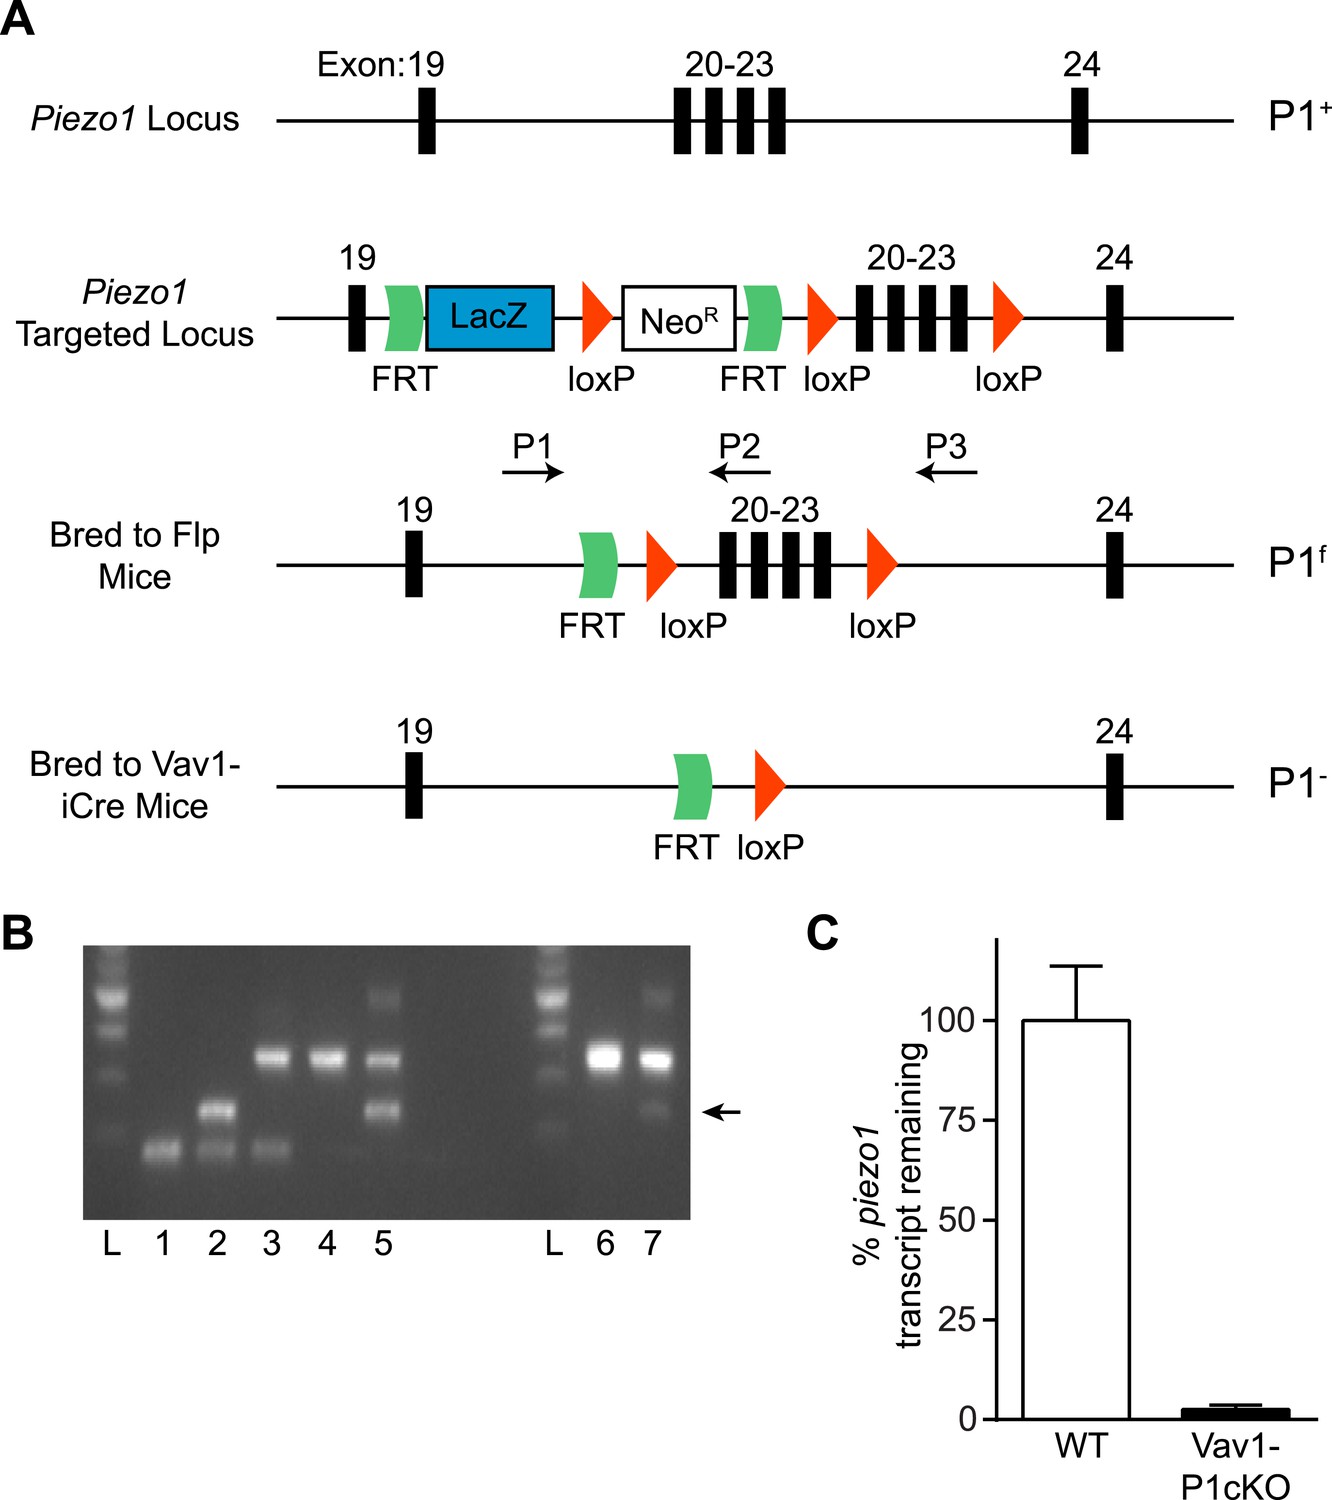
Generation and validation of Vav1-P1cKO mice.
(A) Schematic for generation of Vav1-P1cKO mice. Deletion of exons 20–23 causes a frameshift in the piezo1 transcript. (B) Genotyping of Piezo1 mice with the given Piezo1 genotypes: 1: +/+, 2: +/−, 3: f/+, 4: f/f, 5: f/−, 6: P1f/f, 7: Vav1-iCre+ P1f/f. Arrow indicates the visible (–) band in Vav1-P1cKO mice. (C) piezo1 transcript expression (mean + SEM, n = 4) of lymphocytes isolated from WT and Vav1-P1cKO mice. Transcript levels were calculated using the 2−ΔΔCT method using gapdh as a reference gene and were normalized to the average expression from WT samples.
Figure 1—figure supplement 2
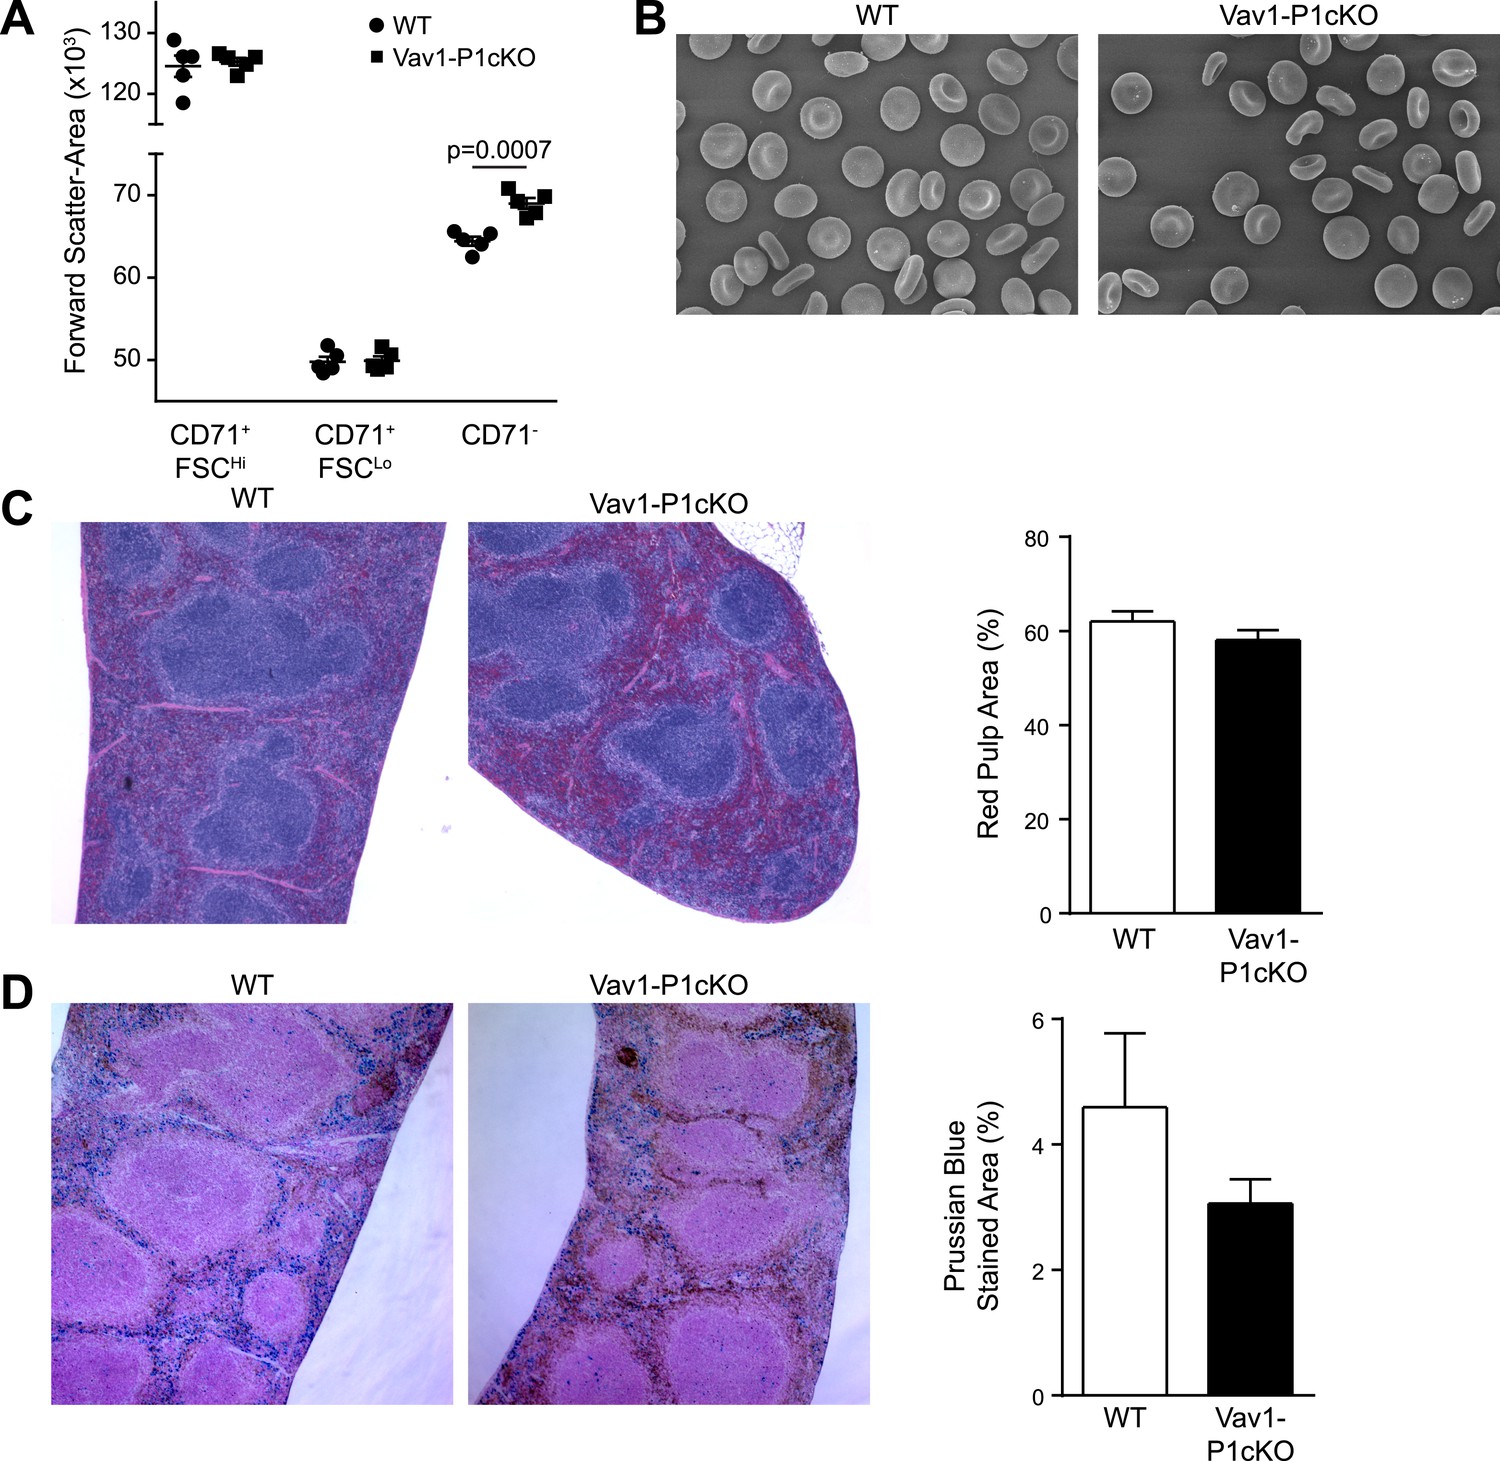
Histology of WT and Vav1-P1cKO spleens.
(A) Forward scatter area (size) of different populations of splenic Ter-119+ RBCs from WT and Vav1-P1cKO mice. (B) Left—scanning electron micrographs of WT (left) and Vav1-P1cKO (right) RBCs. (C) Representative hematoxylin- and eosin-stained spleen sections from WT and Vav1-P1cKO mice. Right—quantification of red pulp area in WT and Vav1-P1cKO spleens. (D) Left—representative Prussian blue-stained spleen sections from WT and Vav1-P1cKO mice. Right—quantification of percent of spleen area stained with Prussian blue in WT and Vav1-P1cKO mice. Graph in A is representative from three experiments, with at least 3 mice per group per experiment. Graphs in C and D result from analysis of 3 spleen sections from each of 4 WT and 4 Vav1-P1cKO spleens.
Figure 2 with 1 supplement
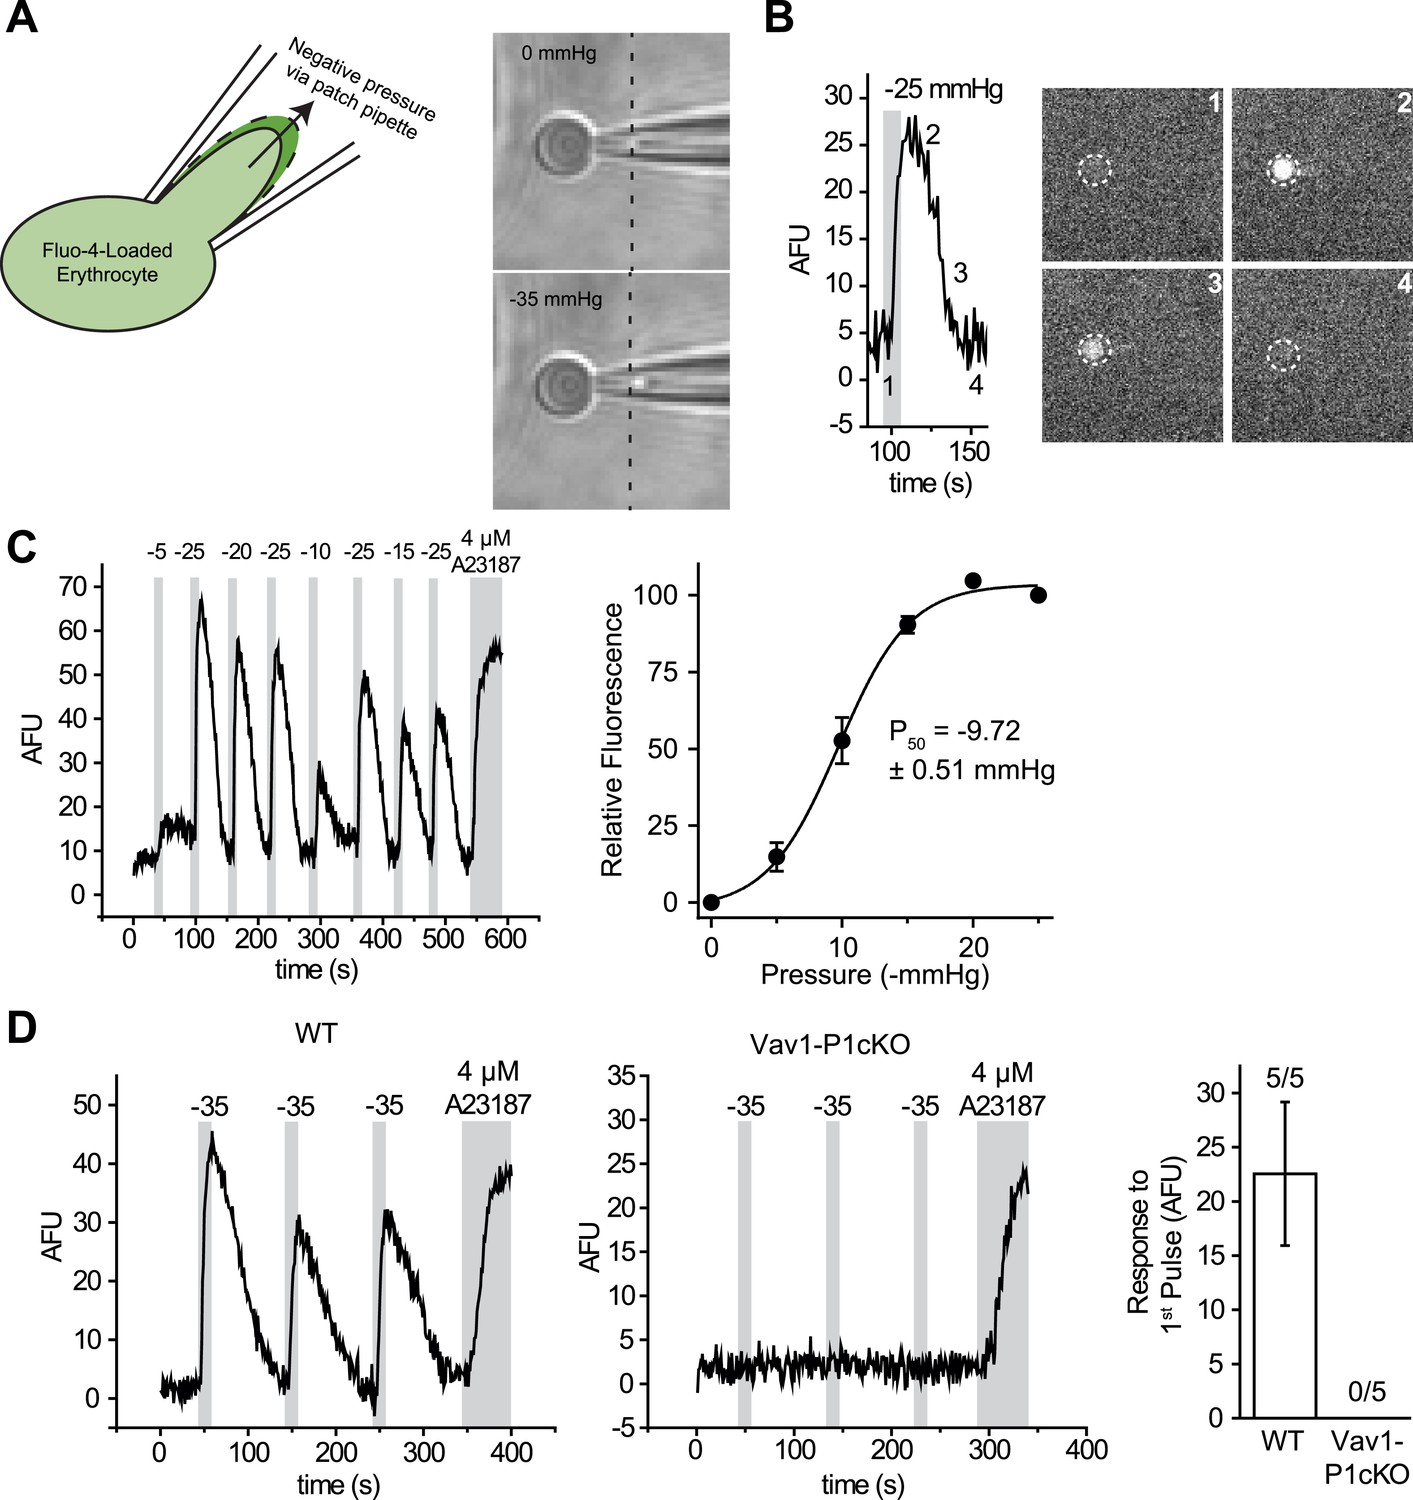
RBCs exhibit Piezo1-dependent Ca2+ influx in response to mechanical stretch.
(A) Left: cartoon representation of mechanical stretching of RBCs. Right: brightfield images of an individual RBC before (top) and during (bottom) application of −35 mmHg. Dotted line indicates starting location of RBC membrane prior to stretching. (B) Left: representative plot of background subtracted Fluo-4 fluorescence of an individual RBC following application of −25 mmHg for the time indicated by the gray shaded area. Right: images of the RBC plotted on left at the times indicated. (C) Left: representative plot of background subtracted Fluo-4 fluorescence from an individual RBC when subjected to pressure pulses of different magnitudes. Duration of the pulses is as indicated by shaded areas on plot; magnitude of pressure in mmHg is indicated above lines. Right: pressure-response curve (mean ± SEM) generated from 8 RBCs subjected to varying pressures. Responses to each different pressure were normalized to the average of the flanking −25 mmHg pulses, and the order of each different pressure applied was randomized for each separate RBC. (D) Representative plots from individual WT (Left) and Vav1-P1cKO (Right) RBCs subjected to pressure pulses as indicated in mmHg. Right graph represents mean ± SEM of fluorescence change in response to first −35 mmHg pulse from 5 WT and 5 Vav1-P1cKO RBCs subjected to mechanical stretching protocol as shown in plots. Numbers above graph indicate number of cells that had responses over 10 AFU out of total cells tested.
Figure 2—figure supplement 1
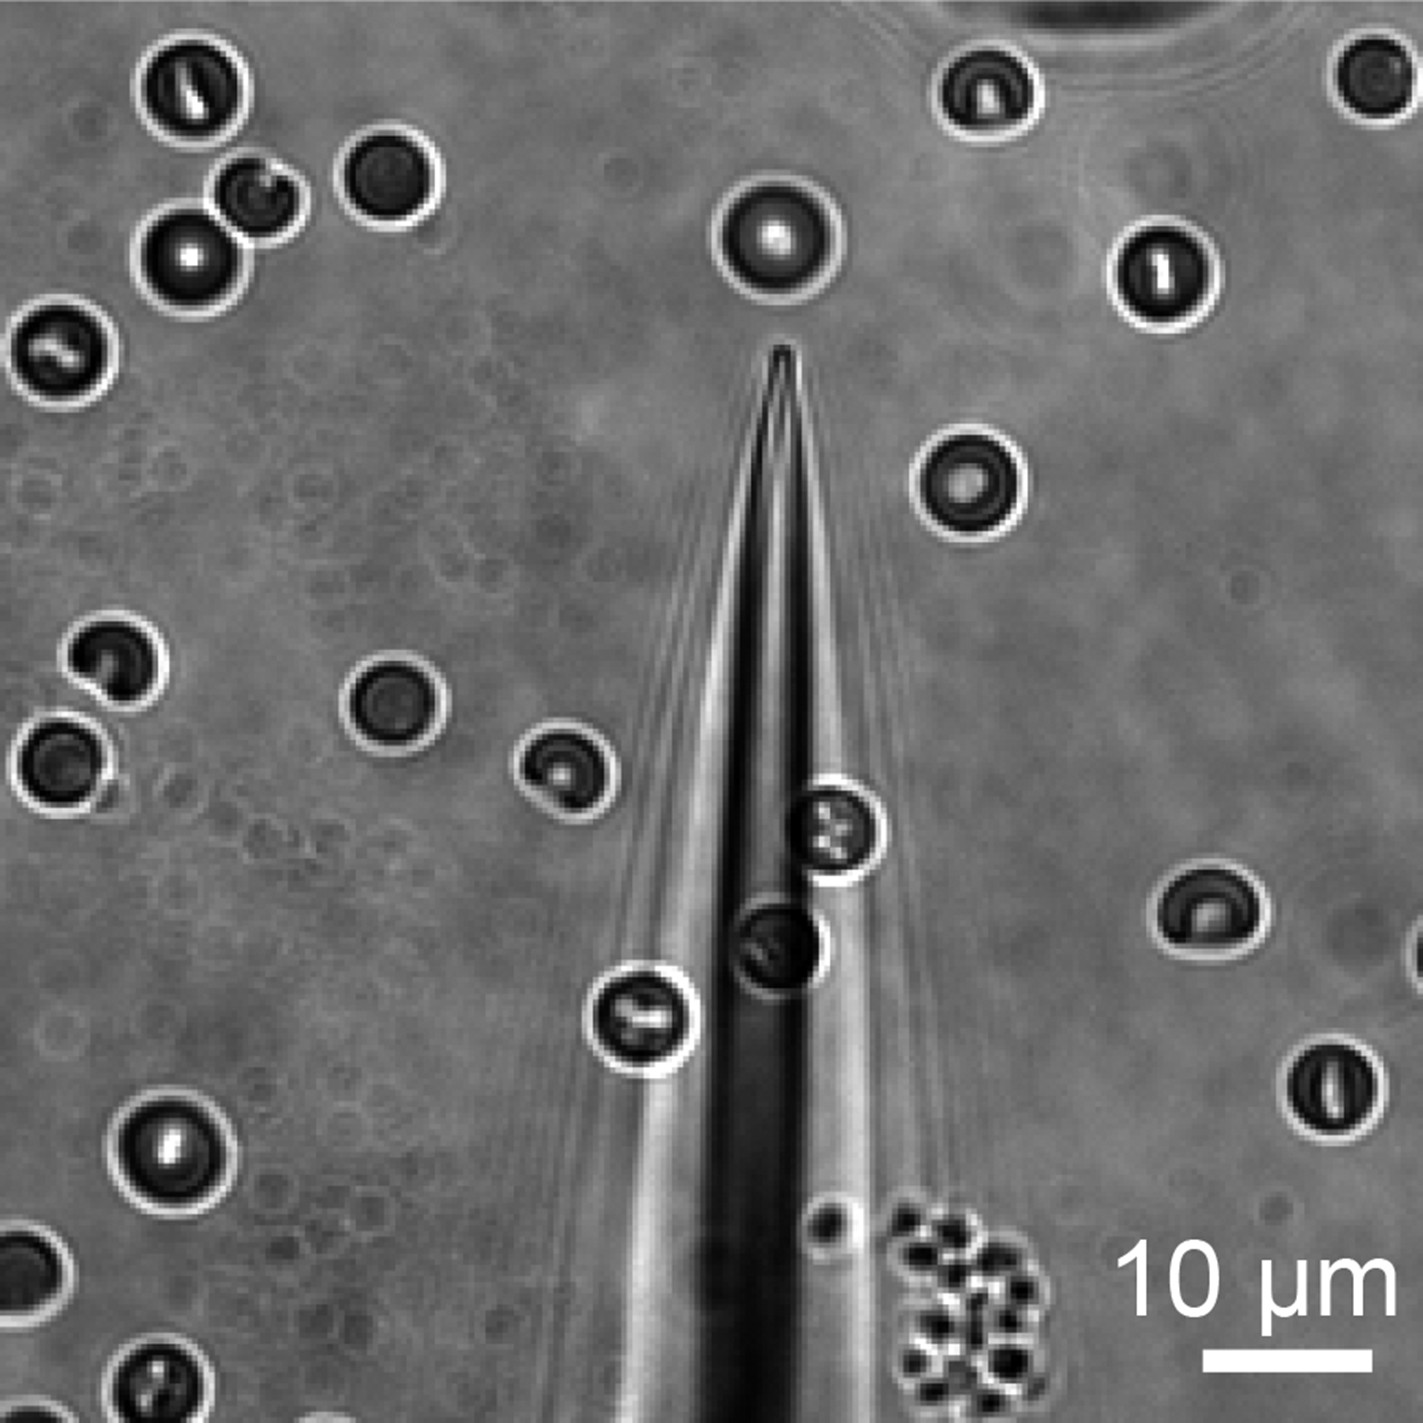
Bright field image of representative pipette used to elicit Ca2+ influx in RBCs.
https://doi.org/10.7554/eLife.07370.008
Figure 3 with 1 supplement
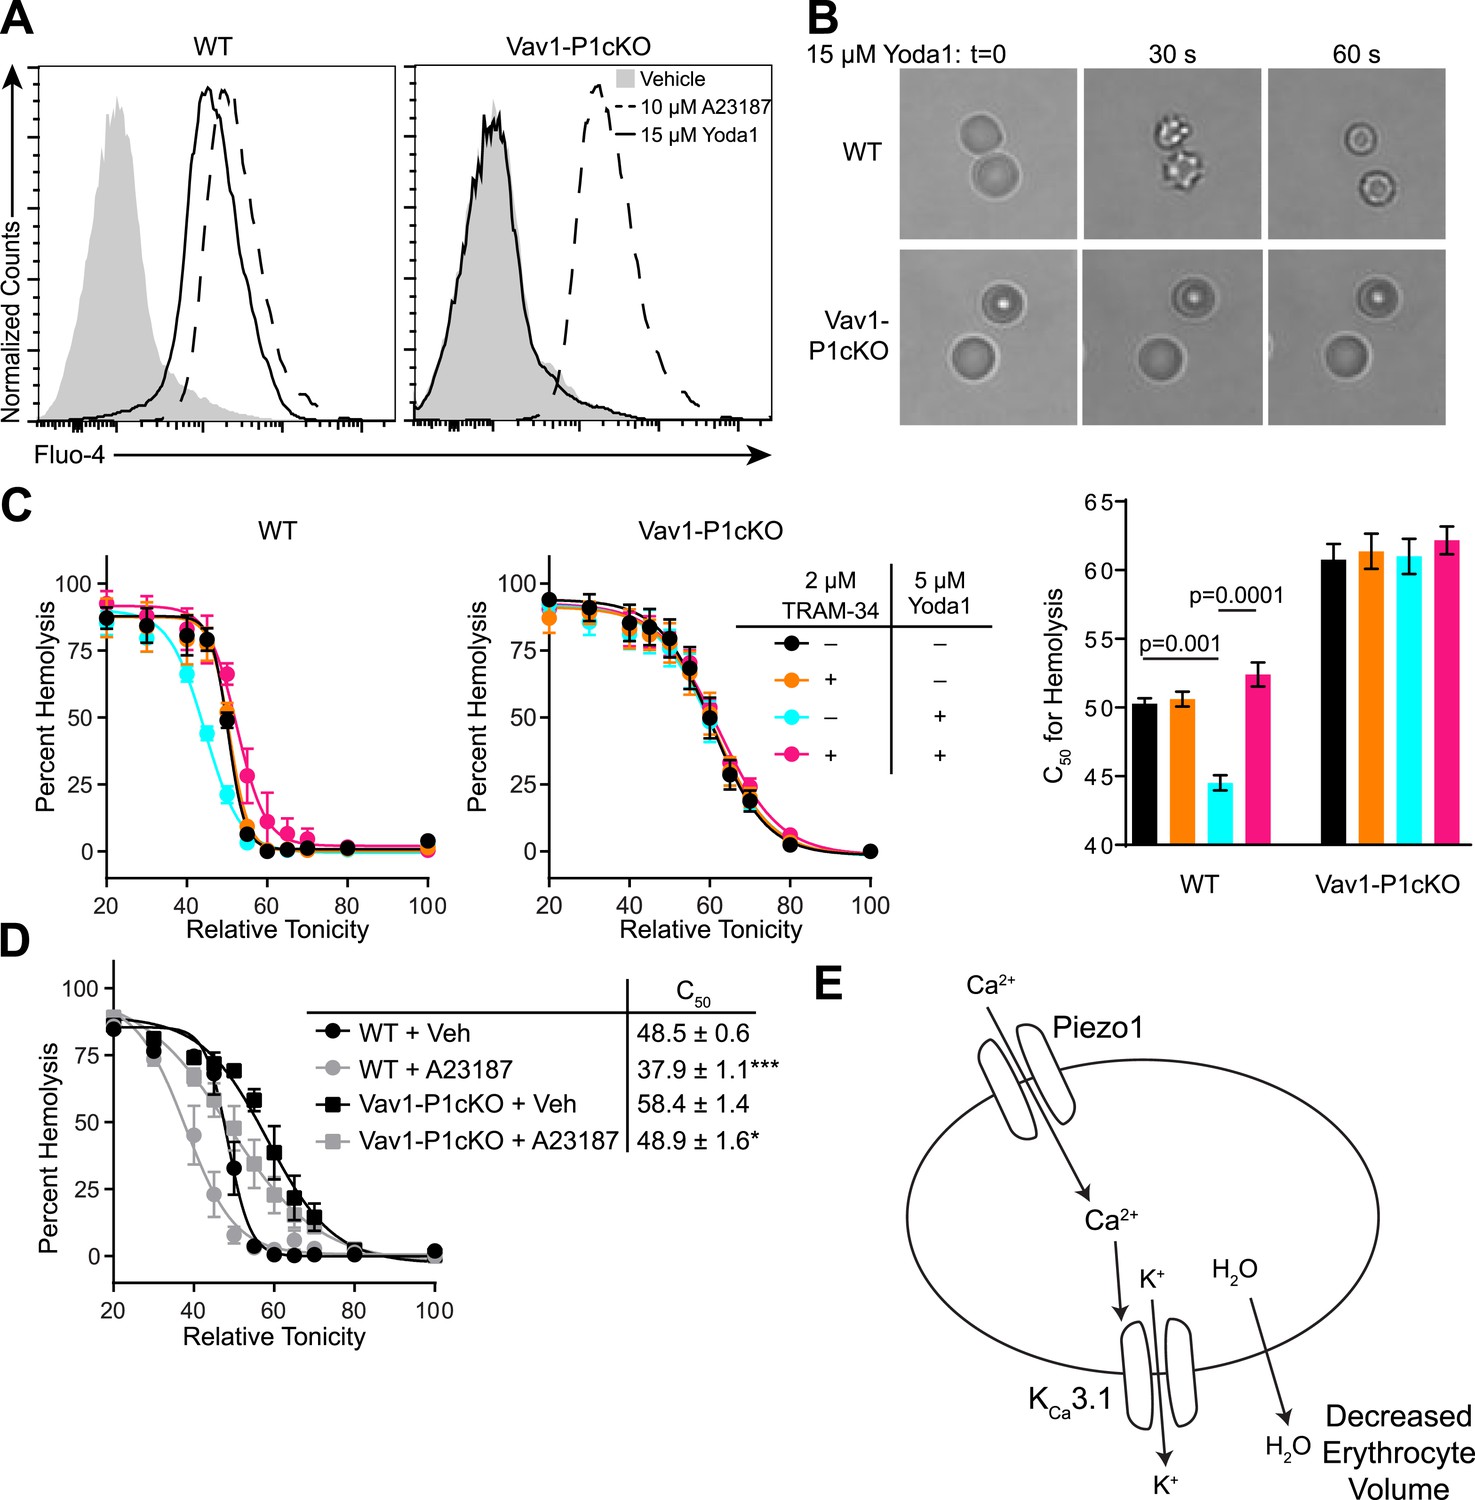
Piezo1 activation causes Ca2+ influx and KCa3.1-dependent RBC dehydration.
(A) Flow cytometry histograms of Fluo-4 fluorescence of WT (left) or Vav1-P1cKO (right) RBCs treated with vehicle (gray shaded), 15 μM Yoda1 (solid line), or 10 μM A23187 (dashed line) for 1 min as indicated. Rightward shifts in fluorescence indicate increased intracellular Ca2+. (B) Brightfield images from RBCs from WT (top) or Vav1-P1cKO (bottom) RBCs at the indicated times after superfusion with 15 μM Yoda1. (C) Osmotic fragility (±SEM, n = 3) of blood from WT (left) or Vav1-P1cKO (middle) treated with 2 μM the KCa3.1 antagonist TRAM-34 and/or 5 μM Yoda1 as indicated. Blood was incubated with TRAM-34 or vehicle for 10 min, and then incubated with Yoda1 or vehicle for 30 min. Graph on right depicts C50 ± SEM for hemolysis for the genotypes and treatments in the left graphs. p values were calculated using one-way ANOVA. (D) Osmotic fragility (±SEM, n = 3) of WT and Vav1-P1cKO blood treated with 1 μM of the Ca2+ ionophore A23187 for 30 min. *p < 0.05; ***p < 0.001 compared to genotype-matched, vehicle-treated blood by Student's t-test. (E) Working model for how Piezo1 activation regulates RBC volume. Experiments were repeated the following number of times: A: 3, B: 3, C: 2, D: 2, with results from an individual experiment being presented.
Figure 3—figure supplement 1

Tram-34 does not block Piezo1.
Average maximal response (mean ± SEM, vehicle, n = 194, TRAM-34, n = 191) of Fura2-loaded HEK293T cells transfected with mPiezo1-IRES-eGFP after superfusion with either vehicle or 2 μM TRAM-34 for 4 min prior to superfusion with 15 μM Yoda1.
Author response image 1
Videos
Video 1
Video of Ca2+ influx into a RBC following mechanical stimulation.
Time lapse video of a single Fluo-4-loaded RBC subjected to repeated 10-s pulses of −35 mmHg as indicated. Time scale is in min:s.
Tables
Table 1
Hematological indices from blood isolated from 8- to10-week-old WT and Vav1-P1cKO mice
| WT ± SEM (n = 19) | Vav1-P1cKO ± SEM (n = 18) | |
|---|---|---|
| RBC | 100 ± 0.58 | 96.60 ± 1.10* |
| HGB | 100 ± 0.54 | 99.50 ± 1.10 |
| HCT | 100 ± 0.51 | 105.59 ± 1.13*** |
| MCV | 100 ± 0.23 | 109.51 ± 1.51*** |
| MCH | 100 ± 0.25 | 103.14 ± 0.48*** |
| MCHC | 100 ± 0.26 | 94.37 ± 1.08*** |
| RDW | 100 ± 0.92 | 114.49 ± 2.64*** |
-
Data are pooled from four individual experiments, each experiment consisting of at least three age- and sex-matched mice per genotype. RBC: red blood cell count per unit volume; HGB: hemoglobin content; HCT: hematocrit; MCV: mean corpuscular volume; MCH: mean corpuscular hemoglobin; MCHC: mean corpuscular hemoglobin concentration; RDW: red cell distribution width. Indices for each mouse were normalized to the average value of WT mice from the same experiment. Statistics were calculated by two-tailed Mann–Whitney test. *p < 0.05, ***p < 0.001.
Download links
A two-part list of links to download the article, or parts of the article, in various formats.
Downloads (link to download the article as PDF)
Open citations (links to open the citations from this article in various online reference manager services)
Cite this article (links to download the citations from this article in formats compatible with various reference manager tools)
Piezo1 links mechanical forces to red blood cell volume
eLife 4:e07370.
https://doi.org/10.7554/eLife.07370


