The structure of plant photosystem I super-complex at 2.8 Å resolution
- Tel Aviv University, Israel
Figures
Figure 1
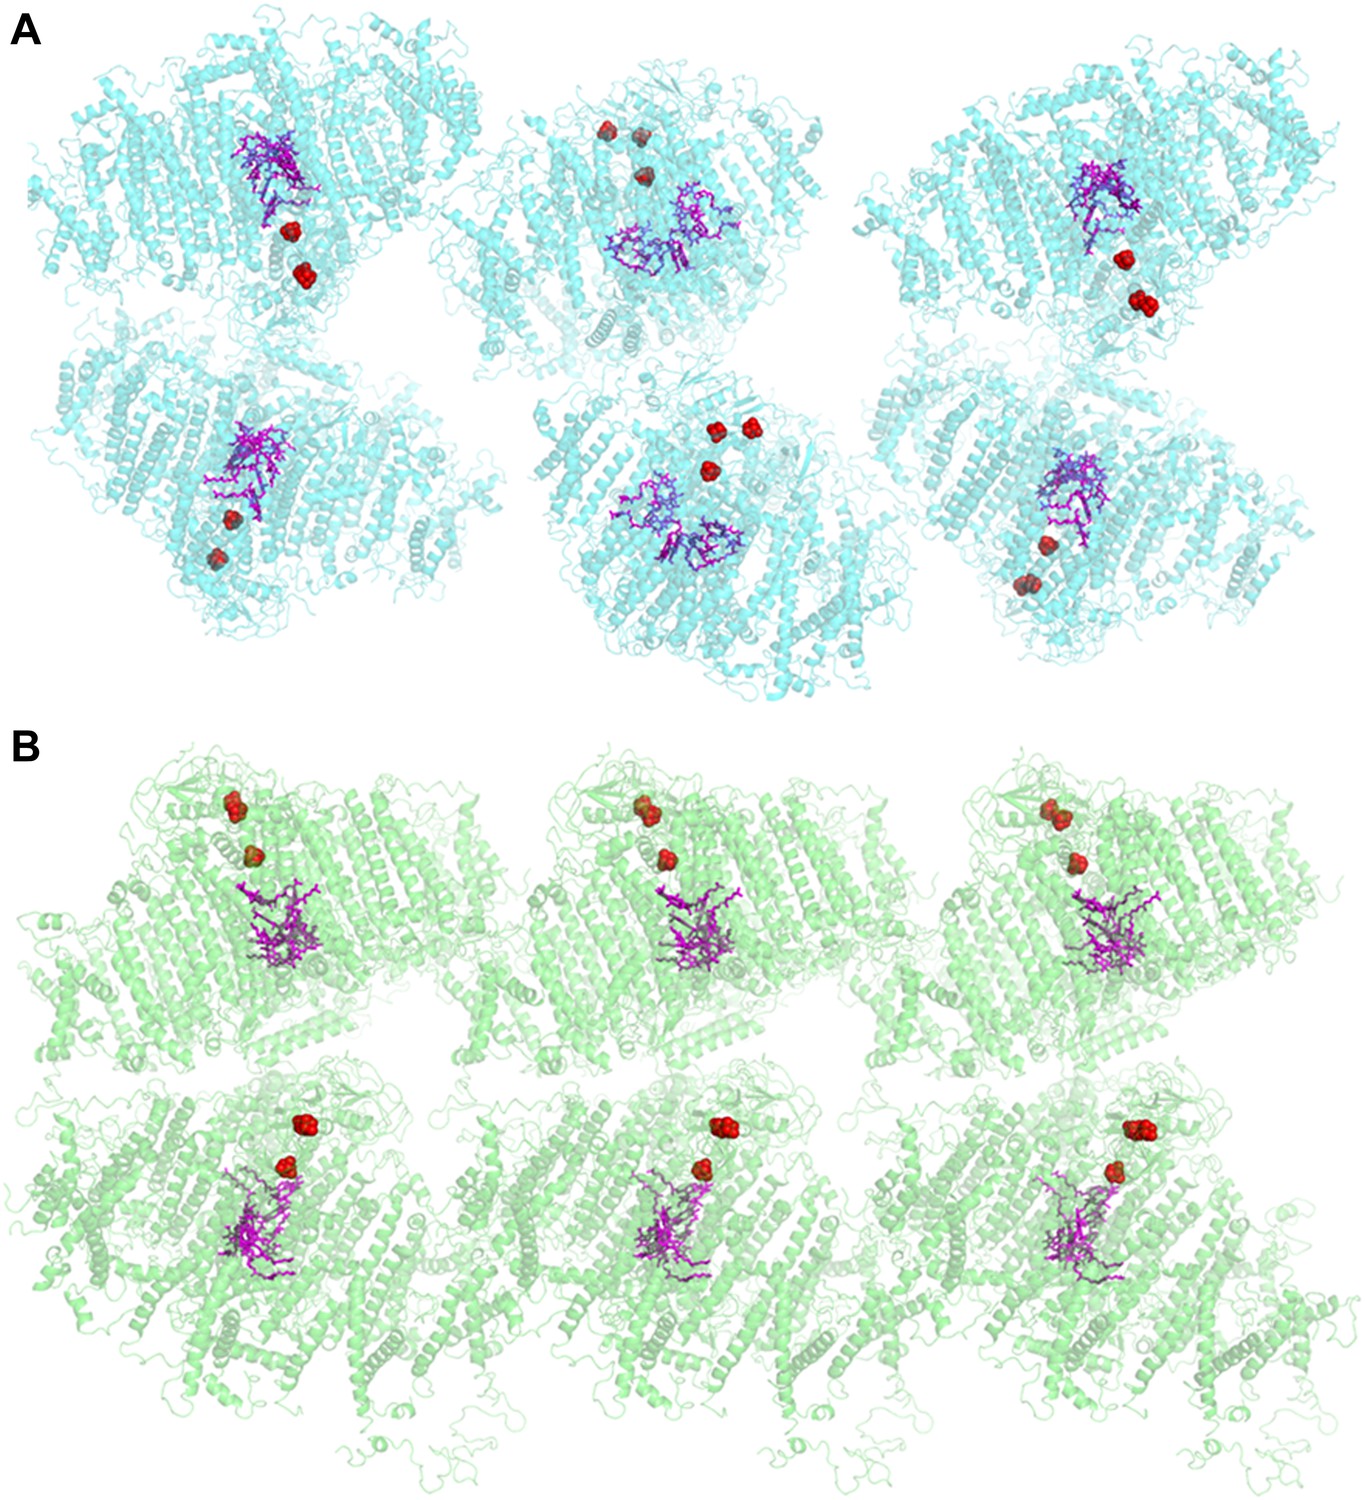
Comparison of two PSI-LHCI crystal lattices.
(A) The previous PSI-LHCI crystal in the P21 space group with a layered arrangement of the complex. This arrangement is capable of generating extremely high voltages upon illumination. (B) The new crystal lattice in the P212121 space group. Iron sulfur clusters are colored in red and the pigments of the internal electron transport chain in magenta (chlorophylls) and blue (quinones). PSI-LHCI complexes are arranged in a crissed-crossed manner from left to right.
Figure 2 with 1 supplement
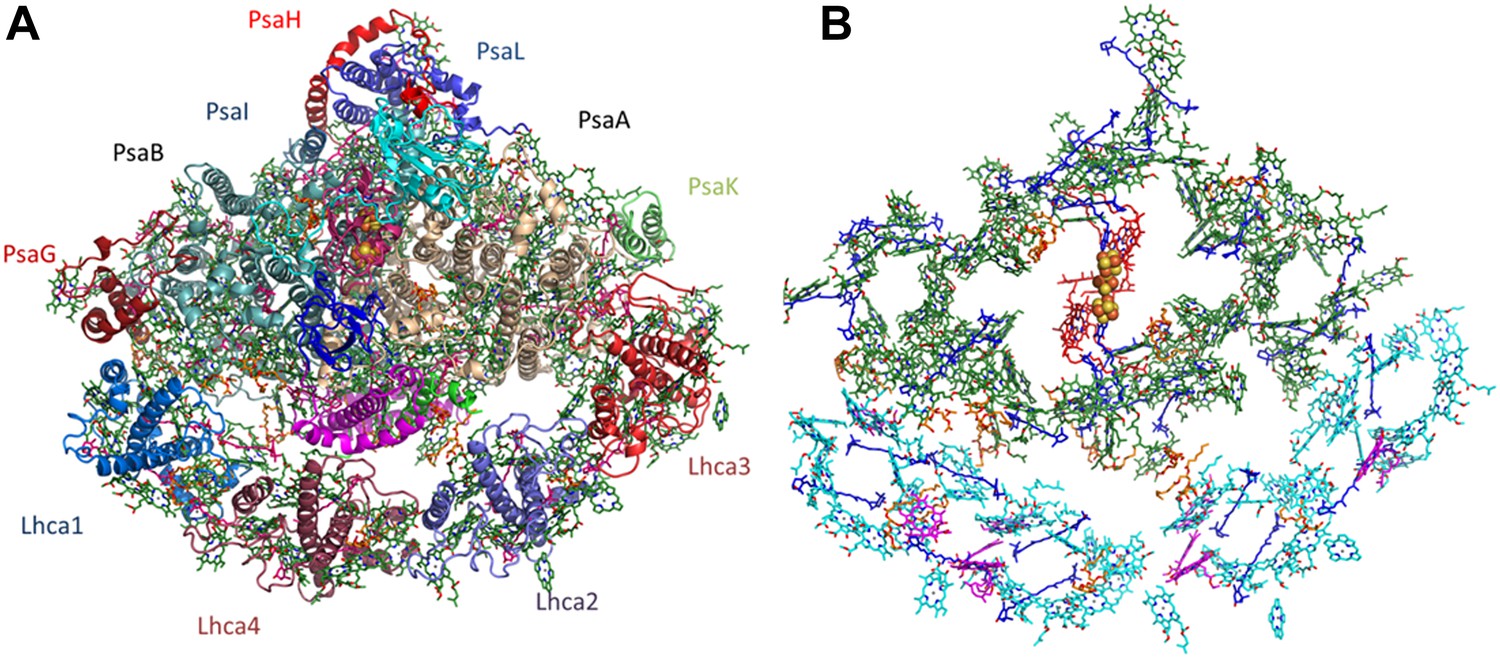
Overall structure and organization of the plant PSI-LHCI supercomplex.
(A) A view from the stromal side of the membrane of PSI-LHCI with the PsaL subunit pointing up. The PsaF and PsaJ subunits connecting in the middle of LHCI are colored in magenta and green, respectively. The three subunits of the stromal ridge, PsaC, PsaD, and PsaE, can be seen in the middle of the complex, colored cyan, pink, and blue, respectively. The two iron-sulfur clusters of PsaC can be distinguished as yellow and orange clusters in the middle of the complex. (B) Pigment organization in PSI-LHCI. The central pigments of the internal electron transport chain are colored red, chlorophylls of the core antenna green, chlorophyll a in LHCI in cyan, and chlorophyll b in magenta. Carotenoids, which are distributed throughout the complex, are colored in blue and lipids in key connecting points and conserved positions in the core, in orange.
Figure 2—figure supplement 1
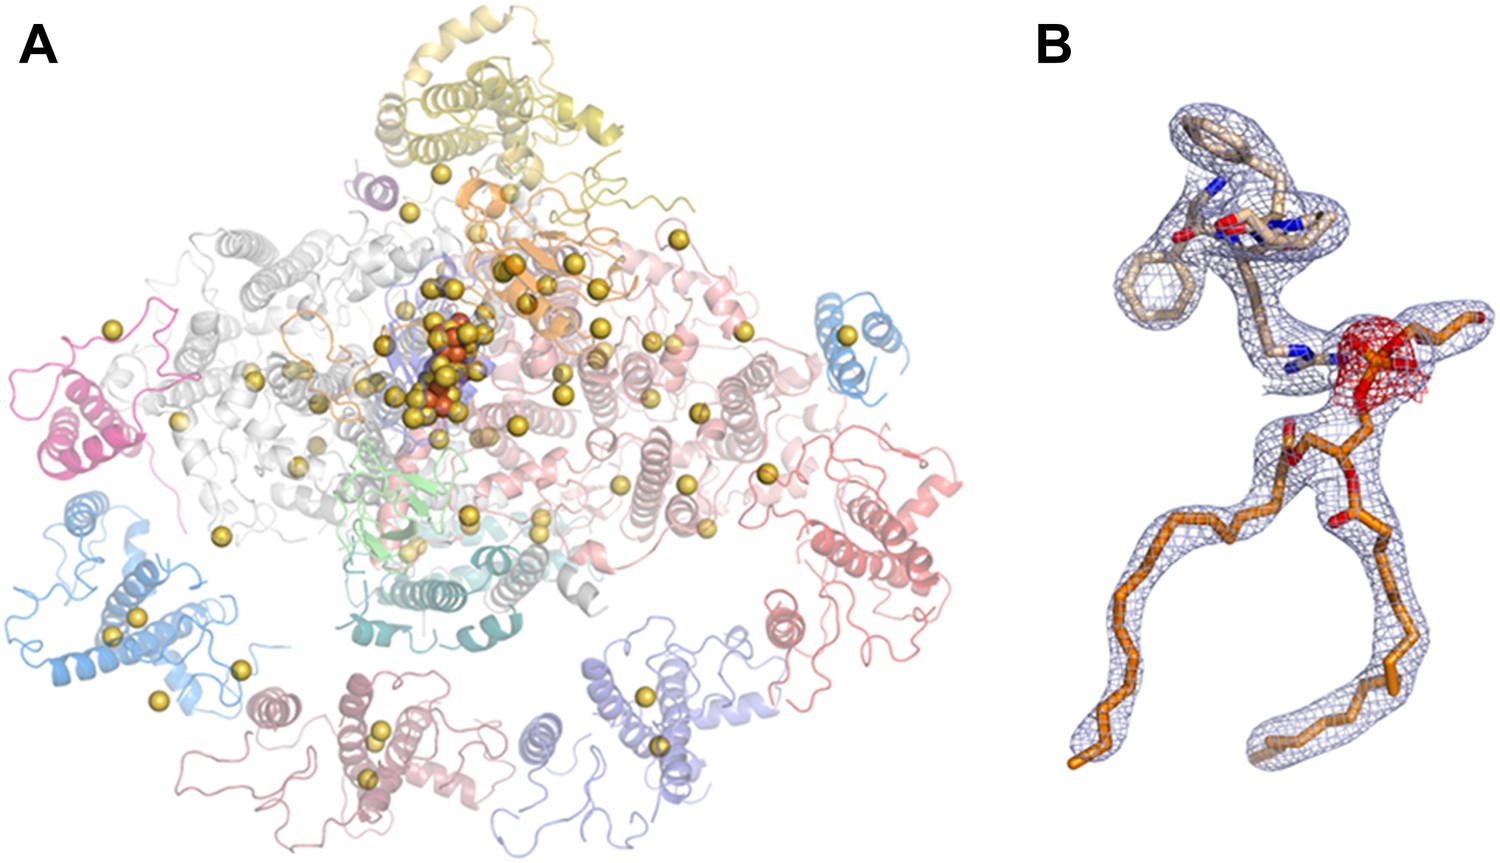
Phasing substructure and electron density maps.
(A) Positions of the native sulfurs, phosphates (both in yellow), and iron atoms (orange) identified in the PSI-LHCI complex based on the measured anomalous signal. (B) Electron density maps. The 2F − Fc map in blue, contoured at 1.3 rmsd, and an anomalous difference map in red, contoured at 2 rmsd around the phosphate atom of lipid 7001 bound by PsaA. Residues 577:580 from PsaA are also shown.
Figure 3 with 1 supplement
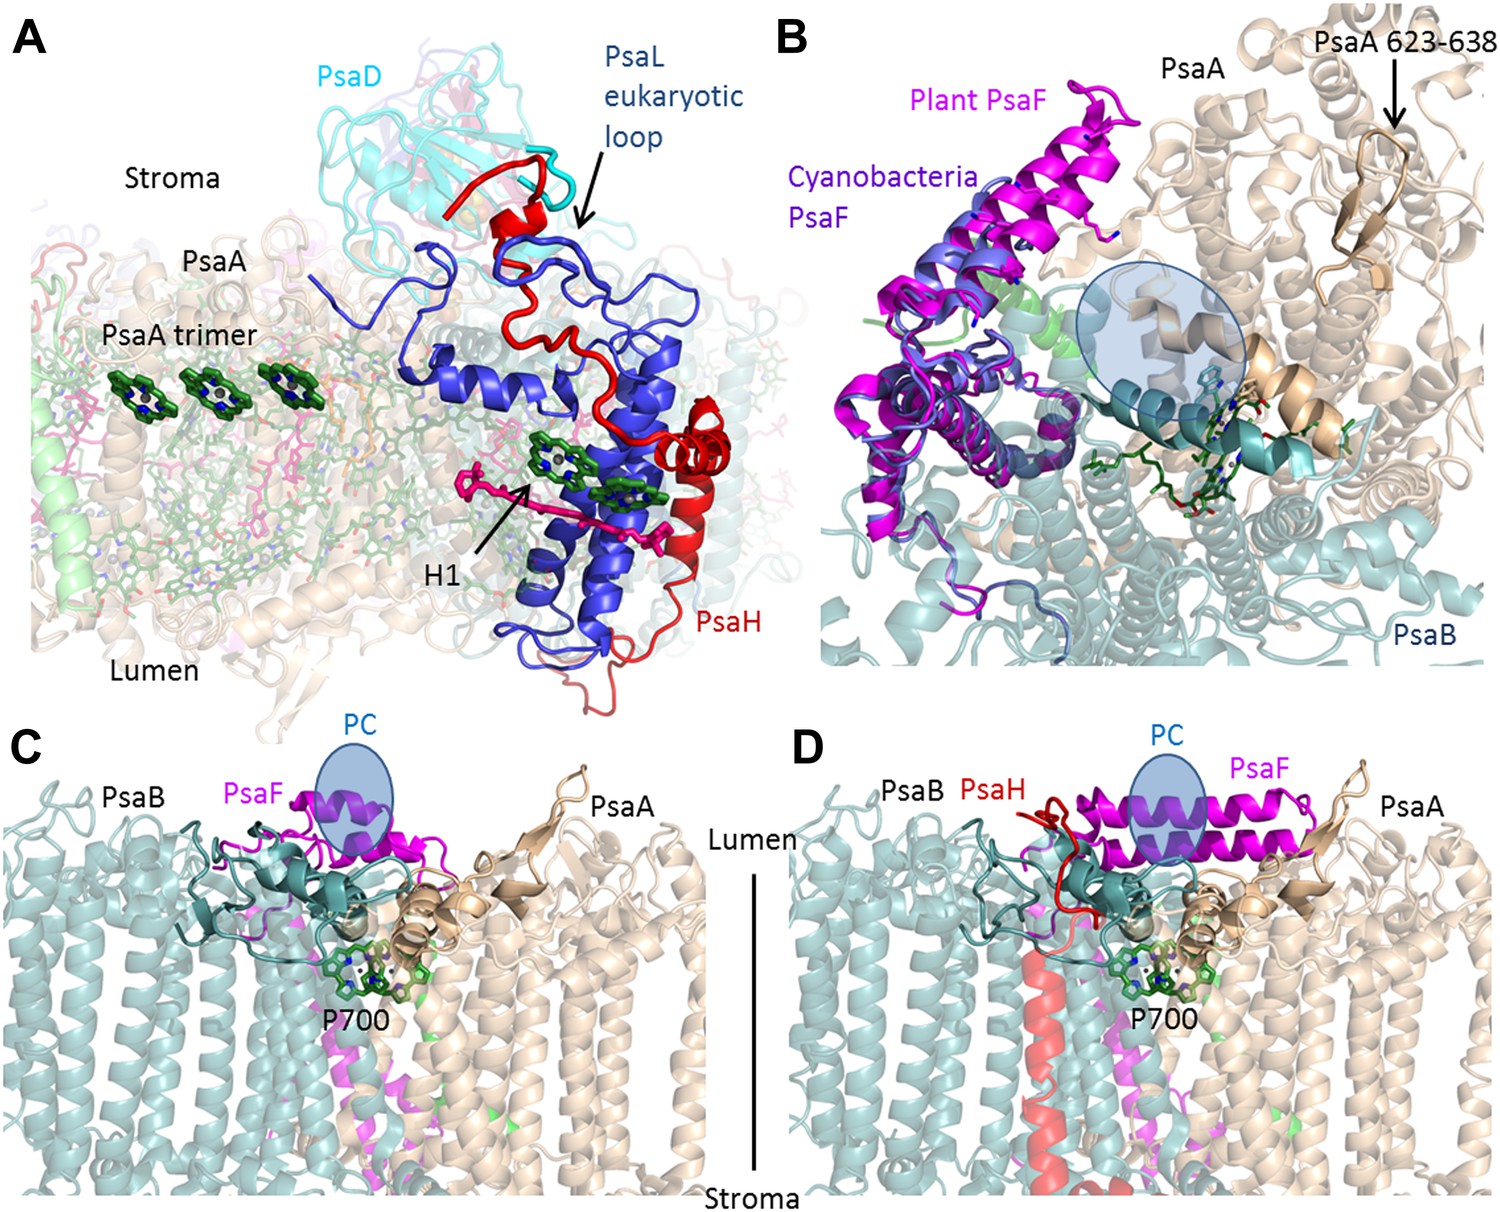
PsaH connects the state II and the PC binding sites.
(A) PsaL is presented in blue, and the path of the PsaH subunit (red) travels through its extended, eukaryotic specific, loop. The new PsaH chlorophyll (green, marked as H1) connects to the PsaL-coordinated chlorophyll and carotenoid (green and pink), as well as an additional chlorophyll trimer (middle left, marked as PsaA trimer), which is proposed to connect PSI to LHCII in state II. (B) A luminal view of the PSI surface at the PC binding site. The two hydrophobic helices are colored in grey (PsaA) and light blue (PsaB). The luminal PsaA loop is highlighted on the background of the entire PsaA subunit. All the ligands (with the exception of P700) are not shown. (C and D) Side by side view of the cyanobacterial (C) and plant (D) PC binding sites showing the extended PsaF helices that limit access from the membrane plane and the N terminus of PsaH (red), which parallels the configuration of the PsaA luminal loop. The approximate location of PC is indicated in blue.
Figure 3—figure supplement 1
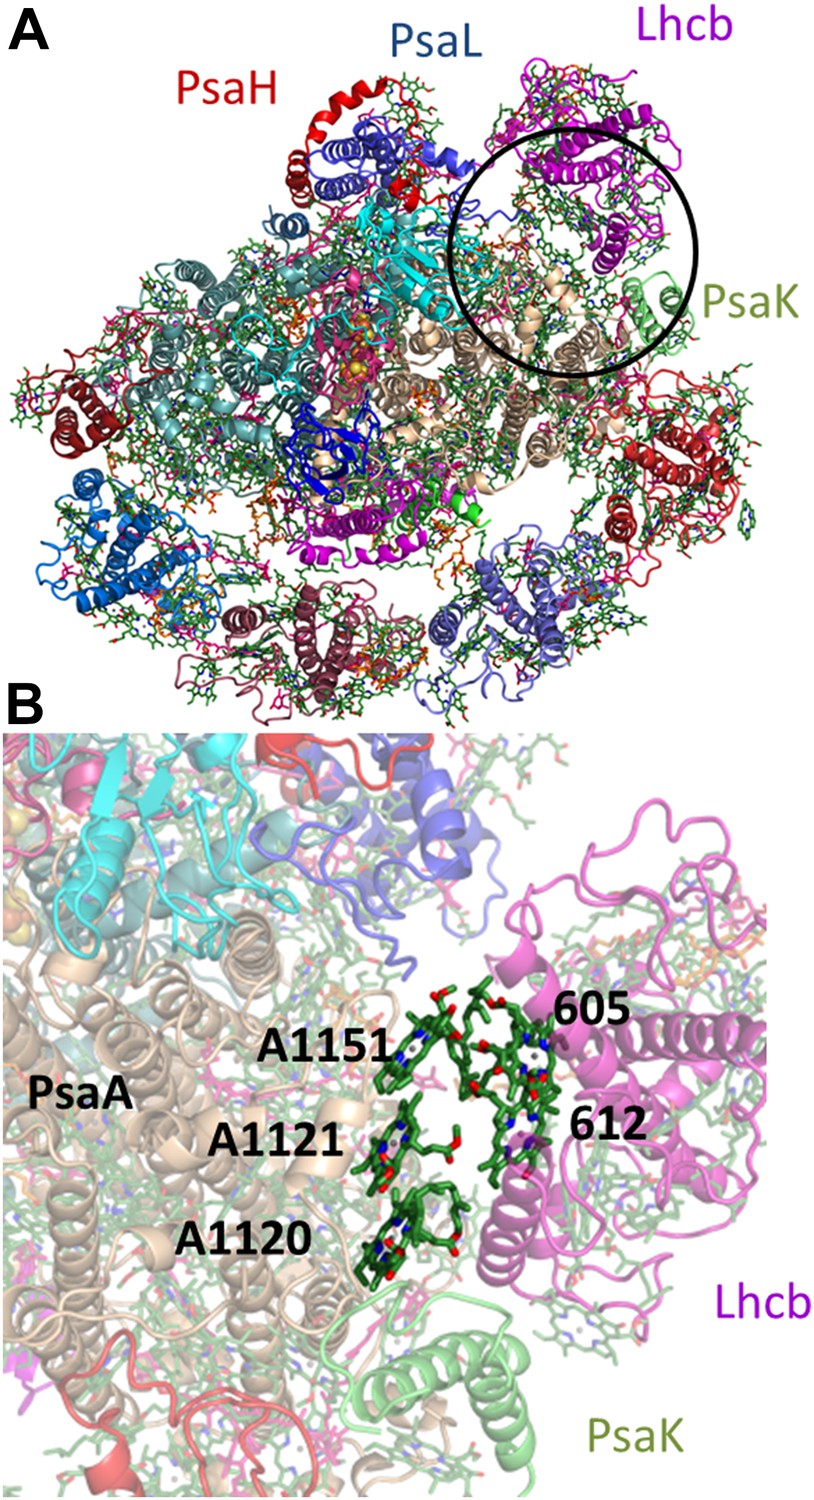
The proposed configuration of the state II super complex.
(A) monomeric LHCII is shown in magenta near the PsaL subunit, juxtaposed to PsaK. The region blown up in B is circled black. (B) This arrangement brings sites 5 and 12 from Lhcb next to the PsaA-coordinated chlorophyll trimer.
Figure 4 with 2 supplements
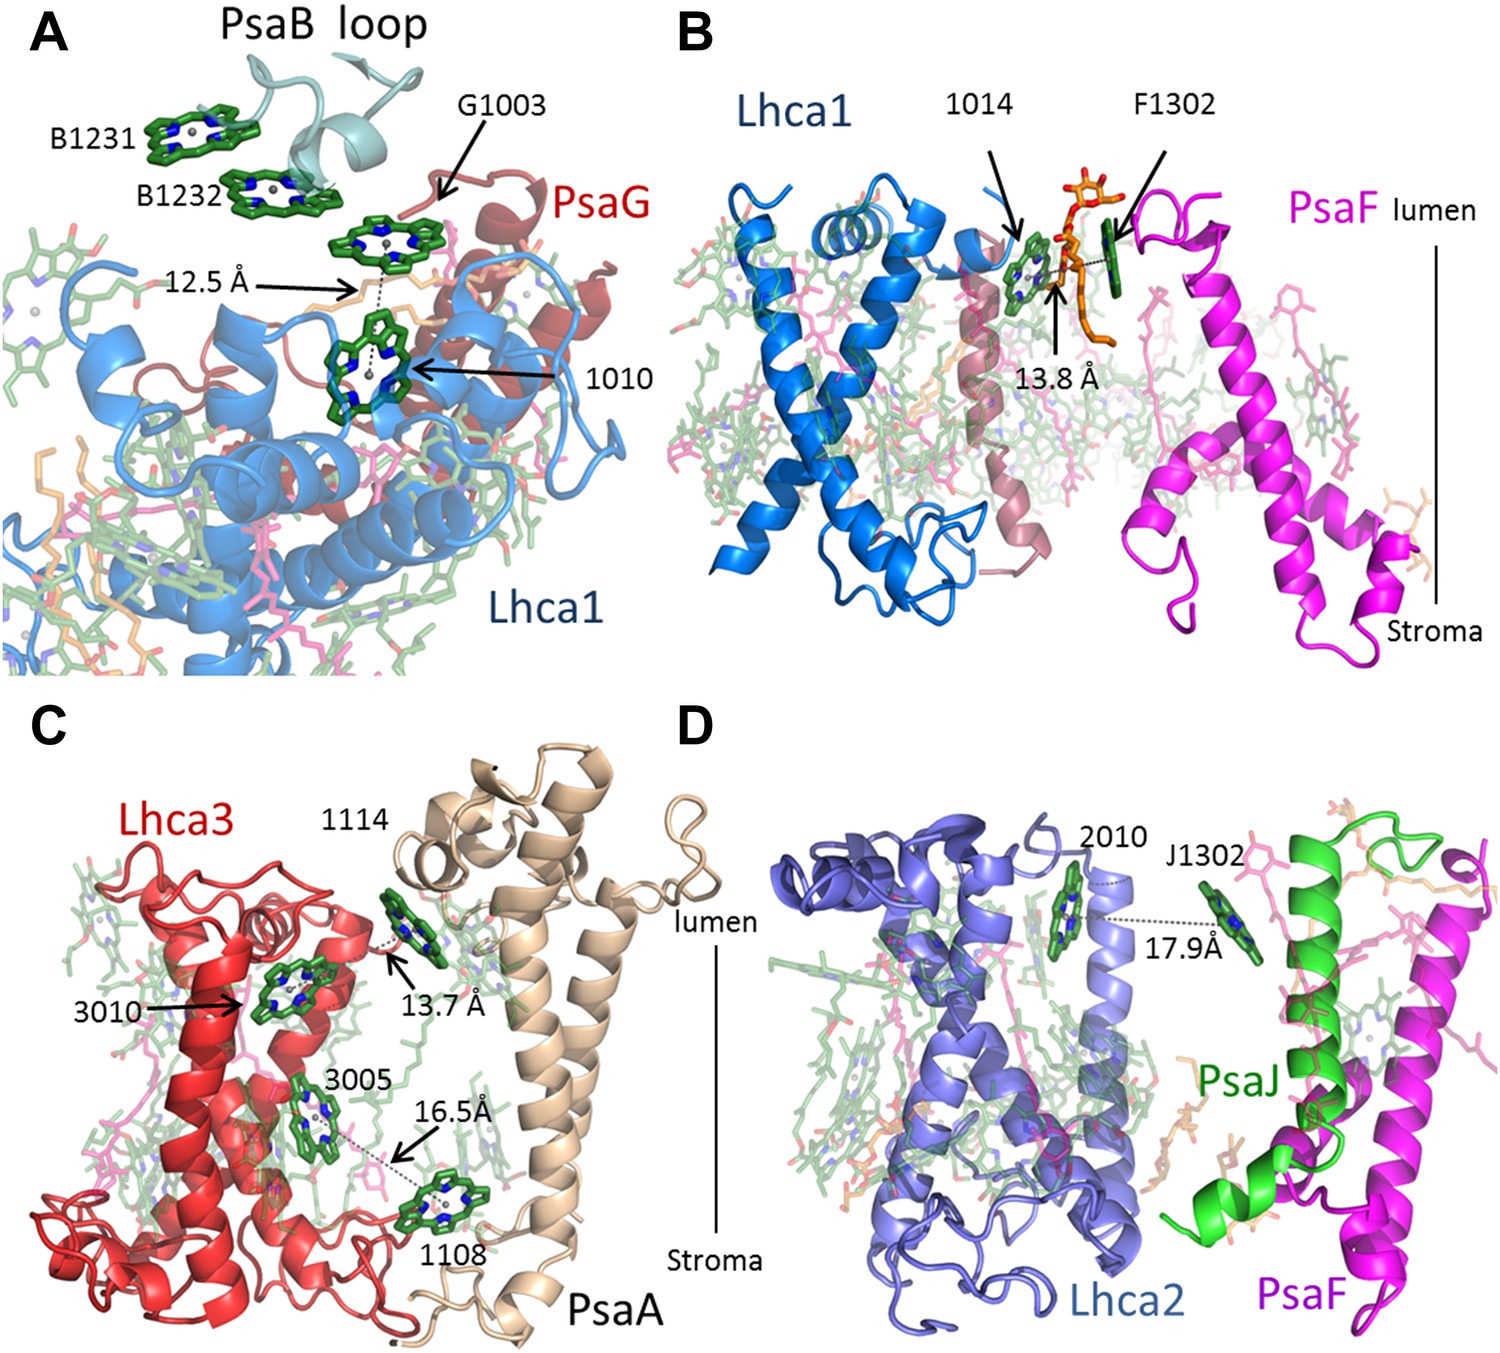
Antenna connections in PSI-LHCI.
(A) The configuration of the PsaG-Lhca1 pigment connection shown from the luminal side of the membrane. The new stacked chlorophyll trimer (numbered B1231, B1232 and G1003) is shown. The N-terminus of PsaG (dark red) supports one of the chlorophylls making up this trimer. The entire trimer is connected with chlorophyll 10 (numbered 1010) in Lhca1 (blue). (B) The second LHCI-PSI connection between Lhca1 and PsaF (magenta) on the luminal side of the membrane is bound by a lipid (orange). (C) The Lhca3 (red) -PsaA connection. Two chlorophyll pairs mediate this interaction. At the lumen face, 13.7 Å separate chlorophyll 3010 from chlorophyll 1114. On the stromal side, chlorophyll 3005 and chlorophyll 1108 are 16.5 Å apart. (D) Lhca2 (blue)—PsaJ (green) connecting chlorophylls.
Figure 4—figure supplement 1
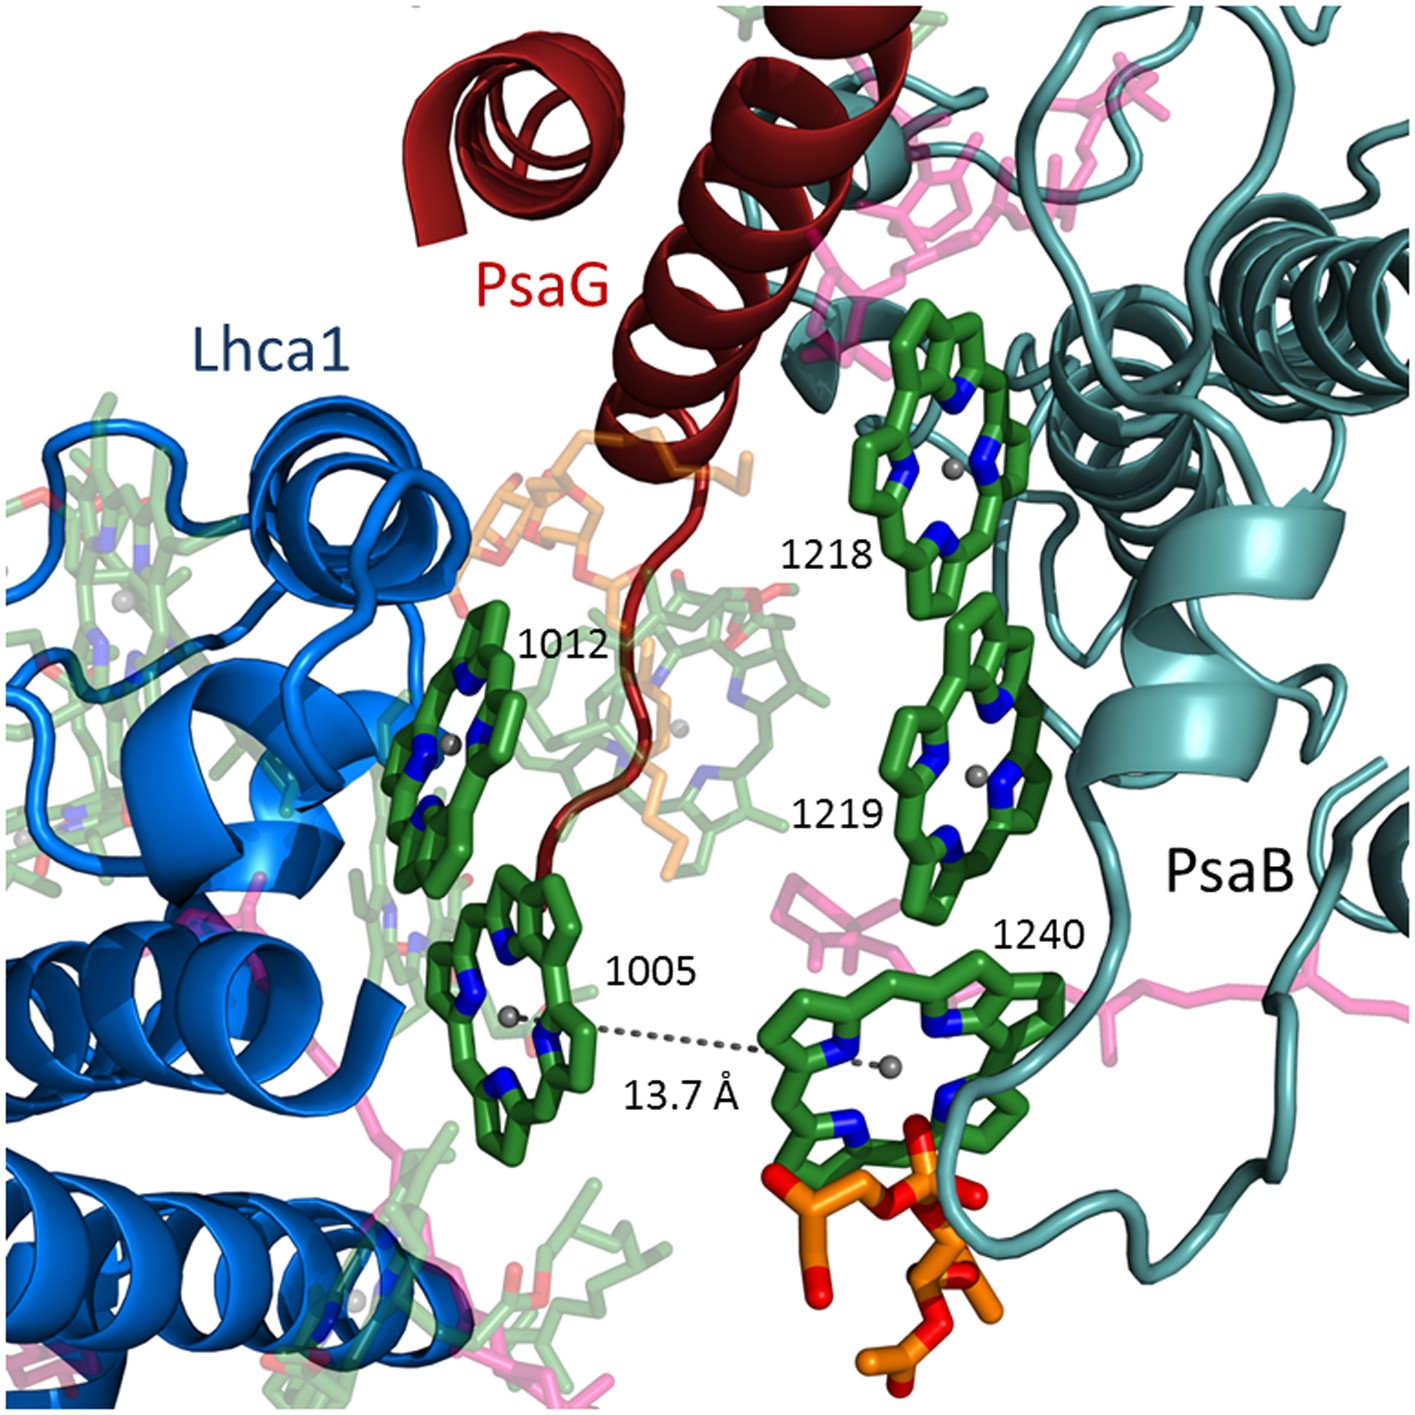
LhcA1 connects to PSI through chlorophyll trimers.
The second chlorophyll trimer connecting Lhca1 to the core on the stromal side of the membrane bound by a short PsaB helix (teal).
Figure 4—figure supplement 2
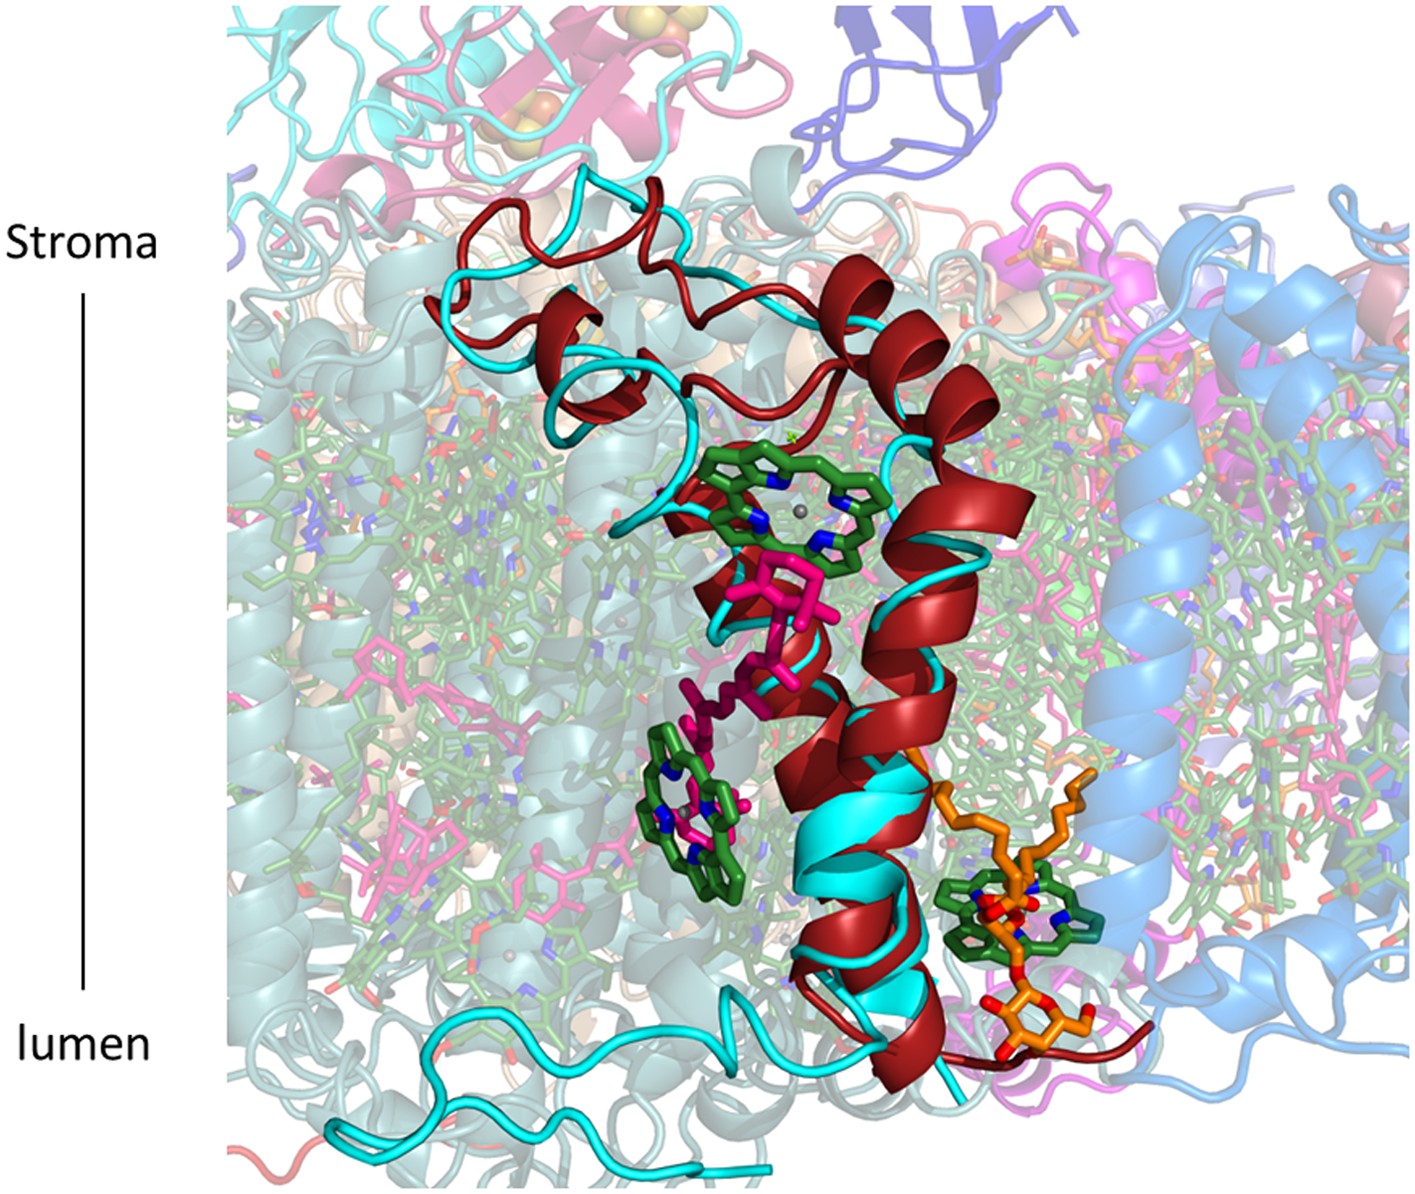
PsaG occupy roughly an equivalent position compared to previous PSI-LHCI structures (PsaG from 2WSC in cyan, PsaG from the current structure in red).
However the polarity of the transmembrane helices is reversed, as a result the N-terminus which was protruding outward from the complex now faces LHCI. Three chlorophylls, a carotene and a lipid are coordinated by this subunit in the current structure.
Figure 5 with 1 supplement

Lhcas connect to the PSI core through conserved structural elements.
(A) A view from the stromal side of the membrane of LHCI. Each Lhca connects to the next one through its conserved N-terminal domain (marked N). All connections to the core are mediated by the short region preceding the entrance of the first transmembrane helix into the membrane (marked by a circle). The extended loop (L23) is conserved in all Lhcas except Lhca1. (B) Electrostatic interactions determine the specificity of the Lhca4/5 binding site to PsaF. The conserved E84-R209 interaction occurs within the PsaF (magenta) domain, which is partially membrane-buried, and Lhca4 (raspberry). (C) Superposition of Lhca3 (red) and LHCII (cyan). Lhca3 interacts with the core via contacts with PsaA and PsaK through short extension (red circle) or deletion (green circle) in the otherwise highly conserved N terminus. The extension of loop 23 is also seen at the bottom left corner of the image.
Figure 5—figure supplement 1
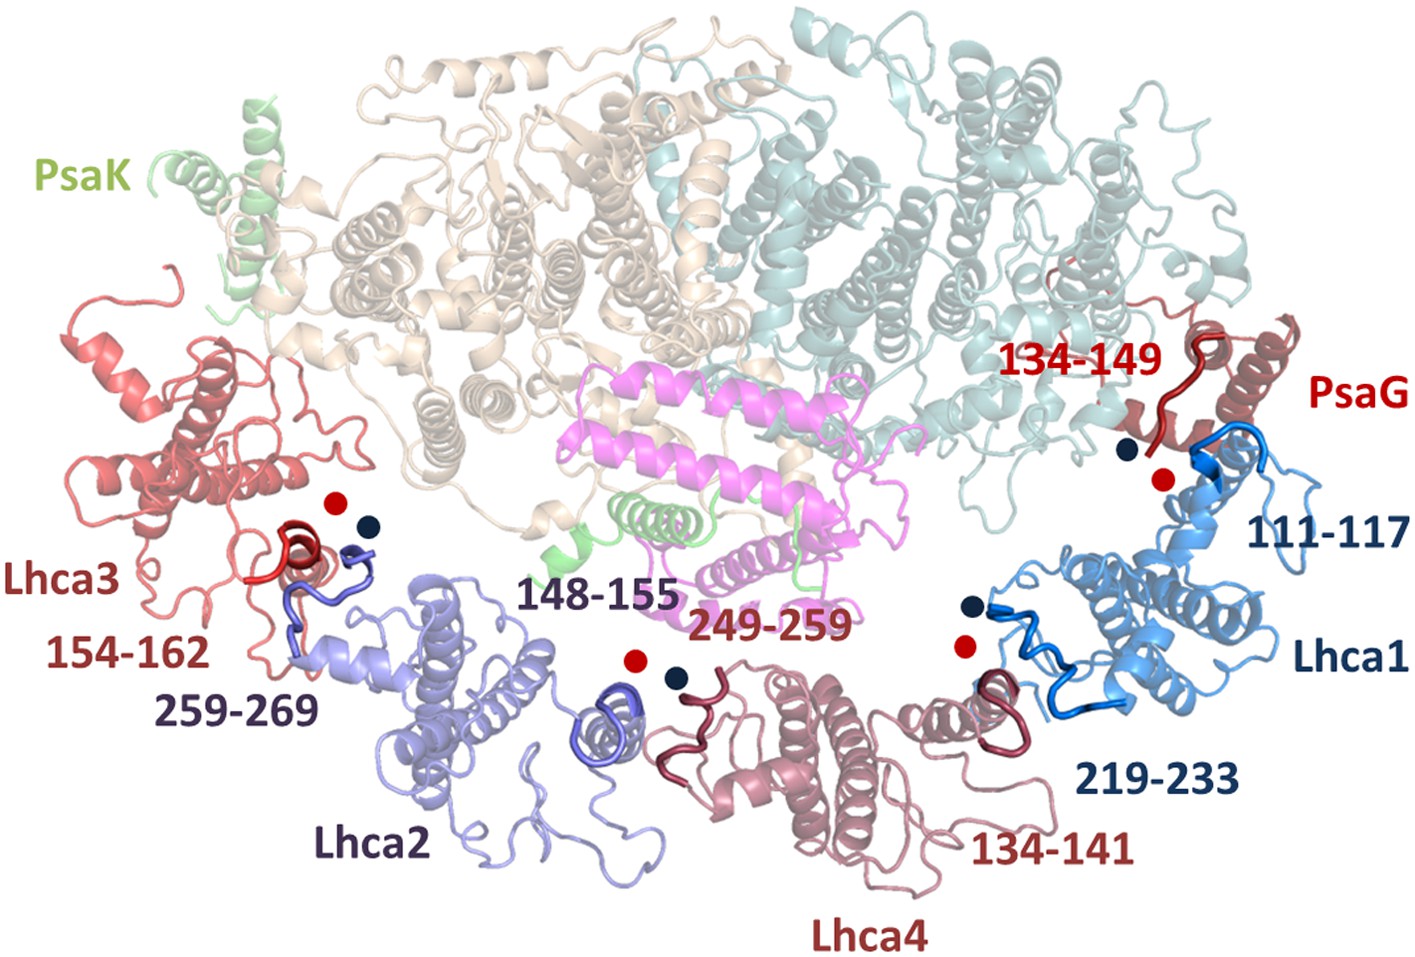
Luminal side connections between the core PSI and LHCI.
Short sequences immediately preceding the insertion point of the second transmembrane helix in the LHC fold (marked by a red spot) interact with the C-terminal sequences of the adjacent subunit (marked with a blue spot). Numbers indicate the sequence range shown in bold for the respective Lhca subunit.
Figure 6 with 1 supplement

The interface within the Lhca heterodimers provides a mechanism for NPQ.
(A and B) Structure of the Lhca1/4 (A) and Lhca2/3 (B) heterodimer as viewed from the membrane plane extrinsic to the PSI-LHCI complex. The conserved connecting carotenoid in position L3 (pink) serves a structural role, connecting the two subunits of the dimer by linking chlorophyll 6 (bottom right) to chlorophyll 9 (upper left corner). The position of the new chlorophyll site bound by loop 23 of Lhca2 (numbered 2016) is also shown. (C and D) A new chlorophyll site connects the pigments of the heterodimer. Chlorophyll 17 (numbered 4017 or 3017) is shown as viewed from the luminal side of the membrane. The connections between the red pigment cluster on the right and position 9 in the adjacent subunit are marked with grey lines. The new carotenoid site, L5, is shown in C. This site lines the gap between LHCI and PSI and is therefore easily interchangeable. The distance between L5 and of chlorophylls 17 π systems is 3.7 Å. (E) Lhca3 is colored in red. A short helix segment from the first transmembrane helix is shown as sticks. Chlorophyll 3005 is part of the red-absorbing dimer. LHCII (PDB: 2BHW) was superimposed on the structure and shown in faint grey. Chlorophyll 612 is shown as a ring. The coordinating side chain was changed from histidine 68 in LHCII to asparagine 109 in Lhca3. Another important change is the leucine to glycine modification at position 105, which allows chlorophyll 3005 to alter its ring orientation by approximately 12°. (F) The same site in Lhca4 shown in a similar fashion with Lhca4 colored in raspberry. The same basic coordination is observed, though the ring tilt is smaller because of the alanine occupying position 95.
Figure 6—figure supplement 1
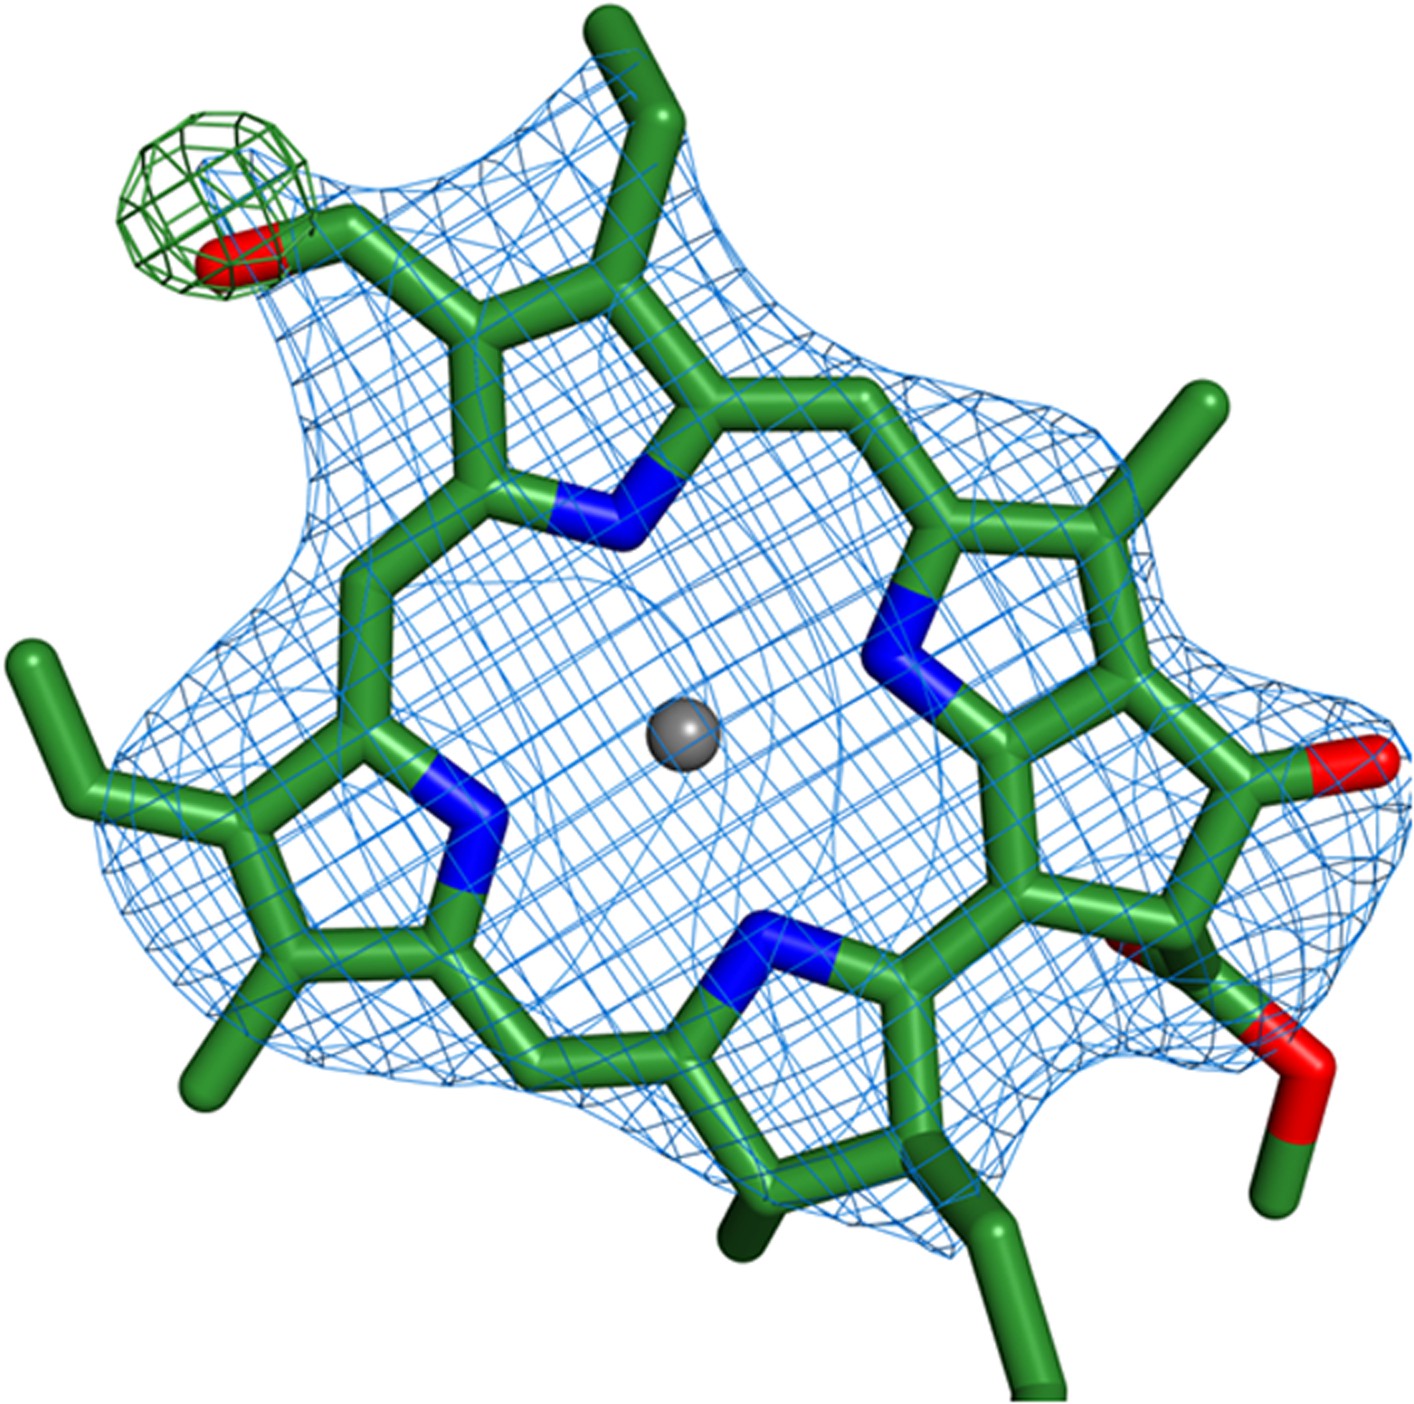
Identification of chlorophyll b molecules.
Shown is the chlorophyll b occupying position 10 from Lhca2. Simulated annealing omit maps were calculated on a model which lacked the formyl-7 group (shown in the image). All b factors of the model were reset to the Wilson B factor, followed by a single round of simulated annealing and refinement using phenix.refine. The difference map (green) is contoured at 2.5 rmsd and the 2Fo − Fc map (blue) is contoured at 1.2 rmsd.
Figure 7
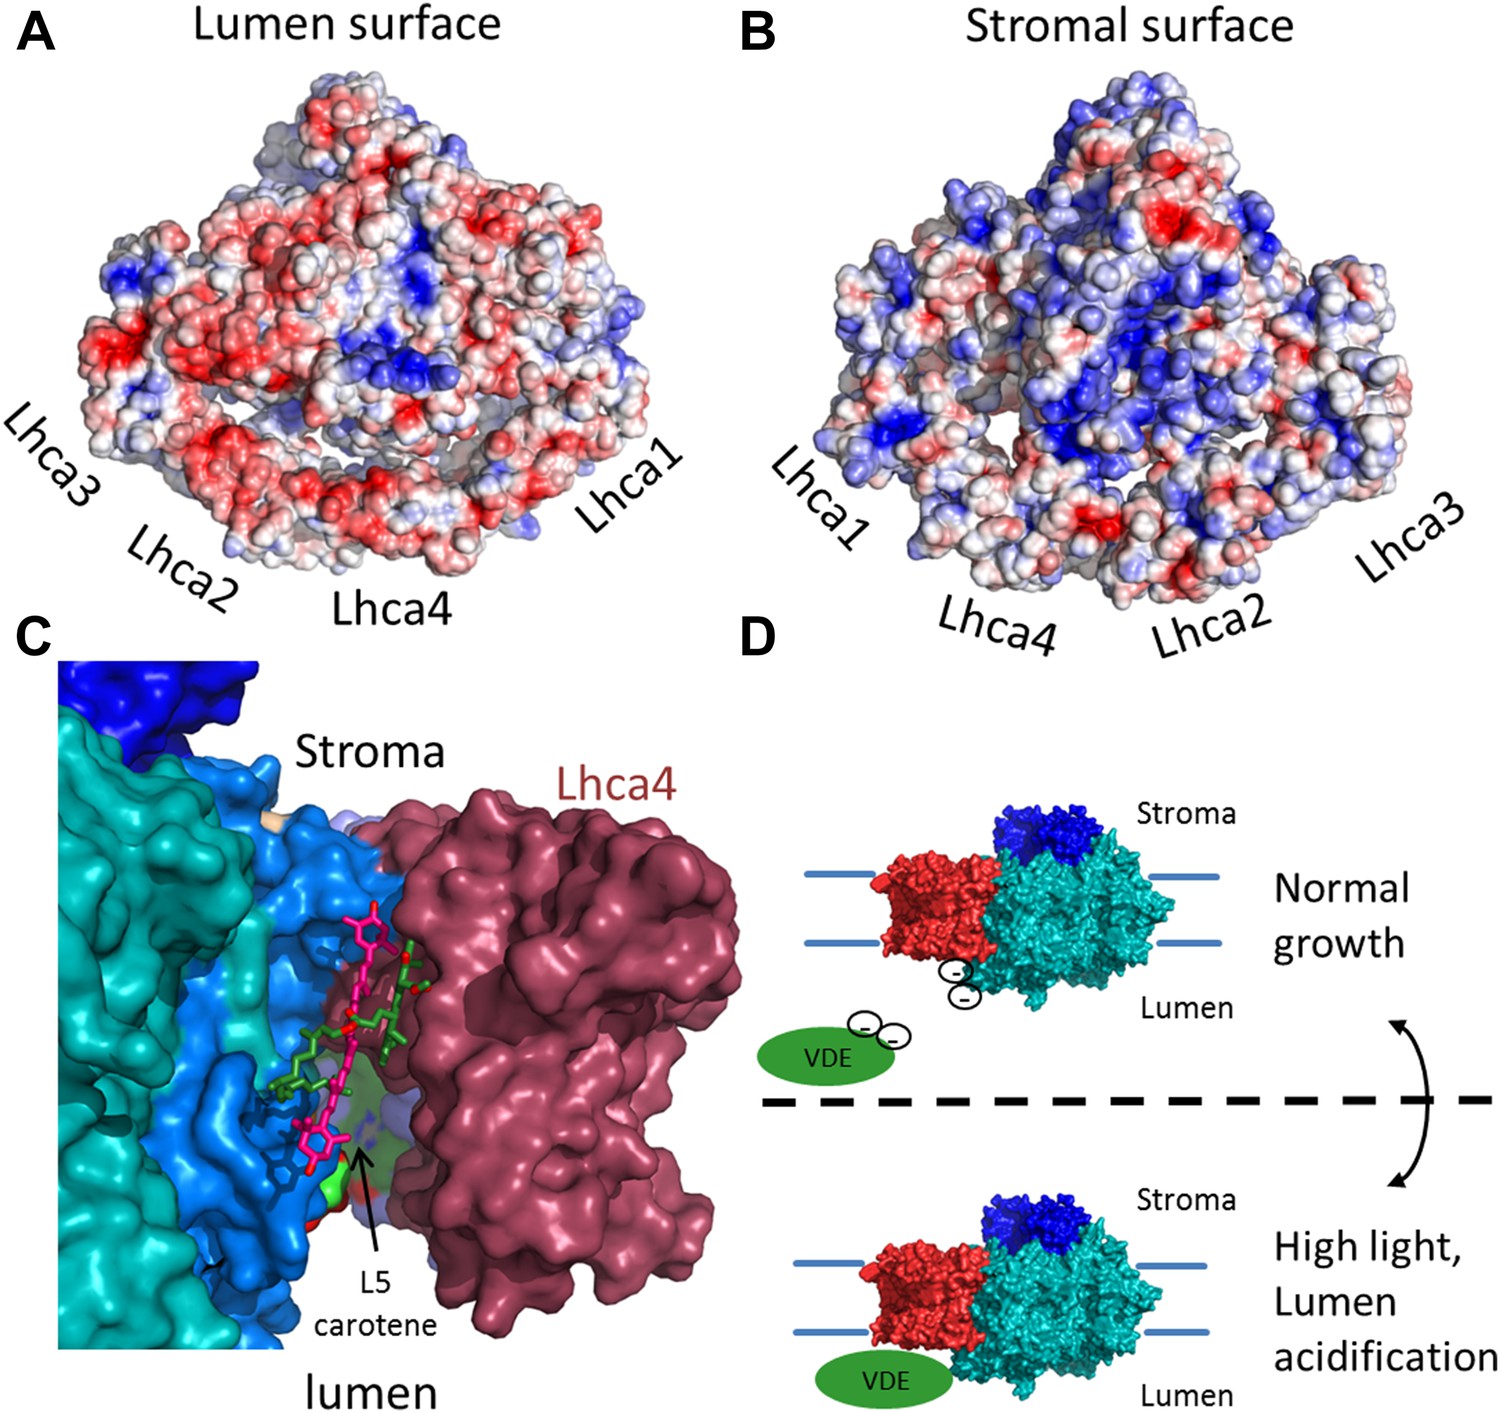
The surface electrostatic potential of PSI-LHCI.
(A) Luminal view of the electrostatic potential (red for negative and blue for positive charges) generated from PSI-LHCI apoproteins. The gap region is shown as an open cavity (the ligands occupying this cavity were omitted from the calculation) lined with negative patches. The plastocyanin binding site can be distinguished as a blue patch generated by the positively charged luminal double helix domain of PsaF. (B) The stromal electrostatic surface of PSI-LHCI showing the putative ferredoxin binding site as a basic patch on the left side of the stromal ridge. (C) A side view of the stromal gap shows the large opening facing the lumen. Lhca1 and PsaG are omitted to reveal the internal cavity. This surface was drown around all ligands identified in the gap with only chlorophyll 4017 and carotene 4505 omitted. (D) We propose that the negative patches lining the gap play a role in preventing the accessibility of VDE to gap pigments during regular growth. While at high light conditions, lumen acidification partially neutralizes these negative charges, allowing VDE activity on gap xanthophylls.
Tables
Table 1
Data collection and refinement statistics
| Data collection | |||
|---|---|---|---|
| Beamline | BESSY PX14.1 | SLS PXI−X06SA | ESRF ID 23-2 |
| Wavelength (Å) | 1.73 | 1.74 | 0.873 |
| Resolution (Å) | 40−2.8 (2.85–2.8) | 40−2.8 (2.85−2.8) | 50−3 (3.1−3) |
| Space group | P212121 | P212121 | P21 |
| Unit cell dimensions | |||
|---|---|---|---|
| a, b, c (Å) | 188.7, 200.8, 212.4 | 188.6, 201.3, 212.7 | 120.6, 189.2, 129.7 |
| α, β, γ | 90, 90, 90 | 90, 90, 90 | 90, 91.1, 90 |
| Measured reflections | 7,831,302 | 14,841,310 | 724,010 |
| Unique reflections | 198,911 | 200,218 | 116,039 |
| Rpim (%) | 0.051 (1.276) | 0.030 (0.180) | 0.099 (0.812) |
| <I/σ(I)> | 10.5 (1.2) | 13.4 (1.4) | 5.8 (1.3) |
| Completeness (%) | 99.9 (98.4) | 99.9 (98.4) | 99.9 (99.2) |
| Redundancy | 39.9 (37) | 74.1 (33.4) | 6.2 (5.4) |
| Refinement statistics | |||
|---|---|---|---|
| Resolution (Å) | 40−2.8 | 40−2.8 | 50−3 |
| Rwork/Rfree | 25.6/26.5 | 24/25.2 | 25.8/29.3 |
| No. of chains | 16 | 16 | 17 |
| No. of ligands | 214 | 214 | 197 |
| Average B-factor (Å2) | 98.7 | 112 | 96.6 |
| R.M.S deviations | |||
|---|---|---|---|
| Bond angles | 1.9 | 2 | 2.4 |
| Bond lengths | 0.004 | 0.005 | 0.011 |
| Ramachandran statistics | |||
|---|---|---|---|
| Favoured region % | 90.2 | 90.2 | 86.6 |
| Allowed region % | 7.1 | 7.1 | 8.7 |
| Outlier region % | 2.7 | 2.7 | 4.7 |
-
Data collection, scaling and merging statistics were calculated using XDS, AIMLESS and PHENIX XTRIAGE. Refinement statistics are from PHENIX.
Table 2
Amino acid changes between PSI-LHCI structures
| Subunit | Number of amino acids | Modeled amino acids | Number of changes | |
|---|---|---|---|---|
| 4Y28 | 2WSC | |||
| PsaA | 758 | 741 | 729 | 1 |
| PsaB | 734 | 732 | 732 | 1 |
| PsaC | 81 | 80 | 81 | 1 |
| PsaD* | 156 | 140 | 135 | 5 |
| PsaE* | 92 | 68 | 65 | 9 |
| PsaF* | 154 | 150 | 154 | 18 |
| PsaG* | 98 | 95 | 95 | 15 |
| PsaH* | 95 | 84 | 69 | 11 |
| PsaJ* | 42 | 41 | 42 | 5 |
| PsaK* | 134 | 79 | 85 | 10 |
| PsaL* | 168 | 160 | 161 | 21 |
| Lhca1* | 204 | 193 | 165 | 12 |
| Lhca2 | 256 | 206 | 176 | 3 |
| Lhca3 | 242 | 210 | 162 | 16 |
| Lhca4 | 252 | 197 | 166 | 3 |
-
The number of modeled amino acids in each subunit is shown and compared to the most recent PSI-LHCI structure (2WSC). Insertions, deletions and extensions are counted as a single change. Since the genome sequence of Pisum Sativum is not completely known (genes with no DNA data are marked with an *) we relied on high-throughput mRNA sequence data for verification (Franssen et al., 2011).
Download links
A two-part list of links to download the article, or parts of the article, in various formats.
Downloads (link to download the article as PDF)
Open citations (links to open the citations from this article in various online reference manager services)
Cite this article (links to download the citations from this article in formats compatible with various reference manager tools)
The structure of plant photosystem I super-complex at 2.8 Å resolution
eLife 4:e07433.
https://doi.org/10.7554/eLife.07433


