Reduced matrix rigidity promotes neonatal cardiomyocyte dedifferentiation, proliferation and clonal expansion
- Weizmann Institute of Science, Israel
Figures
Figure 1 with 1 supplement

Compliant substrates alter neonatal cardiomyocyte cell shape and sarcomeric organization, and promote their proliferation.
(A) Representative images of the sarcomeric patterns of MHC (top), myomesin (middle), and cTnT (bottom) on rigid 2 MPa (left) and soft 5 kPa (right) substrates. Scale bar: 20 µm. (B) An overview of neonatal P1 rat CMs on rigid (left) and soft substrates (right). Scale bar: 50 µm. (C) Axial ratio of P1 rat CMs (D) Cell area of P1 rat CMs (n = 1,108, for C, D). (E, F) Representative immunofluorescence images of proliferating P1 rat CMs on various PDMS substrates. Scale bar: 20 µm. CMs were stained for (E) sarcomeric cTnT and proliferation marker Ki67, or (F) cardiac MHC and PH3 (PH3+/MHC+ are denoted with arrows). (G) Quantification of Ki67+/cTnT+ P1 rat CMs on different rigidities (n = 4,165). (H) Quantification of PH3+/MHC+ P1 rat CMs on different rigidities (n = 1,964) (I) Representative images of neonatal P1 mouse CMs on 2 MPa, 20 kPa, and 5 kPa substrates. (J) Quantification of Ki67+/cTnT+ P1 mouse CMs on different rigidities (n = 11,876). Statistical significance was determined using ANOVA followed by post-hoc Tukey's (HSD) test. Results are marked with one asterisk (*) if p < 0.05, two (**) if p < 0.01, and three (***) if p < 0.001.
Figure 1—figure supplement 1
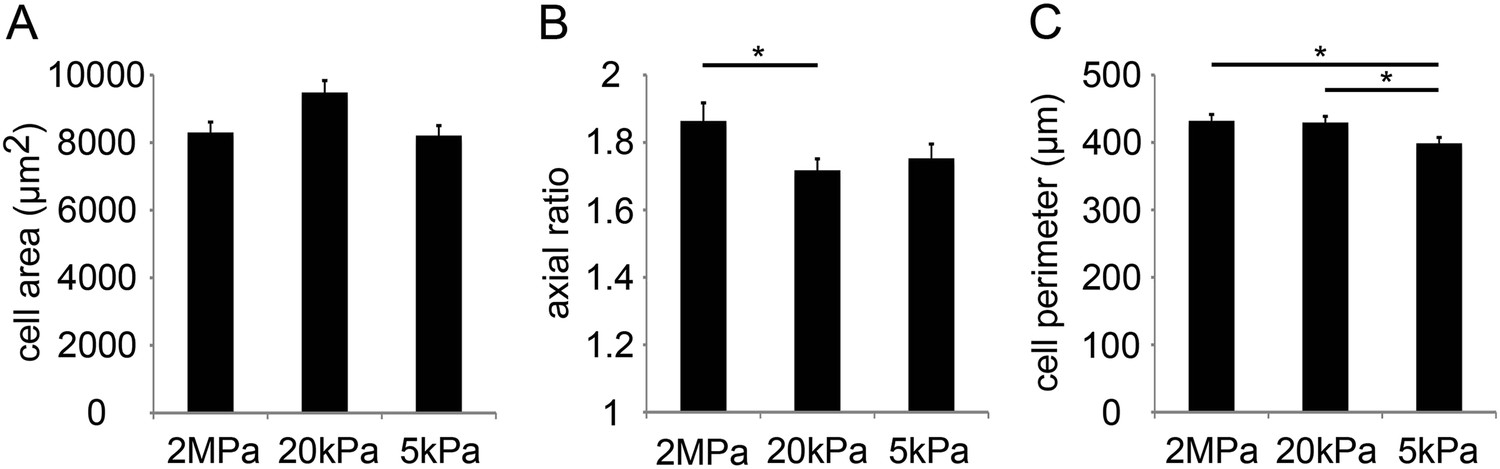
Compliant substrates alter P1 mouse cardiomyocyte cell shape, polarity, and sarcomeric organization.
(A) Cell area of P1 mouse CMs cultured on rigid and compliant substrates (n = 1,118). (B) Axial ratio of CMs on the different substrates (n = 1,115). (C) Cell perimeters of CMs (n = 1,131). Statistical significance was determined using ANOVA, followed by post-hoc Tukey's (HSD) test. Results are marked with one asterisk (*) for p < 0.05.
Figure 2 with 1 supplement
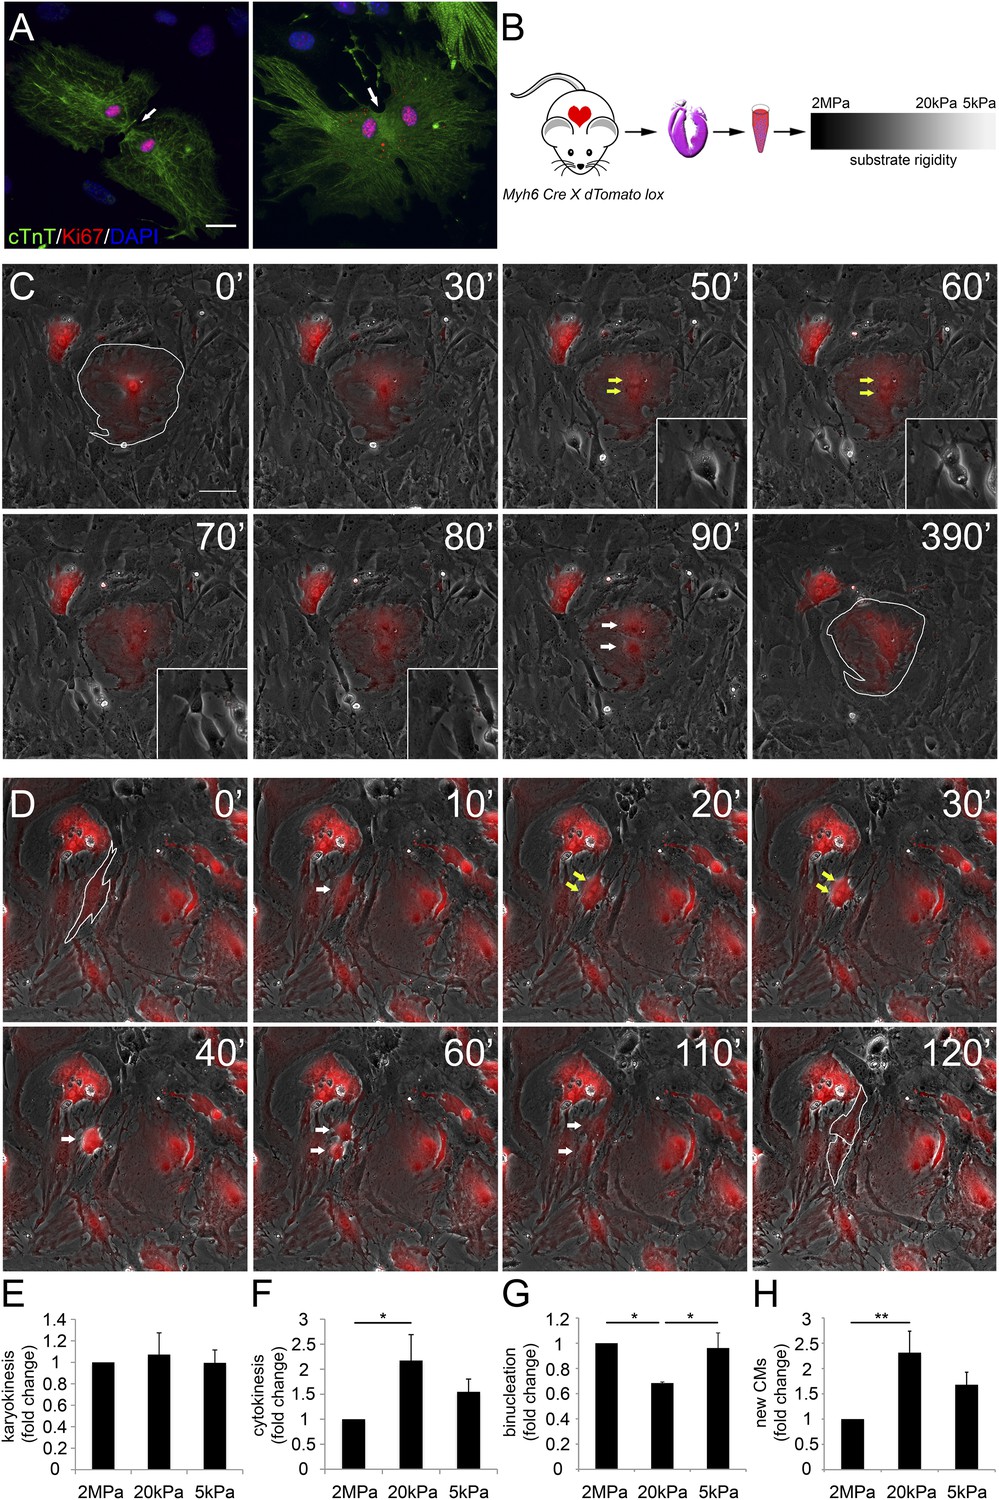
Distinct rigidity-dependent cardiomyocyte division mechanisms.
(A) Immunofluorescent images of dividing neonatal CMs in culture. The newly formed CMs are still connected, and both nuclei are Ki67+ (red). (B) A schematic drawing of the experimental design. (C) Video frames of a P1 Myh6-Cre;R26R-dTomato-lox CM undergoing karyokinesis followed by binucleation, without changing its morphology. (Inset) A fibroblast undergoing typical cell division. (D) Video frames of a P1 Myh6-Cre;R26R-dTomato-lox CM undergoing karyokinesis, followed by complete cytokinesis. The original CM is highlighted in 0′. The two new CMs are highlighted in 120′. Yellow arrows mark karyokinesis (20′, 30′); white arrows mark the new nuclei (40′), or new CM (60′,110′). (E) P1 mouse CM karyokinesis on different rigidities. (F) P1 mouse CM cytokinesis on different rigidities. (G) P1 mouse CM binucleation on different rigidities (n = 2,167 for E, F, G). (H) Quantification of new CMs on different rigidities (n = 2,878). Statistical significance was determined using ANOVA followed by post-hoc Tukey's (HSD) test. Results are marked with one asterisk (*) if p < 0.05, and two (**) if p < 0.01.
Figure 2—figure supplement 1
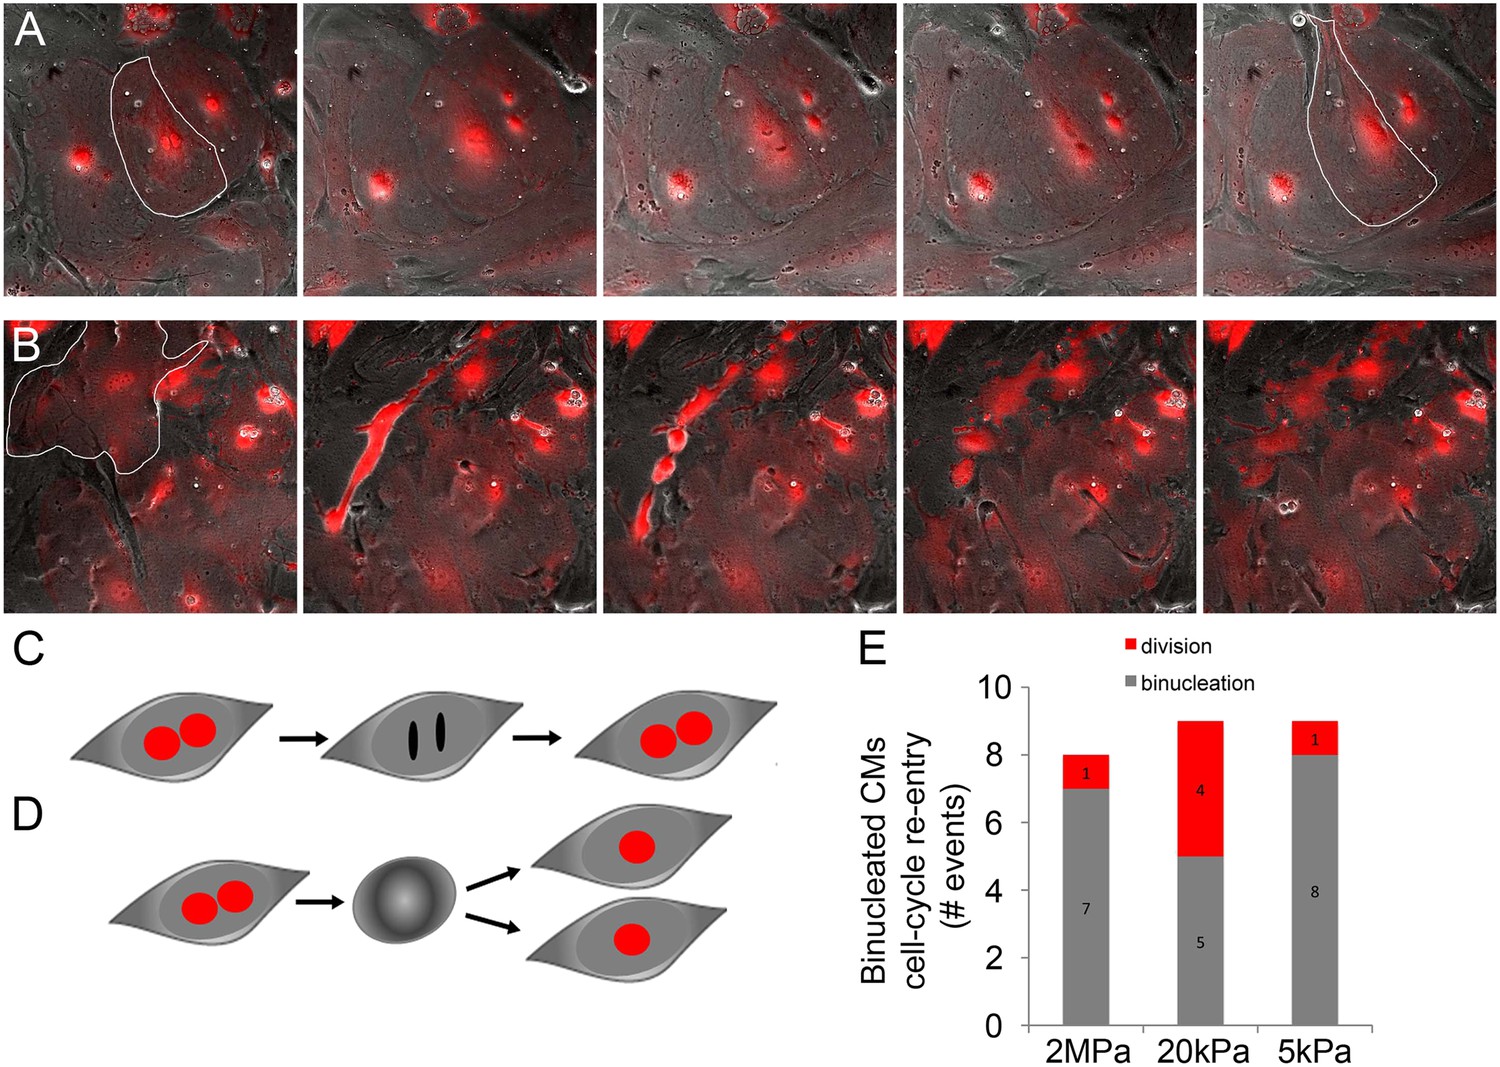
Binucleated cardiomyocytes re-enter the cell cycle.
(A) A binucleated P1 Myh6-Cre;R26R-dTomato-lox CM (highlighted) re-enters the cell cycle, but fails to divide, and remains binucleated. (B) A binucleated P1 Myh6-Cre;R26R-dTomato-lox CM (highlighted) re-enters the cell cycle, changes its morphology, and divides, forming new CMs. (C) A schematic drawing of binucleated CM cell cycle re-entry; however, the CM remains binucleated. (D) A schematic drawing of a binucleated CM re-entering the cell cycle, undergoing rounding, and completing cytokinesis, to form new CMs. (E) Binucleated CMs cell-cycle re-entry events occurring on matrices of varying rigidities.
Figure 3 with 1 supplement
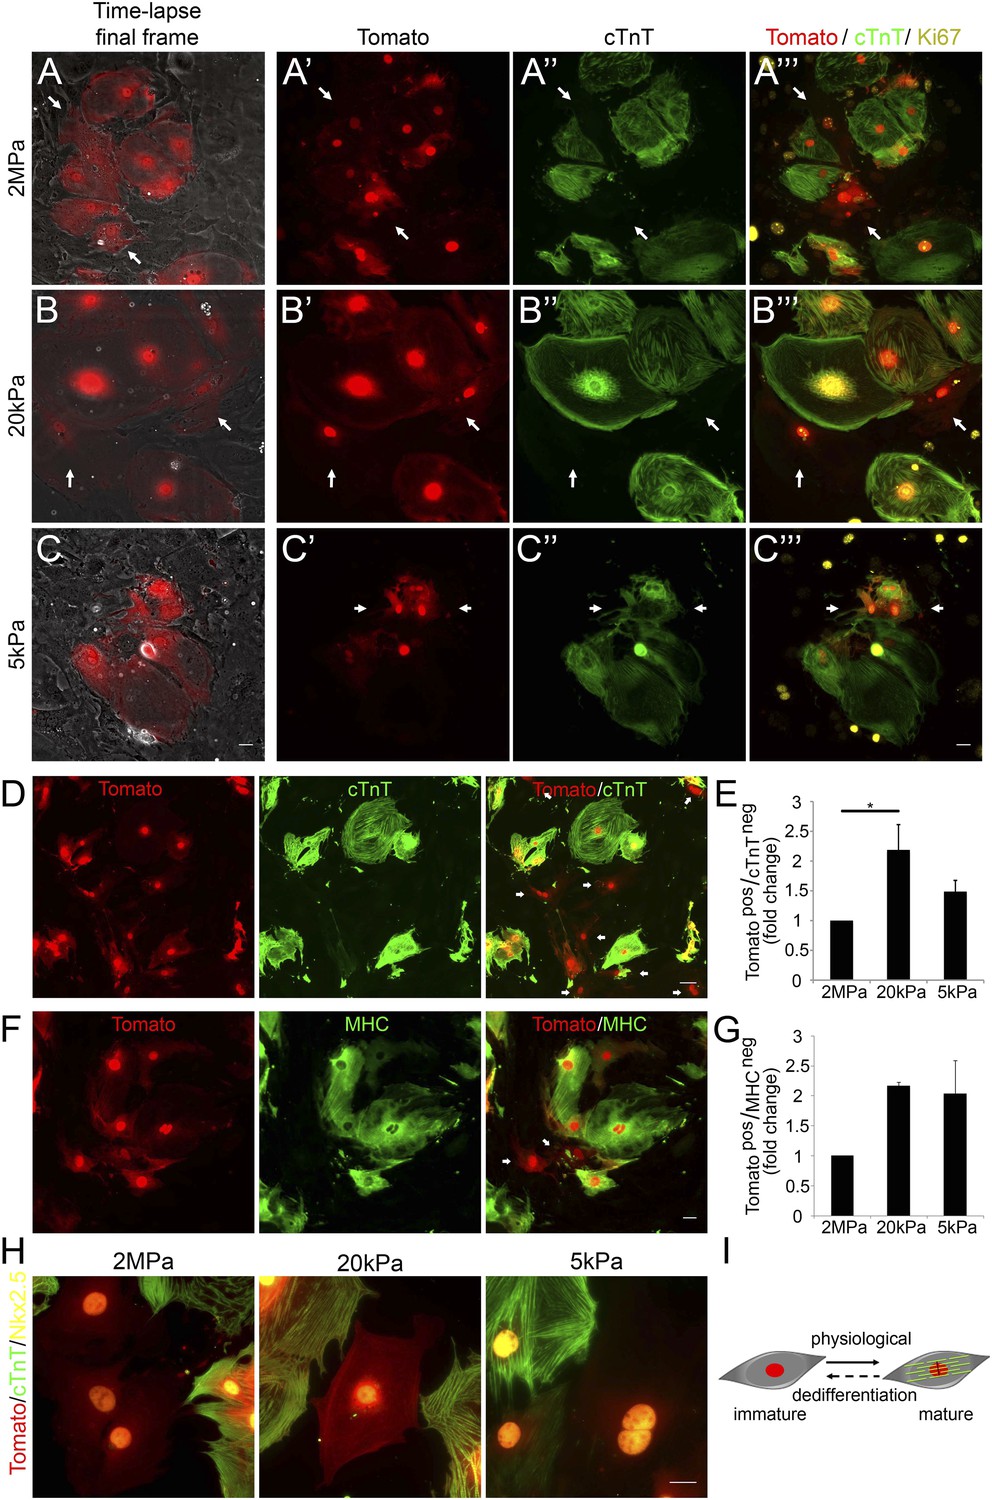
Compliant matrices induce cardiomyocyte dedifferentiation.
(A–C) Correlative live-cell-immunofluorescence of CM dedifferentiation on (A) 2 MPa, (B) 20 kPa, and (C) 5 kPa matrices. Recently divided P1 Myh6-Cre;R26R-dTomato-lox CMs, following time-lapse imaging (A, B, C, left panel, and A′, B′, C′), correlated with the expression of cTnT (A′′, B′′, C′′), and Ki67 (A′′′, B′′′, C′′′). CMs following cell division are denoted with white arrows. (D) An overview of a field of P1 Myh6-Cre;R26R-dTomato-lox CMs (red, left panel), immunostained for cTnT (green, middle panel), and a merge of Tomato+/cTnT− images (right panel). Scale bar: 50 µm. (E) Quantification of Tomato+/cTnT− CMs on 2 MPa, 20 kPa, and 5 kPa (n = 19,869). (F) An overview of a field of P1 Myh6-Cre;R26R-dTomato-lox CMs (red, left panel), immunostained for MHC (green, middle panel), and a merge of the Tomato+/MHC− images (right panel). Scale bar: 20 µm. (G) Quantification of Tomato+/MHC− CMs on 2 MPa, 20 kPa, and 5 kPa substrates. Scale bar: 20 µm (n = 13,474). (H) P1 Myh6-Cre;R26R-dTomato-lox/cTnT− CMs expressing Nkx2.5. (I) Schematic diagram showing CM dedifferentiation from a mature to an immature proliferative state, facilitated by compliant matrices. Statistical significance was determined using ANOVA followed by post-hoc Tukey's (HSD) test. Results are marked with one asterisk (*) if p < 0.05.
Figure 3—figure supplement 1
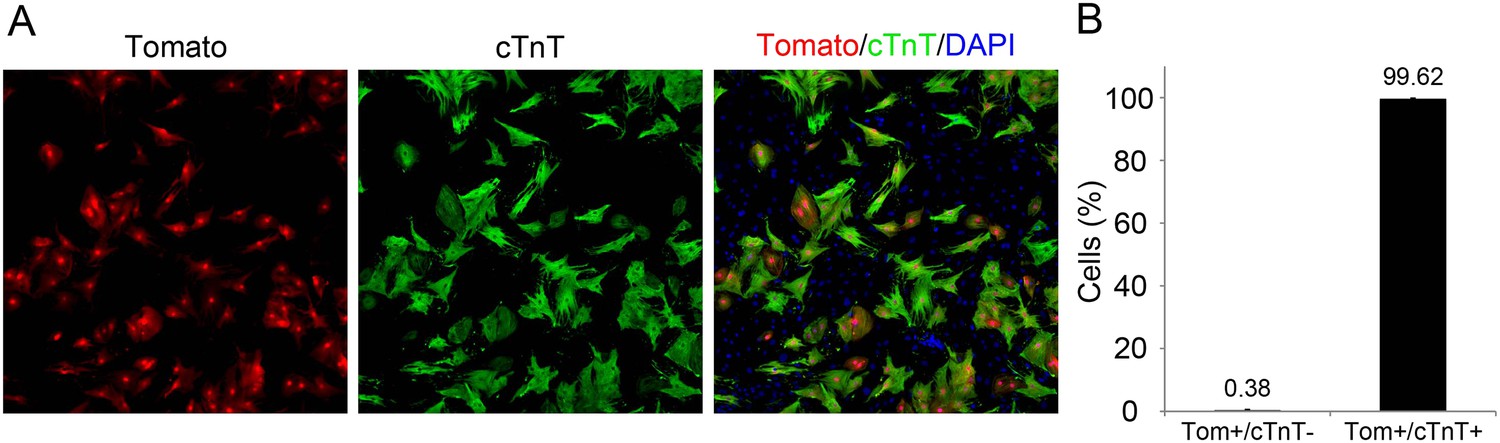
dTomato cardiomyocytes express cTnT.
(A, B) Representative image of P1 Myh6-Cre;R26R-dTomato-lox-derived CMs co-stained with cTnT antibody (A), and their quantification showing less than 1% of Tomato+/cTnT negative CMs (B).
Figure 4
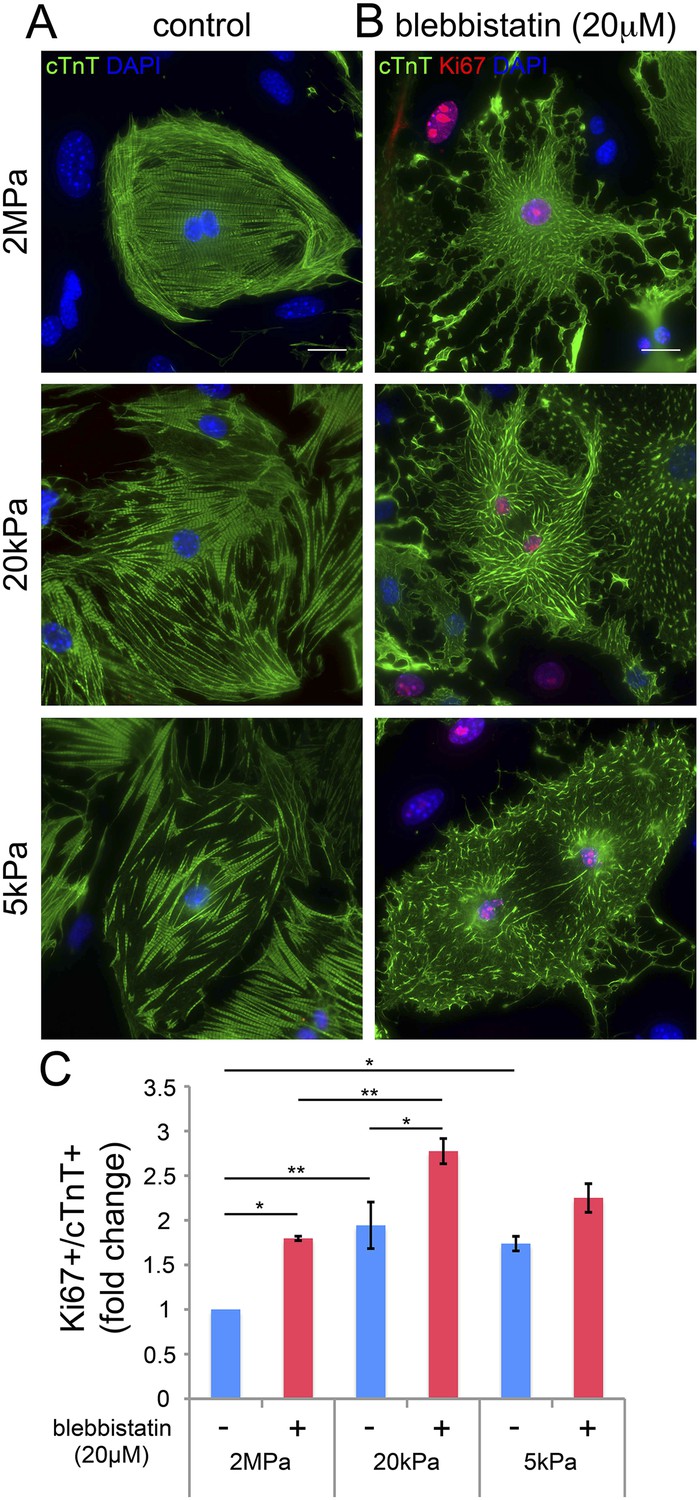
Blebbistatin induces CM proliferation.
(A, B) Representative images of P1 mouse CMs cultured in the absence of blebbistatin (A), or presence of 20 µM blebbistatin (B), on 2 MPa (top), 20 kPa (middle), and 5 kPa (bottom) substrates. Scale bar: 20 µm. (C) Quantification of Ki67+/cTnT+ P1 mouse CMs on different rigidities in the presence or absence of 20 µM blebbistatin (n = 25,554). Statistical significance was determined using ANOVA followed by post-hoc Tukey's (HSD) test. Results are marked with one asterisk (*) if p < 0.05, and two (**) if p < 0.01.
Figure 5 with 2 supplements
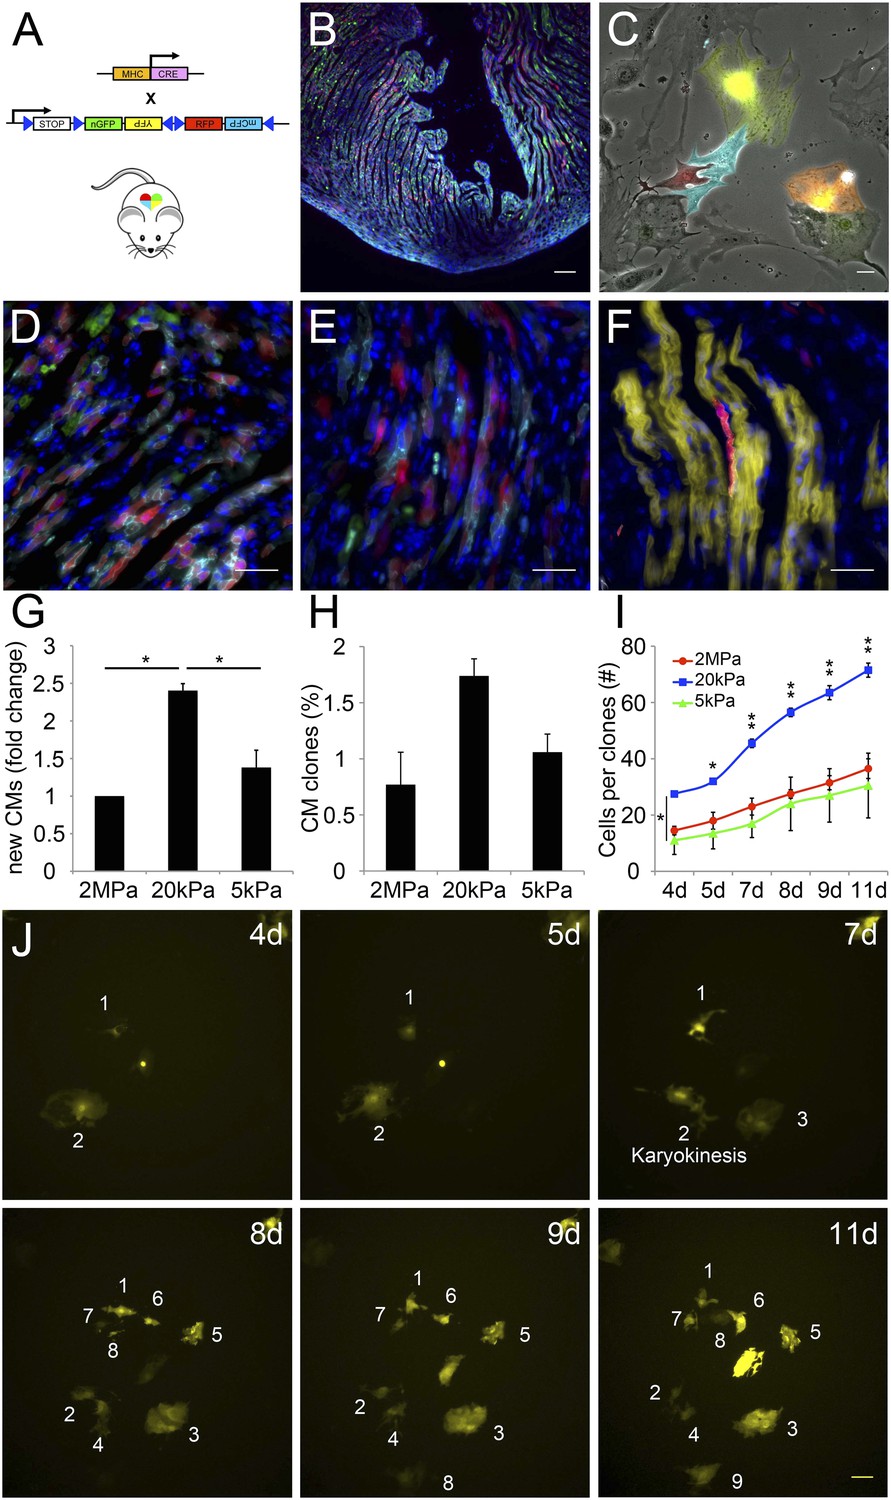
The compliant 20 kPa matrix promotes cardiomyocyte clonal expansion.
(A) A schematic drawing of the clonal tracing strategy of Myh6-Cre;R26R-Confetti-lox mice. (B) In vivo section of a neonatal Myh6-Cre;R26R-Confetti-lox heart. Scale bar: 100 µm. (C) In vitro culture of Myh6-Cre;R26R-Confetti-lox—derived CMs. Scale bar: 20 µm. (D–F) in vivo images of Myh6-Cre;R26R-Confetti-lox heart sections at high magnification. Scale bar: 20 µm. (D–E) Heterogeneous population of CMs. (F) A clone of YFP+ CMs, surrounding a single RFP+ CM. (G) 20 kPa substrate facilitates a 2.4-fold increase in CM number, relative to 2 MPa. (H) 20 kPa substrate facilitates an increase in the percentage of clones. (I) Total number of cells over time on 2 MPa, 20 kPa, and 5 kPa substrates, showing a greater initial number of cells, as well as a greater final number of cells, on 20 kPa substrates (n = 6,401 for G, n = 5,110 for H, I,). (J) Formation of a YFP-positive clone on a 20 kPa substrate, throughout the experiment. Clonal expansion is indicated by an increase in the number of cells. Statistical significance was determined using ANOVA, followed by post-hoc Tukey's (HSD) test. Results are marked with one asterisk (*) if p < 0.05, and two (**) if p < 0.01.
Figure 5—figure supplement 1
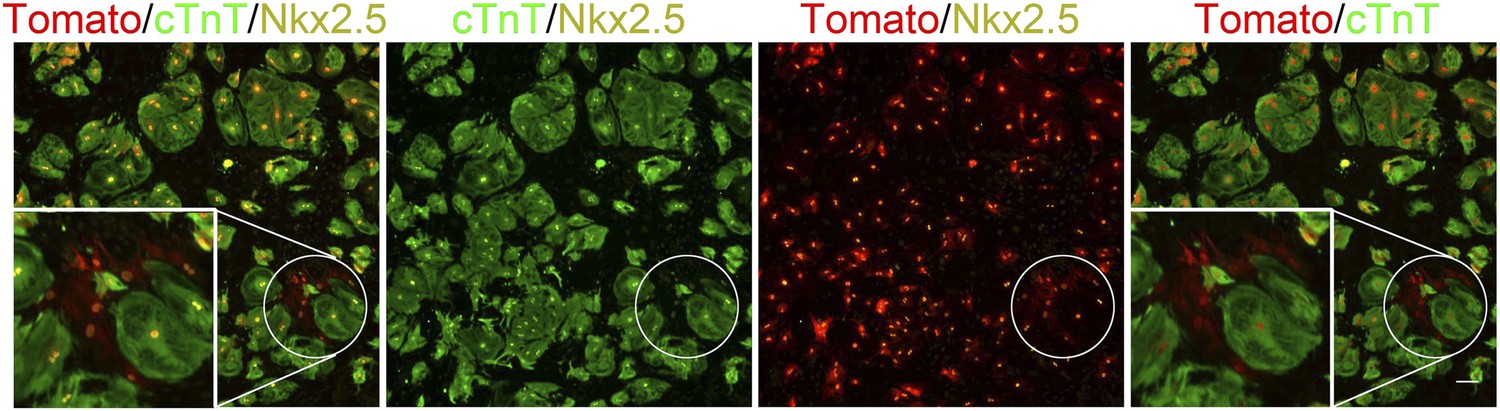
Formation of dedifferentiated cardiomyocyte clones on a 20 kPa matrix.
A cluster of Tomato+/cTnT−/Nkx2.5+ expressing cells (more than 2) on a 20 kPa matrix, suggesting clonal behavior of cells derived from a common CM (or a few CMs) that underwent multiple cell divisions (circled clone). Scale bar: 100 µm.
Figure 5—figure supplement 2
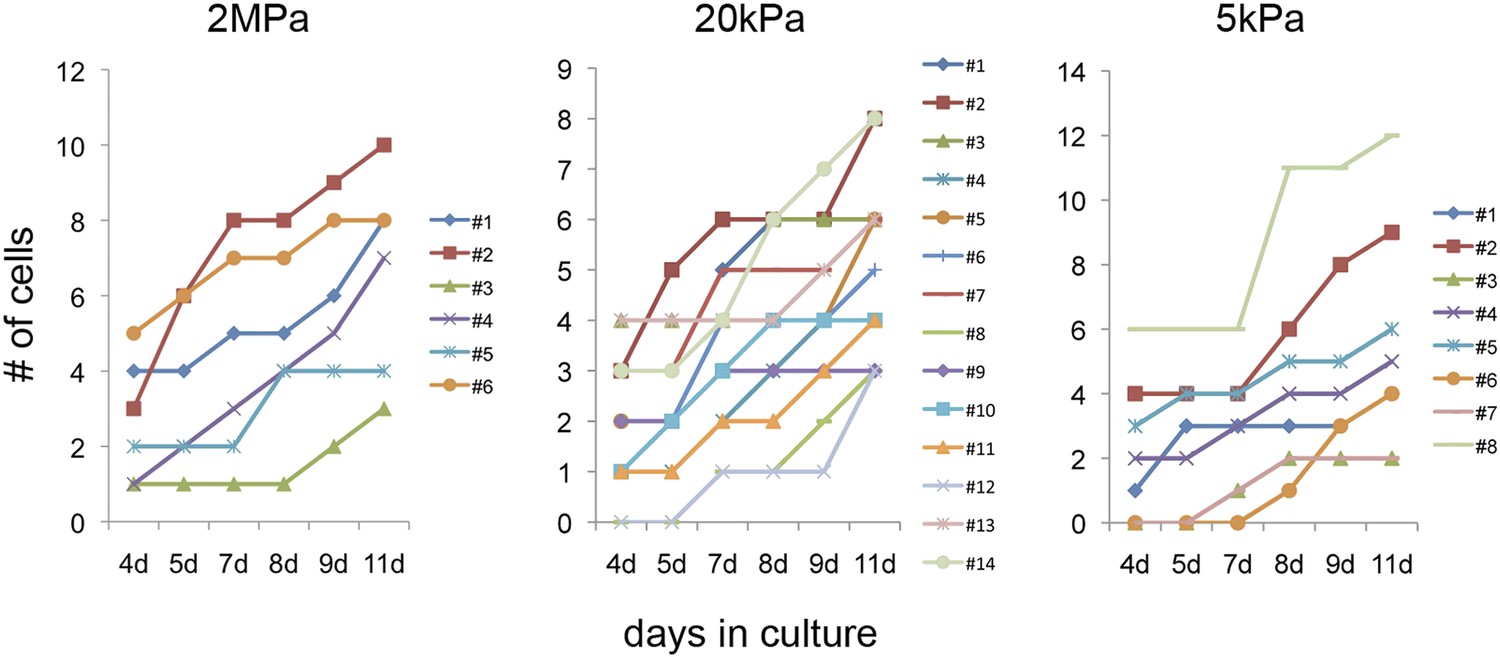
Clonal behavior of individual P1 Myh6-Cre;R26R-Confetti-lox—derived cardiomyocytes on different rigidities.
Development of P1 Myh6-Cre;R26R-Confetti-lox -derived clones at different time points, on matrices with rigidities of 2 MPa (left), 20 kPa (middle), and 5 kPa (right).
Figure 6
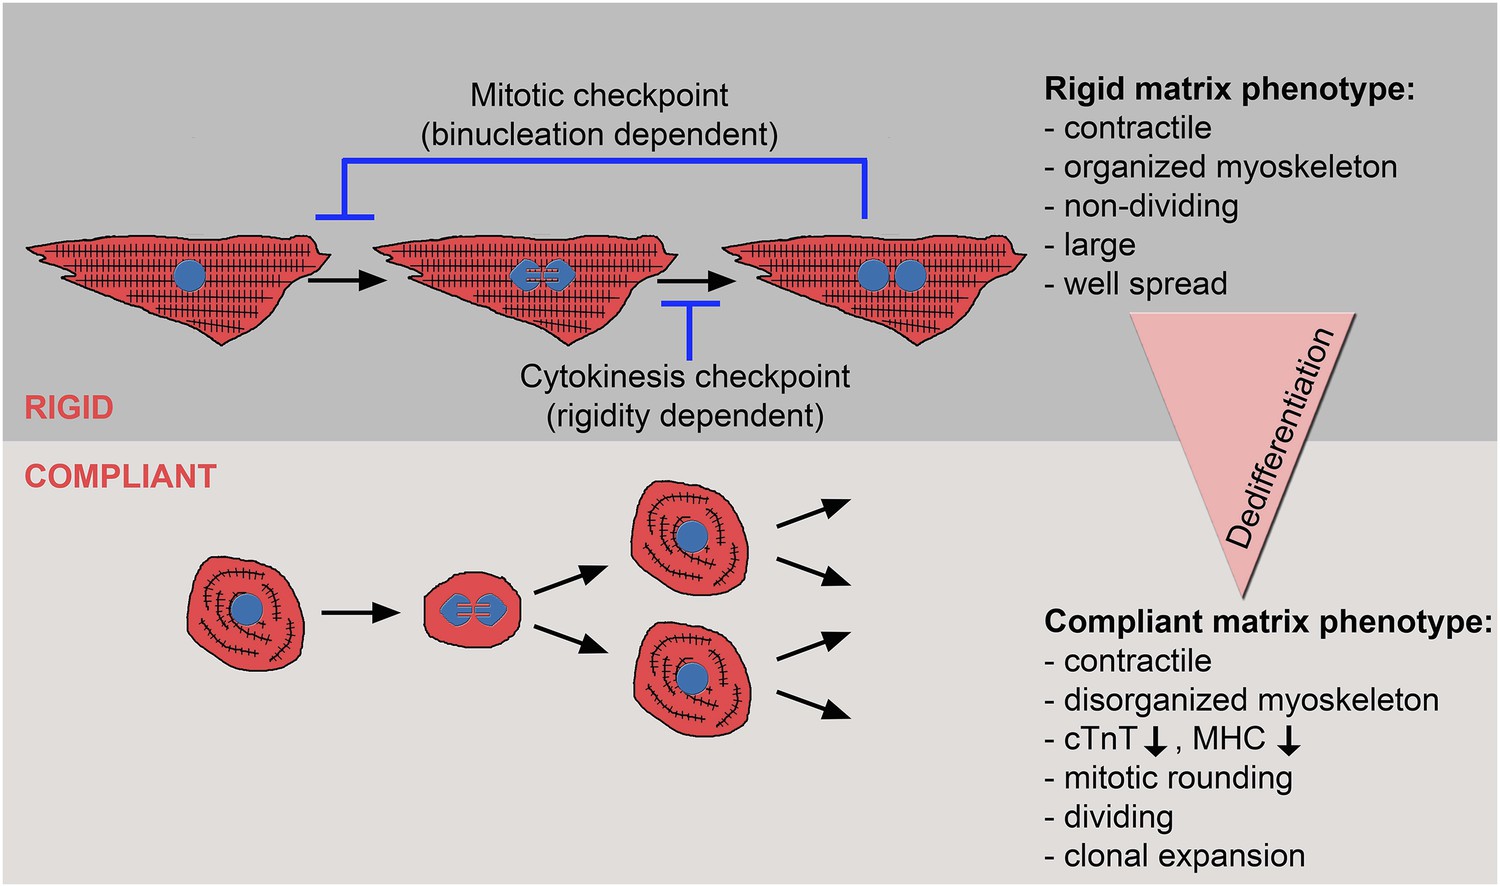
The crosstalk between matrix rigidity and CM cell fate.
A schematic model showing the effect of matrix rigidity on CM cell fate. Rigid substrates maintain the differentiated state of CMs, which is incompatible with cytokinesis. Blocked cytokinesis leads to binucleated CMs. A mitotic checkpoint determines the ability of CMs to re-enter the cell cycle. Compliant substrates control a second checkpoint, mechanical in nature, which enables cytokinesis. Compliant substrates induce CM dedifferentiation into a less organized, immature and proliferative state. This state involves cytoskeletal disarrangements leading to CM mitotic rounding, thus enabling cell division.
Videos
Video 1
Mouse cardiomyocyte binucleation.
A 24 hr time-lapse video of a representative P1 Myh6-Cre;R26R-dTomato-lox CM undergoing karyokinesis followed by binucleation. Time-lapse-10 min. Scale bar: 30 µm.
Video 2
Mouse cardiomyocyte cytokinesis.
A 48 hr time-lapse video of a representative P1 Myh6-Cre;R26R-dTomato-lox CM undergoing karyokinesis followed by cytokinesis. Time-lapse-10 min. Scale bar: 30 µm. One of the mononucleated daughter cells undergoes consecutive cell division, and karyokinesis followed by cytokinesis.
Video 3
Mononucleated cardiomyocyte cytokinesis on a 2 MPa substrate.
48 hr time-lapse imaging (with 10 min intervals) of P1 Myh6-Cre;R26R-dTomato-lox CMs on a 2 MPa substrate. Scale bar: 30 µm. The last frame of this video is shown in Figure 3A, and was correlated with immunofluorescence staining, as shown in Figure 3A′′,A′′′.
Video 4
Mononucleated cardiomyocyte cytokinesis on a 20 kPa substrate.
48 hr time-lapse imaging (with 10 min intervals) of P1 Myh6-Cre;R26R-dTomato-lox CMs on a 20 kPa substrate. Scale bar: 30 µm. The last frame of this video is shown in Figure 3B, and was correlated with immunofluorescence staining, as shown in Figure 3B′′,B′′′.
Video 5
Mononucleated cardiomyocyte cytokinesis on a 5 kPa substrate.
48 hr time-lapse imaging (with 10 min intervals) of P1 Myh6-Cre;R26R-dTomato-lox CMs on a 5 kPa. Scale bar: 30 µm. The last frame of this video is shown in Figure 3C, and was correlated with immunofluorescence staining, as shown in Figure 3C′′,C′′′.
Download links
A two-part list of links to download the article, or parts of the article, in various formats.
Downloads (link to download the article as PDF)
Open citations (links to open the citations from this article in various online reference manager services)
Cite this article (links to download the citations from this article in formats compatible with various reference manager tools)
Reduced matrix rigidity promotes neonatal cardiomyocyte dedifferentiation, proliferation and clonal expansion
eLife 4:e07455.
https://doi.org/10.7554/eLife.07455


