Lamprey VLRB response to influenza virus supports universal rules of immunogenicity and antigenicity
- National Institute of Allergy and Infectious Diseases, United States
- Emory University School of Medicine, United States
Figures
Figure 1

Origin of variable lymphocyte receptor B (VLRB) in jawless vertebrates.
Jawless and jawed vertebrates last shared a common ancestor ∼550 Mya. VLR genes are only in jawless vertebrates, whereas Immunoglobulin (Ig) genes are only in jawed vertebrates. However, both jawed and jawless vertebrates have a lymphocyte-based adaptive immune system suggesting that the genetic programs necessary for lymphocyte development originated in a common ancestor before the antigen receptor genes. Cytidine deaminases are expressed by lymphocytes in both jawed and jawless vertebrates and may have originated in a common ancestor; activation-induced cytidine deaminase (AID) and cytosine deaminase (CDA). Structures of prototypic VLRB (Top, PDB: 3e6j) and IgG (Bottom, PDB: 1Igt) are shown to the right, along with cartoons of their secreted forms. Regions of antigen recognition are shaded in blue or green. In red are the concave antigen binding residues of VLR and the complementarity determining regions (CDRs) of Ig.
Figure 2
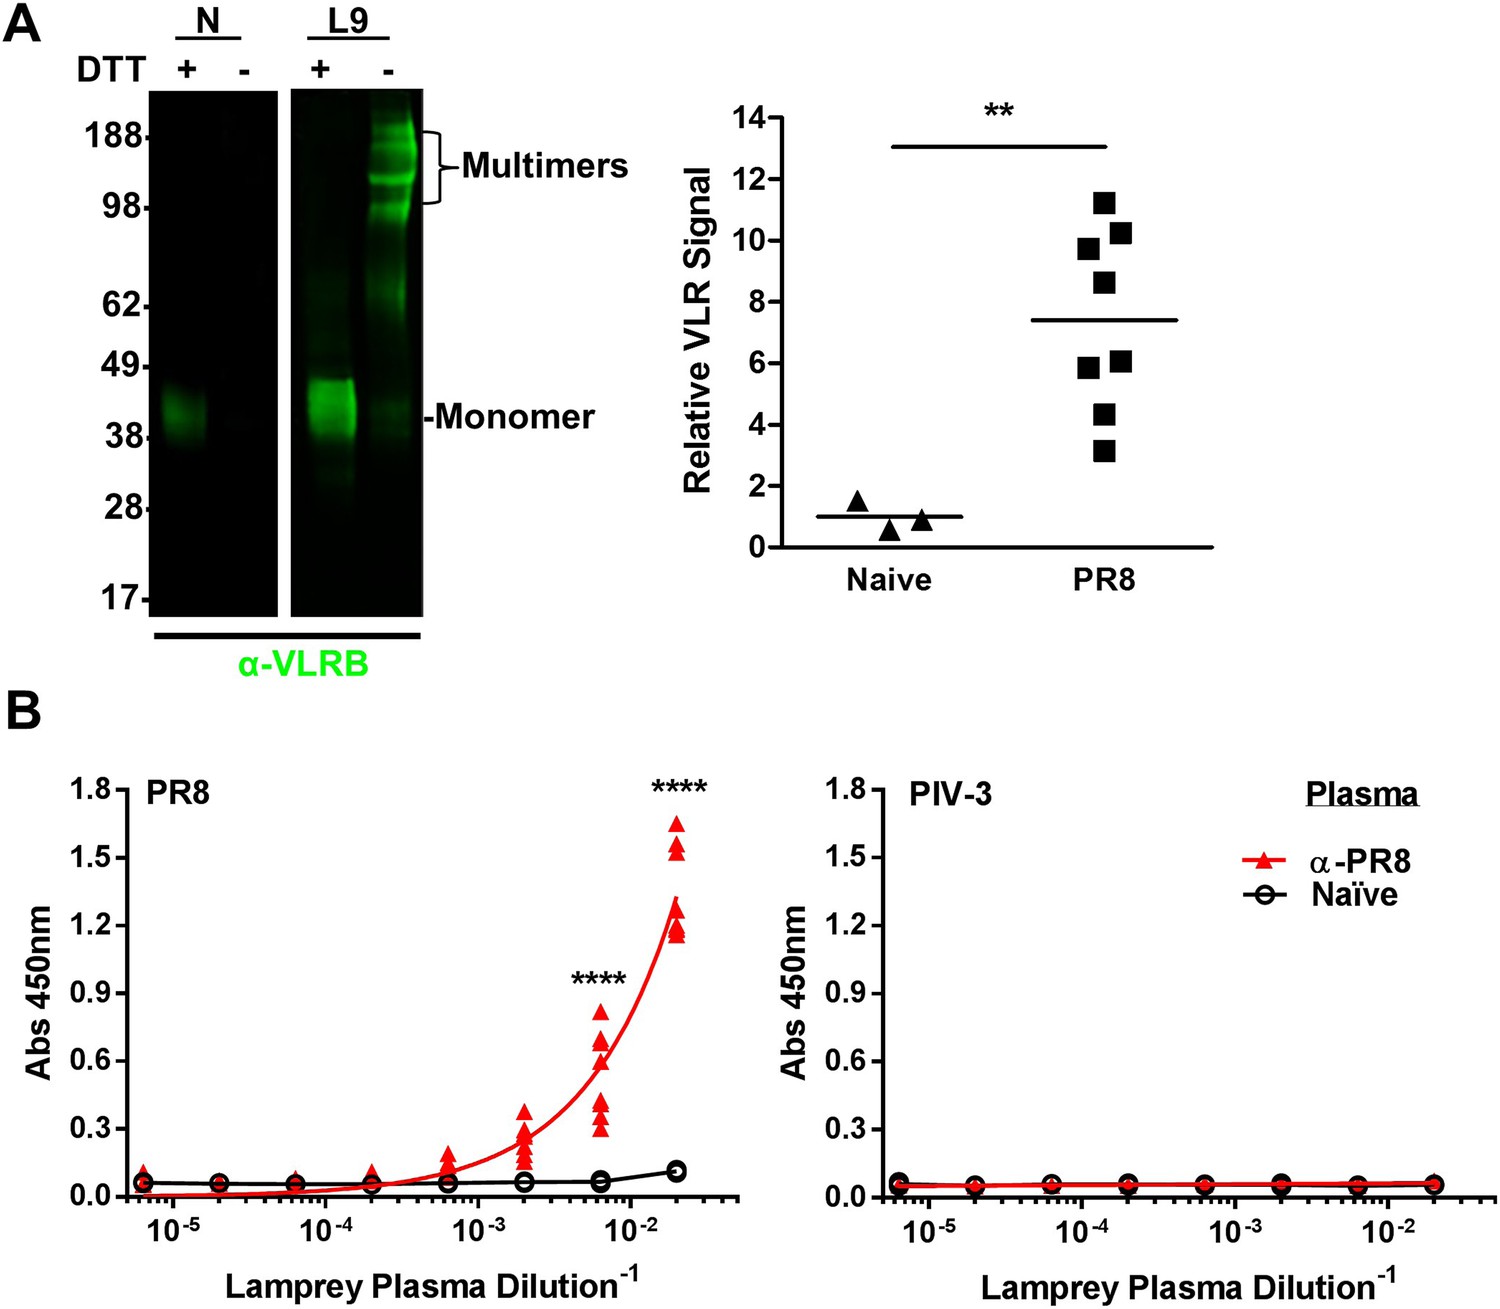
Lamprey make VLRBs specific for influenza A virus (IAV) after immunization with non-adjuvented, UV-inactivated virus.
(A) Left, whole lamprey plasma (5 µl of naïve or immunized three times with PR8 [L9]) electrophoresed on a 4–12% SDS PAGE gel probed with anti-VLR monoclonal Ab (mAb) by immunoblotting. VLR monomers (∼35–45 kDa) are naturally cross-linked by disulfide bonds to form VLR multimers >100 kDa. Right, lane intensity measured by ImageJ for immunoblots of 2 µl Naïve (3 animals) or PR8 immunized (8 animals) probed with anti-VLR 2° Ab. Each point represents one animal. Data were analyzed by two-tailed t-test using PRISM software (**p < 0.01). The mean signal from immunized plasma was 7.4 ± 1.8 × greater than the naïve mean. (B) Equal protein quantities of purified virus were adsorbed to ELISA plates and probed with lamprey plasma from either immunized (n = 9) or naïve (n = 2) animals. Data were analyzed by two-way ANOVA followed by Bonferroni multiple comparison using PRISM software (****p < 0.0001).
Figure 3 with 3 supplements
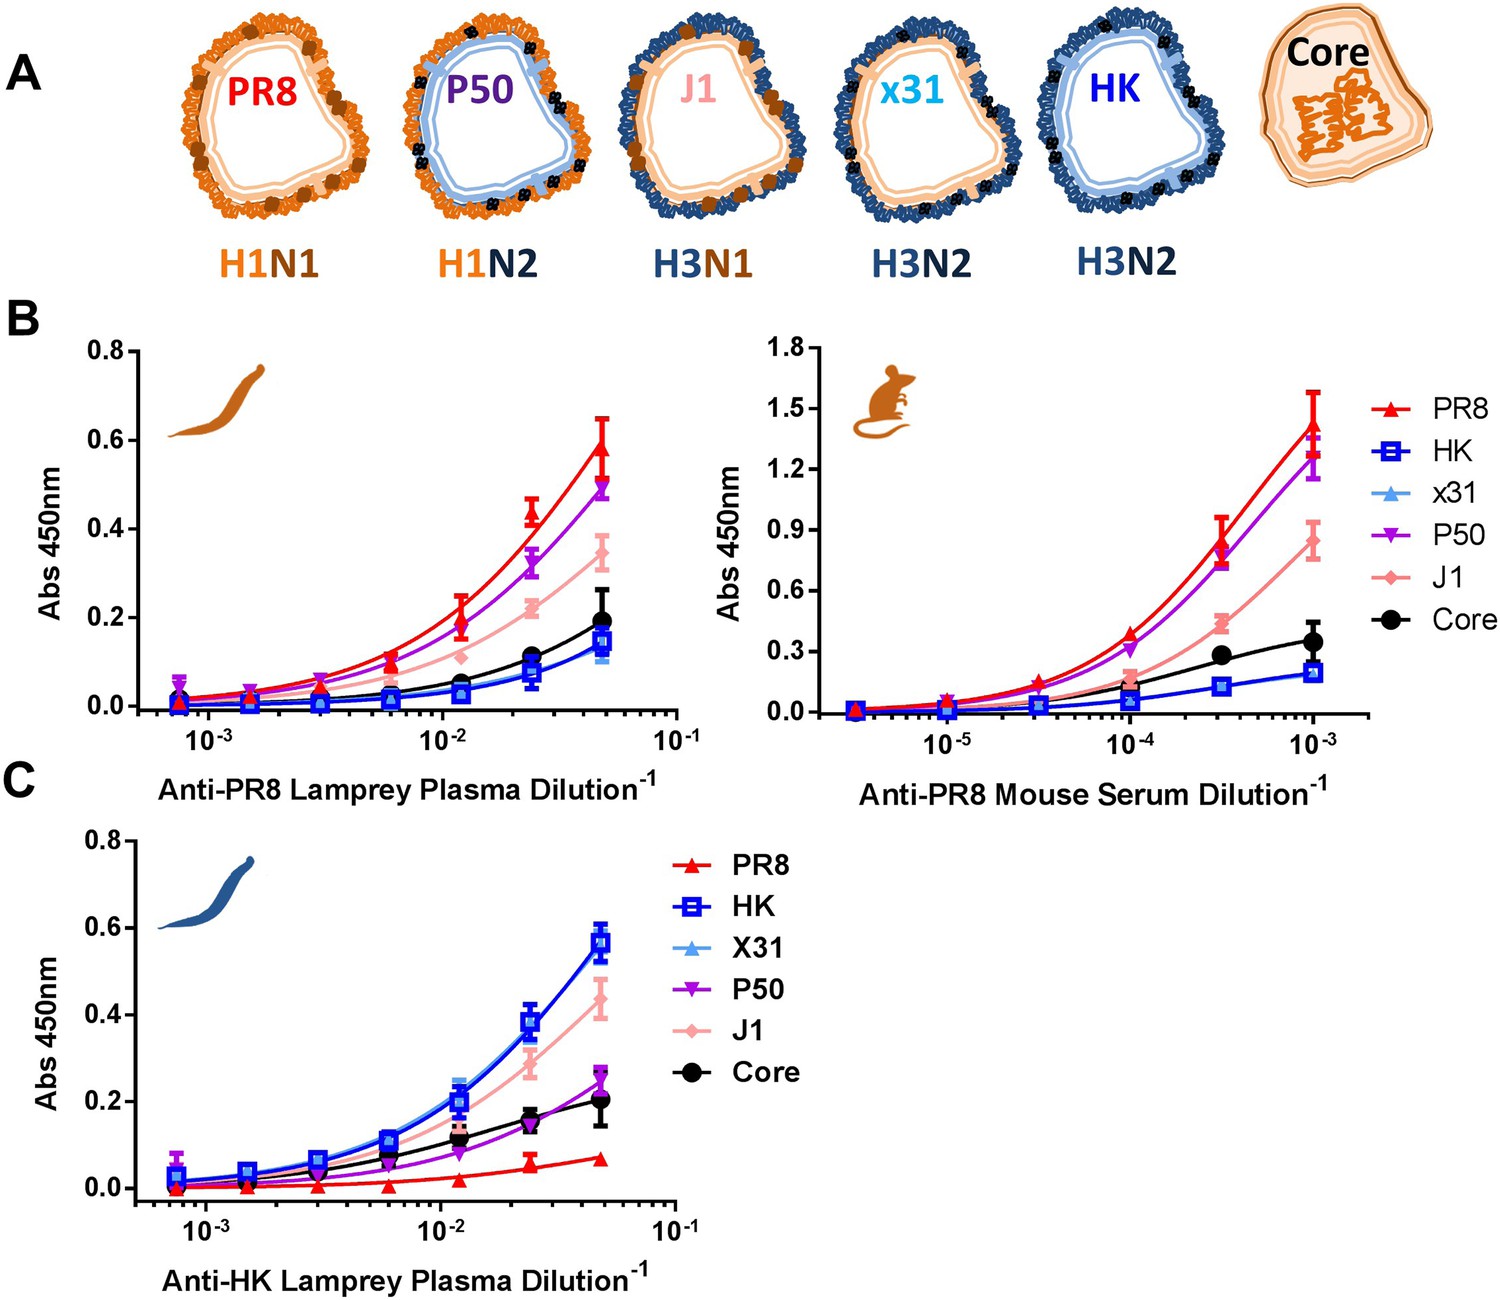
Immunodominance hierarchy against IAV for lamprey and mice is the same.
(A) Scheme depicting reassortant virus components used for experiments in this figure. (B) Equal protein quantities split (HA/NA/M1) and core (NP/M1) antigens bound to ELISA plates were tested for binding to anti-PR8 mouse sera or lamprey plasma. Mouse data are representative of two mice with n = 4 independent experiments. Lamprey data are from three pooled animals with n = 4 independent experiments. (C) Same as Figure 3B, but using anti-HK lamprey plasma. Data are from three pooled animals with n = 4 ELISA replicates.
Figure 3—figure supplement 1
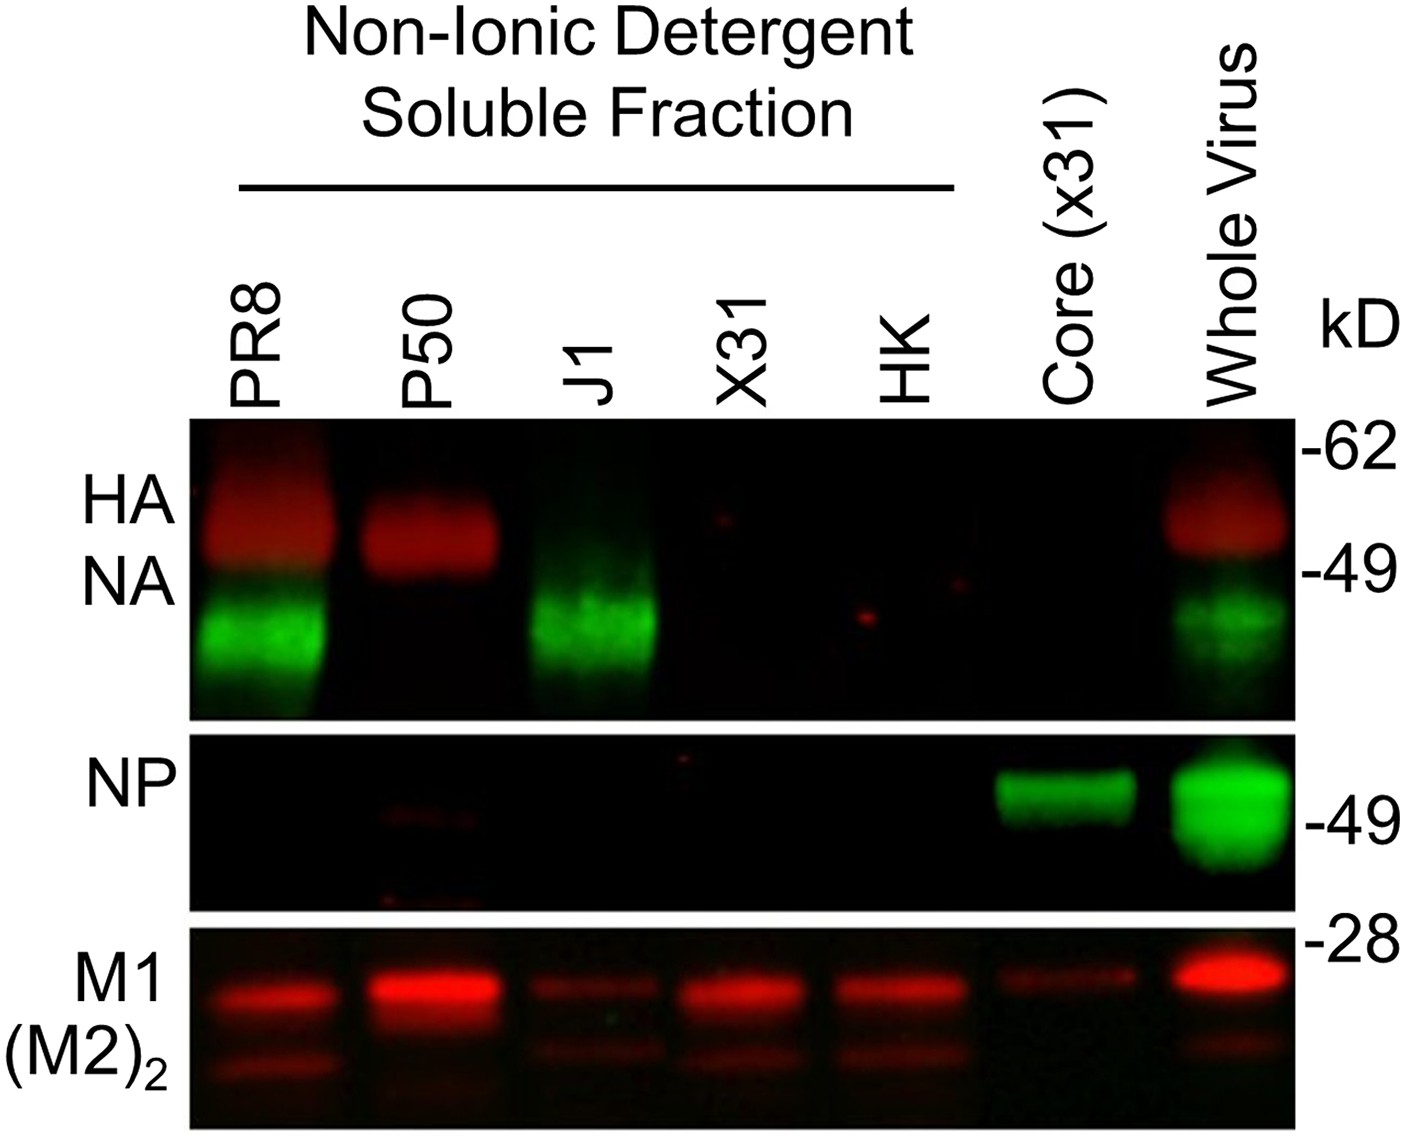
Detergent-split reassorted viruses.
Western blot of reassorted virus components probed with mouse mAbs specific for H1N1 hemagglutinin (HA) + neuraminidase (NA) or cross-reactive nucleoprotein (NP), M1, and M2 dimer.
Figure 3—figure supplement 2

PR8 antibodies (Abs) bind HA and NA but not M influenza proteins.
HeLa cells transfected with pDZ control plasmid or PR8 HA, NA, M1/2, NP, or NS1 plasmids were stained with their respective mouse mAb, mouse sera, or lamprey plasma raised against PR8 virus. Both lamprey plasma and mouse sera bound HA and NA. The mouse sera bound NP, but the lamprey plasma did not. Neither bound M1/2 proteins. Neither immune sera stained NS1 protein. Note naïve lamprey plasma has less total VLRB and a lower background than immune lamprey plasma. Data is representative of three independent experiments.
Figure 3—figure supplement 3
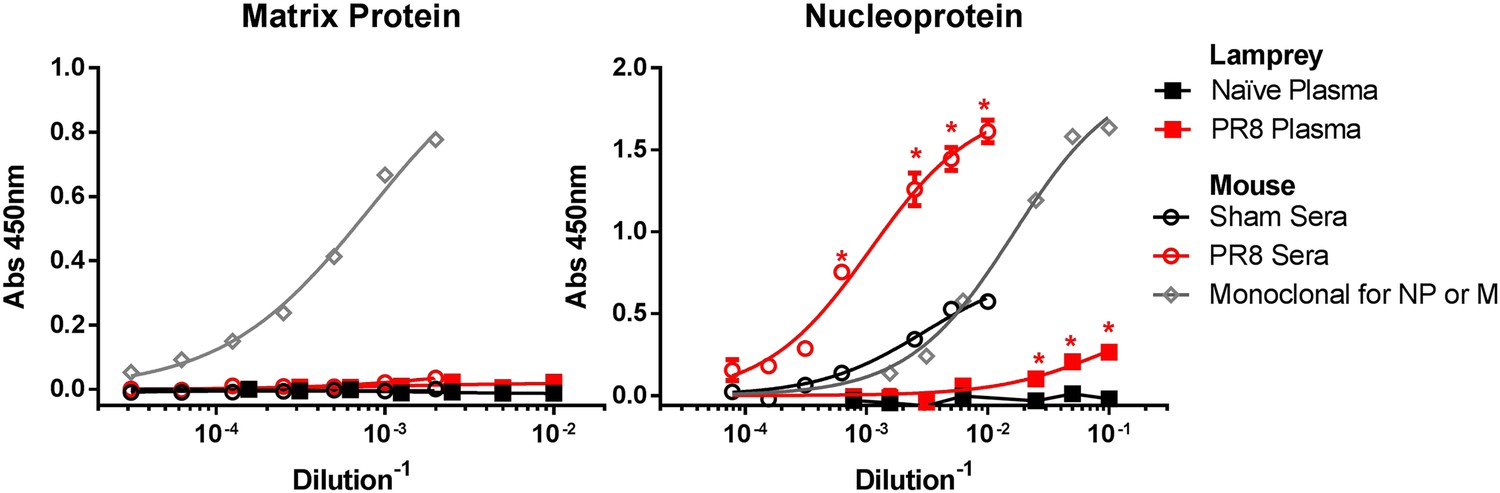
PR8 immunized lamprey plasma binds purified NP protein, but not purified M1 by ELISA.
Purified NP or M1 protein were adsorbed to ELISA plates and probed with mouse sera (n = 2) or lamprey plasma from either immunized (n = 4) or naïve (n = 2) animals. Data were analyzed by two-way ANOVA followed by Bonferroni multiple comparison using PRISM software (*p < 0.0001). Both PR8-immune mouse sera and lamprey plasma bound NP better than unimmunized control. Neither bound M1 protein. mAbs M2-1C6 for M1 and HB65 for NP are shown to confirm proper folding of purified protein on plate.
Figure 4
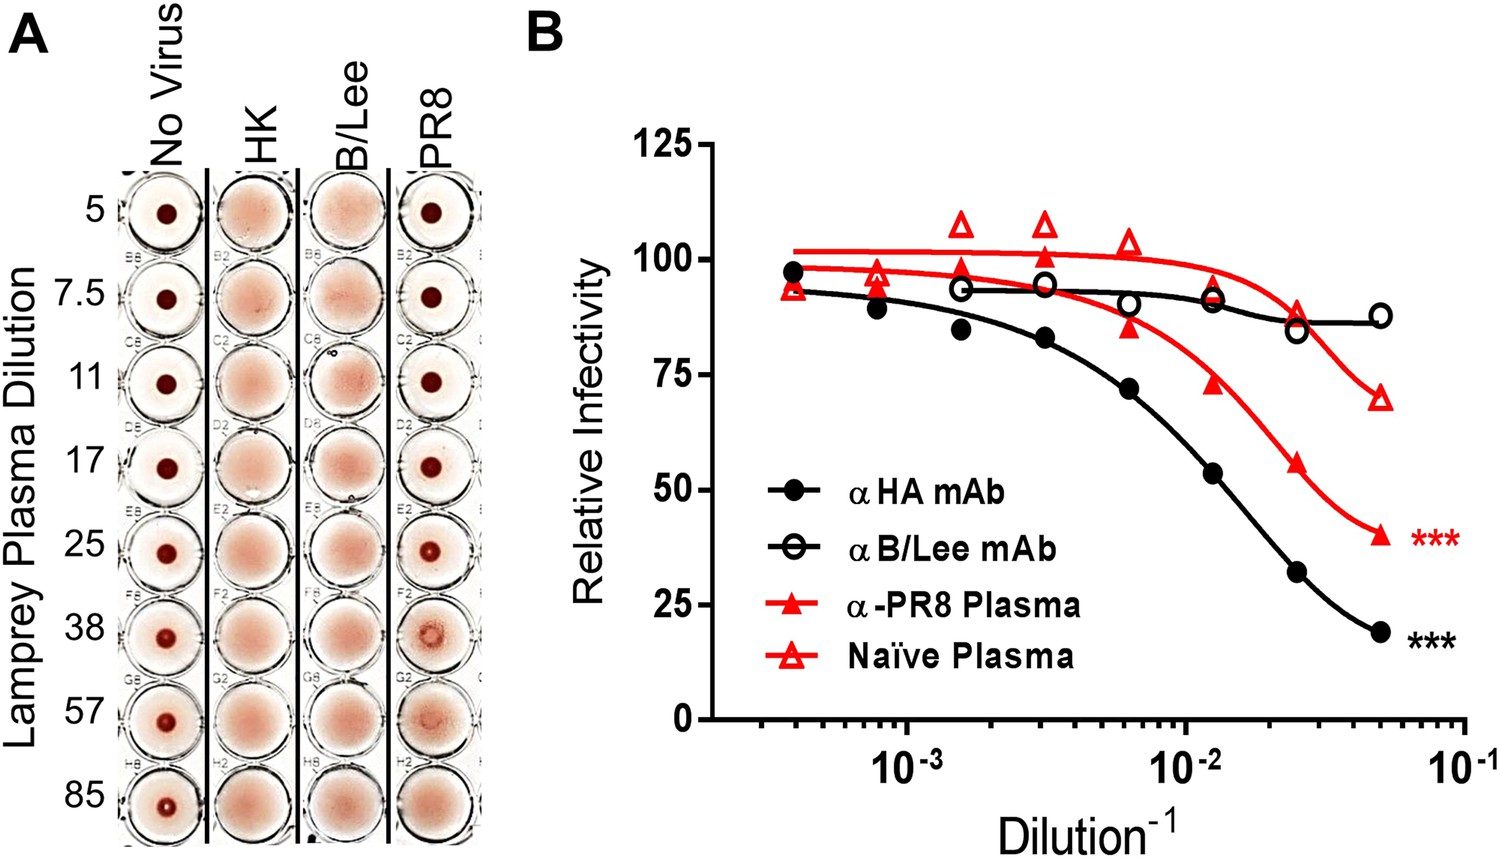
Lamprey VLRBs bind to hemagglutinin and neutralize infection.
(A) Plasma from PR8-immunized lamprey inhibits PR8 hemagglutination at a 1:30 plasma dilution, but did not inhibit hemagglutination by either HK or B/Lee at any dilution. Data are representative of two experiments. (B) MDCK cells were infected with an MOI 0.07 of PR8 in the presence of titrated mAb supernatants (H17L2 against PR8 or control 1.2F4 against influenza B/Lee) or lamprey plasma (L9 vs Naïve). After 8 hr cells were fixed, double-stained with anti-HA and anti-NP Igs. Cells positive for either HA or NP by flow cytometry were considered infected. Data from four independent experiments were normalized to control for different percentages of infection between experiments and fit to a variable dose–response curve. The best-fit, calculated infectious dose 50 (ID50) was significantly lower for both the immunized plasma and PR8 specific Ig (***p < 0.001).
Figure 5
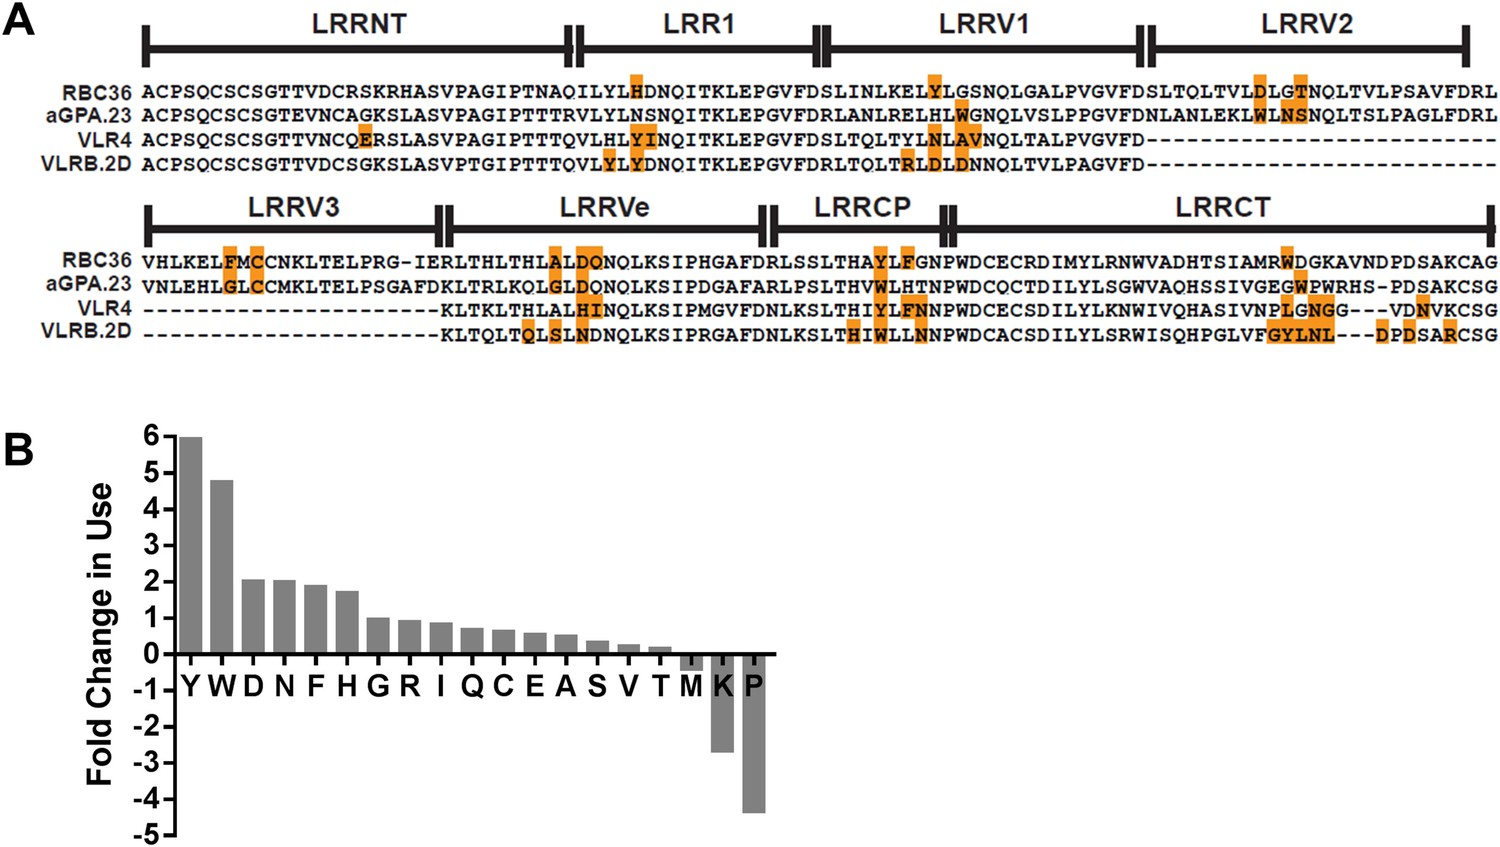
Paratope signature of VLRBs.
(A) Contact residues determined by the crystal structures of VLRBs in complex with their antigens are highlighted in orange. RBC36 against H trisaccharide (3E6J); aGPA.23 against TF disaccharide (4K79); VLR4 against BclA (3TWI); and VLRB.2D against HEL (3G39). (B) Enrichment or shortfall of each amino acid in the contact residues relative to the total amino acids found in the full VLRB was determined from the ratio of frequency of each amino acid in contact residues vs the frequency in the total VLRB sequence. Leucine was excluded from the analysis as it is the major structural amino acid of VLRBs. No M, K, or P were found among the contact residues. Shortfall was determined by estimating, based on total VLRB frequency, how many amino acids would be there if the amino acid distribution was even throughout the VLRB.
Tables
Table 1
Lamprey plasma binding is sensitive to drifted viruses by ELISA and HI
| Virus | ELISA % ΔAUC* | HI Titer† |
|---|---|---|
| PR8 | – | 40 |
| # Substitutions in HA head | ||
| 3 | 15 | 10 |
| 6 | −25 | 20 |
| 9 | −46 | <10 |
| 12 | −59 | <10 |
| H1N1 isolates | ||
| A/Weiss/43 | −61 | – |
| A/Cameron/46 | −50 | – |
| A/Malaysia/54 | −77 | – |
-
*
Equal amounts of each virus were plated and probed with lamprey plasma (L25) or mouse sera. Data from four independent experiments were normalized to the BMax of the stem binding mAb 3A01 to allow precise comparison between viruses and replicates (Table 1—source data 3). Data were fit to a hyperbola and the percent change in area under curve (AUC) between PR8 and the indicated virus is reported. All curve-means were significantly different from PR8 by Two Way ANOVA followed by Tukey Multiple comparisons test, p < 0.001, except PR8 vs 3.
-
†
Agglutination inhibition of four HAU of input virus by lamprey plasma (L27) occurred at the dilution reported.
-
HA, hemagglutinin.
-
Table 1—source data 1
Other animals show similar binding to sequential virus series. ELISA binding curves for lamprey plasma from Table 1 are plotted alongside PR8 immunized guinea pig, chicken and mouse sera against the same plated Sequential virus series. Each graph shows representative data on a single animal's sera. Percent change in area under curve between wt PR8 and Sequential 12 is shown on each graph (ΔAUC).
- https://doi.org/10.7554/eLife.07467.011
-
Table 1—source data 2
More H1N1 isolates. ELISA binding curves for lamprey plasma from Table 1 against plated H1N1 isolates are plotted along with two additional isolates omitted from the Table.
- https://doi.org/10.7554/eLife.07467.012
-
Table 1—source data 3
Anti-HA stem Ab binding curves used to normalize amounts of plated HA in Table 1. (A) ELISA binding curves for serially diluted anti-HA stem Ab (3A01) added to the Sequential virus series are show from each of the four experiments. (B) Same as (A) for the H1N1 isolate panel.
- https://doi.org/10.7554/eLife.07467.013
Table 2
IC75 values for anti-PR8 lamprey plasmas and guinea pig serum (positive control) in competition with defined HA mAbs by ELISA*
| L7 | L9 | L29 | Guinea pig | Stem | ||||
|---|---|---|---|---|---|---|---|---|
| Epitope† | IgG | Fab | IgG | Fab | IgG | Fab | IgG | C179 |
| Sa | NC‡ | NC | 250 | 400 | — | 290 | 36,000 | NC |
| Sb | NC | NC | 320 | 410 | — | 530 | 17,000 | — |
| Cb | 280 | 610 | 600 | 980 | — | 860 | 26,000 | — |
| Ca1 | 250 | 350 | 360 | 300 | — | 860 | 40,000 | — |
| Ca2 | 370 | — | 600 | — | — | — | 25,000 | — |
| Stem | — | — | — | — | NC | — | — | 3.5 |
| 2G02 | – | – | – | – | – | – | – | nM |
-
*
Data was fit to a Hill Slope. IC75 value was calculated from the curve using PRISM. IgG data are from three independent experiments, Fab data are from one experiment due to limited lamprey plasma.
-
†
mAbs used—Sa: PEG-1; Sb: H28E23; Cb: H36 C12 (IgG), H9 D3 (Fab); Ca1: H2 4B1; Ca2: H18 S413; Stem: C179 and 2G02.
-
‡
NC, no competition; ‘—’, not determined.
-
mAbs, monoclonal antibodies.
-
Table 2—source data 1
Competition ELISA against α-Head HA panel Abs. Data from Table 2 shown in graph form. Serially diluted unlabeled lamprey plasma raised against PR8 (L7, L9 or Naïve) was added to PR8 immobilized on 96 well ELISA plates. After 1 hr incubation, a fixed concentration of each indicated hybridoma supernatant (PEG-1, H28E23, H18 S413, H35 C12, H2 4B1, H18 S210, and Y8 2D1) was added at a predetermined concentration—65% of maximum binding (EC65). Data from three independent experiments were analyzed by Two Way ANOVA followed by Bonferroni Multiple Comparisons against the Naïve plasma data using PRISM. (*p < 0.05; **p < 0.01; ***p < 0.001; ****p < 0.0001).
- https://doi.org/10.7554/eLife.07467.015
-
Table 2—source data 2
Competition ELISA against α-Head HA Fabs. Same as Table 2—source data 1 but with Fabs instead of hybridoma supernatants. p-value measurements determined with One-Way Anova followed by Dunnett's Multiple Comparison Test against Naïve plasma values. Stars indicate differences among whole groups. Data collected from only one experiment due to shortage of lamprey plasma.
- https://doi.org/10.7554/eLife.07467.016
-
Table 2—source data 3
Immune lamprey plasma does not compete against stem binding Abs by ELISA. Serially diluted naïve or immune lamprey plasma raised against PR8 (L29) on 96 well ELISA plates immobilized with PR8. After 1 hr incubation, a fixed concentration of purified monoclonal C179 or 2G02 was added at EC65. As a positive control, the two stem Abs were competed against each other or against an anti-HA head Ab (H28E23). Data are from at least two separate experiments with four total replicates. There was no statistical difference between the lamprey plasma curves. ELISA signal from these Abs is low, thus the curves are noisy. In contrast, the ‘2G02 then C179 curve’ is statistically different from the ‘H28E23 then 2G02 curve’ by two-tailed t-test (**p< 0.01).
- https://doi.org/10.7554/eLife.07467.017
Download links
A two-part list of links to download the article, or parts of the article, in various formats.
Downloads (link to download the article as PDF)
Open citations (links to open the citations from this article in various online reference manager services)
Cite this article (links to download the citations from this article in formats compatible with various reference manager tools)
Lamprey VLRB response to influenza virus supports universal rules of immunogenicity and antigenicity
eLife 4:e07467.
https://doi.org/10.7554/eLife.07467


