Magnetosensitive neurons mediate geomagnetic orientation in Caenorhabditis elegans
- University of Texas at Austin, United States
Figures
Figure 1 with 1 supplement
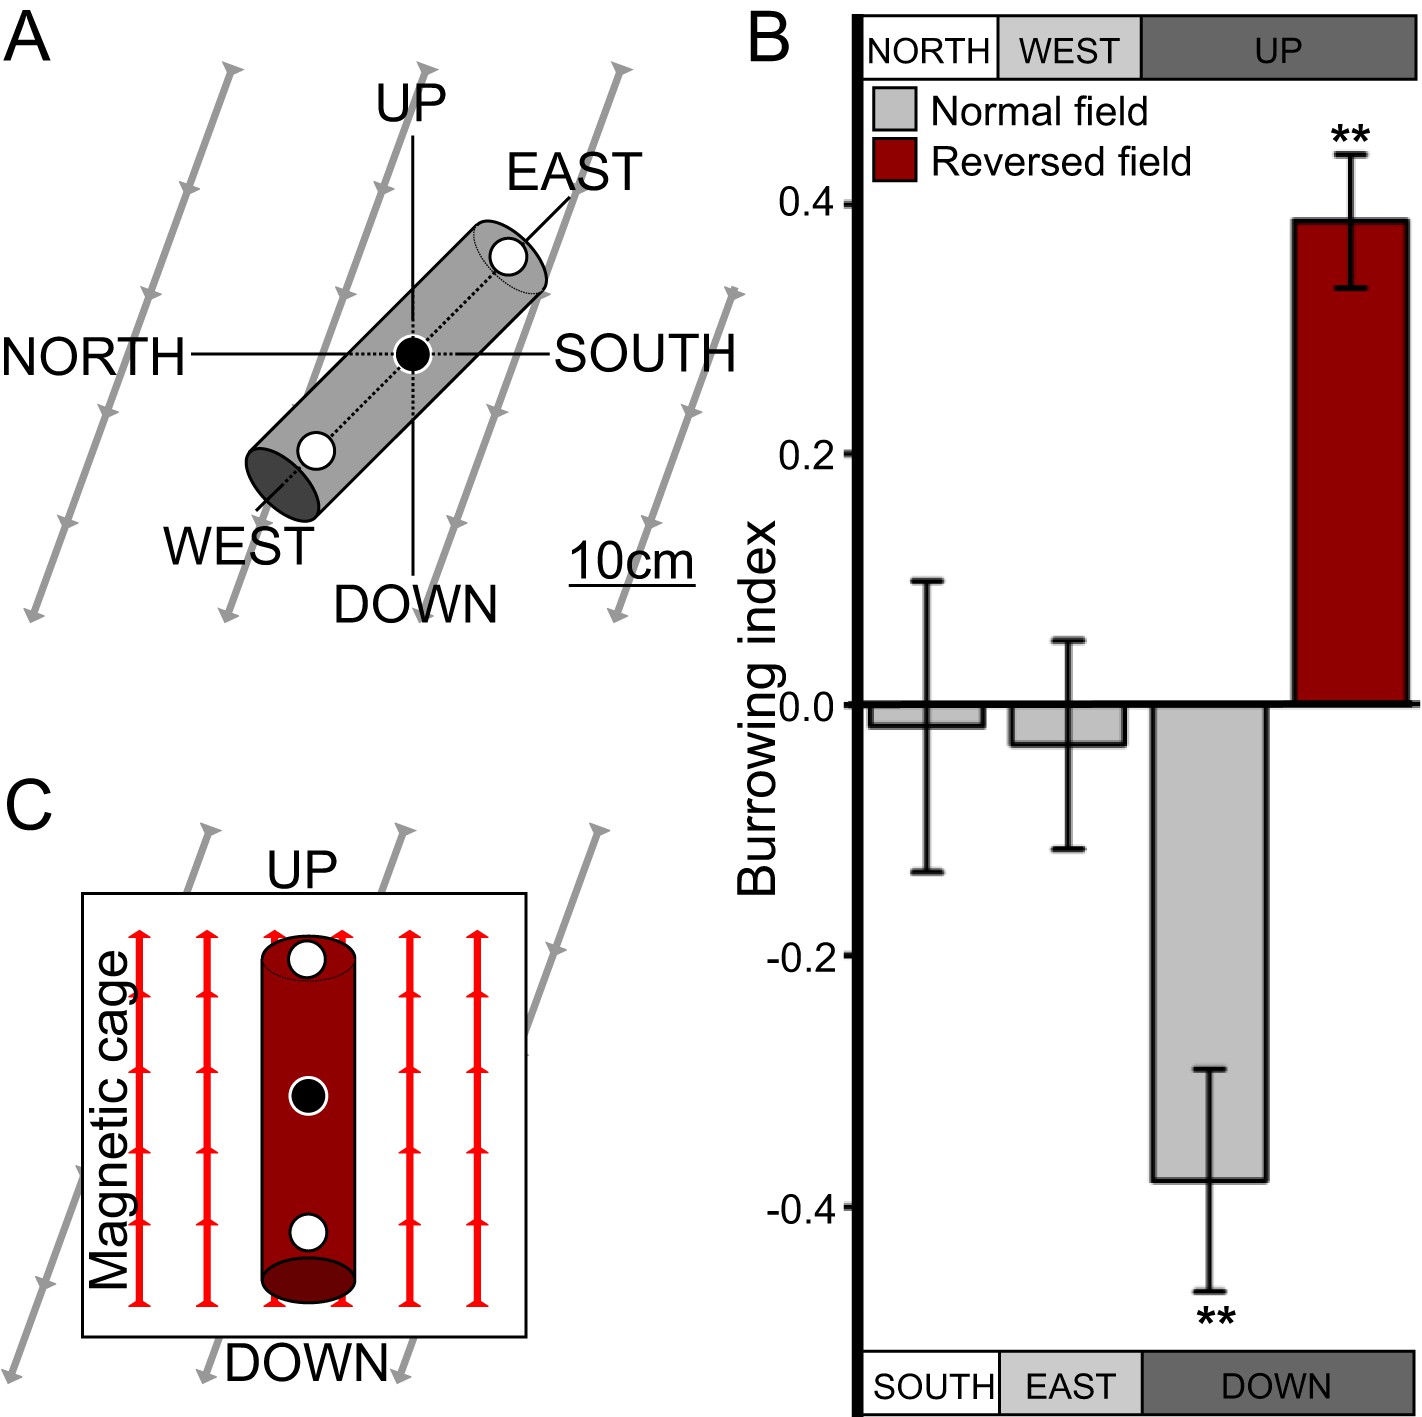
C. elegans engages in vertical migrations whose direction depends on satiation state.
(A) To determine if C. elegans engaged in burrowing migrations we injected worms into agar-filled pipettes aligned horizontally (east-west and north-south), or vertically (up-down). Alternatively, we disrupted the local magnetic field around vertical pipettes (where magnetic north is down), by reversing the local field polarity (thus making magnetic north up) with a magnetic coil system. (B) Only worms in pipettes aligned vertically displayed burrowing bias, preferentially migrating down unless the local magnetic field polarity was reversed (red bar) with the help of a magnetic coil system (C).
Figure 1—figure supplement 1
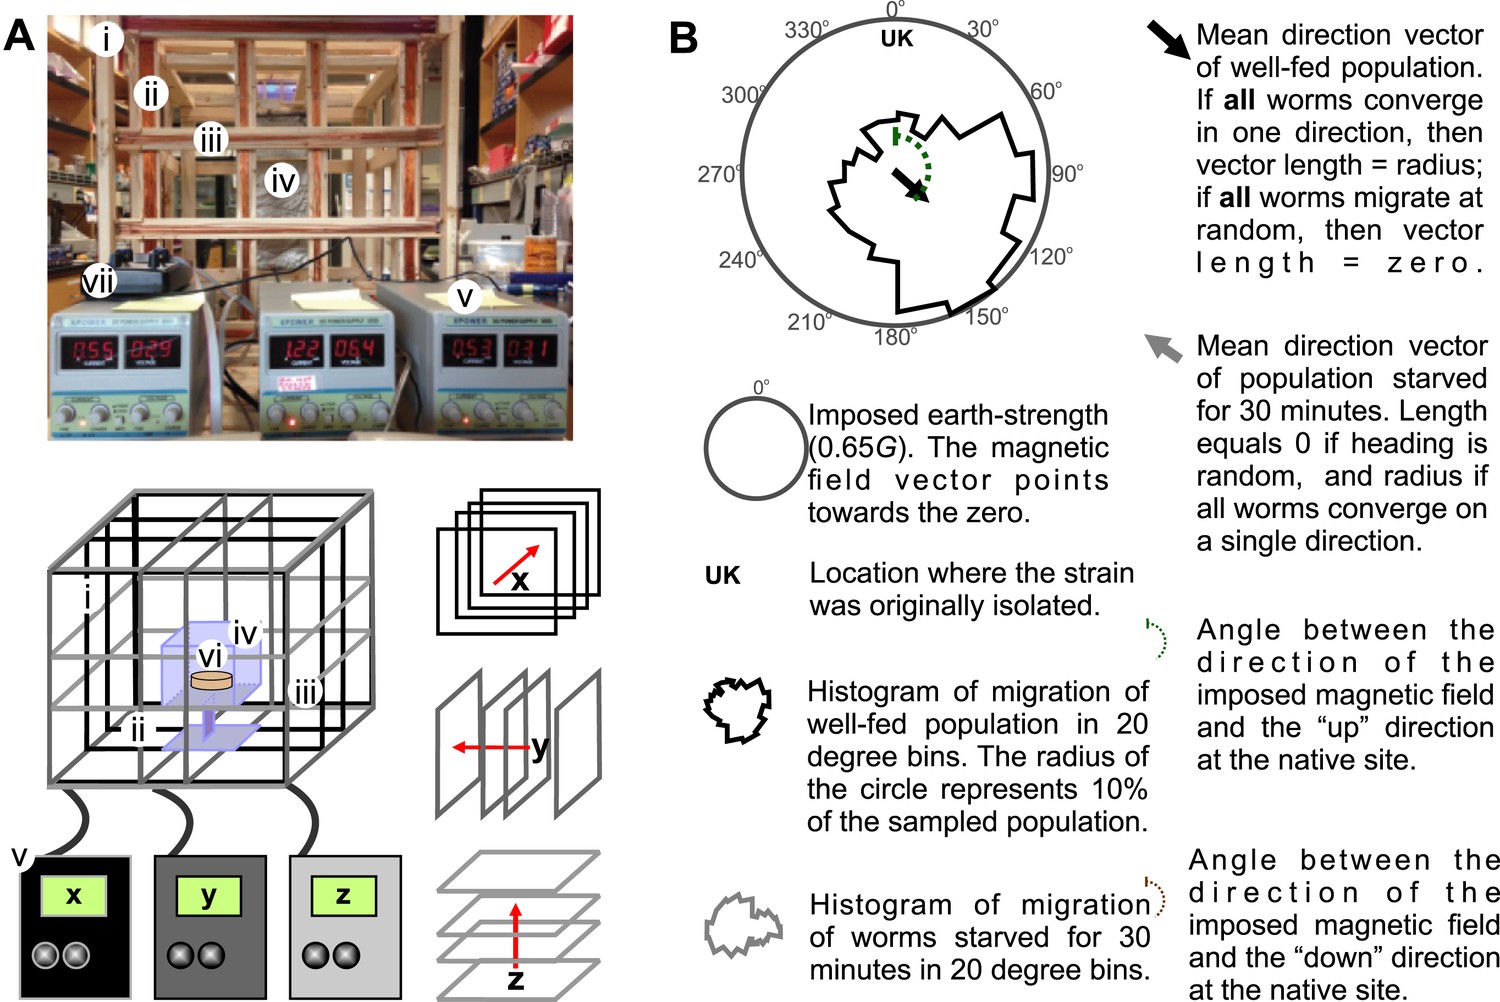
Merritt coil system for 3D control of magnetic fields.
To expose worms to controlled and homogeneous earth-strength magnetic fields we constructed a triple magnetic Merritt coil system (Merritt et al., 1983). (A) Each system creates a magnetic field along the x (i), y (ii), and z (iii) directions and consists of four 1-m2 squares, each arranged orthogonal to the other two. The system generates magnetic and electric fields. To prevent electric fields from affecting our experiments we built a Faraday cage around the experimental volume (iv). Dedicated DC power supplies for each coil (v) allowed us to control the orientation and the magnitude of the net magnetic field within the coil system. Assay plates (vi) were then placed inside the coil system for testing. We empirically calibrated the field within the coil system with the aid of a milligausmeter (vii) from AlphaLab Inc. (Utah, USA). (B) In each magnetic coil system experiment, the north direction of the imposed magnetic field is signified by the 0° on the top of the circular plot. Directly beneath this, and inside the circular plot, the strain's genetic background or geographic origin is indicated. The solid circular histograms represent the heading of the tested populations in a circle where the radius equals 10% of the entire population. Well-fed animals are represented by the black contour, while starved worms are represented by the grey contour. Circular plots had 18 bins (20° each). Similarly, the black and grey arrows represent the mean heading vector for the well-fed and starved populations respectively. The length of the vector is 0 if the population of animals migrated at random, and it is 1 if all animals migrate to a single point. The brown and green dashed curves indicate the heading that would result in (respectively) downward or upward translation at the original isolation site of each strain.
Figure 2 with 1 supplement
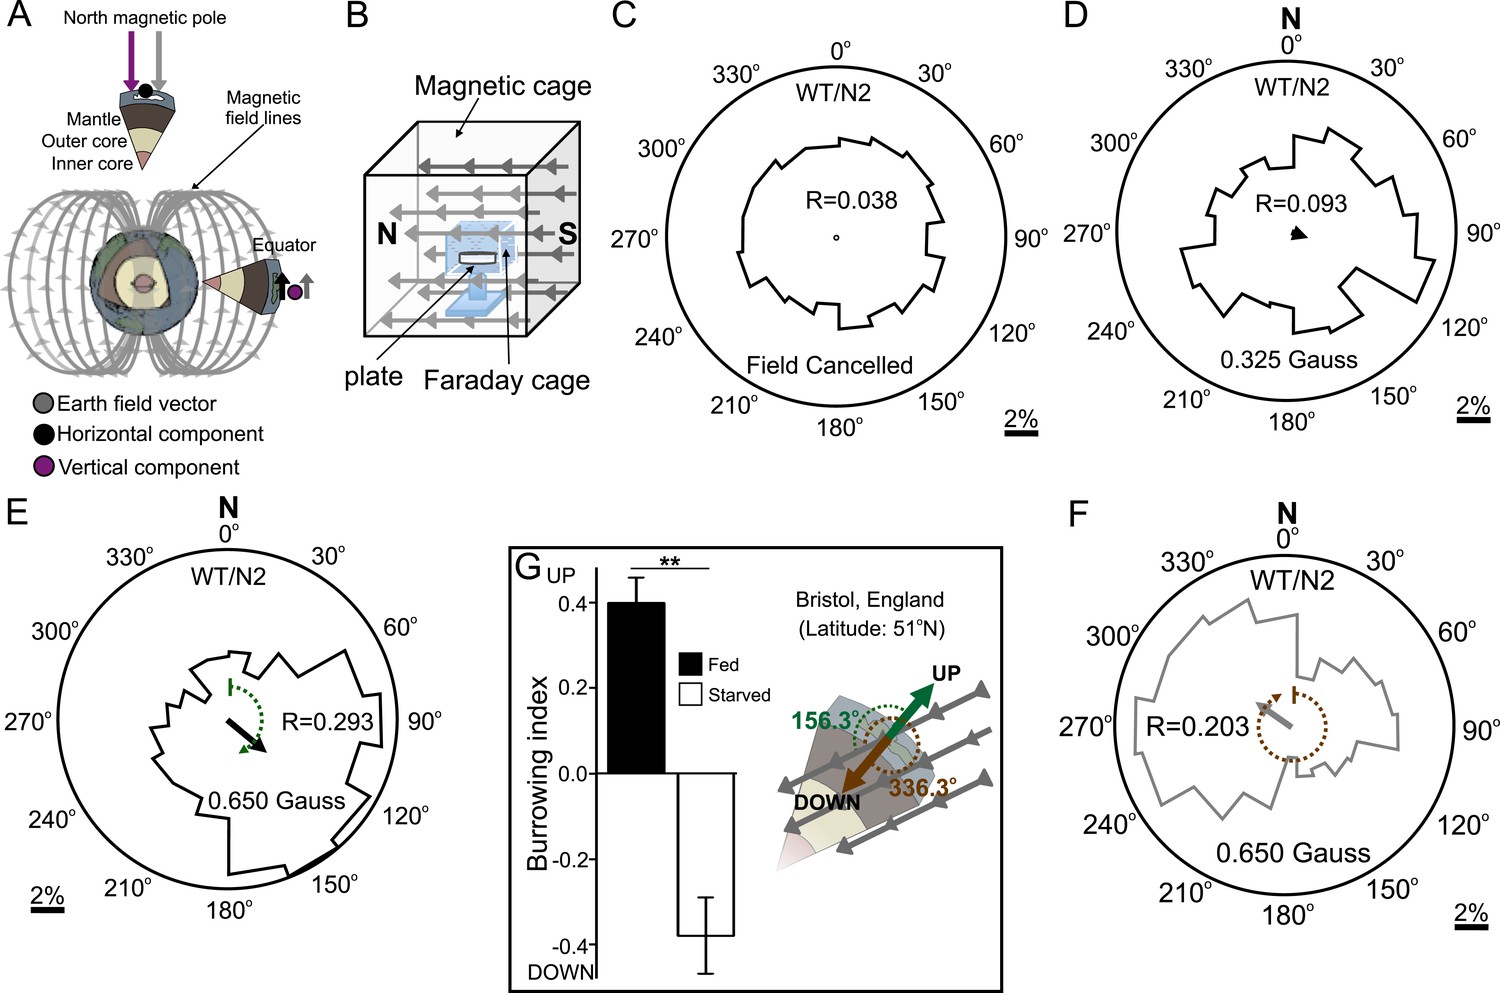
Preferred magnetotaxis orientation to a spatially uniform, earth-strength field depends on satiation state, and local field properties.
(A) The core of the earth generates a magnetic field that bisects the ground at different angles across the planet. The vertical component is strongest at the poles and weakest near the equator. (B) We constructed a Faraday cage within three orthogonal magnetic coil systems to test the response of worms under earth-like magnetic conditions. Circular histograms show the average percentage of worms migrating in each of 18 20-degree-wide headings. The radius of each circle represents 10% of the tested population and the mean heading vector arrow would be as long as the radius if every worm converged on one heading, and have zero length if worms distributed randomly around the plate (see Figure 1—figure supplement 1B for explanation of circular plots). When the magnetic field around them was cancelled C. elegans migrated randomly (C). (D) Worms migrated at an angle to an imposed field when its amplitude was half maximum earth strength (0.325 Gauss). (E) When exposed to a field equaling maximum earth strength (0.625 Gauss), worms showed stronger orientation. (F) Starving the worms for 30 min resulted in animals migrating in the opposite direction to their heading while fed. (G) Burrowing worms mirrored the magnetic coil results with fed worms preferentially burrowing up while starved worms preferentially migrating down. For the standard lab strain N2 (native to Bristol, England) the virtual up and down direction is represented in the circular plots by a green and brown dashed arch and was not found to vary significantly from the mean heading angle of fed and starved worms respectively. For the magnetic coil assays migration along the imposed field would translate animals towards the 0°/N signs.
Figure 2—figure supplement 1
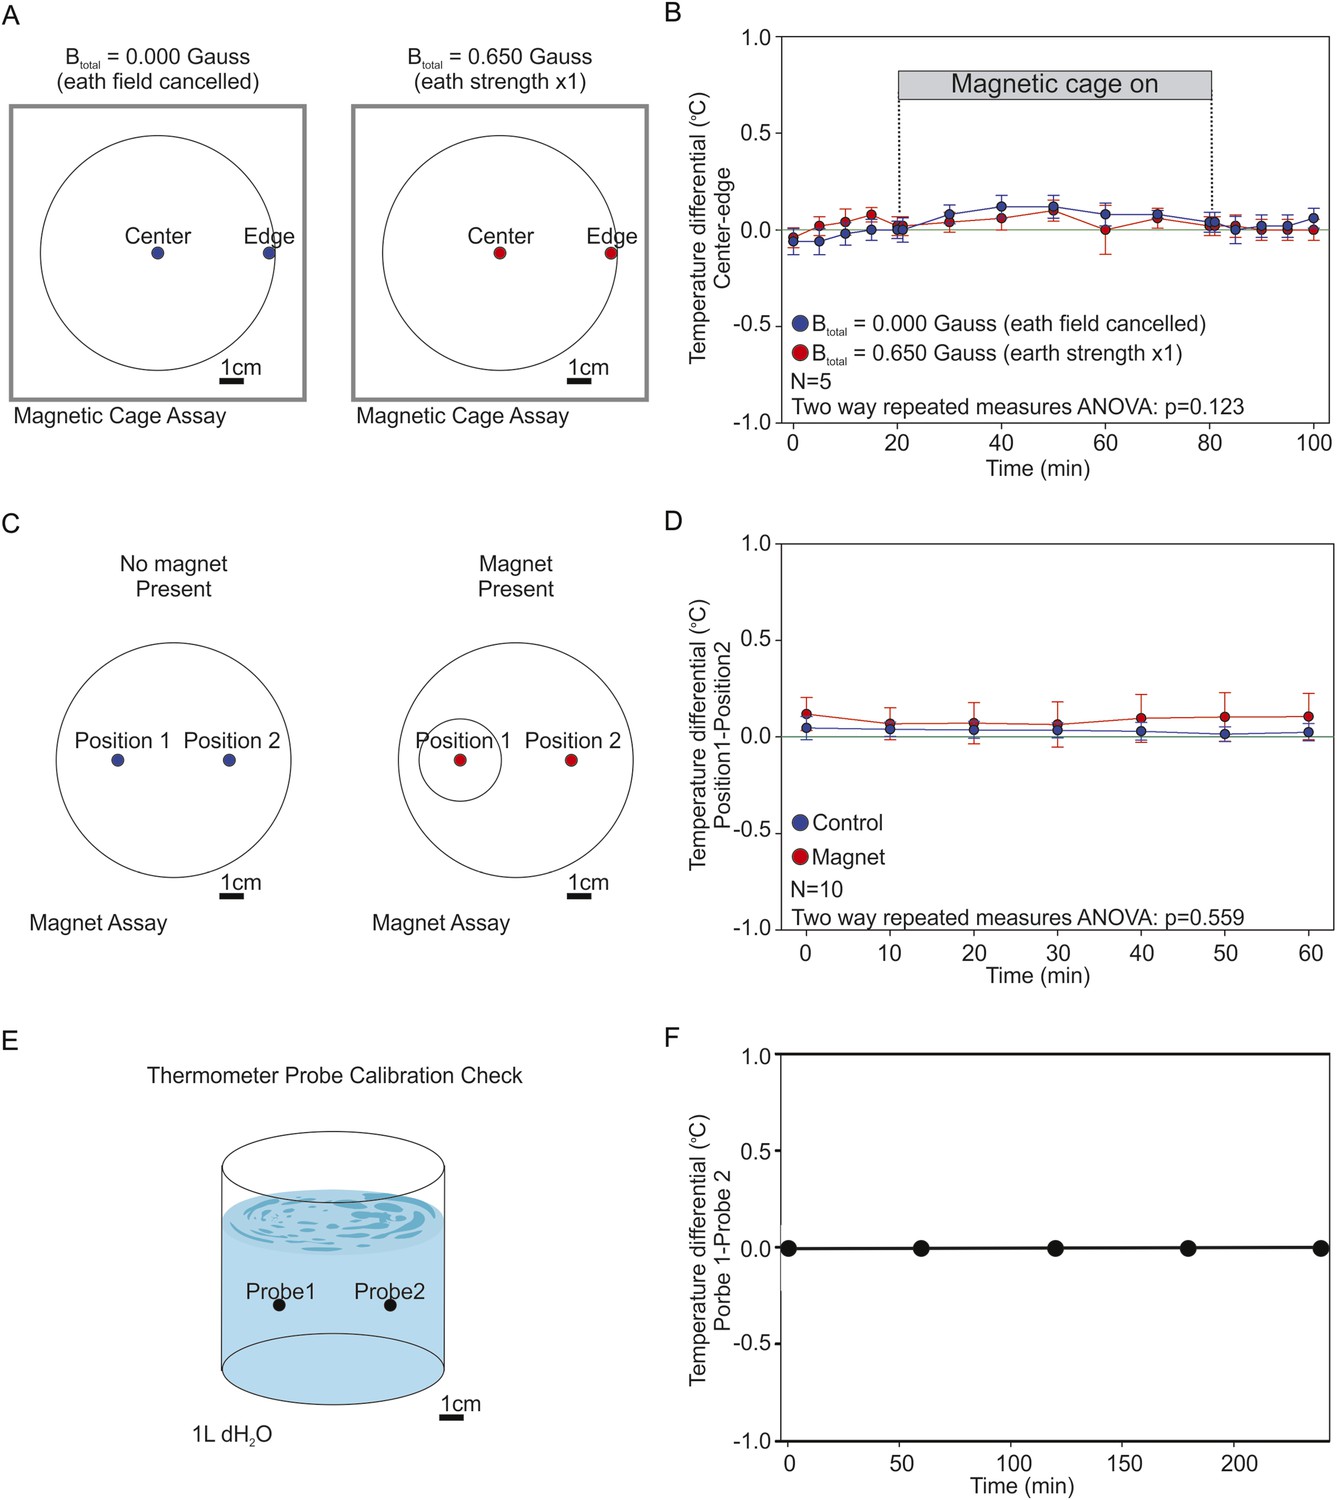
Testing the presence of temperature gradients.
To determine if the artificial magnetic fields introduced unwanted temperature gradients in our assay we used high-accuracy thermometers capable of measuring 1/100 of a degree Celcius. (A) We recorded the temperature inside the coil system at the edge of the assay plate (where worms were tallied), and at the center of the assay plate (where worms began the experiment). We took temperature measurements under two magnetic regiments: when the earth's magnetic field was actively cancelled out inside the cage (0.000 Gauss, blue), and when we created an artificial magnetic field of earth strength inside the cage (0.650 Gauss, red). (B) The temperature difference between the center and the edge of the plate was reported every 5 min for 30 min before powering the cage on; every 10 min for an hour while the cage was on; and every 5 min for 30 min after powering down the cage. A two-way repeated measures ANOVA failed to reveal significant differences between both treatments (p = 0.123). (C) We measured the temperature difference between the end points of our magnet assays. Two temperature probes were placed at the target zones of magnet assay plates in the absence of a test magnet (blue), or when a magnet was present above one of the two test areas (red). (D) We report the difference between both temperature probes every 10 min for 1 hr. A two-way repeated measures ANOVA failed to find a significant difference between the two experimental conditions (p = 0.559). (E) To empirically confirm that both probes were accurately calibrated we placed them inside a beaker containing 1 l of dH2O and compared their readings between experiments. (F) Throughout our experiments both probes remained in agreement within 1/100th of a degree Celsius. In all experiments the two probes were positioned 5 cm apart.
Figure 3
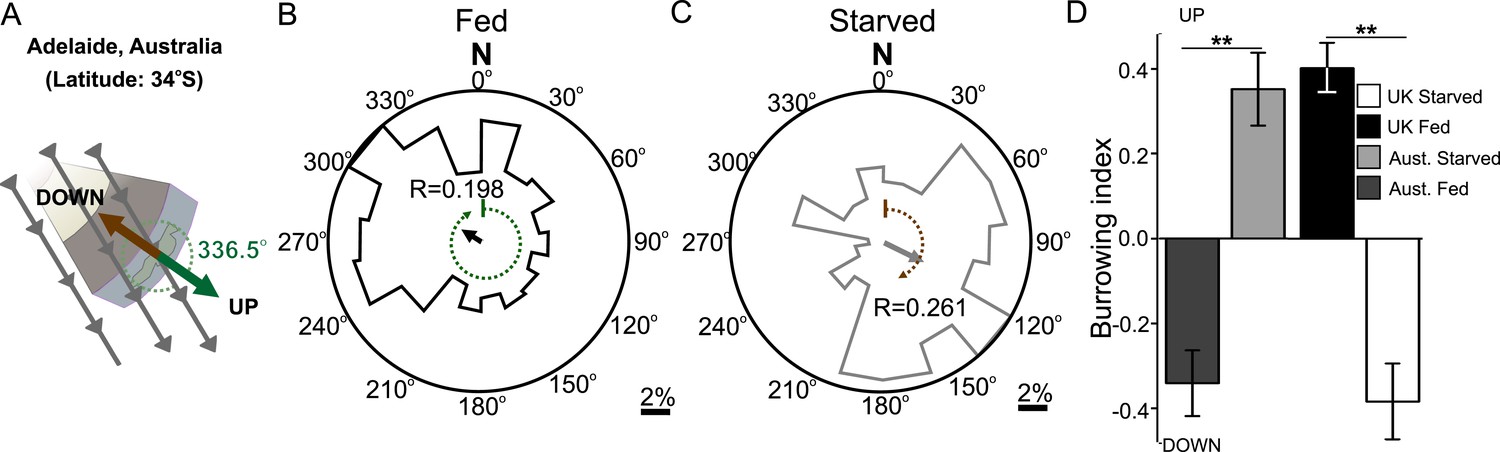
Magnetic orientation varies with satiation state and local field properties.
To investigate if worms from distinct locations around the world displayed different magnetic orientations we tested C. elegans isolated from Adelaide (Australia) where the magnetic field is similar to that of the lab strain (Bristol, England) in strength and inclination but opposite in polarity (A). Worms from Australia showed a magnetotactic response reversed from the British strain. Plots for well-fed (B) and starved (C) worms are shown and the local angle relative to the up and down direction are shown as green and brown dashed arches respectively. For each population, the radius of the circle represents 10% of the animals. The histograms show the percent of the worms that migrated in each of 18 20-degree headings. The mean heading vector shows the average direction of the animals and is equal to zero if all animals migrated randomly, and to the circle radius if all animals migrate on a single heading. (D) We compared the burrowing preference of fed and starved British and Australian worms placed in the local (Texas) magnetic field and found that consistent with our magnetic cage experiments both strains migrated in opposite directions.
Figure 4 with 1 supplement
Magnetotactic variability between wild C. elegans isolates result from differences in local magnetic field properties.
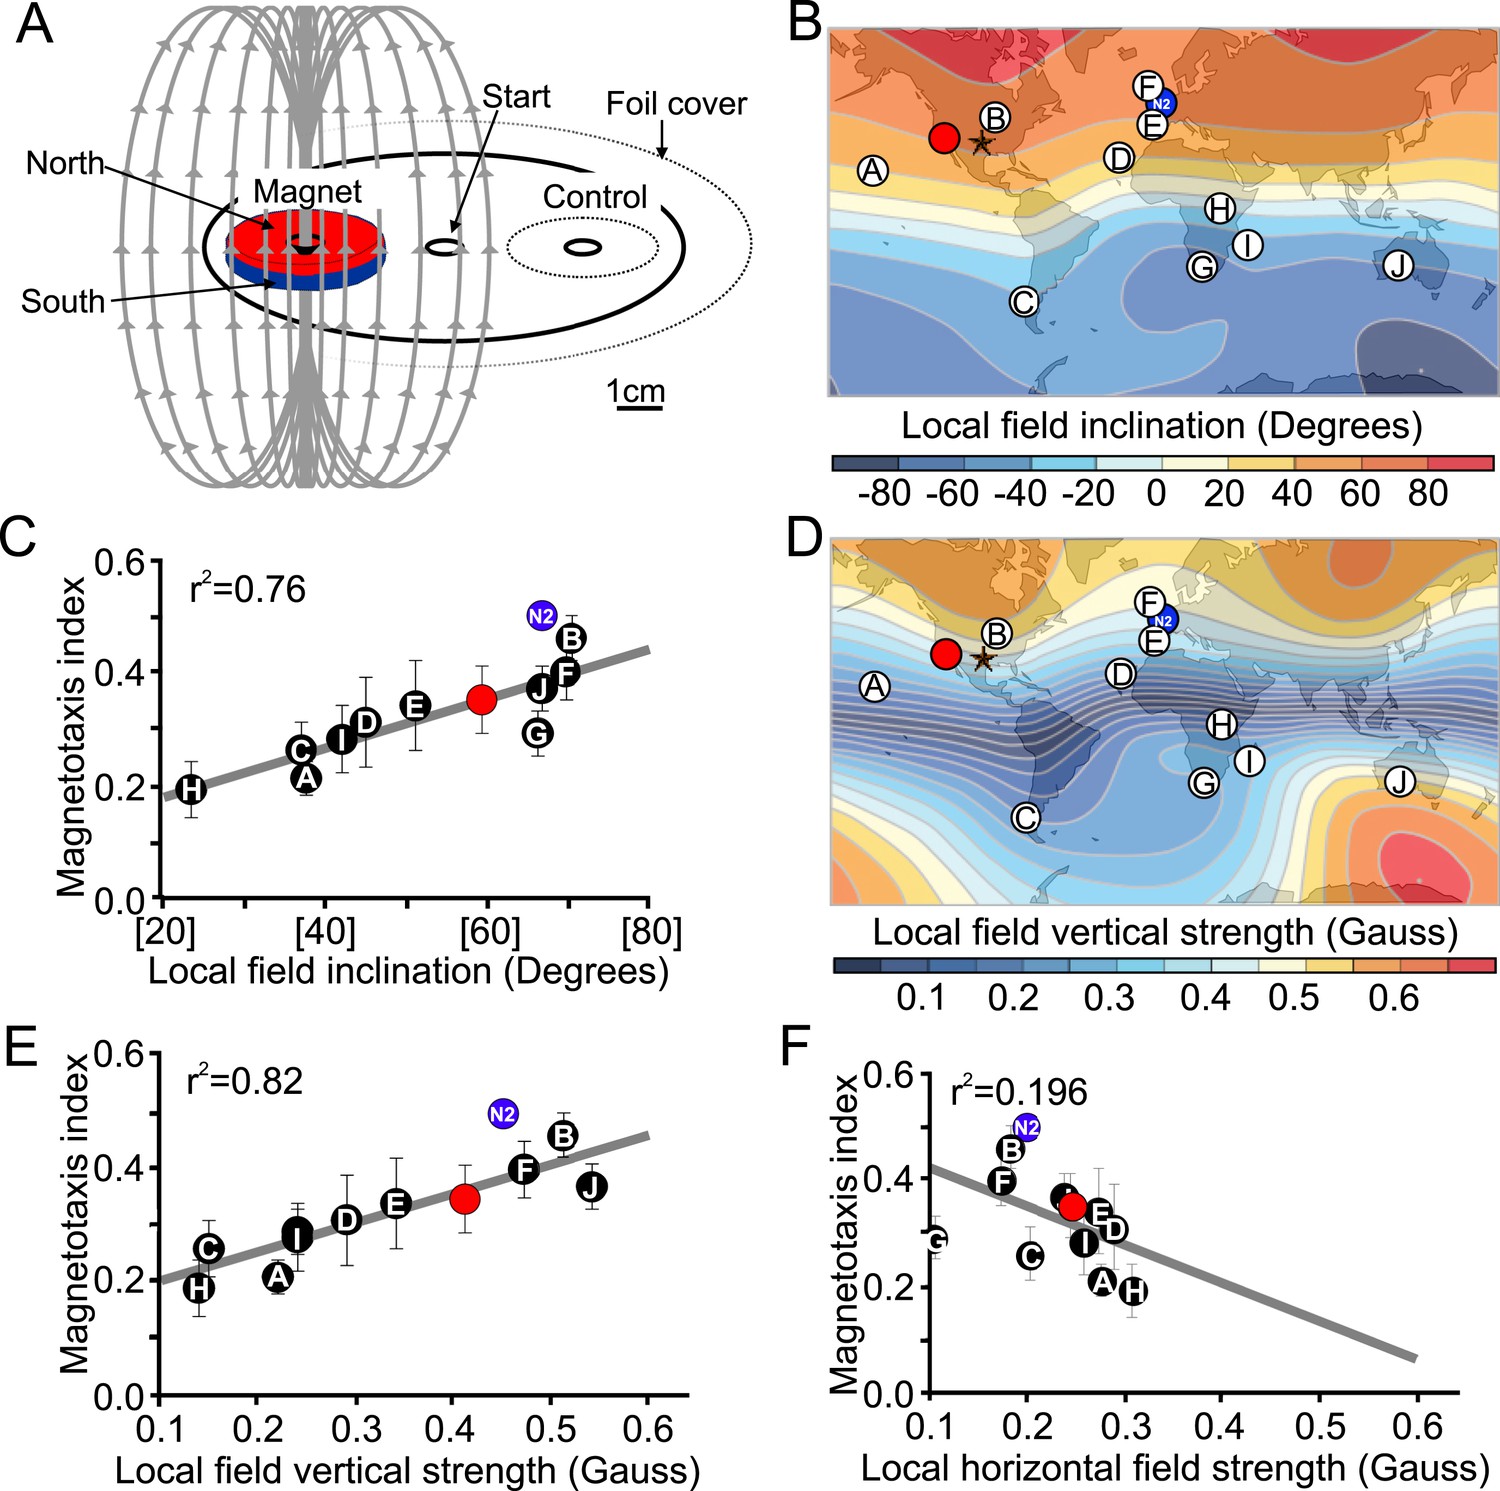
(A) We developed a novel assay to rapidly assess the ability of worms to detect and orient to magnetic fields. Worms placed at the center of a test plate were allowed to migrate freely toward or away from a magnet. The number of animals by the magnet M, or by a control area C were compared and used to calculate a magnetotaxis index: MI = (M − C)/(M + C). Wild-type C. elegans have been isolated across the planet at locations with diverse local magnetic fields. (B) Earth's magnetic field inclination map plotted from data obtained from NOAA (Maus et al., 2009) showing the isolation location for twelve wild-type strains of C. elegans used in this study (circles). (C) The ability of these wild isolates to magnetotax in our magnet assay strongly correlated with the inclination of the magnetic field at their origin. We used the white ten isolates to compute the correlation between these variables. This correlation was able to predict the magnetotaxis index of an additional strain obtained from California (red circle). (D) Map of the vertical component of the earth's magnetic field (Maus et al., 2009). (E) Performance in the magnet assay was even more correlated with the vertical component of the earth's magnetic field. However, the horizontal component of the magnetic field (F) showed no correlation with the magnetotaxis index of the wild isolates. The blue circle represents the lab strain (N2) from England. All assays conducted at location indicated by the lone star. All values reported are means. Error bars represent S.E.M.
Figure 4—figure supplement 1
A new assay for testing magnetotactic ability.
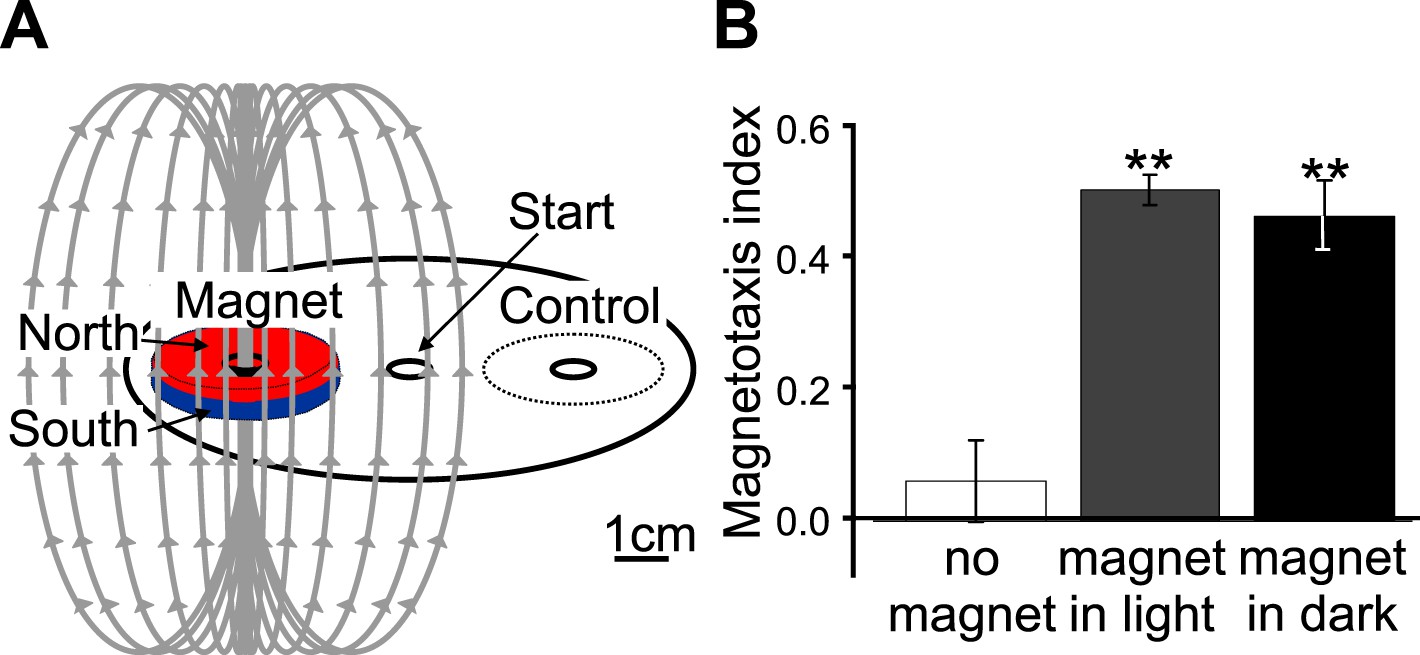
(A) We developed a convenient assay able to determine the ability of worm populations to detect and orient to magnetic fields. Worms were placed in the center of an agar plate. A 1.5 μl drop of anesthetic (NaN3) was placed at the center of two test areas equidistant from the start, and a magnet was then centered above one of the two test areas. We calculated the magnetotaxis index as: Magnetotaxis Index = (M − C)/(M + C). Where M is the number of worms found immobilized by the test area at the magnet, and C is the number of worms immobilized by the control test area. (B) If no magnet was present, worms distributed evenly between the two test areas. If a magnet was introduced above one of the areas, about two thirds of the worms preferentially migrated to the magnet test area. We repeated the experiment in assay plates wrapped in several layers of aluminum foil and observed that migration towards the magnet did not require light.
Figure 5
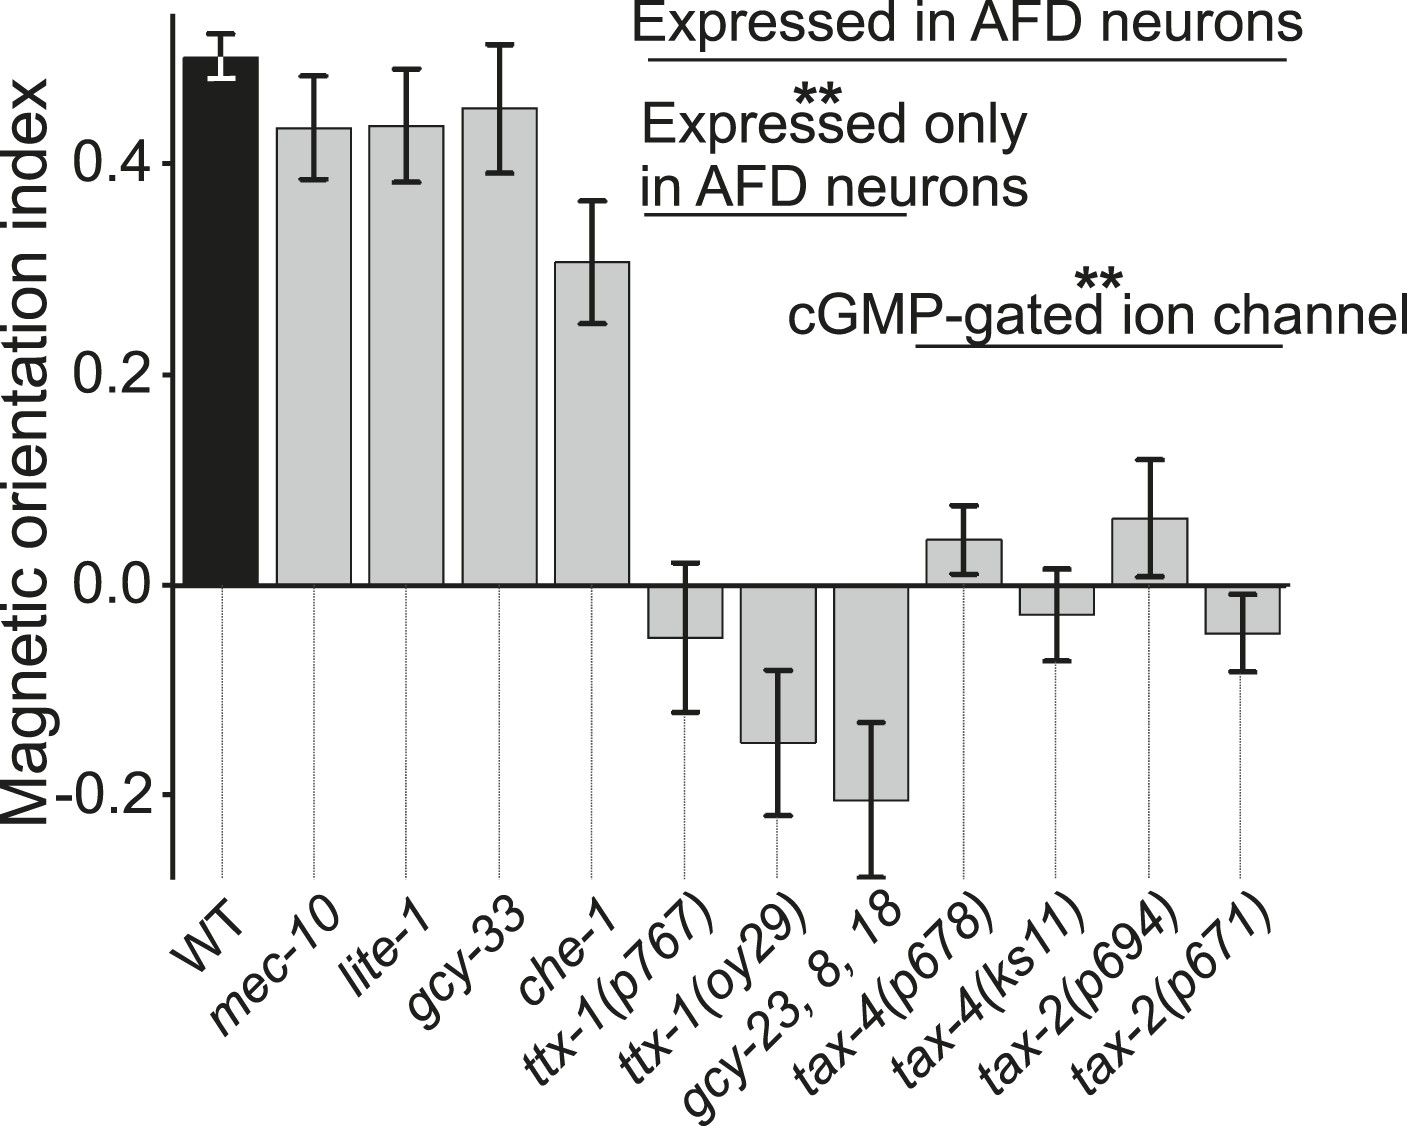
Magnetotaxis requires intact AFD sensory neurons.
We used our magnet assay to test a large number of sensory mutants. Mutations that impair the mechano- (mec-10), light- (lite-1), oxygen- (gcy-33), and taste- (che-1) sensory pathways spared magnetotaxis, while mutations in genes specifically required for AFD sensory neurons (ttx-1 and gcy-23,-8,-18) abolished magnetotaxis. Mutations that impair the cGMP-gated ion channel TAX-4/TAX-2 that are expressed in the AFD sensory neurons (and other cells) similarly prevented magnetotaxis.
Figure 6 with 1 supplement
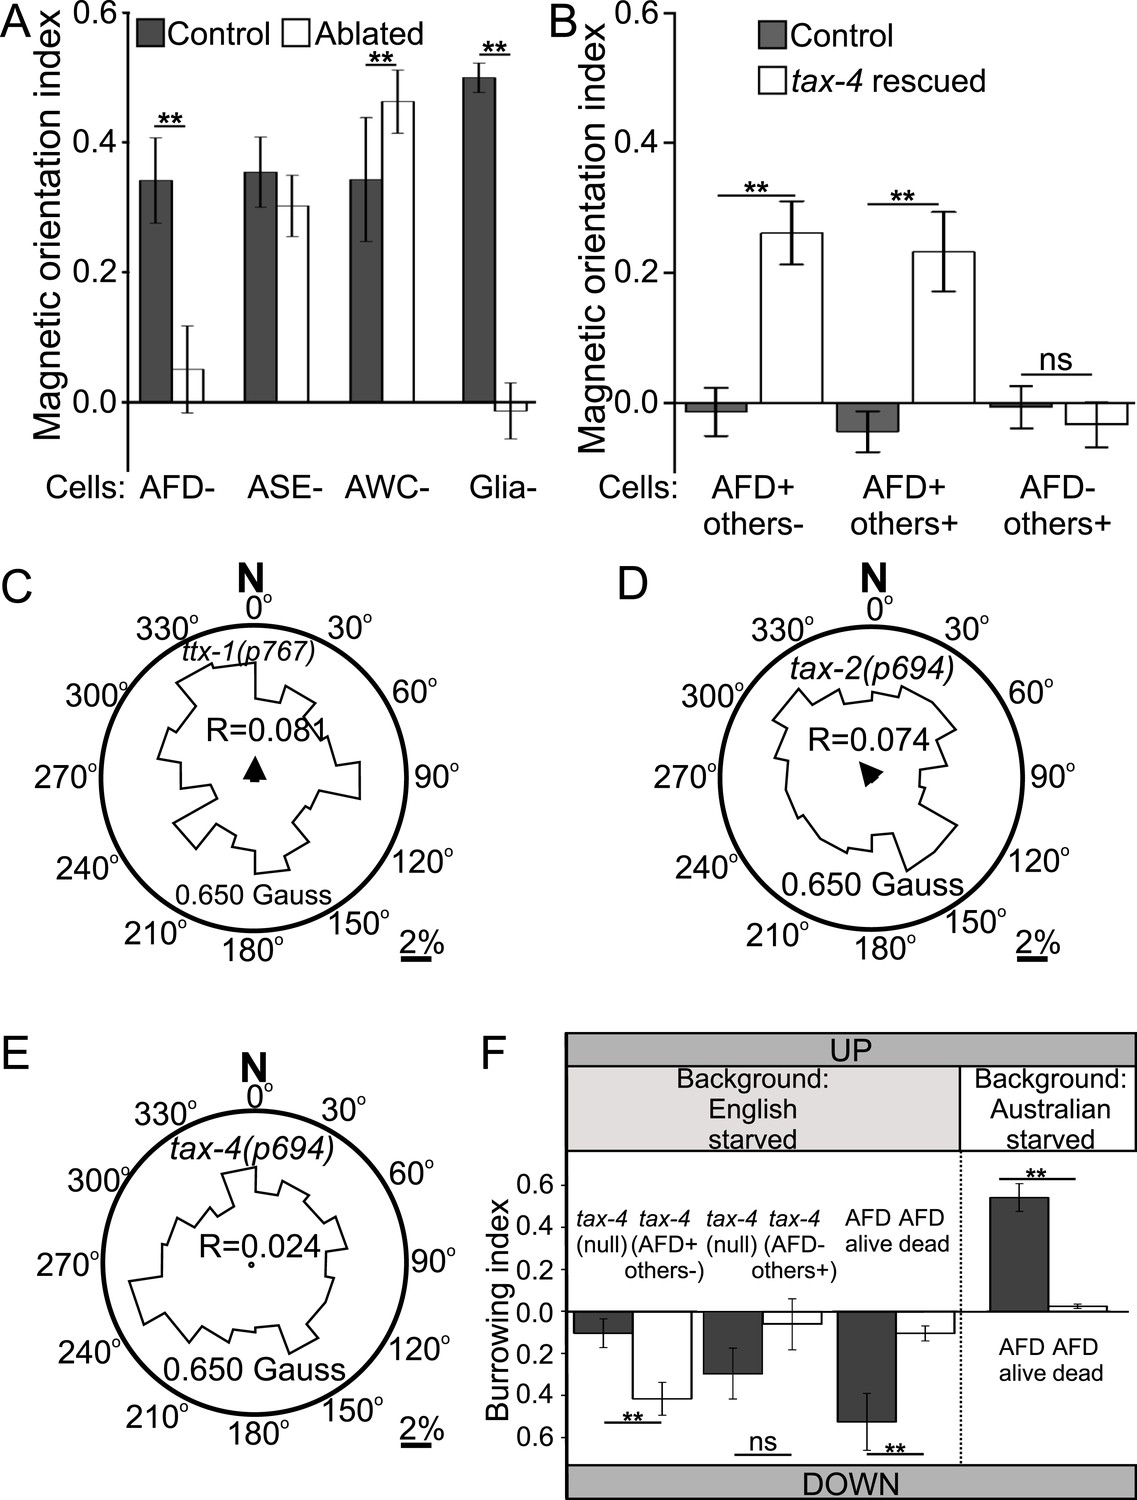
Geomagnetotaxis requires the TAX-4/TAX-2 cGMP-gated ion channel in the AFD sensory neurons.
(A) Genetic ablation of the AFD neurons (or their sensory villi via ablation of amphid glial cells) prevented magnetotaxis. However, ablation of adjacent sensory neurons (ASE and AWC) did not impair this behavior. (B) Genetic rescue of the cGMP-gated ion channel TAX-4 via cDNA specifically in the AFD neurons, or via genomic DNA in additional tax-4-expressing neurons was sufficient to restore magnetotactic ability (white bars) compared to their tax-4-mutant background controls (grey bars). However, rescue of tax-4 expressing neurons that excluded the AFD neurons failed to restore magnetotactic behavior. We retested some of the mutants impaired in the magnet assay in the magnetic coil system under earth-like fields. Impairment of the AFD neurons by mutations in the ttx-1 (C), tax-2 (D), or tax-4 (E) genes resulted in worms that failed to orient to magnetic fields of earth strength (0.625 Gauss). Migration along the imposed field would translate animals towards the 0°/N mark. (F) Genetic manipulations that impaired (or rescued) magnetotaxis had a similar effect on geomagnetotaxis of vertically burrowing worms. Starved British worms lacking the tax-4 gene failed to burrow down. However, control sister worms with the tax-4 gene rescued specifically in the AFD neurons (AFD+ others-) were able to burrow down. Conversely, starved British worms lacking the AFD neurons (AFD dead) failed to migrate down, while control sister worms (AFD alive) migrated down. Ablation of AFD in Australian worms similarly abolished geomagnetotaxis. * p < 0.05, ** p < 0.001. All values reported are means, and error bars represent S.E.M.
Figure 6—figure supplement 1
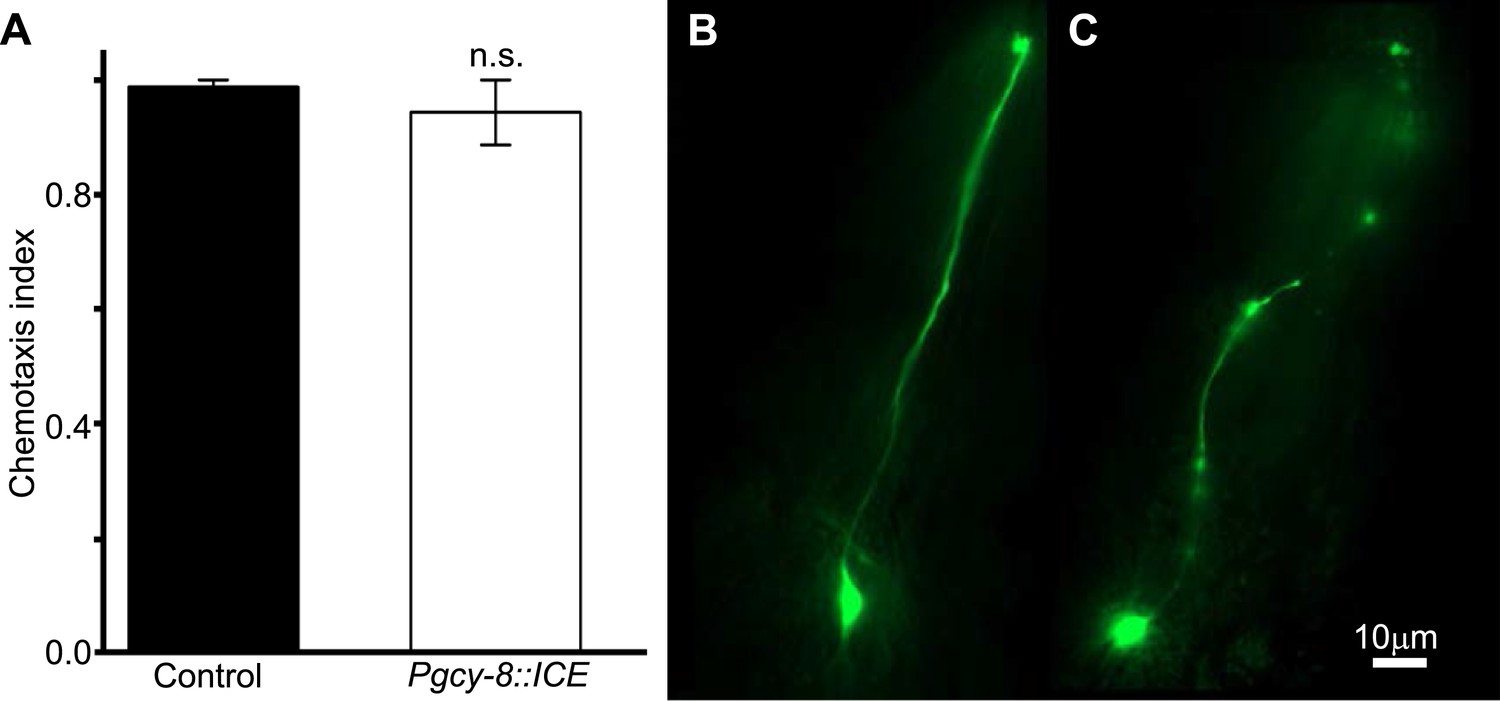
Genetic ablation of AFD does not impair chemotaxis.
(A) Genetic ablation of the AFD neurons did not impair the ability of worms to move, or orient to the chemical attractant diacetyl compared to control sister worms that did not carry a cell-death transgene (ICE). Comparison between the AFD neurons of animals expressing GFP (B), or GFP and ICE (C), revealed that in animals expressing the cell-death gene the AFD neuron is impaired and shows many of the typical signs of neurodegeneration (e.g., circular soma, beaded and fragmented processes).
Figure 7 with 1 supplement
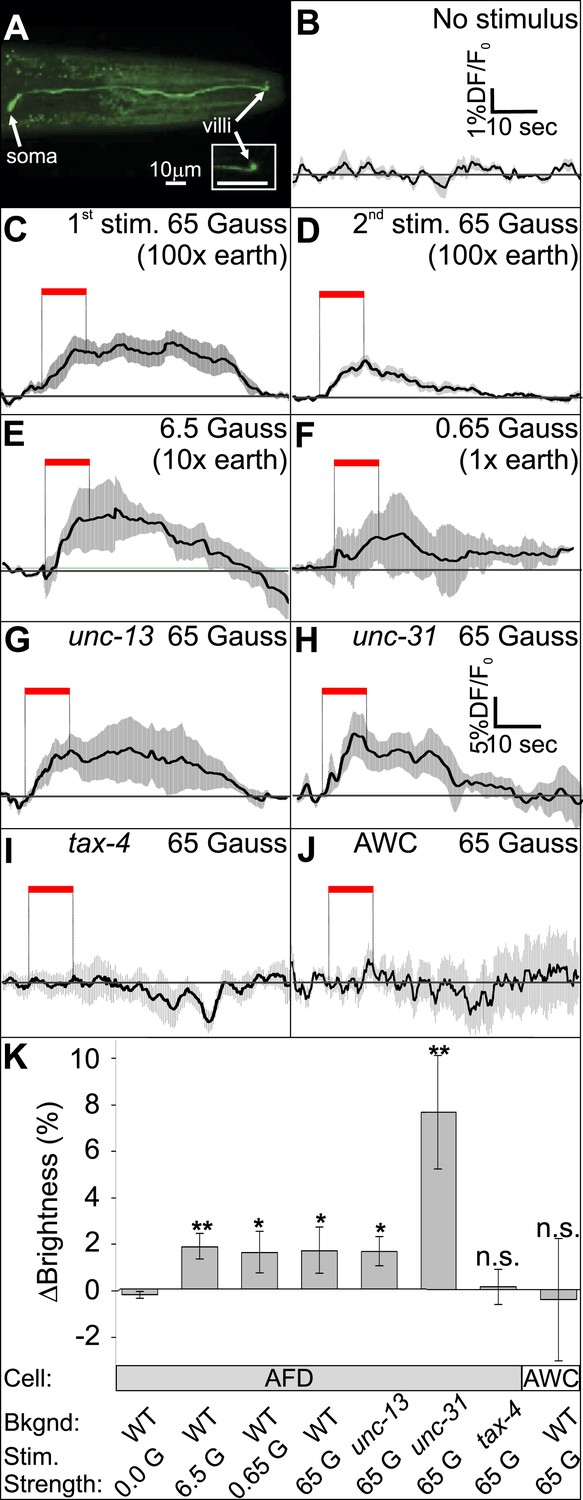
The AFD sensory neurons respond to magnetic stimuli.
(A) Calcium activity indicator GCaMP3 in the AFD neurons. (B) In the absence of a magnetic stimulus the soma of AFD neurons rests at baseline. Exposing restrained worms to a sinusoidal 65 Gauss (100× earth strength) magnetic stimulus caused the soma of the AFD neurons to transiently increase brightness by 2% above baseline in response to the first stimulus (C), and ∼1% in response to subsequent stimuli (D). The AFD neurons responded when the magnetic stimuli was reduced to 6.5 (E) and 0.65 Gauss (F, earth strength). The AFD magnetic response remained even in synaptic mutants (G: unc-13 and H: unc-31) that render these cells synaptically isolated from other neurons. (I) Animals lacking a functional copy of the tax-4 gene did not show an increase in brightness in response to a magnetic stimulus. (J) A 65 Gauss stimulus failed to elicit a response in neighboring sensory neuron AWC. (K) The average soma brightness for the final 4 s prior to stimulus, and the final 4 s of the stimulus were compared. While the ‘no-stimulus’, the ‘tax-4’, and the ‘AWC’ conditions resulted in no significant brightness change, all other test conditions produced a significant increase in AFD brightness above baseline. Change in relative fluorescence key for panels B–J depicted in B with the exception of panel H which has its own key. N = 11 for B–D; 6 for E–H; 14 for I; and 7 for K.
Figure 7—figure supplement 1
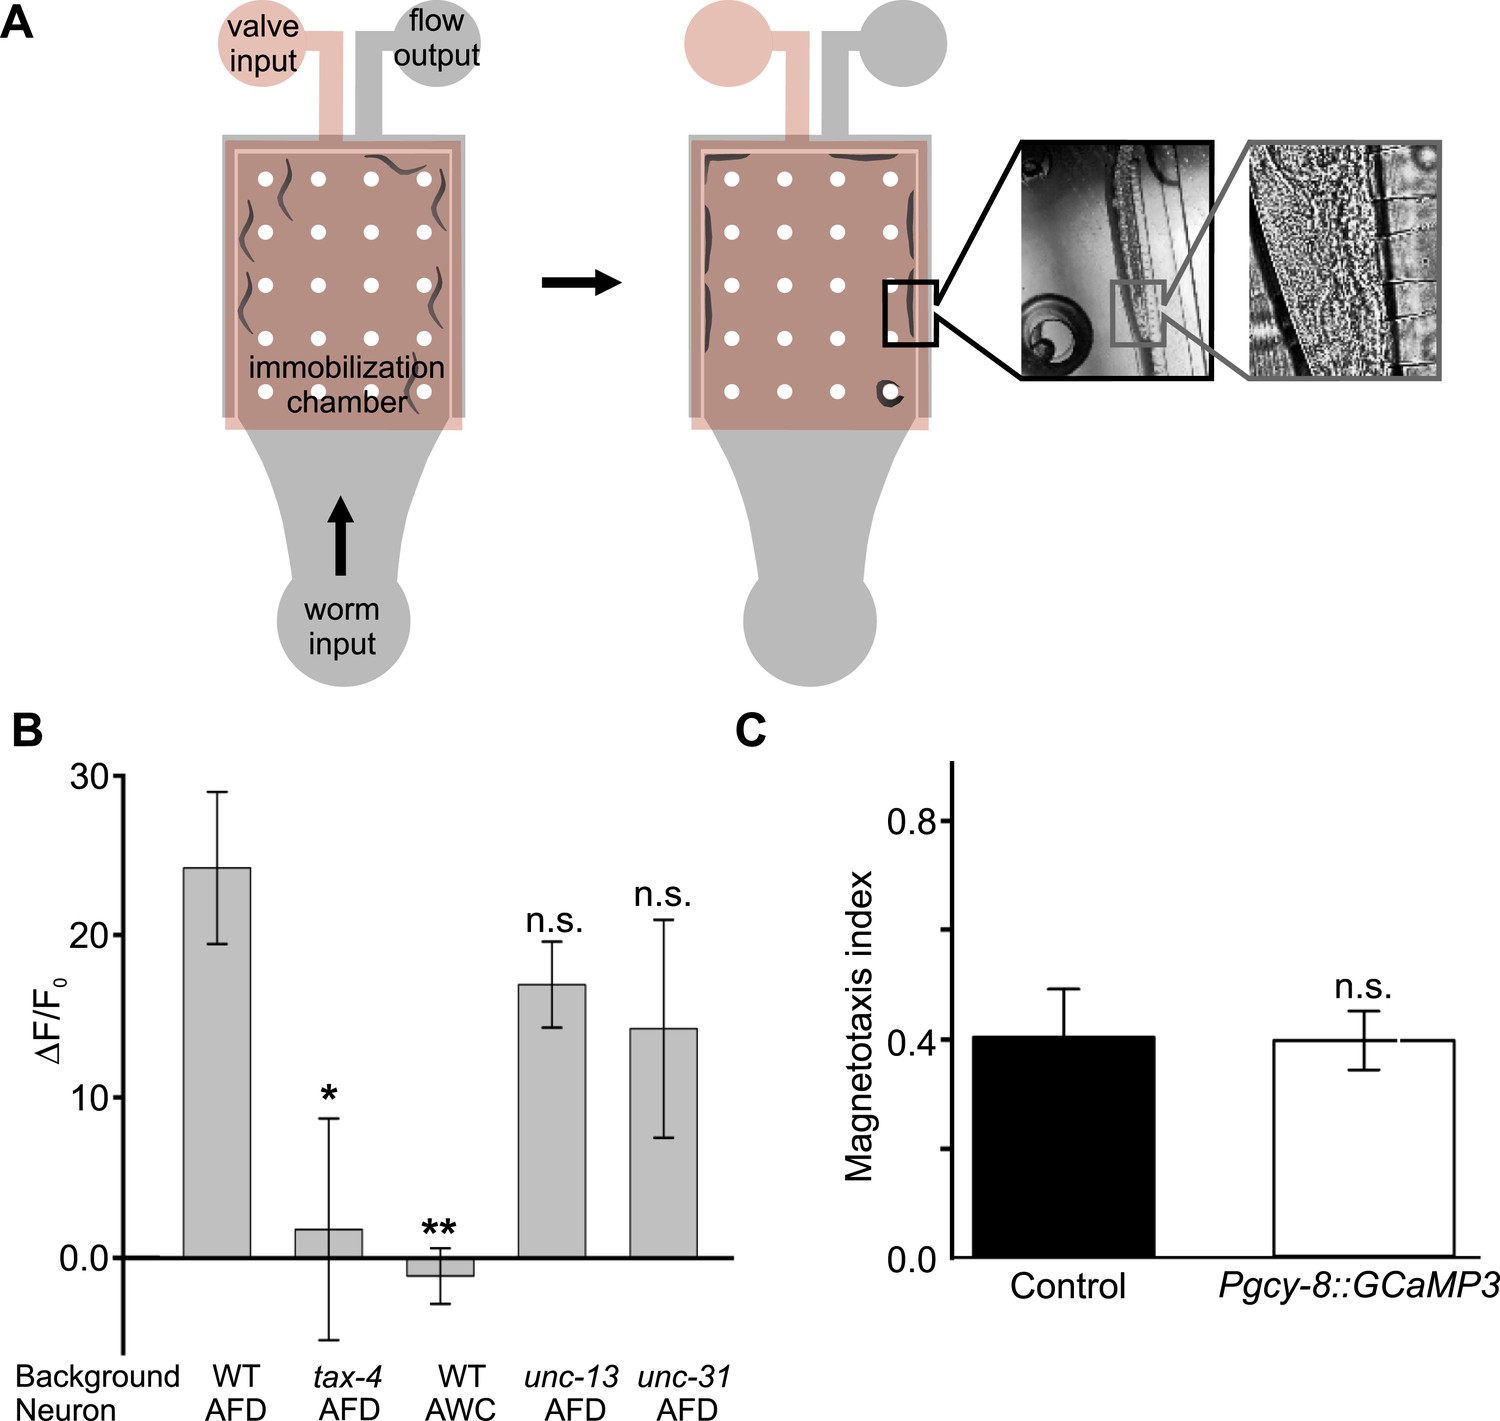
Measuring AFD calcium activity in partially and fully restrained worms.
(A) Worm-immobilization chip for high-resolution fluorescence microscopy. The two-level device consists of a valve layer (pink) sitting above a flow layer where the worms reside (grey). Animals enter the immobilization chamber via the worm input as fluid flow is directed to the fluid output. Small channels across the outer edge of the immobilization chamber permit fluid flow to pass but block the passage of the worms (left). As the flow pushes the worms against the outer edge of the chamber the valve layer is pressurized to fully immobilize the worms (right). A magnified view of a single animal pressed against the small channels along the outer edge of the immobilization chamber is shown during immobilization. (B) Alternatively, we partially restrained worms on an agar pad while measuring the brightness of the AFD (or AWC) sensory neurons before, during, and after exposure to a 60-Gauss magnetic stimulus. Images were taken only when the AFD soma was stationary. While consistent with our immobilized-worm experiments in sign (Figure 7), the amplitude of the responses were about 10 times larger in partially restrained animals. (C) Expression of GCaMP3 in AFD neurons did not impair the worm's ability to orient to magnetic fields. * p < 0.05, ** p < 0.001. All values reported are means, and error bars represent S.E.M.
Additional files
-
Supplementary file 1
(A) Results of statistical comparisons between groups tested in the magnet, burrowing, and chemotaxis assays. Comparisons appear in the order that they were introduced in the text. Two-tailed t-tests were performed between normally distributed groups that had equal variance to test the difference between the populations' means. The Pearson product–moment correlation coefficient was used to determine the correlation between variables. To test difference between means belonging to non-normally distributed samples we used the non-parametric Mann–Whitney ranked sum test. All statistic measures are from comparisons with the group shaded in grey immediately above. Index refers to the mean (magnetic or burrowing) index for each population (see ‘Materials and methods’). (B). Summary of the magnetic coil system results for wild-type animals from three different locations around the world and internal physiological status. Statistical tests were performed using the Circular Statistic toolbox for Matlab (Berens, 2009). Comparisons between different parameters are shown within boxes. (C). Summary of local magnetic field properties and magnet assay results for wild-type worms from twelve different locations around the world (Figure 5). The exact isolation location for the LKC34 (Madagascar) strain is not known. We chose the northernmost location (Antisiranana) for the field properties, although choosing the southernmost location (Toliara) would not have yielded significantly different results. (D). Summary of the magnet-assay results for strains genetically modified to ablate (or to rescue gene function) in selected neurons (Figure 6). (E). Summary of the burrowing assay results (Figures 1–3, 6, Figure 7).
- https://doi.org/10.7554/eLife.07493.015
Download links
A two-part list of links to download the article, or parts of the article, in various formats.
Downloads (link to download the article as PDF)
Open citations (links to open the citations from this article in various online reference manager services)
Cite this article (links to download the citations from this article in formats compatible with various reference manager tools)
Magnetosensitive neurons mediate geomagnetic orientation in Caenorhabditis elegans
eLife 4:e07493.
https://doi.org/10.7554/eLife.07493


