Sleep deprivation suppresses aggression in Drosophila
- Perelman School of Medicine at the University of Pennsylvania, United States
- Howard Hughes Medical Institute, Perelman School of Medicine at the University of Pennsylvania, United States
Figures
Figure 1 with 4 supplements
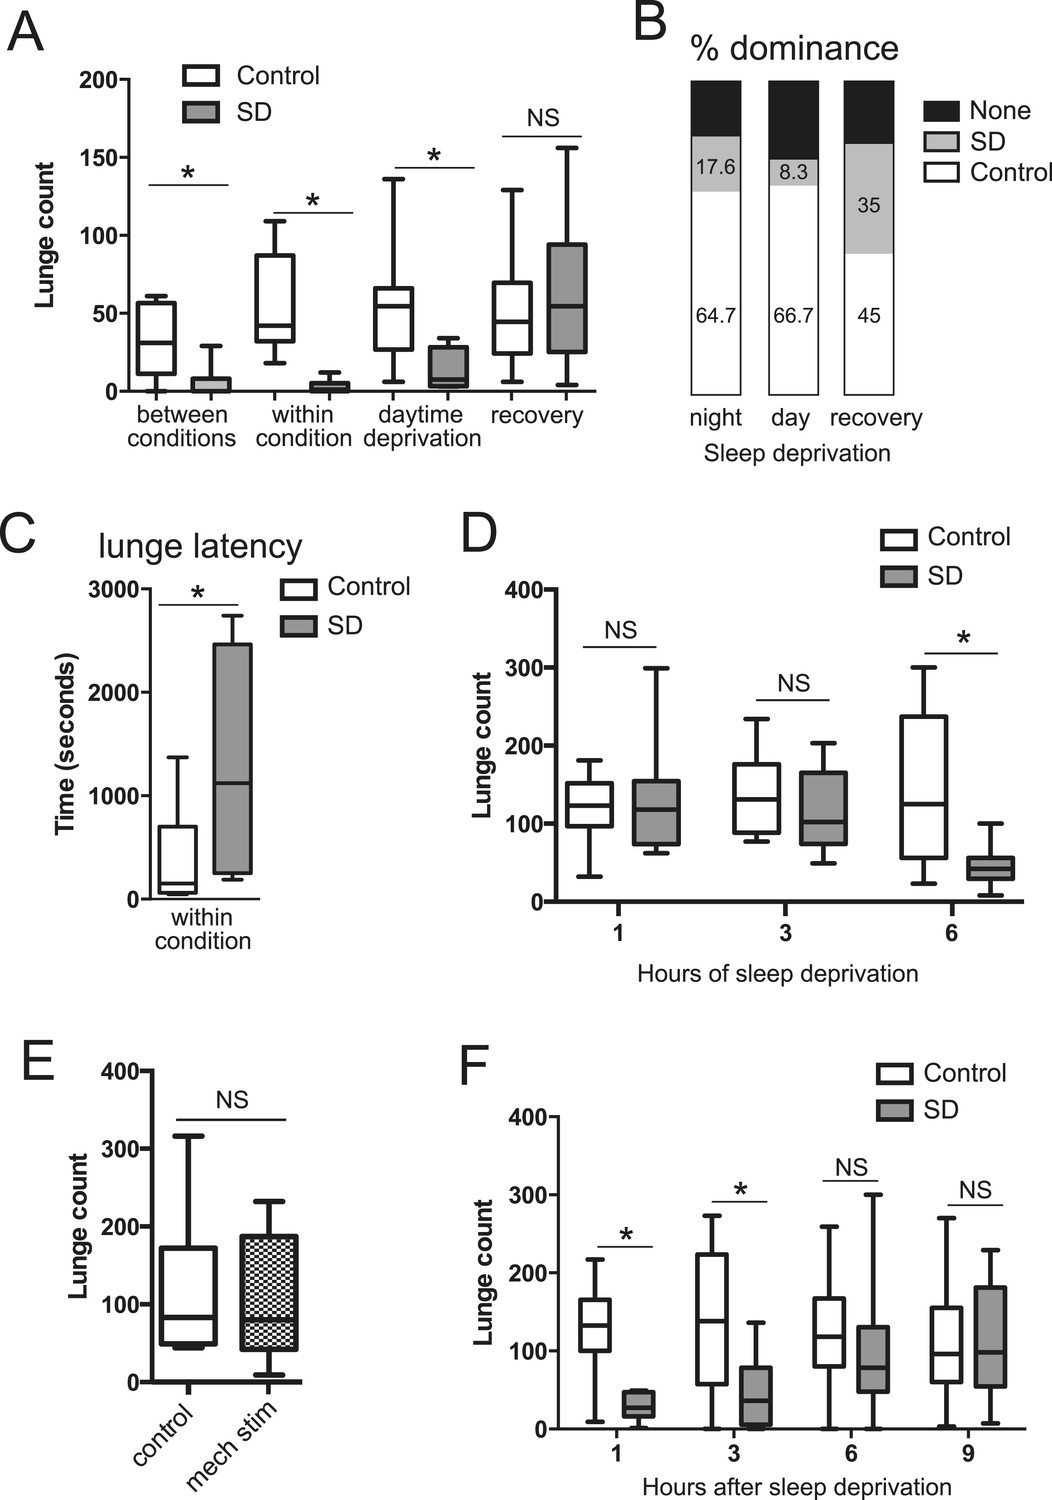
Acute sleep deprivation suppresses aggressive behaviors.
(A) Quantification of aggression (lunge count) in control or sleep deprived male CS flies. ‘Between conditions’ indicates fights between a control fly and a sleep-deprived fly; ‘within condition’ is a fight between 2 sleep-deprived or 2 control flies. ‘Daytime deprivation’ and ‘recovery’ refers to fights between conditions (n = 16, 16, 9, 10, 10, 8, 14, 9 from left to right). (B) Percentage of flies in each condition establishing dominance (fights between conditions). (C) Latency to first lunge following first social encounter (fights are within condition; n = 9 control, 7 deprived). (D) Lunging follow sleep deprivation during the final 1, 3 or 6 hr(s) of the night (fights within condition; n = 8, 8, 13, 9, 12, 12 from left to right). (E) Lunging following 6 hr of mechanical stimulation during the final 3 hr of night and first 3 hr of day (fights within condition; n = 11 for both). (F) Recovery of aggression following prior sleep deprivation for 12 hr (fights within condition; n = 10, 10, 18, 17, 19, 18, 15, 12 from left to right). Box plots in this figure and all others represent median value (horizontal line inside box), interquartile range (height of the box, 50% of the data within this range), and minimum and maximum value (whiskers). Bar graphs in this figure and all others are presented as mean ± s.e.m. *p < 0.05; 1 way ANOVA with Tukey's (A, D) or Sidak's (F) post-hoc test; unpaired two-tailed Student's t-test (C, E). SD = sleep deprivation.
-
Figure 1—source data 1
Quantification of lunging following mechanical sleep deprivation.
- https://doi.org/10.7554/eLife.07643.004
Figure 1—figure supplement 1
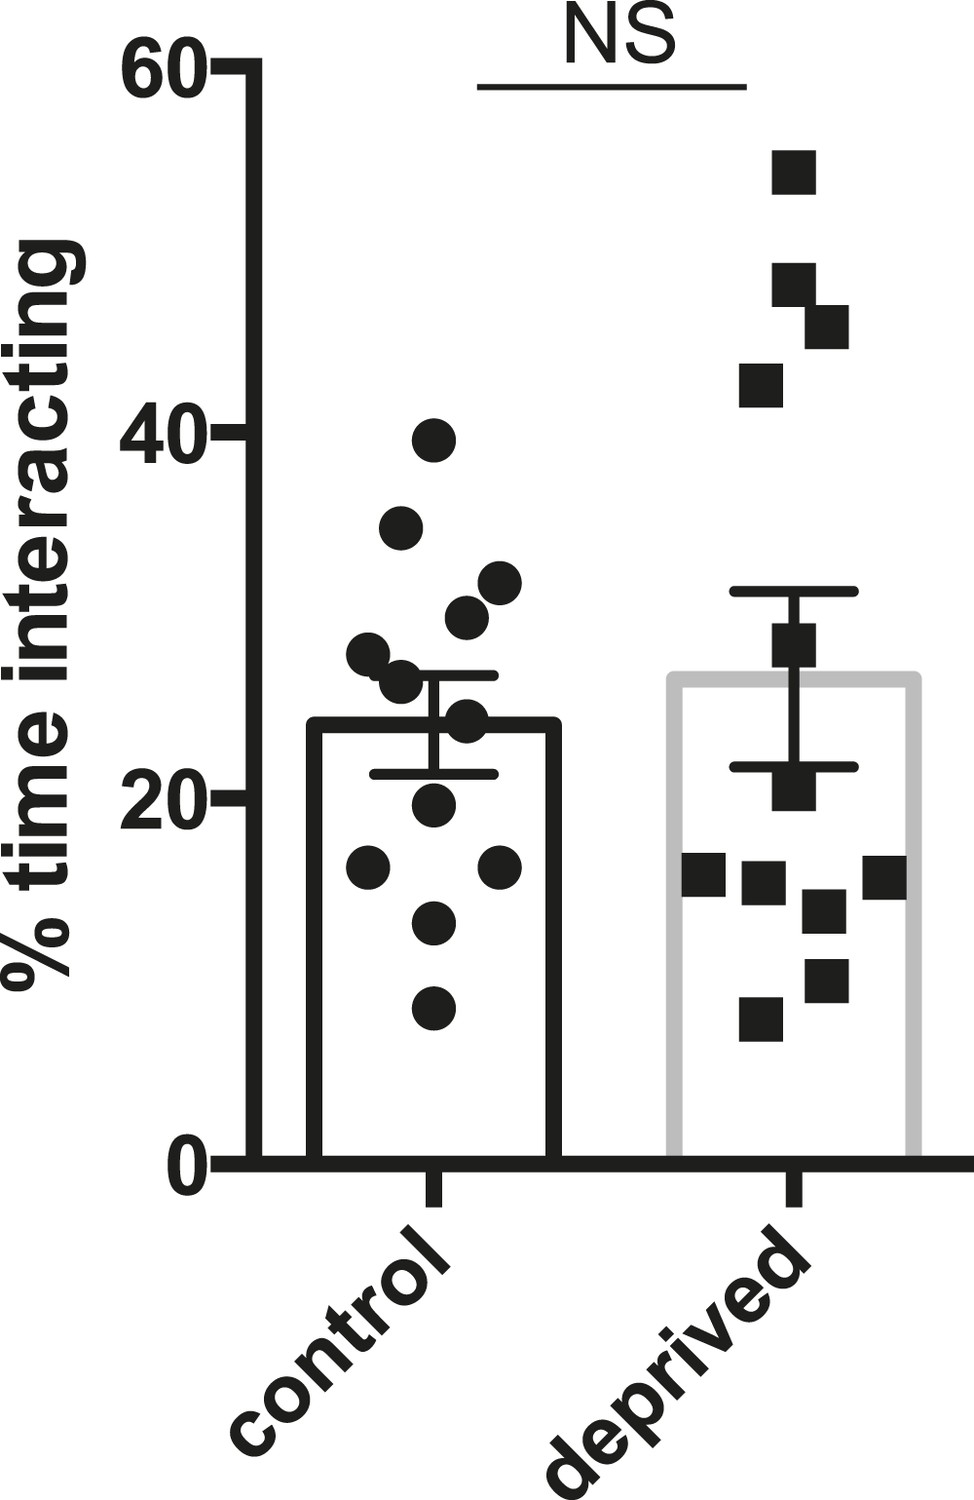
Quantification of percentage of time pairs of flies spent interacting, with or without prior sleep deprivation (n = 12 pairs for control and deprived).
Unpaired two-tailed Student's t-test.
Figure 1—figure supplement 2
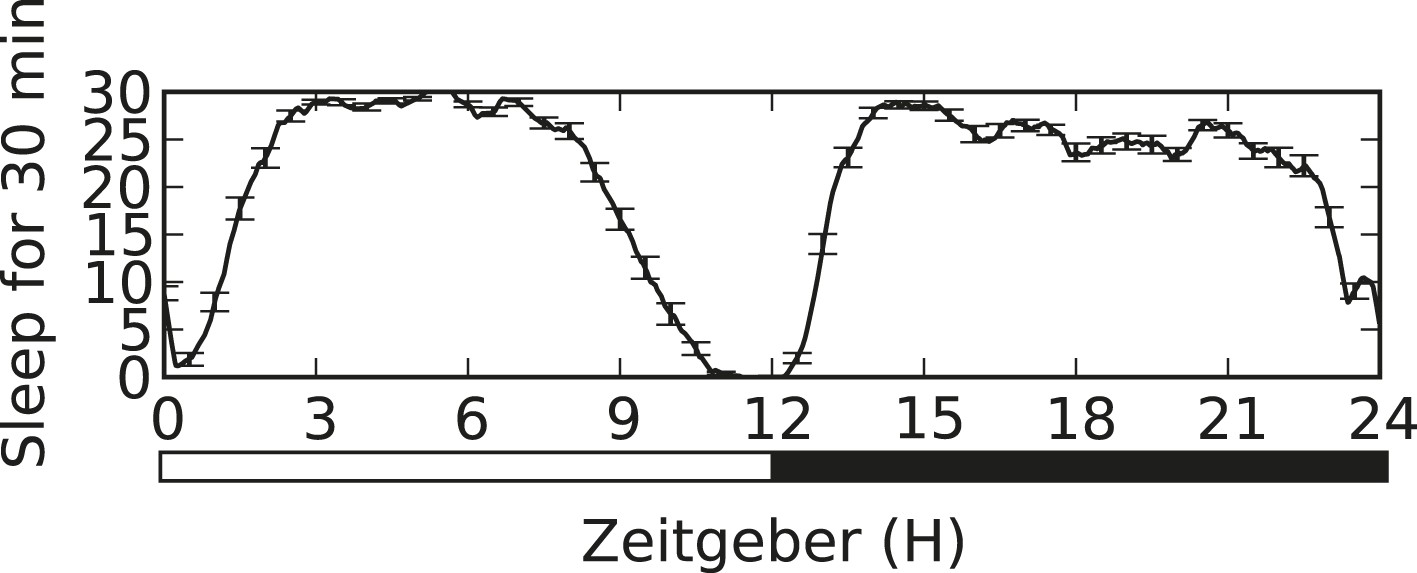
Sleep trace of CS male, showing high sleep amounts during both day and night (n = 22 flies).
https://doi.org/10.7554/eLife.07643.006
Figure 1—figure supplement 3
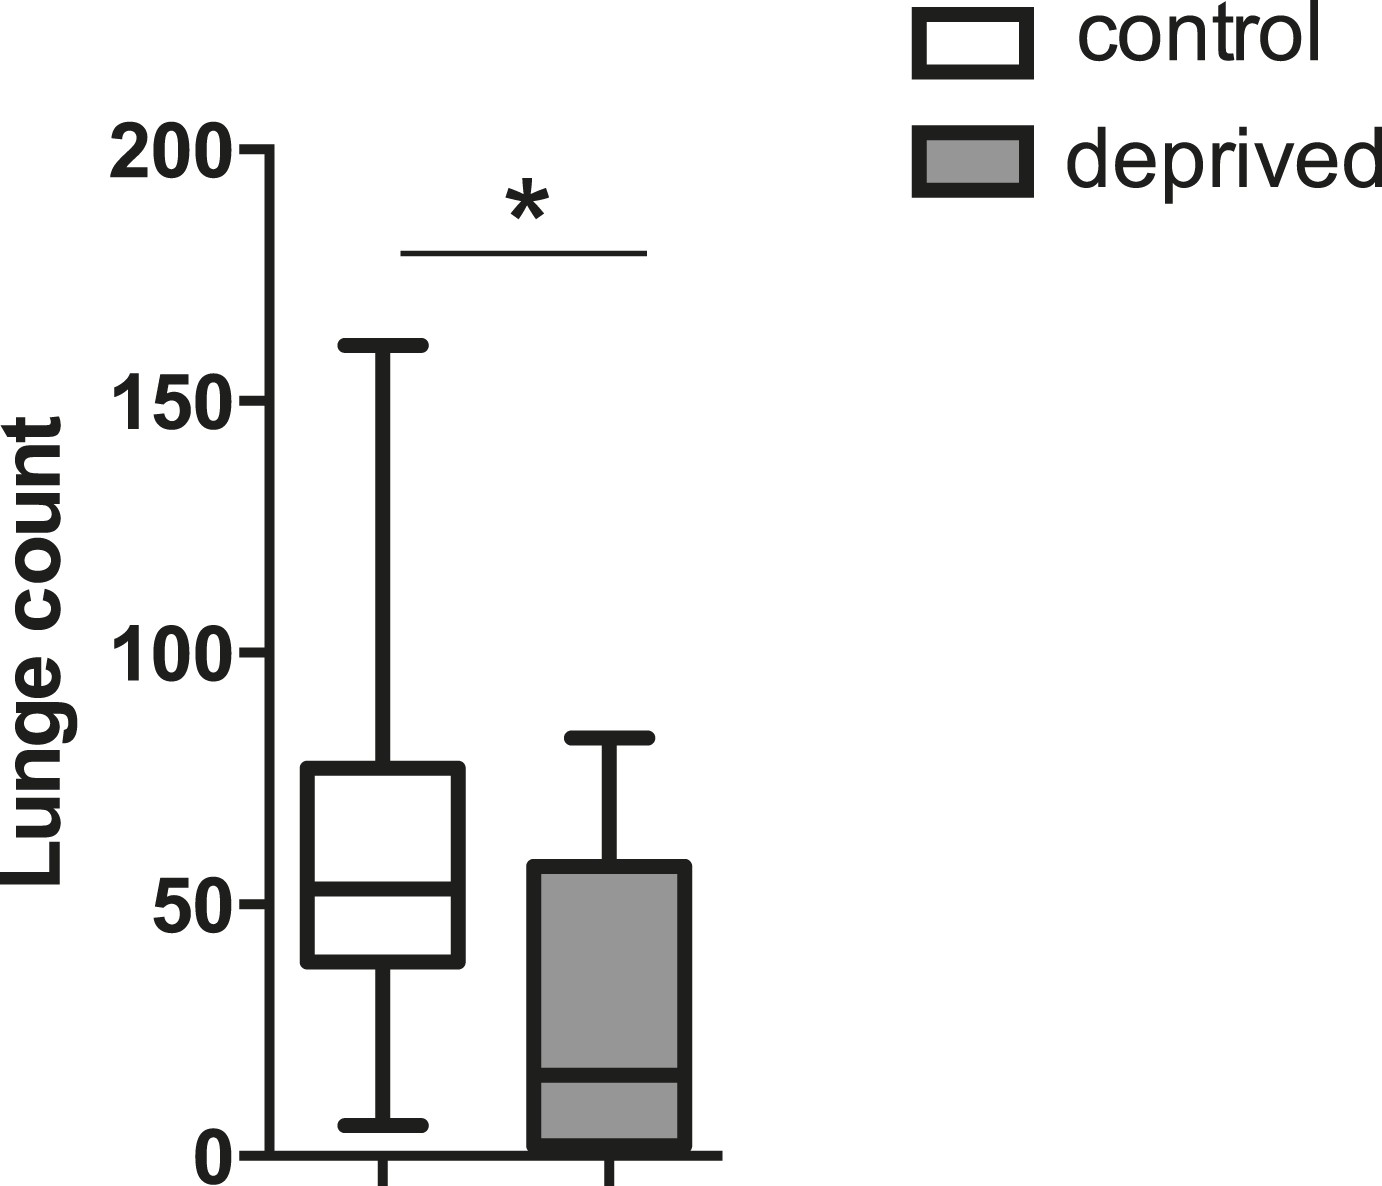
Quantification of aggression following 12 hr of high temperature (31°C) -induced sleep deprivation (fights within condition at 25°C; n = 21 control, 28 deprived).
*p < 0.05; Unpaired two-tailed Student's t-test.
Figure 1—figure supplement 4
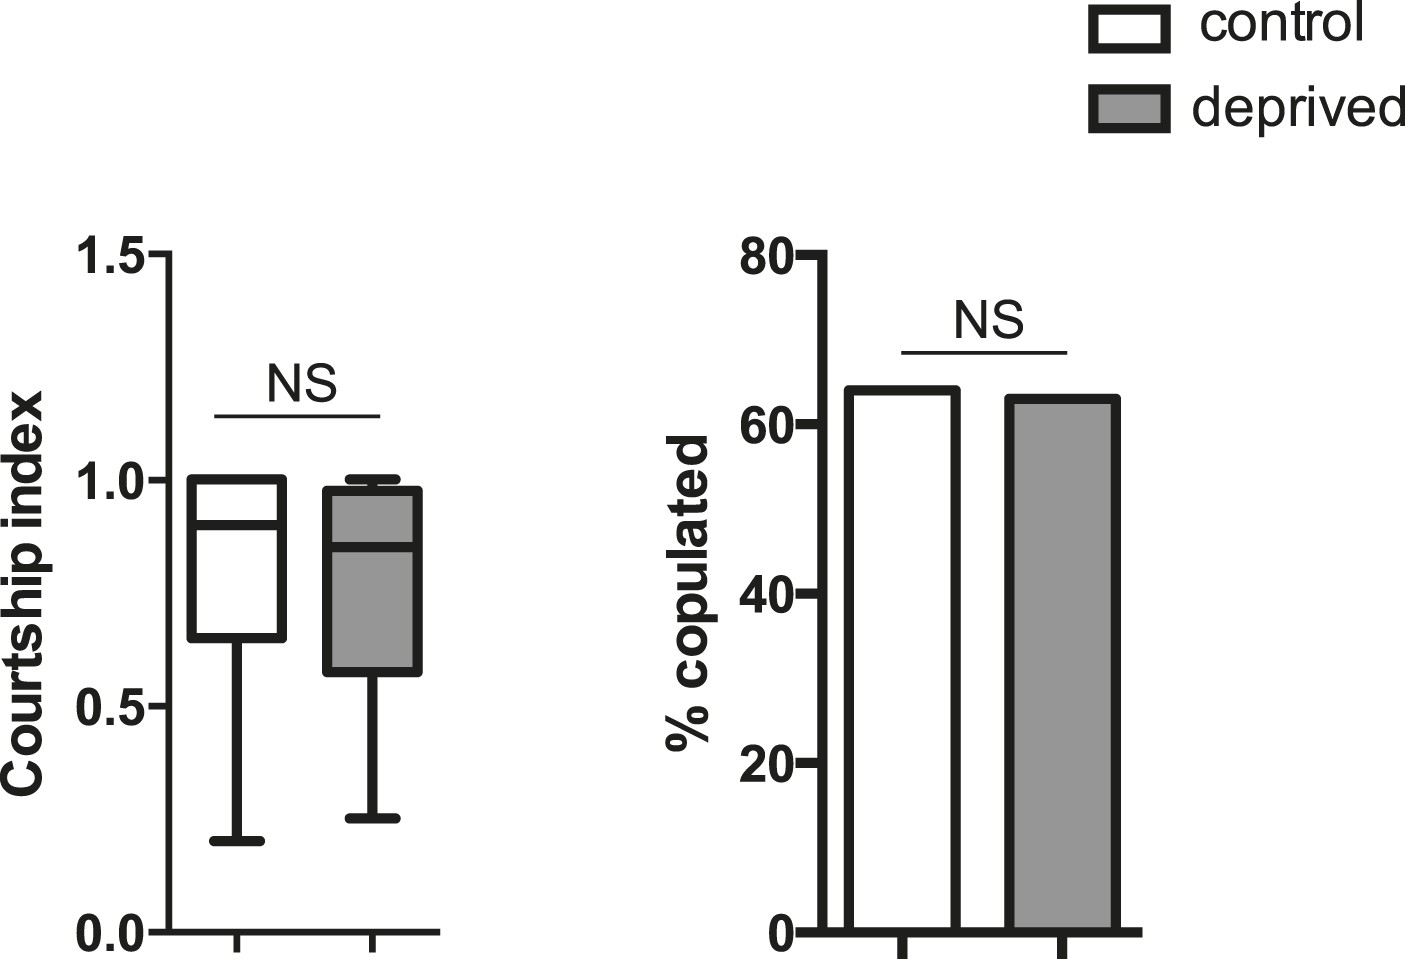
Courtship index and copulation frequency of control or mechanically sleep-deprived males (n = 15 control and deprived).
Unpaired two-tailed Student's t-test (courtship index); Fischer's exact test (copulation frequency).
Figure 2 with 4 supplements
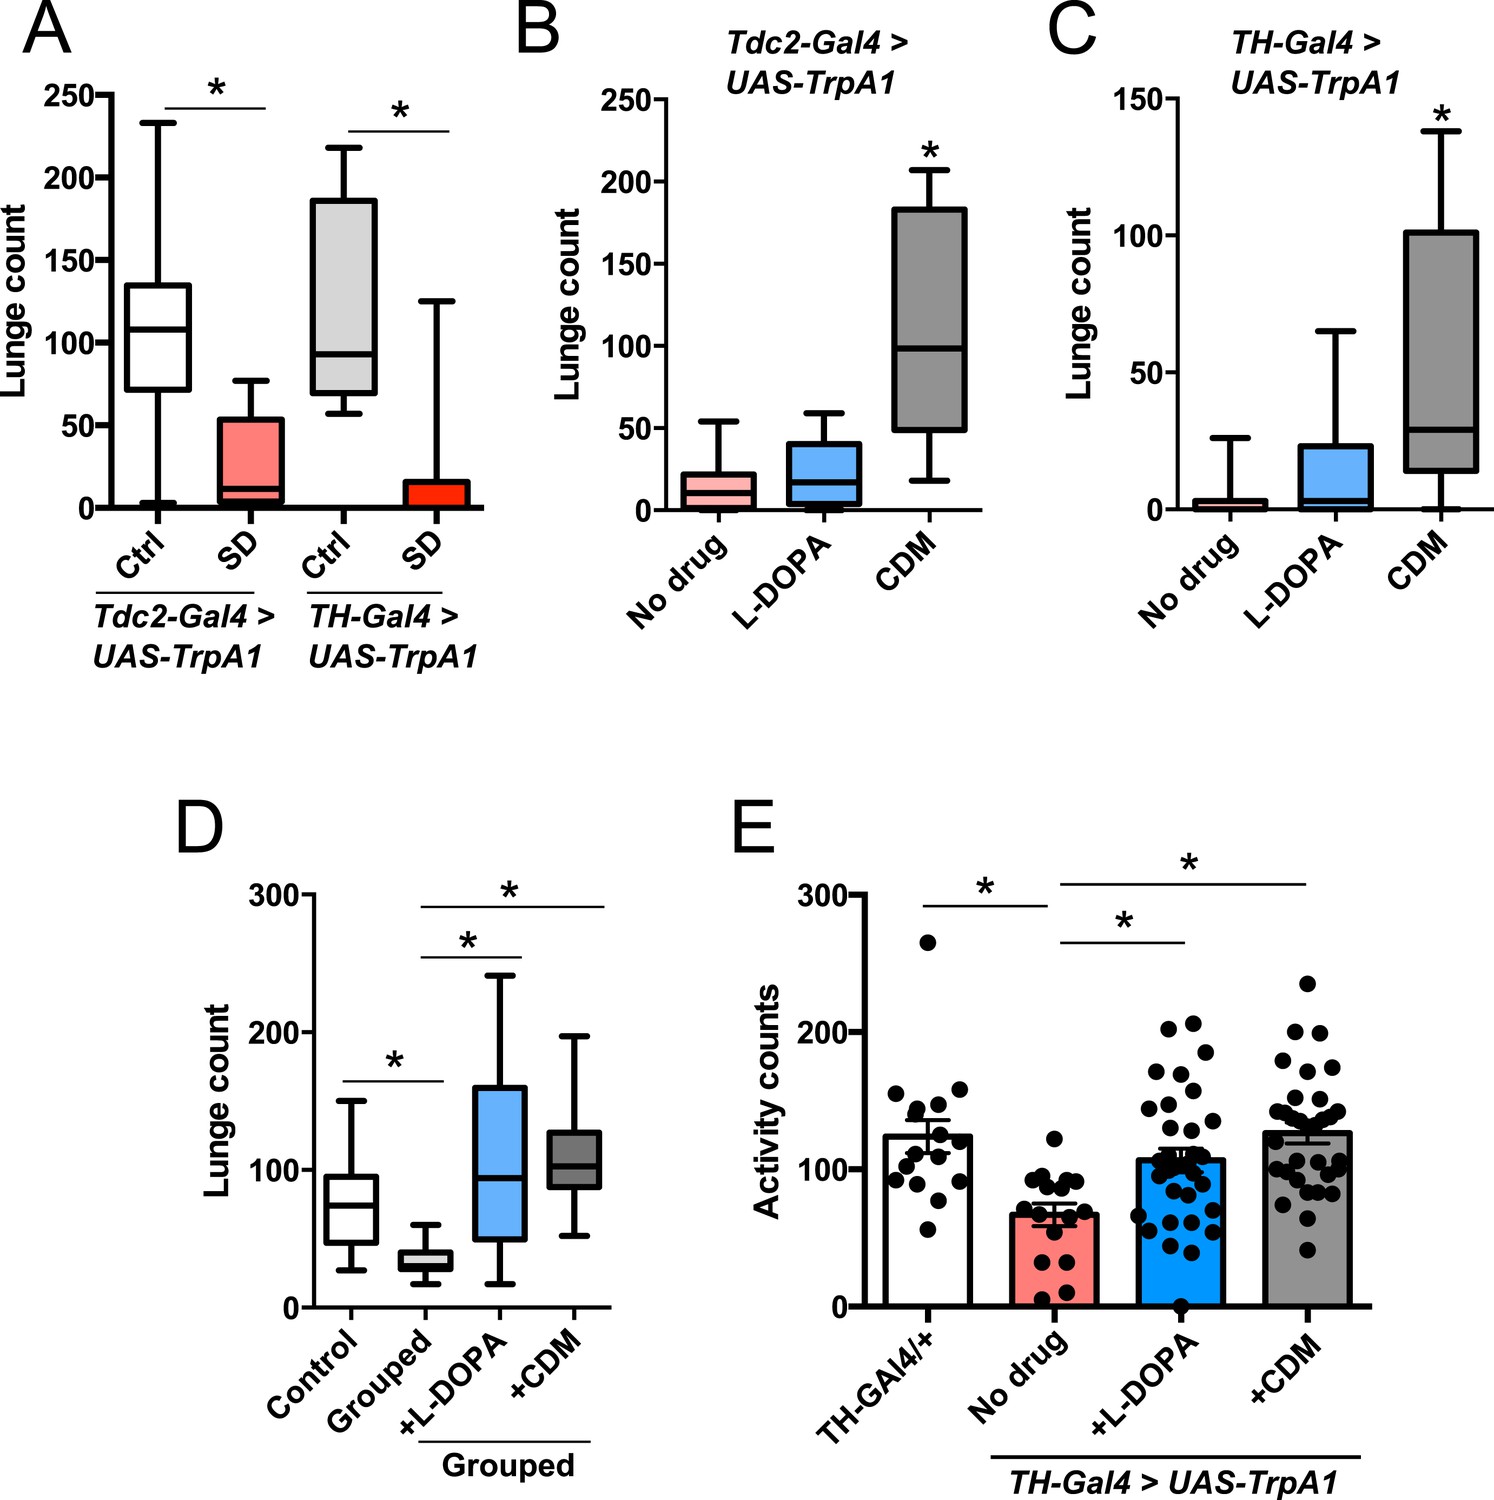
Octopamine agonist CDM rescues reduced aggression following sleep deprivation.
Quantification of aggression at 23°C in Tdc2-GAL4>UAS-TrpA1 or TH-GAL4>UAS-TrpA1 males that were thermogenetically sleep-deprived the prior night at 29°C (SD, red bars) or remained at 21°C (Ctrl, white/gray bars) (n = 10, 16, 10, 12 from left to right). (B, C) Rescue of suppressed aggression in Tdc2-GAL4>UAS-TrpA1 (B) or TH-GAL4>UAS-TrpA1 (C) males fed either CDM or L-DOPA and thermogenetically sleep-deprived (B, n = 12, 10, 10; C, n = 12, 12, 12 from left to right). (D) Rescue of suppressed aggression in group-housed CS males fed either CDM or L-DOPA compared to males reared in isolation (Control) (n = 9, 9, 12, 12 from left to right). (E) Locomotor activity over 1 hr following exposure to 29°C the prior night (n = 16, 16, 32, 32 from left to right). All fights are within condition. *p < 0.05; 1 way ANOVA with Sidak's (A) or Tukey's (B–E) post-hoc test.
-
Figure 2—source data 1
Quantification of lunging following thermogenetic sleep deprivation and pharmacologic rescue.
- https://doi.org/10.7554/eLife.07643.012
Figure 2—figure supplement 1
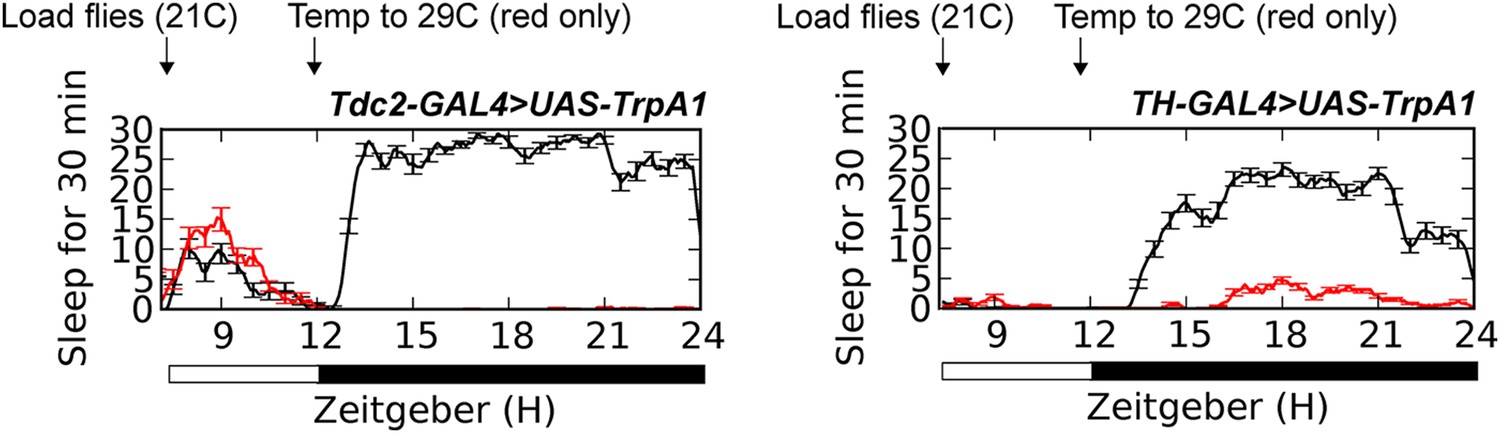
Sleep traces in TH-GAL4>UAS-TrpA1 (n = 24 red, 20 black) or Tdc2-GAL4>UAS-TrpA1 (n = 10 red, 10 black) flies loaded at ZT6 with temperature shift (red trace) to 29°C at ZT12, compared to controls (black trace) remaining at 21°C.
https://doi.org/10.7554/eLife.07643.013
Figure 2—figure supplement 2
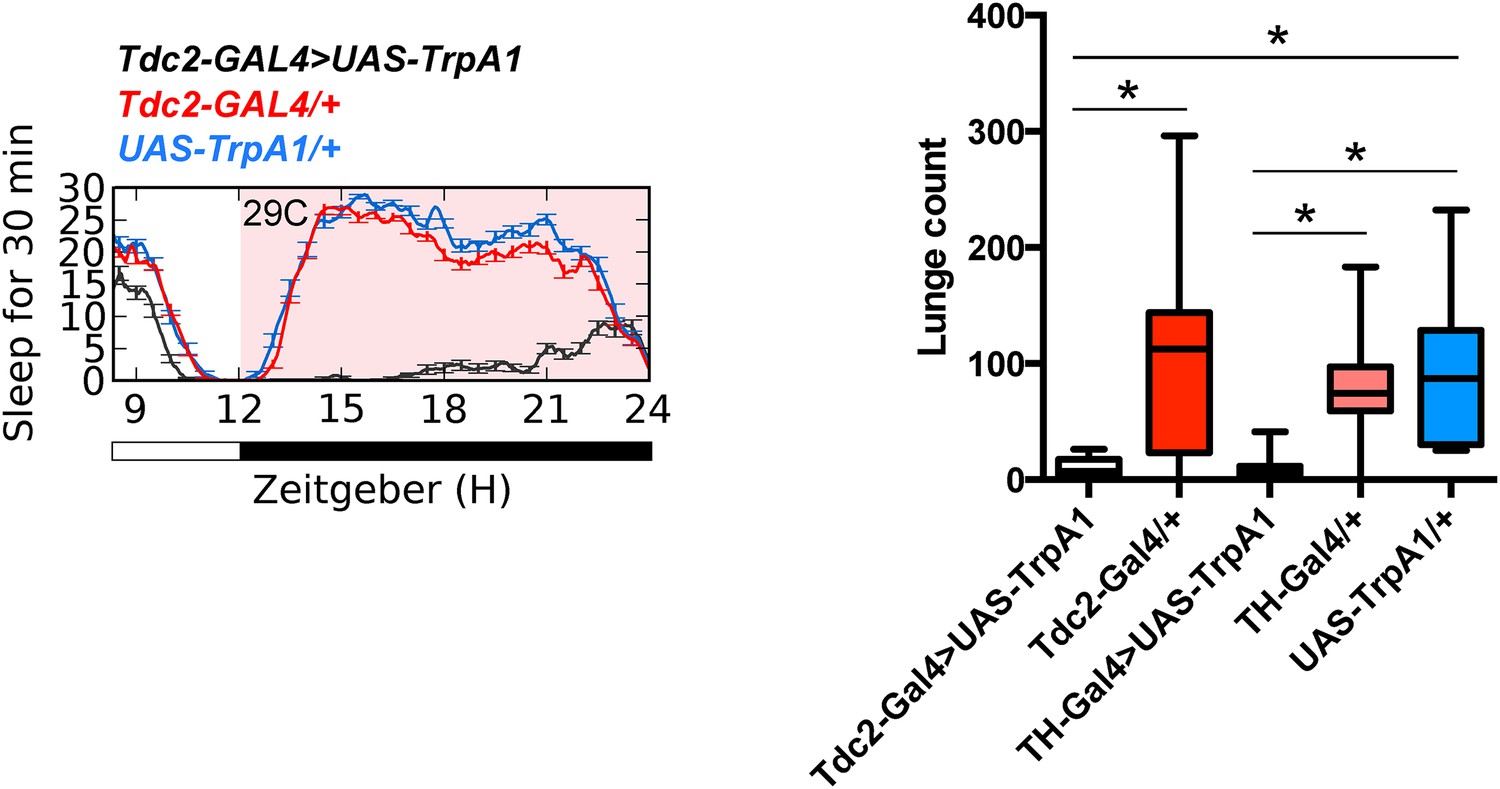
(Left) Sleep traces in Tdc2-GAL4>UAS-TrpA1 (black) and GAL4 (red) and UAS (blue) controls loaded at ZT6 with temperature shift (pink box) to 29°C at ZT12.
(Right) Quantification of aggression at 23°C in GAL4 and UAS controls exposed to 29°C during the prior night (n = 13, 14, 8, 8, 9 from left to right). *p < 0.05; 1 way ANOVA with Tukey's post-hoc test.
Figure 2—figure supplement 3
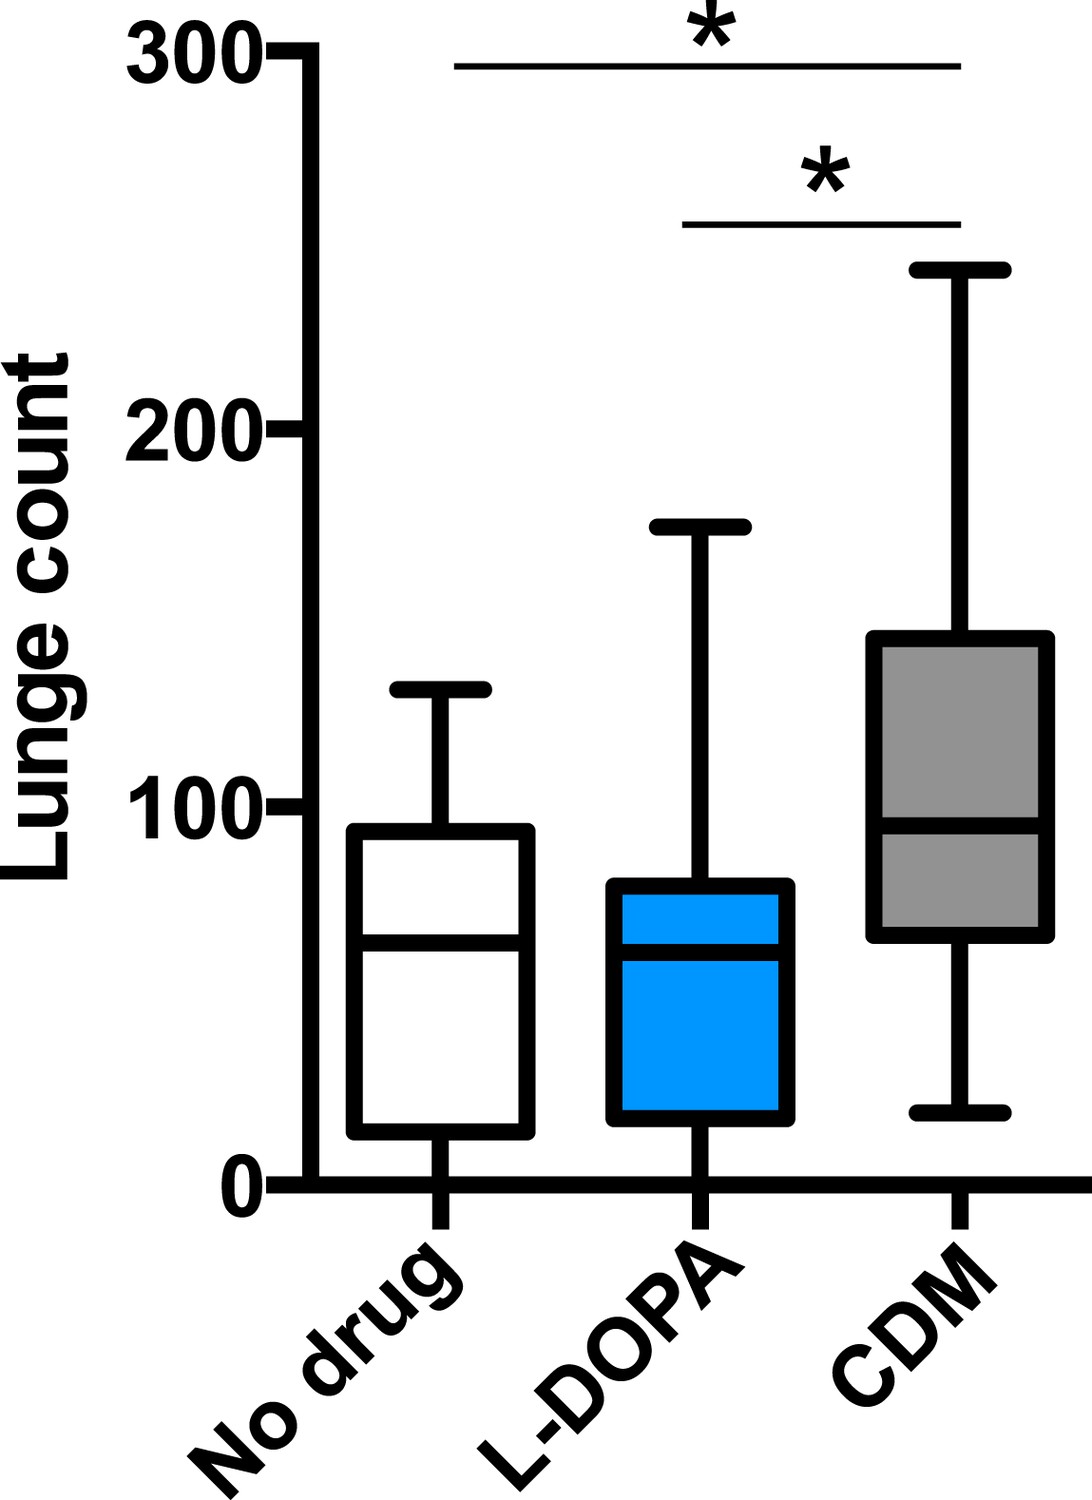
Quantification of aggression in CS males fed either CDM or L-DOPA and mechanically sleep-deprived (n = 17, 20, 24 from left to right).
*p < 0.05; 1 way ANOVA with Tukey's post-hoc test.
Figure 2—figure supplement 4
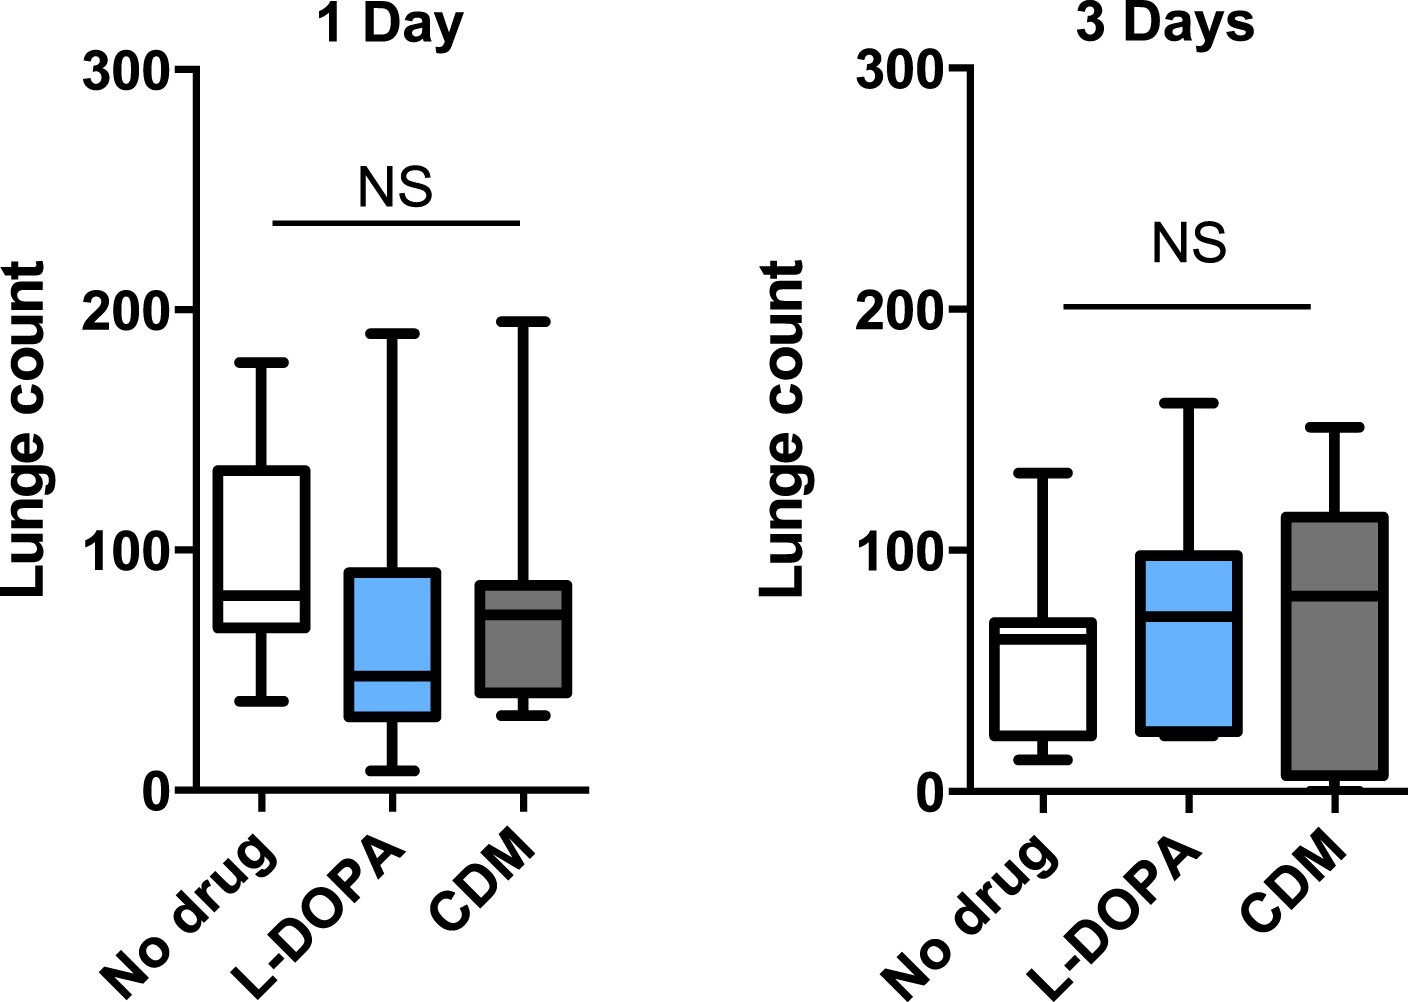
Quantification of aggression following 1 days or 3 days of drug exposure in isolated males.
1 way ANOVA with Tukey's post-hoc test.
Figure 3

Sleep loss is required for suppressed aggression following octopaminergic activation.
(A) Images of Tdc2+ Cha- neurons in brains from Tdc2-GAL4;Cha-GAL80>UAS-CD8::GFP flies immunostained for GFP (green) and nc82 (magenta). Arrows indicate 2–4 VUM neuron cluster in posterior brain. Scale bar = 100 µm. (B) Sleep traces in Tdc2-GAL4;Cha-GAL80>UAS-TrpA1 (red), Tdc2-GAL4>UAS-TrpA1 (black), and UAS-TrpA1;Cha-GAL80 (blue) flies with temperature shift (pink box) to 29°C at ZT12 (n = 12 flies for all conditions). (C) Quantification of aggression in Tdc2-GAL4>UAS-TrpA1 males exposed to elevated temperature (and sleep deprived) overnight compared to Tdc2-GAL4;Cha-GAL80>UAS-TrpA1 males, and temperature controls (fights within condition; n = 14, 15, 16, 15 flies, from left to right). *p < 0.05; 1 way ANOVA with Sidak's post-hoc test.
-
Figure 3—source data 1
Quantification of lunging following thermogenetic activation of Tdc2+Cha- neurons.
- https://doi.org/10.7554/eLife.07643.018
Figure 4 with 1 supplement

Suppressed aggression following sleep deprivation impairs reproductive fitness.
Courtship index towards the female target (A) or male (B) in control (white, n = 32) or sleep-deprived (gray, n = 31) flies during a competitive courtship assay (within condition). (C) Percentage of time spent in chains/clusters during the competitive courtship assay with control (n = 29) or sleep-deprived (n = 30) flies (within condition). (D) Percentage of assays in which the control or sleep-deprived male first copulates with (‘wins’) the female target in a competitive courtship assay between conditions (n = 116 assays, 5 independent experiments). (E) As in (D) but with control vs sleep-deprived ± drug rescue males (control vs SD + no drug, n = 20 assays; control vs SD + L-DOPA, n = 28 assays; control vs SD + CDM n = 27 assays; 3 independent experiments). **p < 0.01, *p < 0.05; Unpaired two-tailed Student's t-test (A–C) or two-tailed Binomial test (D, E).
-
Figure 4—source data 1
Courtship and competitive copulations measures following sleep deprivation.
- https://doi.org/10.7554/eLife.07643.020
Figure 4—figure supplement 1
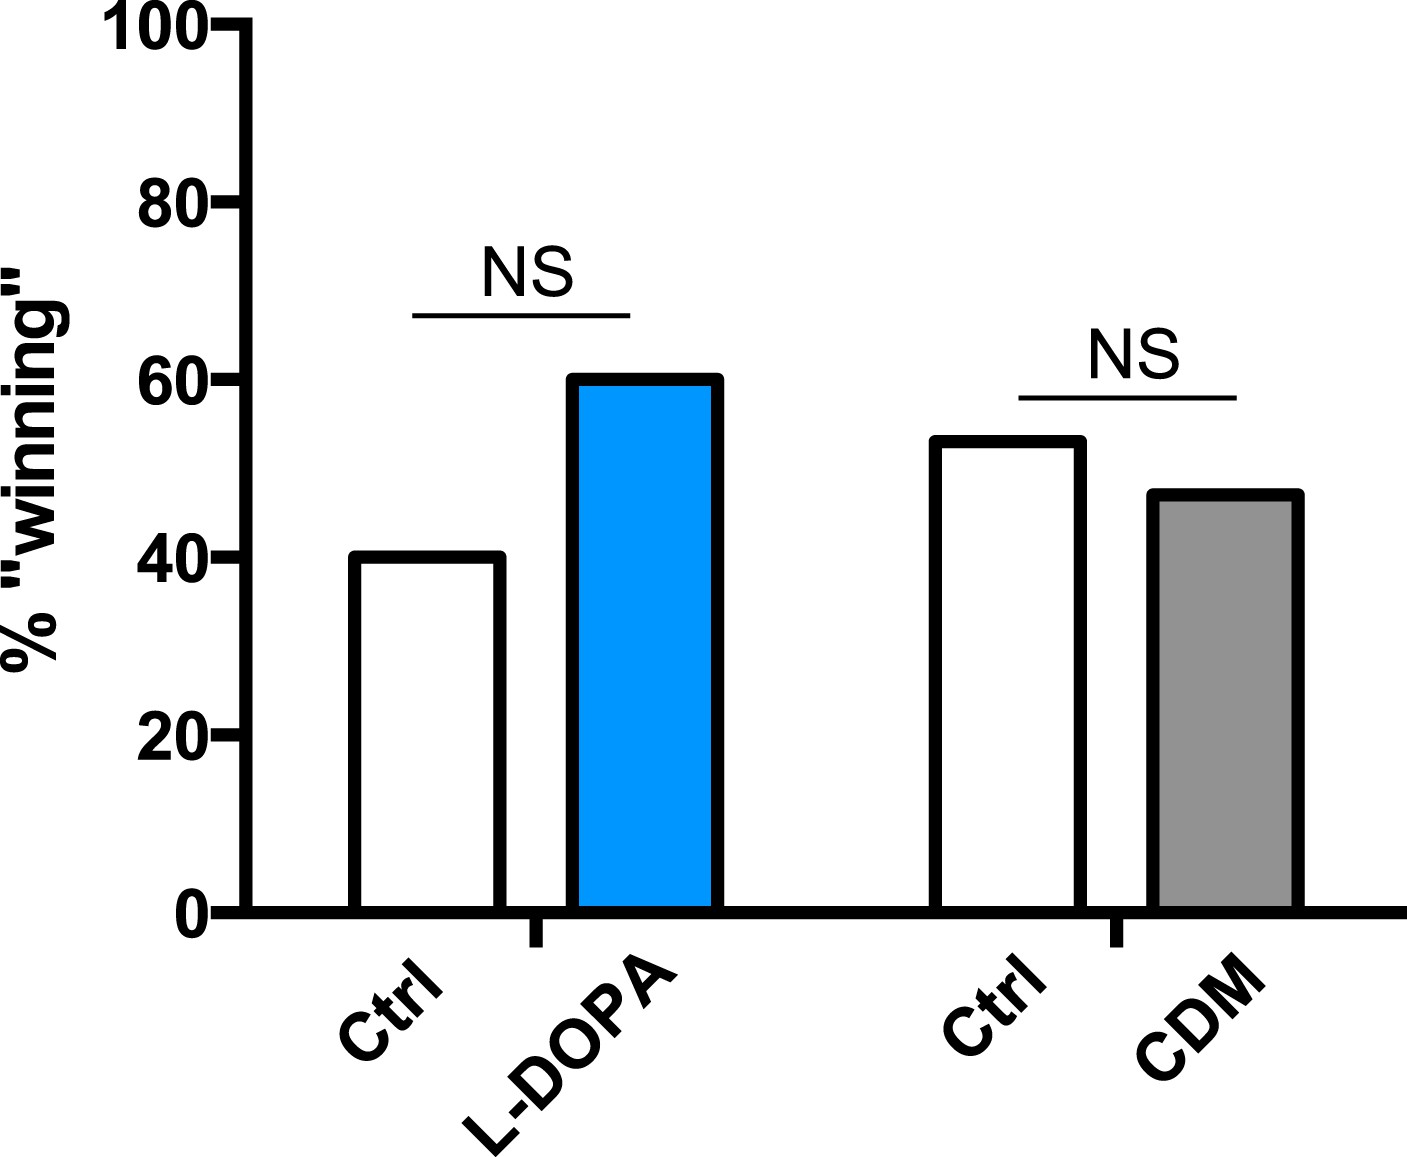
Percentage of assays in which the control or drug condition male first copulates with the female target in a competitive courtship assay between conditions (control vs L-DOPA, n = 30 assays; control vs CDM n = 30 assays; 3 independent experiments).
p = 0.36 for control vs L-DOPA, p = 0.86 for control vs CDM; two-tailed Binomial test.
Videos
Video 1
Aggression assay between two control flies (on regular food with a drop of yeast paste in the center).
https://doi.org/10.7554/eLife.07643.009
Video 2
Aggression assay between two sleep-deprived flies.
https://doi.org/10.7554/eLife.07643.010
Video 3
Competitive courtship assay between 2 control males (white or red painted dot) and a virgin female.
https://doi.org/10.7554/eLife.07643.022
Video 4
Competitive courtship assay between 2 sleep-deprived males (white or red painted dot) and a virgin female.
https://doi.org/10.7554/eLife.07643.023Download links
A two-part list of links to download the article, or parts of the article, in various formats.
Downloads (link to download the article as PDF)
Open citations (links to open the citations from this article in various online reference manager services)
Cite this article (links to download the citations from this article in formats compatible with various reference manager tools)
Sleep deprivation suppresses aggression in Drosophila
eLife 4:e07643.
https://doi.org/10.7554/eLife.07643


