Water-mediated recognition of t1-adenosine anchors Argonaute2 to microRNA targets
- The Scripps Research Institute, United States
- Delft University of Technology, Netherlands
Figures
Figure 1
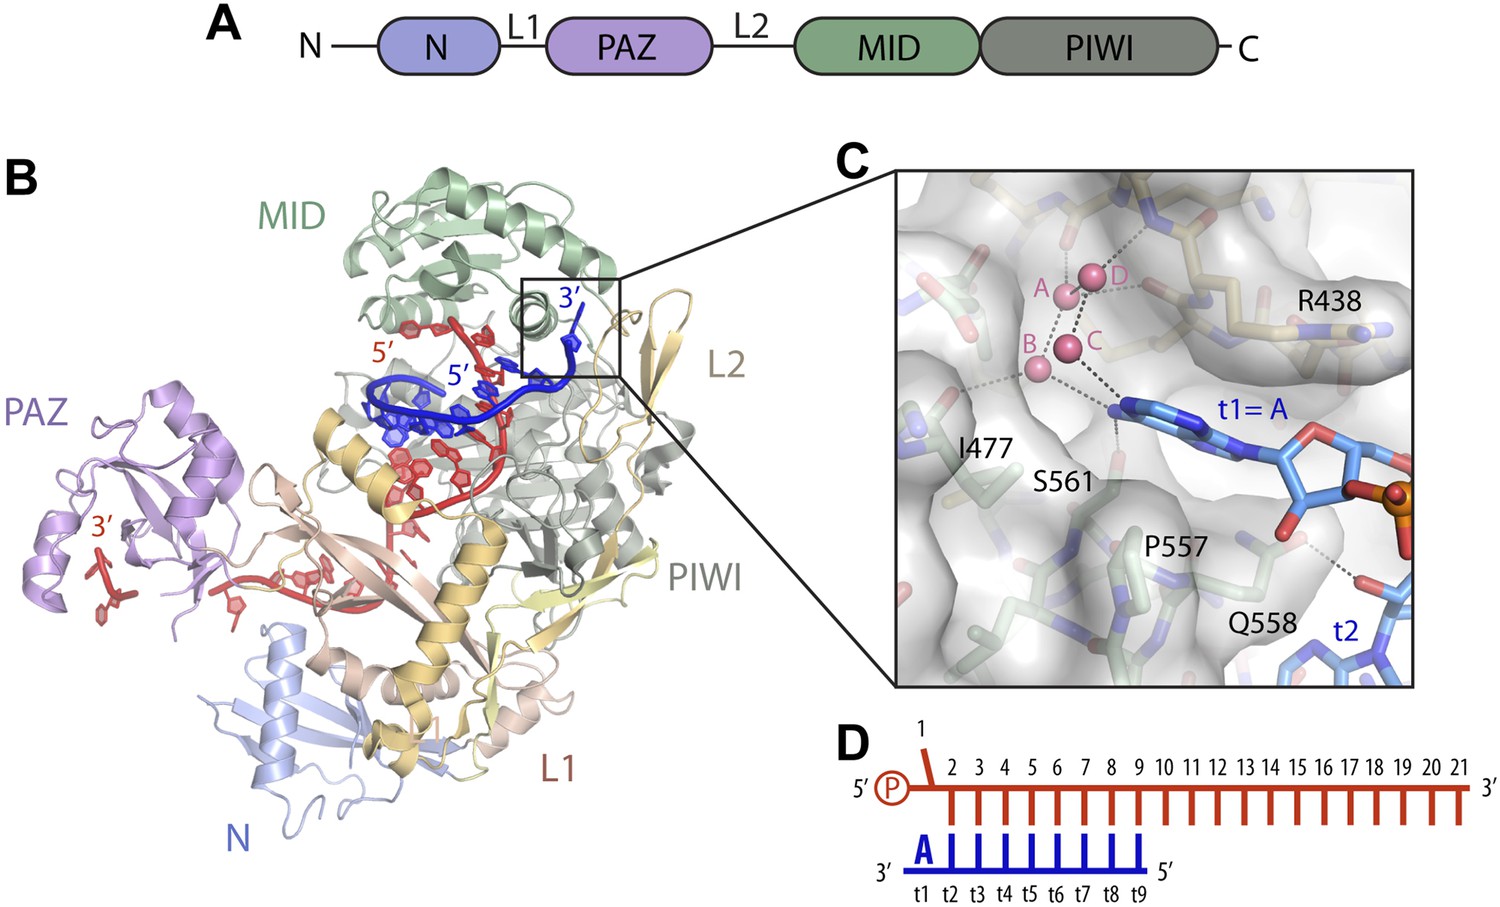
Structure of the t1 nucleotide binding pocket.
(A) Linear schematic of the Argonaute2 (Ago2) primary structure. (B) Crystal structure of Ago2 bound to a guide RNA (red) and target RNA bearing t1A nucleotide (blue; PDB ID: 4W5O). (C) Close-up view of the t1-binding pocket. Ordered water molecules shown as pink spheres. Protein shown in stick and surface representations. Target RNA shown as sticks. (D) Linear schematic of crystallized guide and target RNAs.
Figure 2
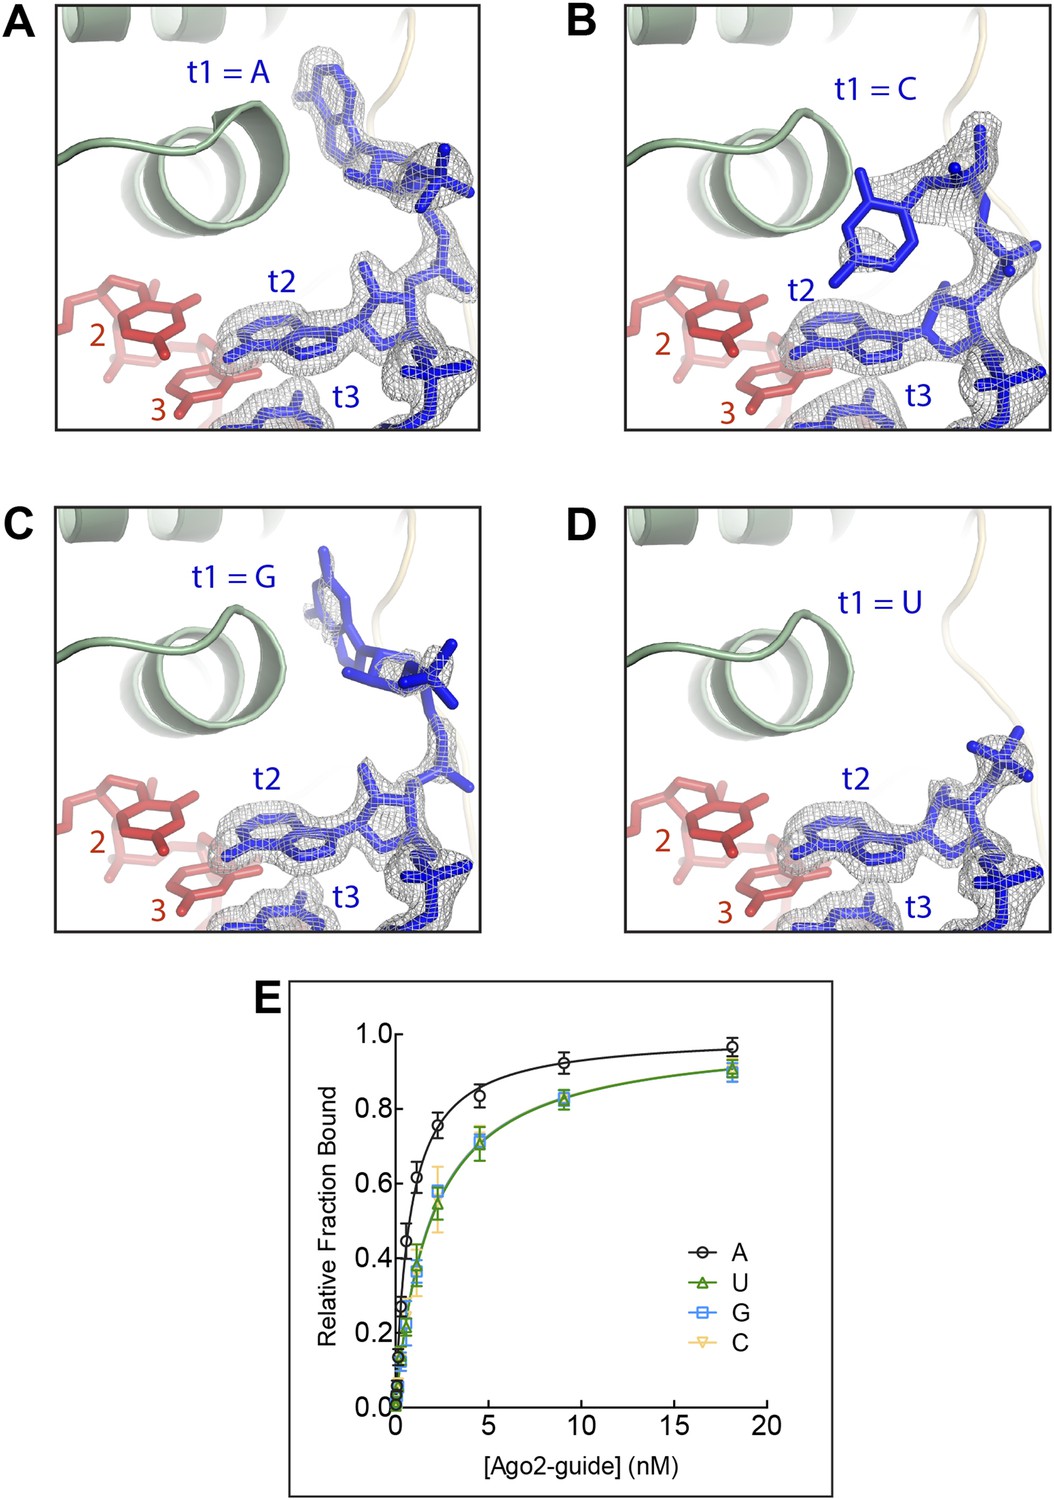
The t1 nucleotide binding pocket specifically recognizes adenosine Strong electron density was observed for adenosine in the t1-binding pocket, but not t1C, G, or U.
(A) T1A target RNA omit map contoured at 3σ (grey mesh). (B) T1C target RNA omit map contoured at 3σ (grey mesh). (C) T1G target RNA omit map contoured at 3σ (grey mesh). (D) T1U target RNA omit map contoured at 3σ (grey mesh). (E) Plot of target bound vs Ago2-guide concentration for target RNAs with different t1-nucleotides.
Figure 3

A purine N6 amine is required for t1 nucleotide recognition.
(A) Chemical structures of adenosine, 2,6-diaminopurine (DAP), guanosine, and inosine (I) nucelobases. Hydrogen bond donors highlighted in blue; hydrogen bond acceptors highlighted in pink. (B) t1I target RNA omit map contoured at 3σ (grey mesh). No electron density was observed for t1I. (C) t1DAP target RNA omit map contoured at 3σ (grey mesh). Clear electron density was observed for t1DAP. (D) Plot of target bound vs Ago2-guide concentration for t1A, t1I, t1DAP, and t1m6A target RNAs.
Figure 4
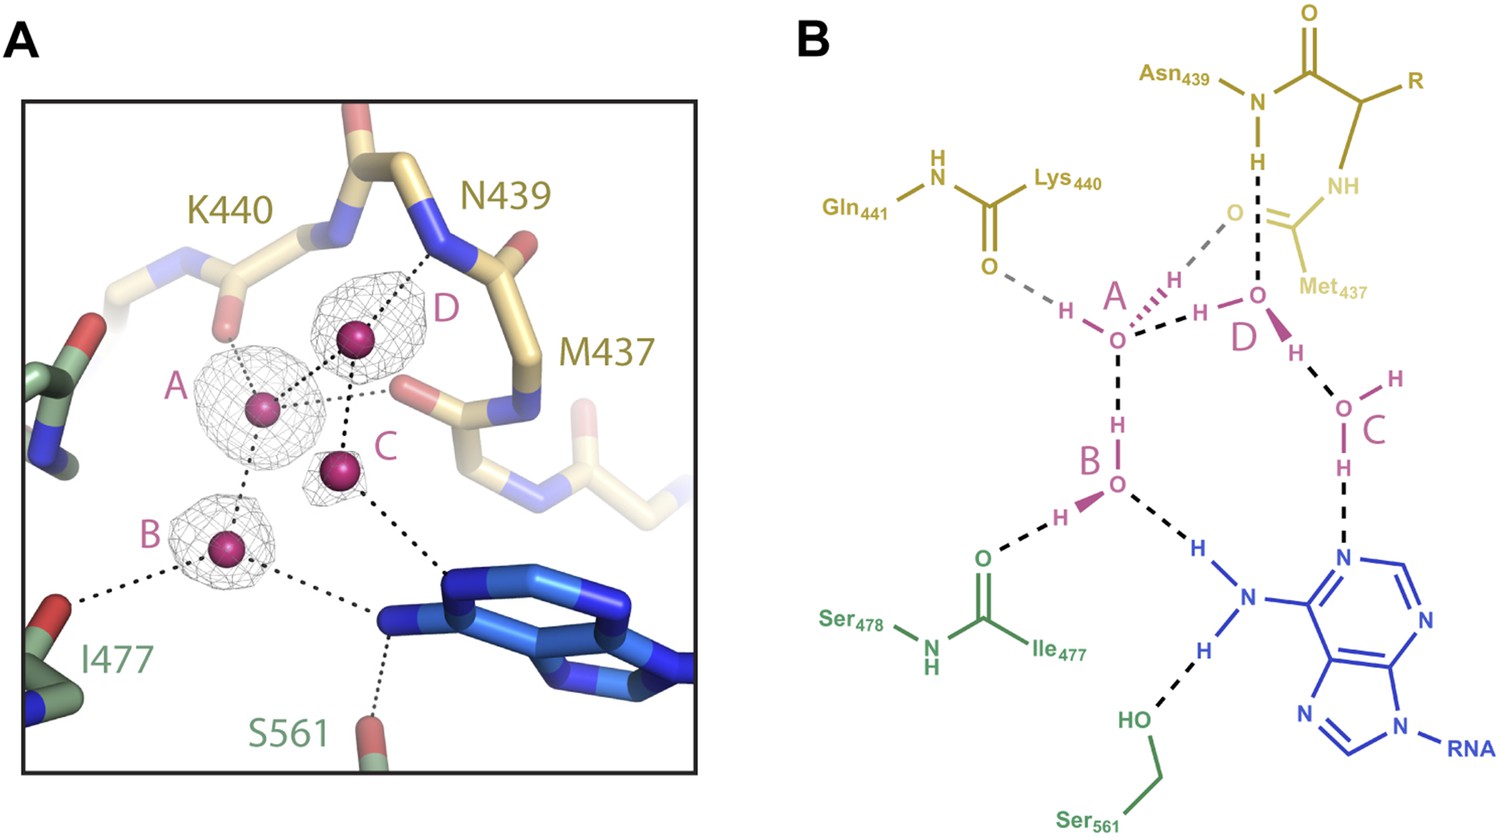
Water-mediated recognition of t1A.
(A) Water network within the t1-binding pocket. Protein main chain shown as sticks, with side-chains (except S561) hidden for clarity. Water molecules shown as pink spheres. Water omit map shown contoured at 2.5σ (grey mesh). Potential hydrogen bonds shown as black dashed lines; t1A shown as blue sticks. (B) Flattened cartoon schematic of image shown in (A). Drawing illustrates proposed positions of hydrogen atoms within the t1A recognition network.
Figure 5
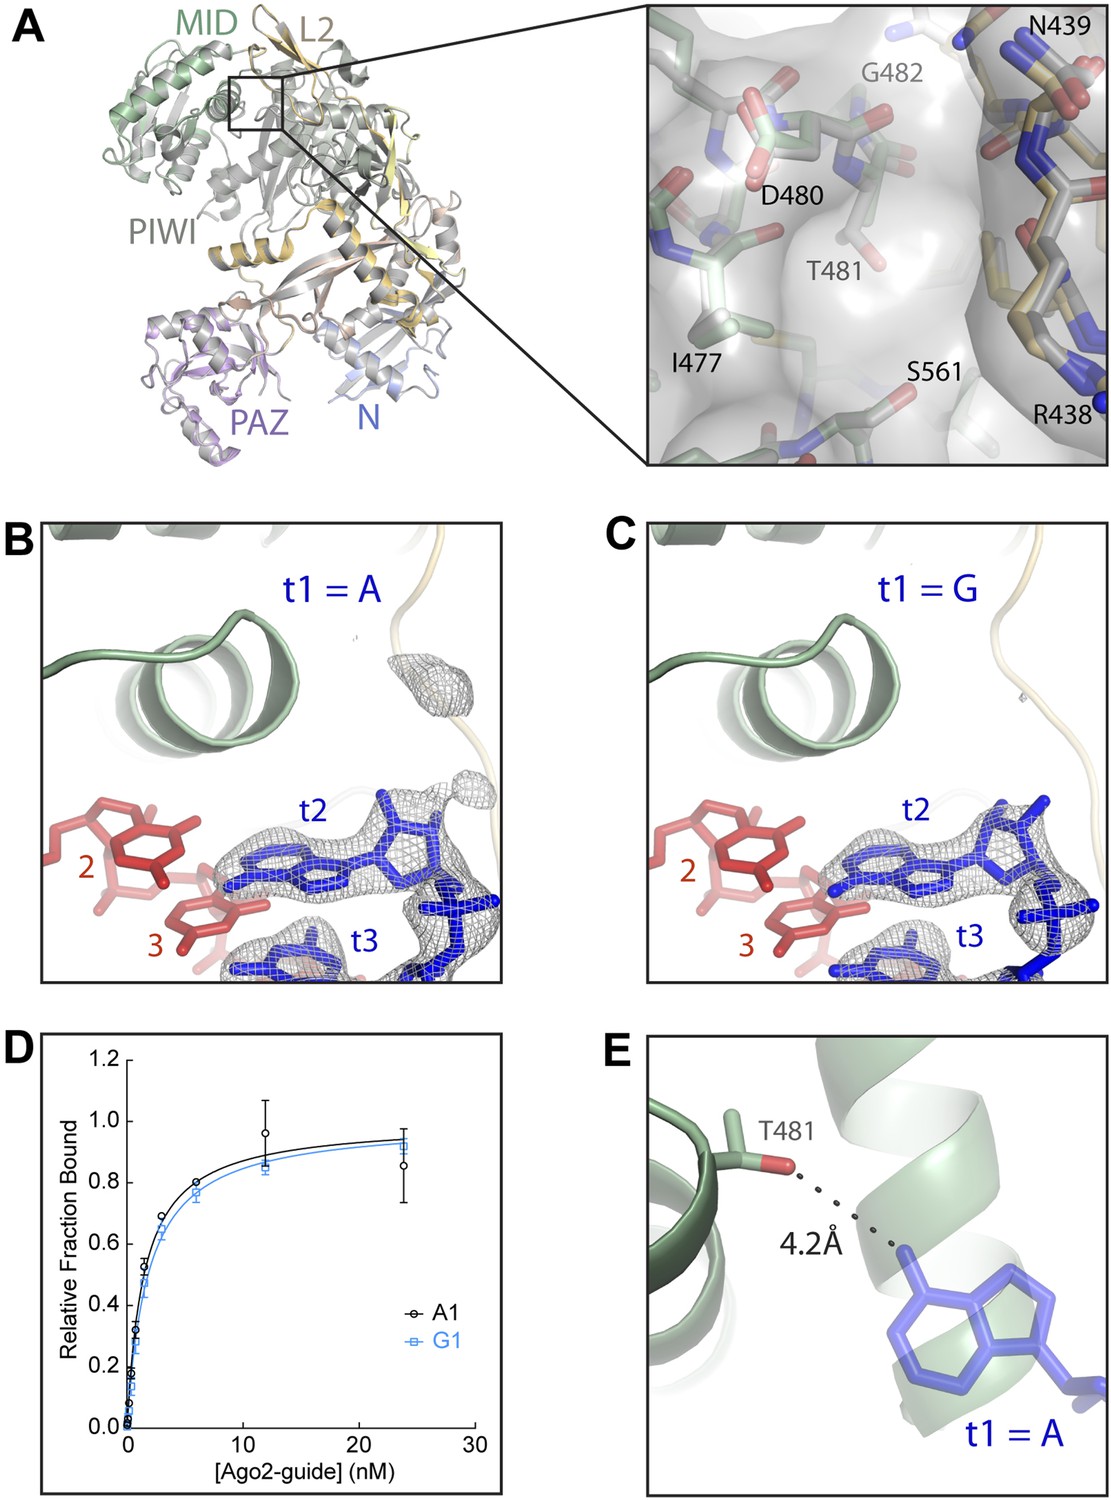
Disruption of the t1 pocket water network abolishes t1A recognition.
(A) Overlay of wild-type and A481T Ago2 structures and close-up view of the region surrounding the A481T mutation (inset). (B, C) Crystal structures of A481T-Ago2 bound to t1A (B) or t1G (C) target RNAs. Target RNA omit maps contoured at 3σ (grey mesh). (D) Plot of bound t1A and t1G target RNAs vs A481T-Ago2-guide concentration. (E) Overlay of A481T-Ago2 and t1A from wild-type (WT) Ago2 (semi-transparent) structures. 4.2 Å distance between the T481 Oγ hydroxyl and the t1A N6 amine indicated as dashed line.
Figure 6
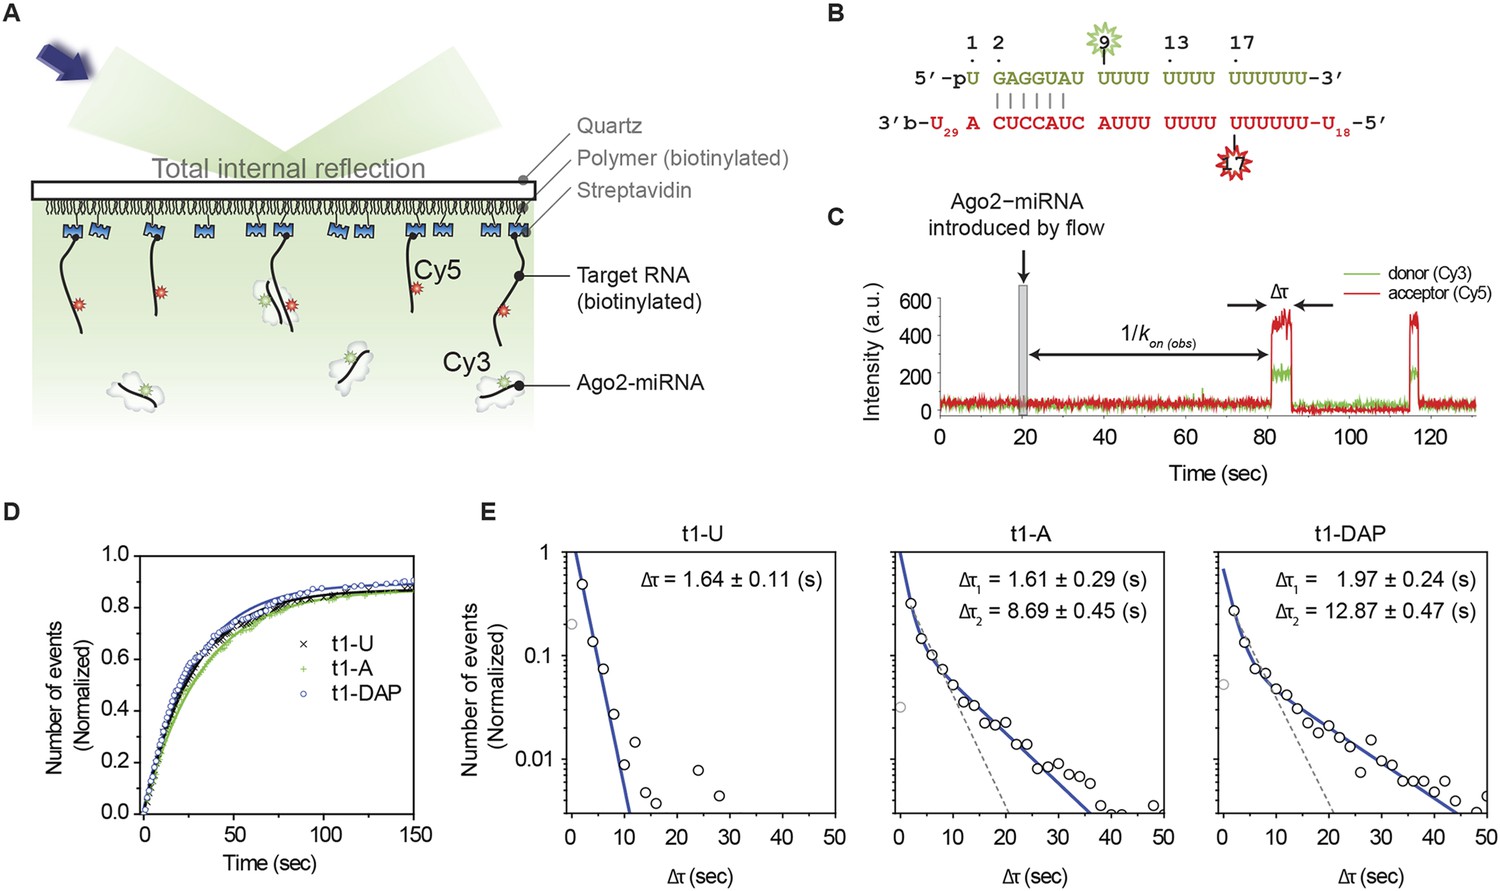
t1A nucleotides increase the dwell time on target sites.
(A) Cartoon schematic of a single-molecule FRET assay. (B) Sequences of miRNA and target RNA with base pairs shown. The donor fluorophore (Cy3) is positioned on the ninth nt of miRNA (counting from the 5′ end of miRNA) and the acceptor (Cy5) on target RNA opposite nt 17 of miRNA. (C) Representative time trajectory. Δτ, dwell time of interaction; kon(obs), apparent binding rate. The thin grey box indicates the time of a flow that delivers Ago2 and microRNA into the observation chamber. (D) Accumulated number of first Ago2-miRNA/target binding events vs time for RNA targets bearing t1U, t1A, or t1DAP. The number of events was normalized by the total number of target RNA strands over an imaging area. (E) Binding event dwell times fit to a double exponential decay (blue). The t1A binding events fit two populations (49.8 ± 6.2% that exhibits Δτ1 and 50.2 ± 6.2% that exhibits Δτ2; R2 = 0.998). The t1DAP binding events fit two populations (44.6 ± 4.4% that exhibits Δτ1 and 55.4 ± 4.4% that exhibits Δτ2; R2 = 0.996). Dotted grey lines represent fits to a single exponential decay. The first data columns were excluded to avoid artifacts arising from the time resolution limit. The number of events per bin was normalized by the total amount of binding events per each histogram.
Figure 7
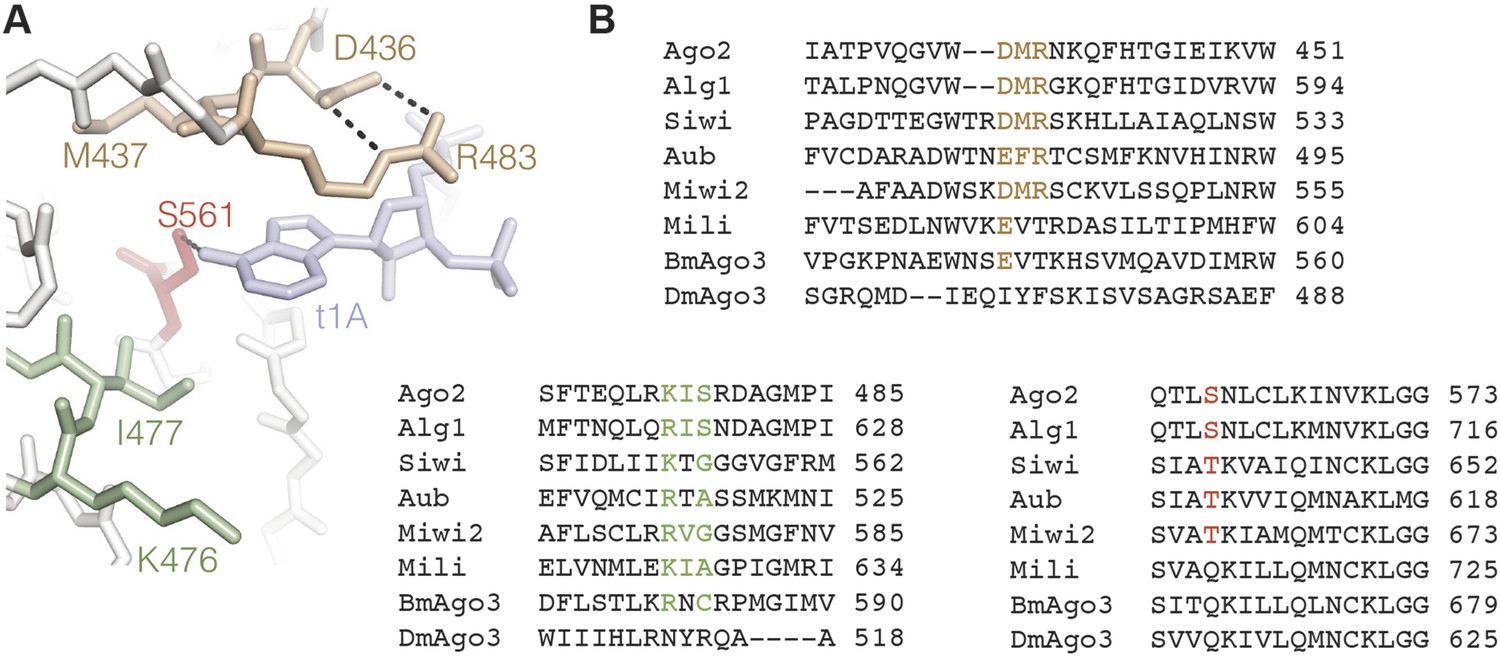
Conservation in the t1A-binding pocket.
(A) Structure of the Ago2 t1A-binding pocket with major structural elements indicated. Ago2 shown as sticks with side chains of non-highlighted residues hidden for clarity. Target RNA shown in blue. (B) Multiple sequence alignment of Ago2 with other members of the extended Argonaute protein family. Conserved structural elements colored as in panel A.
Author response image 1
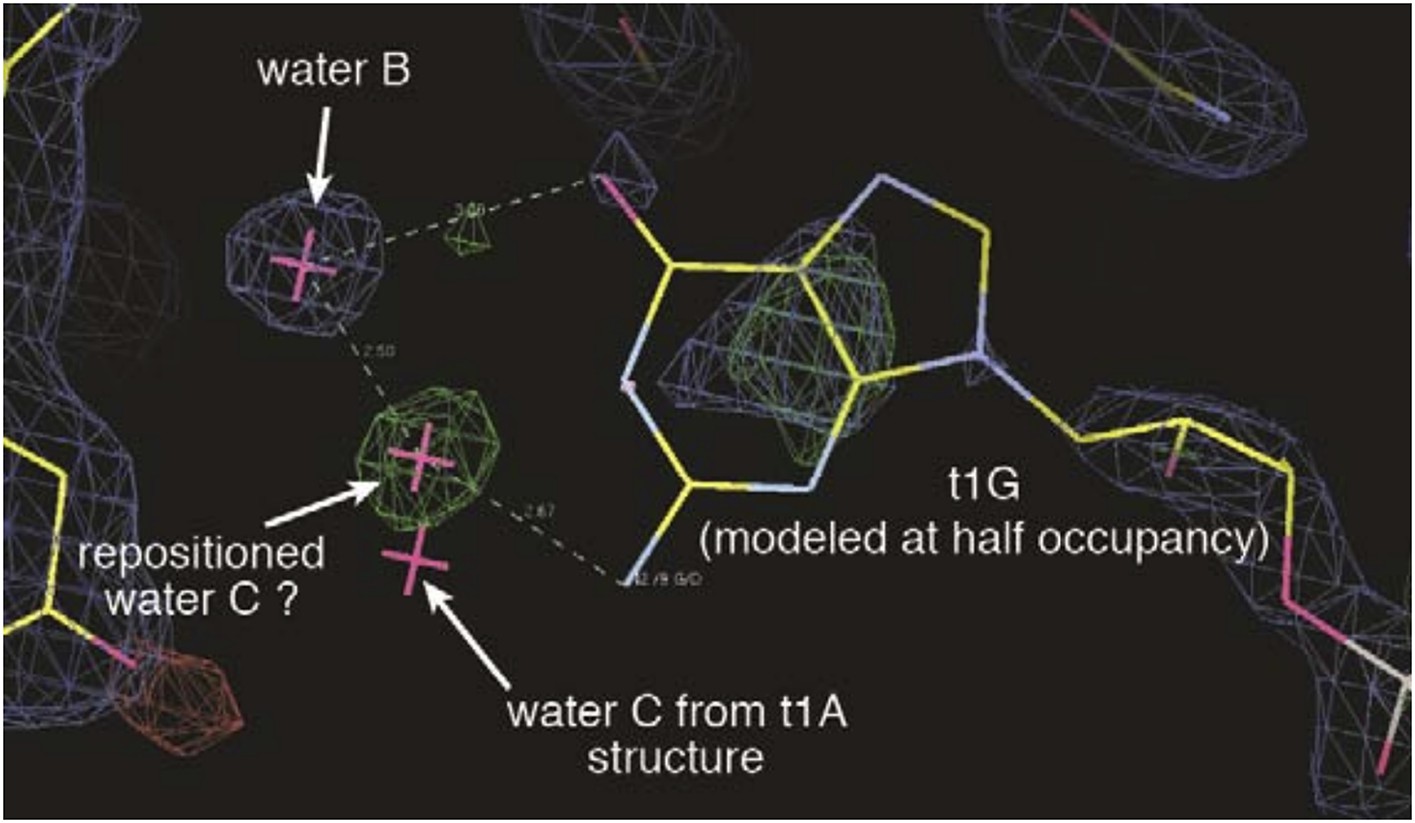
Electron density maps surrounding the t1-G nucleotide.
2Fo-Fc map is shown contoured at 1σ(blue mesh). Fo-Fc map (difference map) is shown contoured at 3σ (green mesh) and -3σ (red mesh). A positive difference density peak, possibly representing a repositioned water C, is observed 2.5 Å from water B and 2.7 Å from the t1-G N2 amine. Position of water C in t1-A structure is included for comparison.
Author response image 2
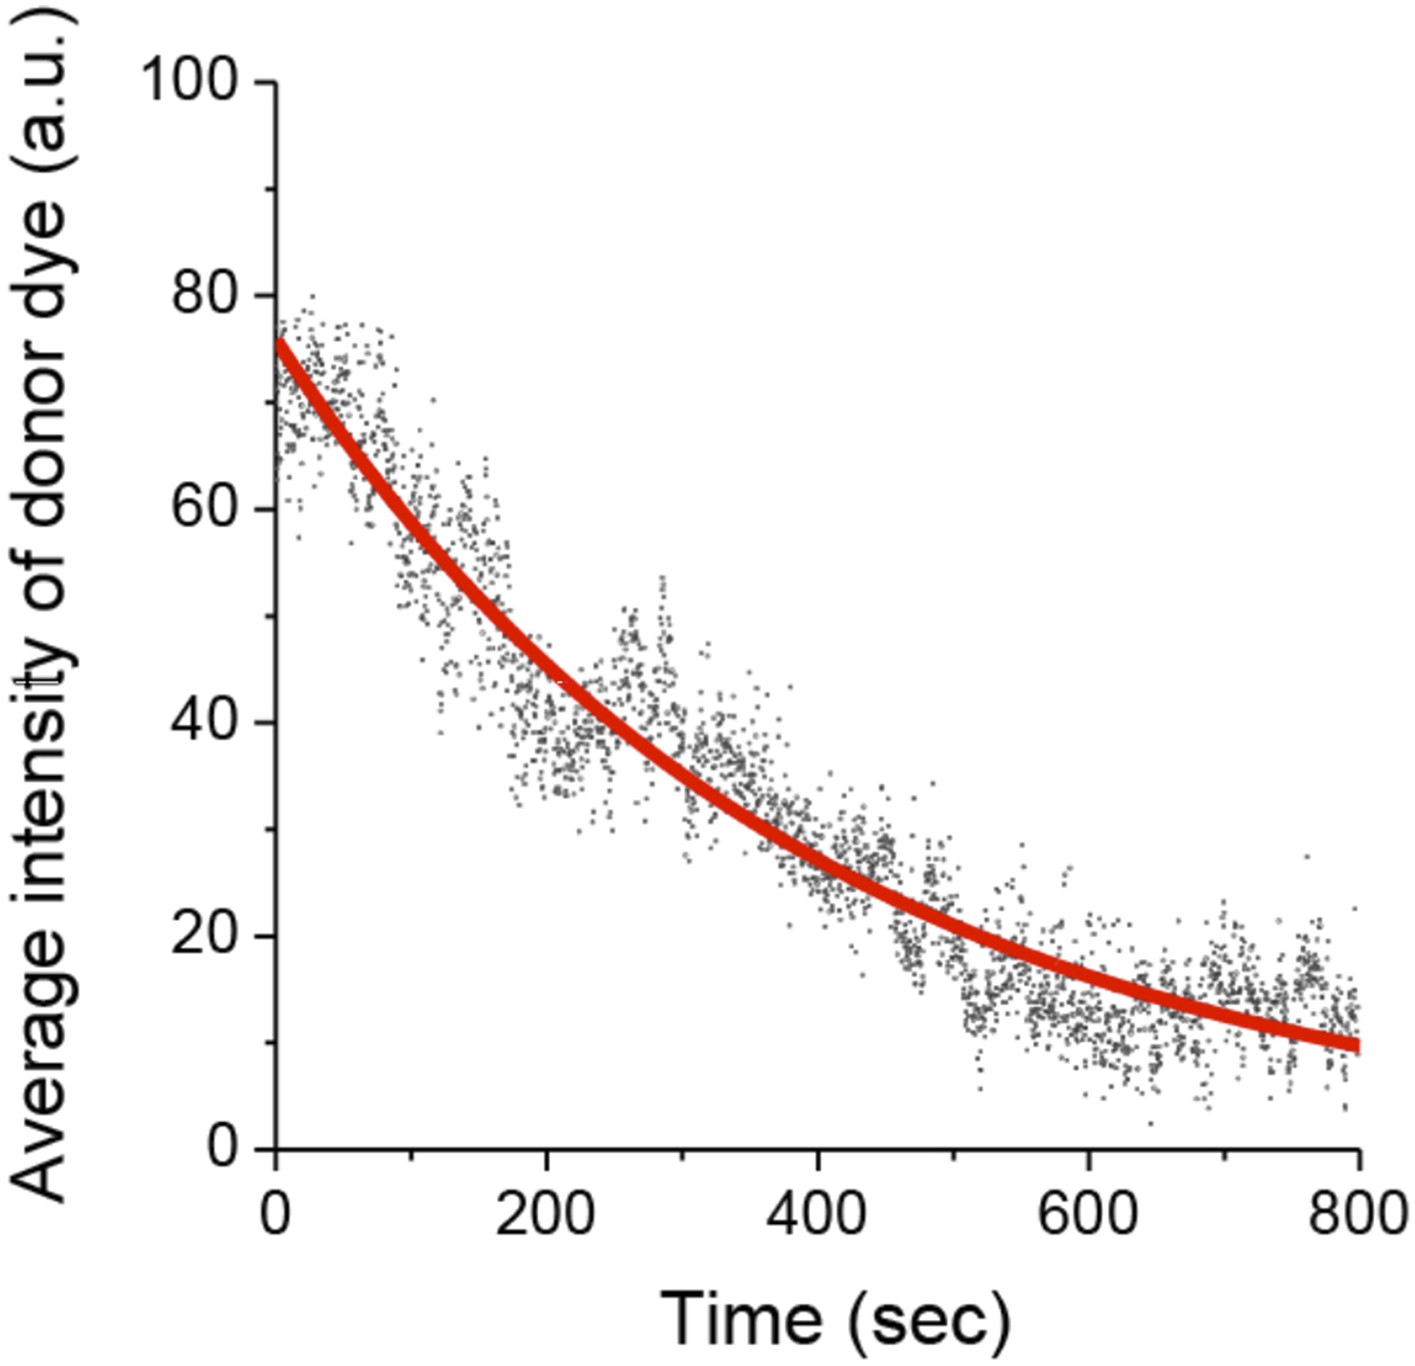
Photobleaching of the Cy3 donor.
https://doi.org/10.7554/eLife.07646.016Tables
Table 1
Crystallographic and refinement statistics for wild-type Ago2-guide-target complexes
| Target RNA | t1-C | t1-G | t1-U | t1-DAP | t1-Inosine |
|---|---|---|---|---|---|
| PDB code | 4Z4C | 4Z4D | 4Z4E | 4Z4F | 4Z4G |
| Space group | P1211 | P1211 | P1211 | P1211 | P1211 |
| Unit cell dimensions | |||||
| a (Å) | 55.69 | 55.74 | 55.64 | 55.86 | 55.66 |
| b (Å) | 116.56 | 117.02 | 116.84 | 116.60 | 117.0 |
| c (Å) | 69.61 | 69.87 | 69.74 | 70.38 | 70.1 |
| β (°) | 92.43 | 92.43 | 92.43 | 92.52 | 92.40 |
| Ago2 per ASU | 1 | 1 | 1 | 1 | 1 |
| Data collection | |||||
| Wavelength (Å) | 0.97945 | 0.97950 | 0.97918 | 0.97950 | 0.97950 |
| Resolution (Å) | 38.85–2.30 (2.38–2.30) | 39.01–1.60 (1.63–1.60) | 55.60–1.80 (1.90–1.80) | 38.86–2.80 (2.95–2.80) | 39.01–2.70 (2.83–2.70) |
| Total reflections | 133,678 | 532,622 | 351,634 | 65,587 | 75,249 |
| Unique reflections | 38,614 | 113775 | 82,071 | 21,078 | 24,061 |
| Completeness (%) | 98.4 (96.3) | 96.8 (93.5) | 99.7 (99.7) | 95.0 (92.6) | 97.2 (91.9) |
| Redundancy | 3.5 (3.4) | 4.7 (4.6) | 4.3 (3.7) | 3.1 (3.0) | 3.1 (2.9) |
| I/σI | 13.1 (2.2) | 13.7 (2.0) | 10.3 (1.9) | 9.9 (2.4) | 9.6 (2.2) |
| Rmerge | 7.7 (53.0) | 5.5 (74.9) | 9.8 (81.9) | 9.8 (57.7) | 8.4 (48.2) |
| Rpim | 7.3 (49.2) | 3.1 (59.0) | 5.3 (47.4) | 9.7 (57.1) | 6.4 (36.3) |
| Refinement | |||||
| Resolution (Å) | 35.30–2.30 | 39.01–1.60 | 40.27–1.80 | 35.47–2.80 | 35.41–2.70 |
| R-free/R-factor | 21.86/16.93 | 18.90/16.31 | 18.54/15.75 | 23.30/18.39 | 22.44/17.86 |
| R.M.S. deviation | |||||
| Bond distances (Å) | 0.014 | 0.014 | 0.007 | 0.006 | 0.008 |
| Bond angles (°) | 1.454 | 1.460 | 1.131 | 0.903 | 0.989 |
| Number of atoms | |||||
| Non-hydrogen, protein | 6429 | 6469 | 6429 | 6421 | 6404 |
| Non-hydrogen, RNA | 568 | 580 | 552 | 571 | 572 |
| Phenol | 28 | 28 | 28 | 21 | 28 |
| Isopropanol | 4 | 20 | 8 | 0 | 0 |
| Phosphate | 10 | 0 | 5 | 0 | 0 |
| Mg | 3 | 3 | 3 | 3 | 3 |
| Water | 279 | 554 | 545 | 16 | 105 |
| Ramachandran Plot | |||||
| Most favored regions | 95.33% | 96.79% | 96.97% | 94.93% | 95.17% |
| Additionally allowed | 4.54% | 3.21% | 3.03% | 4.94% | 4.83% |
| Generously llowed | 0.13% | 0.00% | 0.00% | 0.13% | 0.00% |
Table 2
Ago2-target affinities
| t1 nucleotide | KD (nM) | |
|---|---|---|
| WT Ago2 | A481T-Ago2 | |
| A | 0.75 ± 0.04 | 1.5 ± 0.13 |
| G | 1.9 ± 0.09 | 1.8 ± 0.11 |
| U | 1.9 ± 0.10 | – |
| C | 1.8 ± 0.12 | – |
| DAP | 0.45 ± 0.03 | – |
| I | 1.7 ± 0.09 | – |
| m6A | 1.8 ± 0.12 | – |
-
Dissociation constants for wild-type (WT) and mutant Ago2 binding short target RNAs with different t1 nucleotides.
Table 3
Crystallographic and refinement statistics for mutant (A481T) Ago2-guide-target complexes
| Target RNA | t1-A | t1-G |
|---|---|---|
| PDB code | 4Z4H | 4Z4I |
| Space group | P1211 | P1211 |
| Unit cell dimensions | ||
| a (Å) | 55.69 | 55.60 |
| b (Å) | 116.60 | 116.60 |
| c (Å) | 70.10 | 69.62 |
| β (°) | 92.29 | 92.42 |
| Ago2 per ASU | 1 | 1 |
| Data collection | ||
| Wavelength (Å) | 0.99999 | 0.99999 |
| Resolution (Å) | 44.81–2.50 (2.61–2.50) | 44.69–2.80 (2.95–2.80) |
| Total reflections | 113332 | 85,923 |
| Unique reflections | 30,411 | 21,701 |
| Completeness (%) | 98.6 (98.3) | 99.2 (97.6) |
| Redundancy | 3.7 (3.8) | 4.0 (4.0) |
| I/σI | 9.2 (2.3) | 8.7 (2.4) |
| Rmerge | 12.7 (69.7) | 13.1 (60.0) |
| Rpim | 12.0 (65.0) | 12.0 (55.0) |
| Refinement | ||
| Resolution (Å) | 44.81–2.50 | 44.69–2.80 |
| R-free/R-factor | 21.13/17.21 | 23.32/19.18 |
| R.M.S. deviation | ||
| Bond distances (Å) | 0.008 | 0.005 |
| Bond angles (°) | 0.940 | 0.865 |
| Number of atoms | ||
| Non-hydrogen, protein | 6432 | 6412 |
| Non-hydrogen, RNA | 568 | 568 |
| Phenol | 28 | 21 |
| Isopropanol | 4 | 20 |
| Phosphate | 10 | 0 |
| Mg | 3 | 3 |
| Water | 135 | 23 |
| Ramachandran plot | ||
| Most favored regions | 95.19% | 94.67% |
| Additionally allowed | 4.68% | 5.33% |
| Generously allowed | 0.13% | 0.00% |
Download links
A two-part list of links to download the article, or parts of the article, in various formats.
Downloads (link to download the article as PDF)
Open citations (links to open the citations from this article in various online reference manager services)
Cite this article (links to download the citations from this article in formats compatible with various reference manager tools)
Water-mediated recognition of t1-adenosine anchors Argonaute2 to microRNA targets
eLife 4:e07646.
https://doi.org/10.7554/eLife.07646


