Loss of neurofibromin Ras-GAP activity enhances the formation of cardiac blood islands in murine embryos
- Perelman School of Medicine at the University of Pennsylvania, United States
Figures
Figure 1
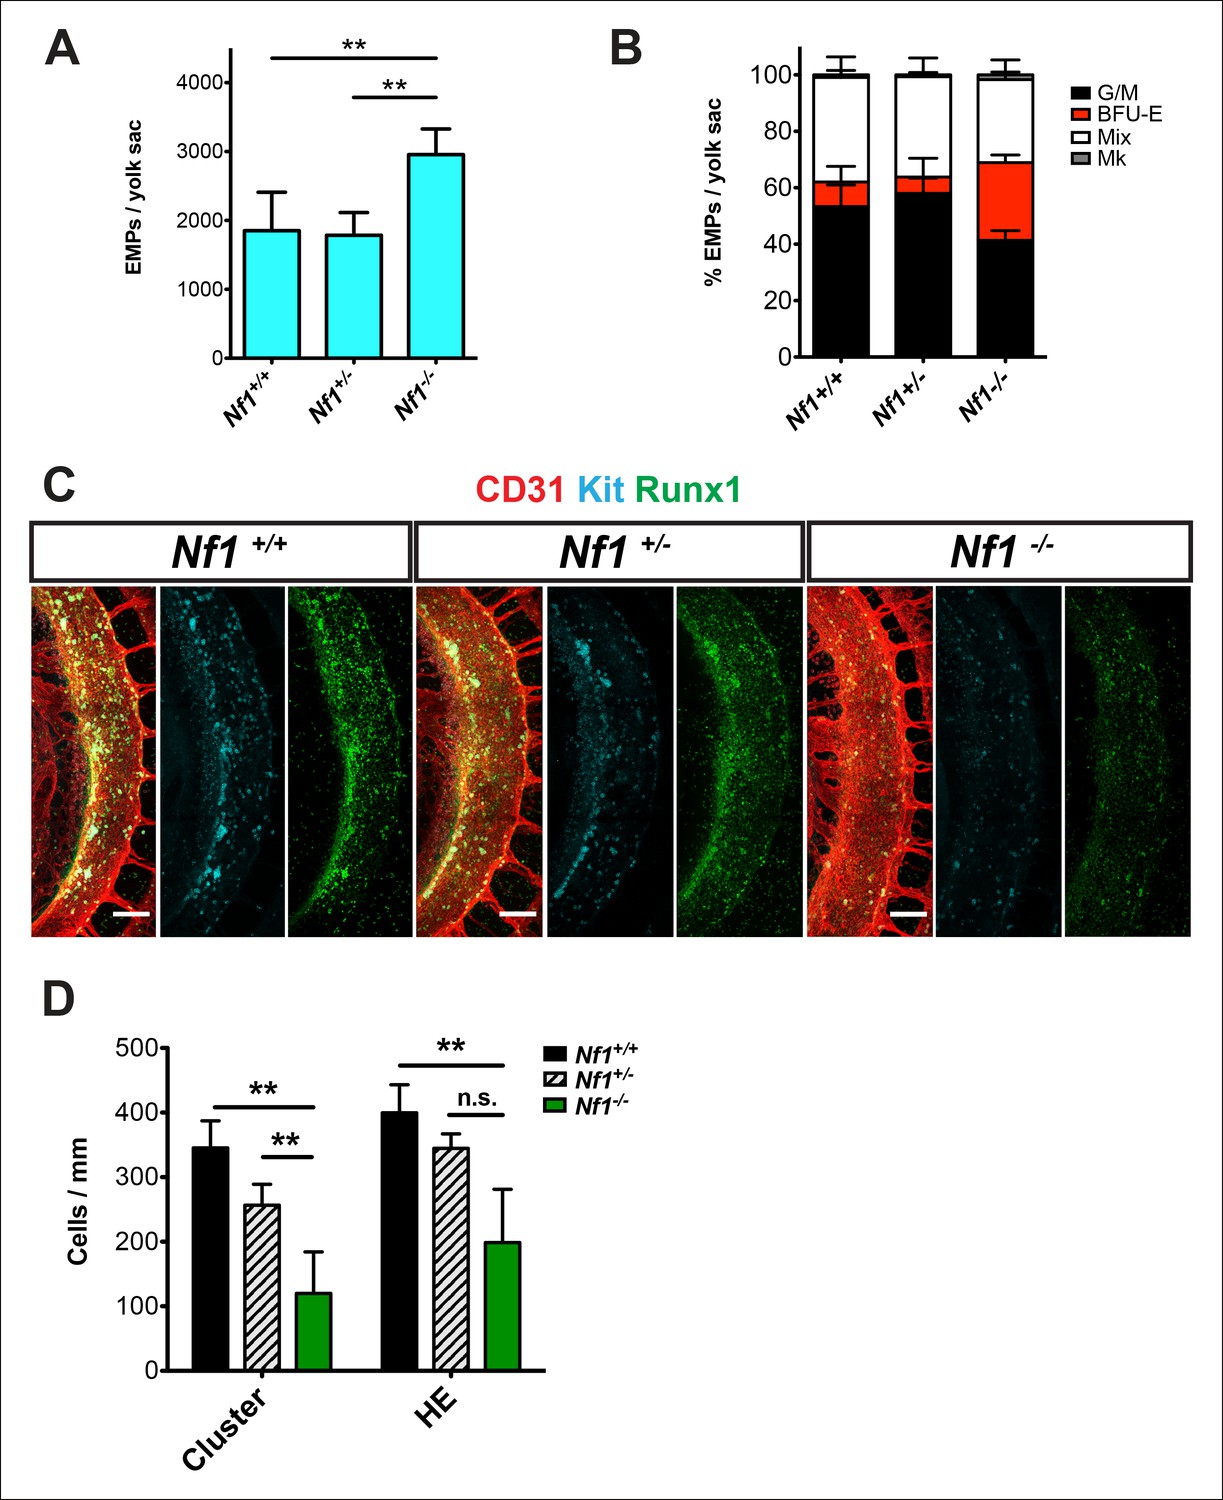
Nf1 deficiency increases yolk sac hematopoiesis but decreases specification of hemogenic endothelium in the dorsal aorta at E10.5.
(A) Quantification of erythroid and myeloid progenitors (EMPs) in the yolk sacs of E10.5 Nf1+/+, Nf1+/- and Nf1-/- conceptuses (Nf1+/+ n = 7; Nf1+/- n = 8; Nf1-/- n = 3). One-way ANOVA and Bonferroni’s multiple comparison test was applied to determine significance, error bars represent the standard deviation (SD) (B) Percent of EMP colony type. Mk: megakaryocyte; Mix: granulocyte-erythroid-monocyte-megokaryocyte; BFU-E: burst forming unit-erythroid; G/M: granulocyte-macrophage colonies. There were significantly more BFU-E progenitors in the yolk sacs of Nf1-/- compared to Nf1+/+ and Nf1+/- littermates, p≤0.0001. (C) Confocal Z-projections (Z intervals = 2 μm) of Nf1+/+ , Nf1+/- and Nf1-/- dorsal aortas at E10.5, immunostained for CD31 (red) Runx1 (green) and Kit (cyan). Scale bars = 100 μm. Aortas are oriented with the ventral aspect on the left. (D) Quantification of CD31+ Runx1+ Kit+ hematopoietic cluster cells and CD31+ Runx1+ Kit-/low hemogenic endothelial cells within the dorsal aorta at E10.5, One-way ANOVA and Bonferroni’s multiple comparison test applied to determine significance, error bars represent the SD and n = 3 for all genotypes. ** indicates that p≤0.01.
Figure 2
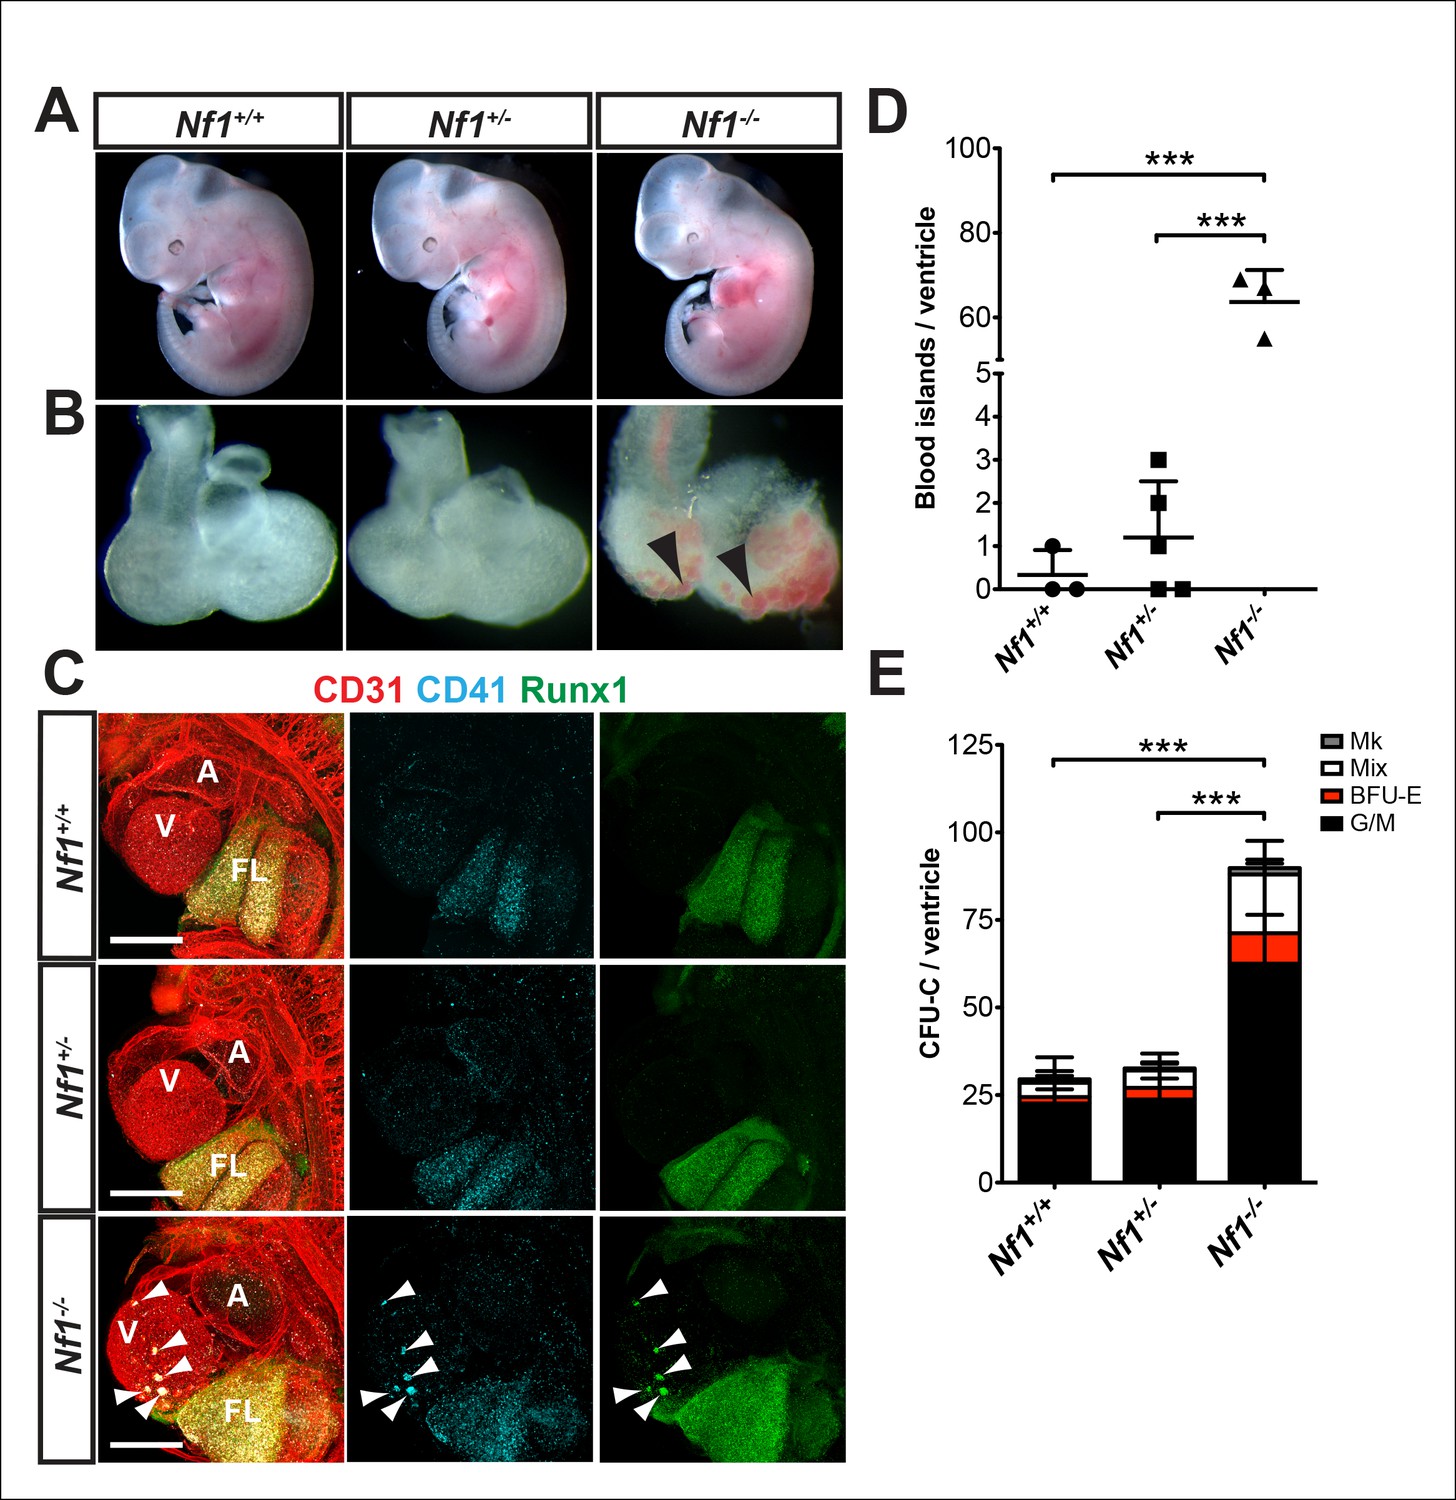
Ectopic formation of cardiac blood islands in Nf1-/- embryos.
(A) Gross view of E11.5 Nf1+/+, Nf1+/- and Nf1-/- embryos (B) Isolated hearts from embryos in (A) Black arrowheads point to two examples of blood-filled protrusions. (C) Confocal Z-projections (Z interval = 5 μm) of CD31 (red), CD41 (cyan) and Runx1 (green) immunostained Nf1+/+, Nf1+/- and Nf1-/- E11.5 embryos. Blood island-like structures (arrowheads) are visible on the ventricle of the Nf1-/- embryo. Scale bars = 500 μm. (D) Quantification of blood islands on the ventricles of E11.5 embryos, One-way ANOVA and Bonferroni’s multiple comparison test applied to determine significance, error bars represent SD. (E) Number of erythroid and myeloid progenitors per flushed E11.5 ventricles. One-way ANOVA and Bonferroni’s multiple comparison test applied to determine significance, error bars represent the standard SD. Nf1+/+ n = 10, Nf1+/- n = 33, and Nf1-/- n = 6. *** indicates that p≤0.001. CFU-C: colony-forming units-culture; V: ventricle; A: atrium; FL: fetal liver; Mk: megakaryocyte; Mix: granulocyte-erythroid-monocyte-megakaryocyte; BFU-E: burst forming unit-erythroid; G/M: granulocyte-macrophage colonies.
Figure 3
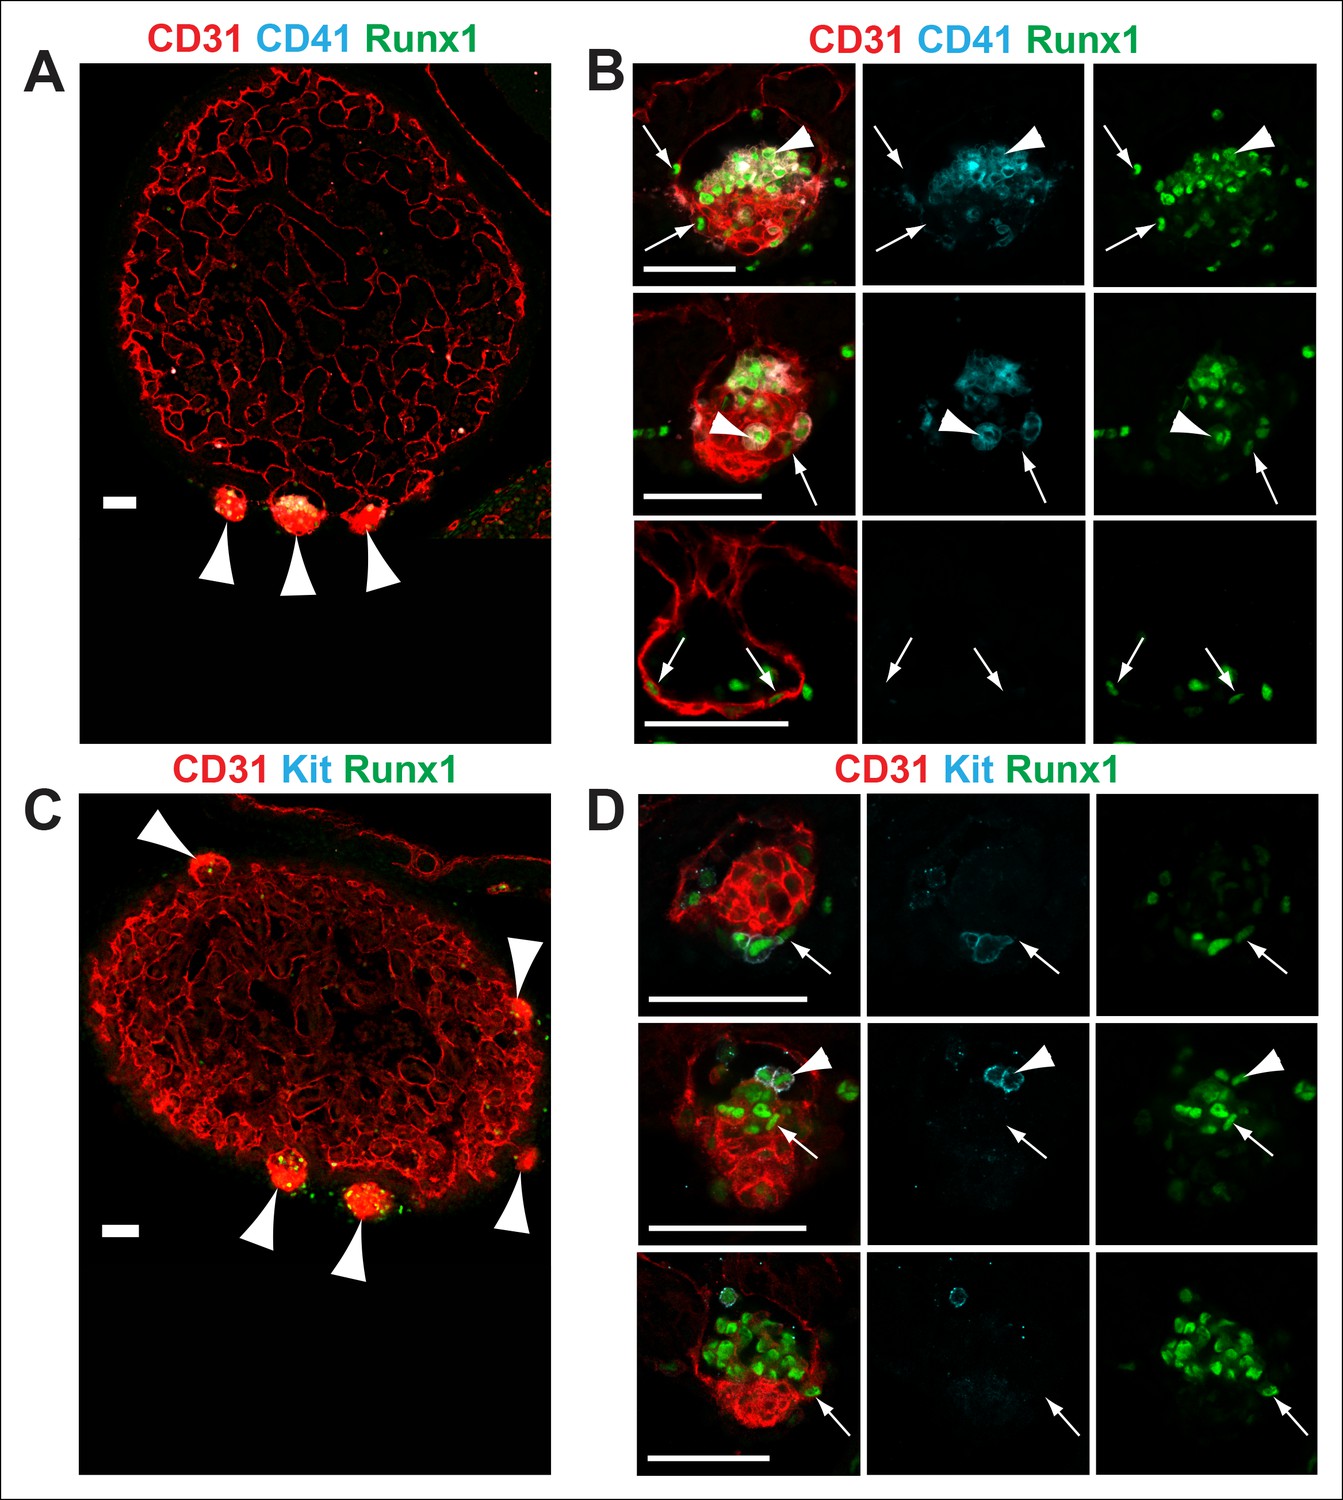
Nf1-/- cardiac blood islands.
(A) Single optical projection through the ventricle of an E11.5 Nf1-/- embryo immunostained for CD31 (red), CD41 (cyan) and Runx1 (green). Blood islands (arrowheads) are visible sprouting from the ventricles of Nf1-/- embryos. (B) Single optical projection through blood islands on the ventricles of E11.5 Nf1-/- embryos. Runx1+ endocardial cells are visible in the blood islands (arrows). Arrowheads indicate examples of CD31+ CD41+ Runx1+ hematopoietic cells. (C) Single optical projection through the ventricle of an E11.5 Nf1-/- embryo immunostained for CD31 (red), Kit (cyan) and Runx1 (green). (D) Single optical projection through blood islands. Arrows indicate Runx1+ endocardial cells. Arrowheads indicate examples of CD31+Kit+ Runx1+ hematopoietic cells. Scale bars = 50 μm.
Figure 4 with 2 supplements
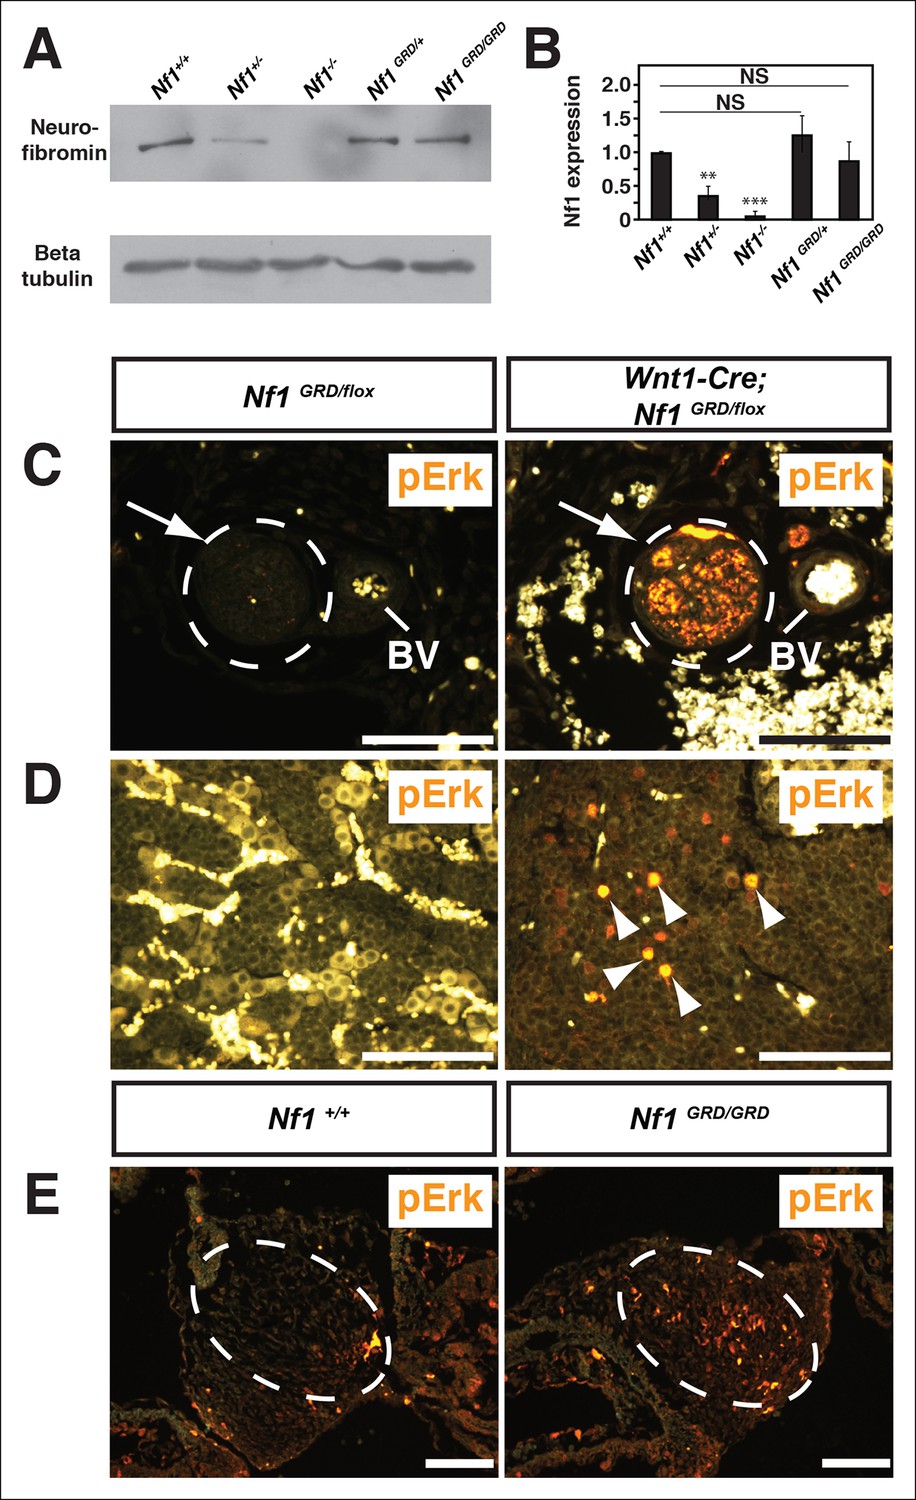
Neurofibromin protein expression and activity from the Nf1 alleles.
(A) Total cell lysates from E10.5 Nf1+/+, Nf1+/-, Nf1-/-, Nf1GRD/+, and Nf1GRD/GRD embryos were analyzed by SDS-PAGE followed by immunoblotting with either anti-neurofibromin (top panel) or anti-beta tubulin (bottom panel) antibodies as indicated. (B) Band intensities from 5 immunoblots as in (A) were quantified by ImageJ. The relative neurofibromin expression for each genotype compared to wild-type is indicated. All data are represented as the mean ± S.E. **, p<0.05; ***, p<0.001; NS = not significant (p<0.001, one-way ANOVA between groups, post hoc multiple comparisons, Tukey’s test). (C) A cross-section of a peripheral nerve (demarcated in white and indicated by an arrow) from each of Nf1GRD/flox and Wnt1-Cre; Nf1GRD/flox P0 animals shows elevated expression of pERK, a downstream indicator of Ras activity, in Wnt1-Cre; Nf1GRD/flox animals (right panel). An adjacent blood vessel (BV) is indicated. (D) Adrenal medullary tissue within an adrenal gland from either a Nf1GRD/flox or Wnt1-Cre; Nf1GRD/flox animal shows increased pERK expression in a hyperplastic area from the Wnt1-Cre; Nf1GRD/flox animal (right panel). pERK-positive cells are marked by arrowheads. Background fluorescence from non-neural-crest-derived adrenal cortical and blood cells is evident in the Nf1GRD/flox sample. (E) Cardiac cushions from E11.5 embryos show elevated pERK staining in Nf1GRD/GRD embryos compared to Nf1+/+ animals as indicated within the dashed oval. Scale bars = 50 μm.
Figure 4—figure supplement 1
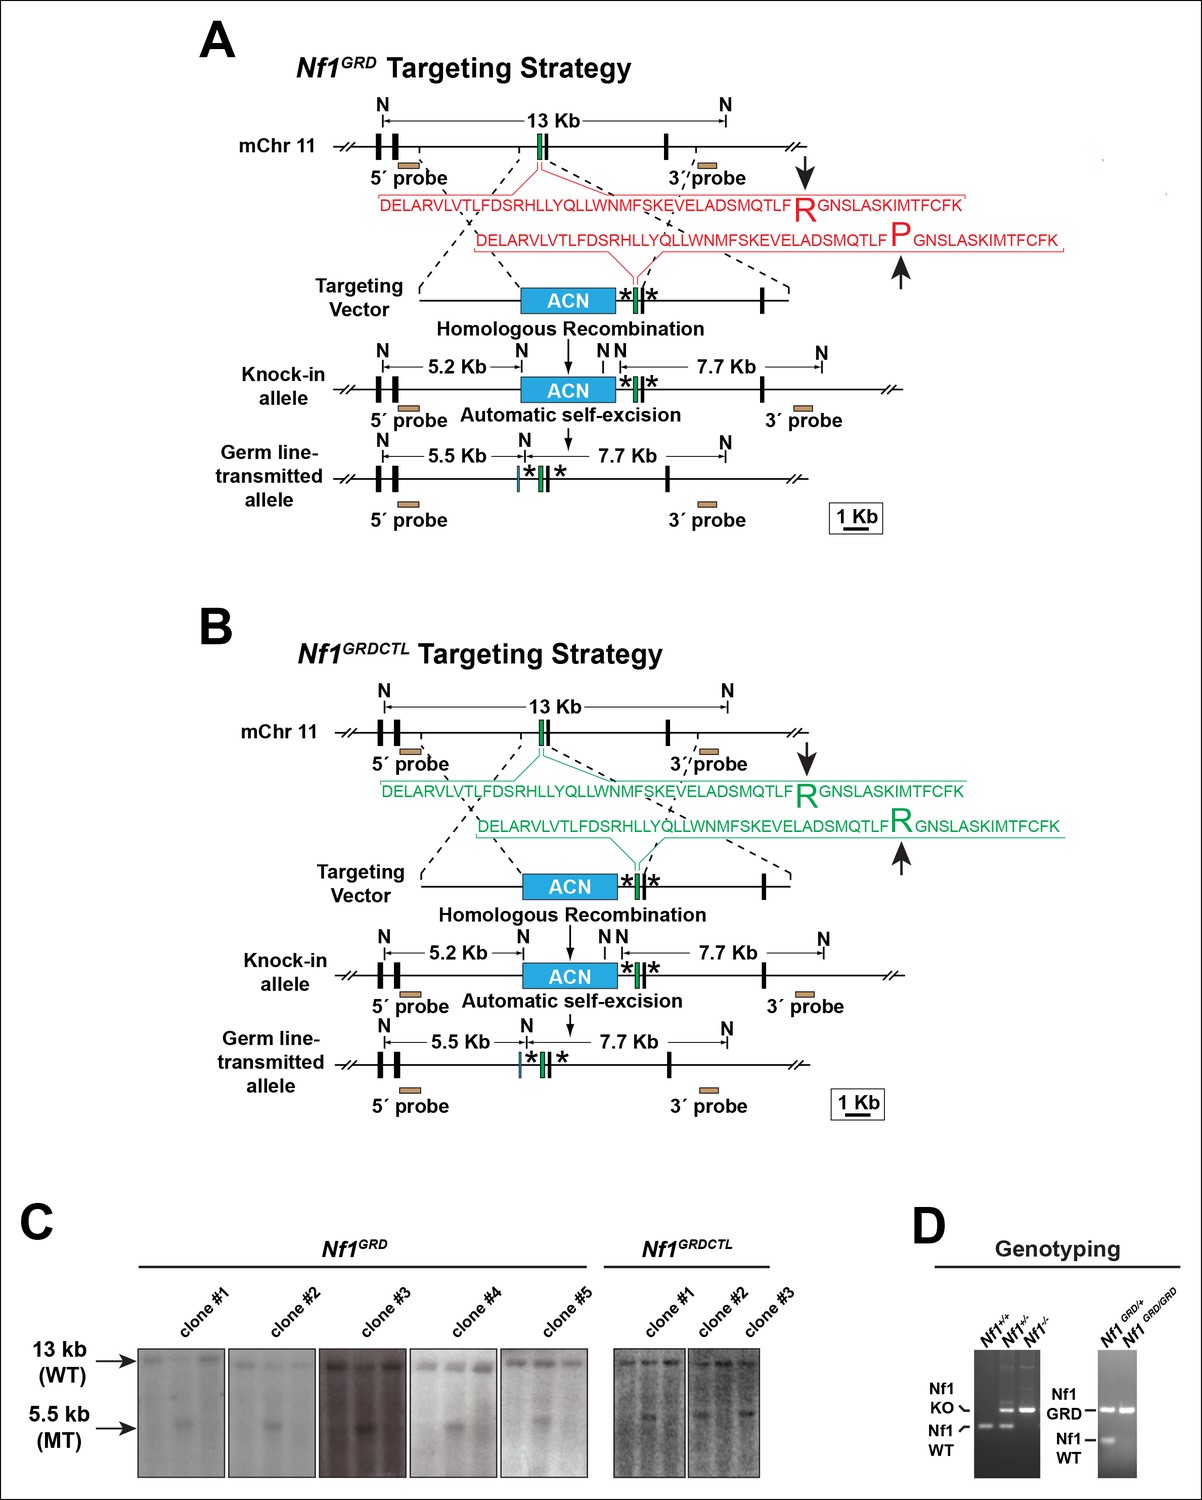
Generation of Nf1GRDand Nf1GRDCTL mouse lines.
(A) Schematic diagram outlining the targeting strategy to develop the Nf1GRD mouse line by modifying the endogenous mouse Nf1 locus with a mutation corresponding to the human NF1 R1276P missense allele. This mutation abrogates neurofibromin GAP activity without impairing secondary or tertiary protein structure or reducing cellular levels of neurofibromin (Klose, et al., 1998). (B) Strategy to develop the Nf1GRDCTLknock-in 'control' mouse by targeting the endogenous mouse Nf1 locus with a construct identical to that used to target the NF1 R1276P mutation in (A) with the exception that no mutation is introduced. Knock-in Nf1GRDCTLmice generated from this construct are a stringent control for Nf1GRDanimals. For both (A) and (B) asterisks denote regions where additional DNA sequences are identically introduced into introns as part of the targeting process. The 'an' cassette imparts G418 resistance and is self-excised in the male germ line. N = NcoI restriction endonuclease site. (C) Southern blots of genomic DNA from embryonic stem (ES) cell clones targeted with either the Nf1GRDor Nf1GRDCTLallele display a 13 kb wild type (WT) band as well as a 5.5 kb mutant (MT) band. Five and three positive clones were isolated with genotype Nf1GRDor Nf1GRDCTL, respectively, as shown. (D) DNA products from PCR reactions performed with primers specific for the Nf1 wildtype, Nf1 knockout (KO), or Nf1 GRD alleles using template DNA isolated from amniotic sacs of E10.5 embryos.
Figure 4—figure supplement 2
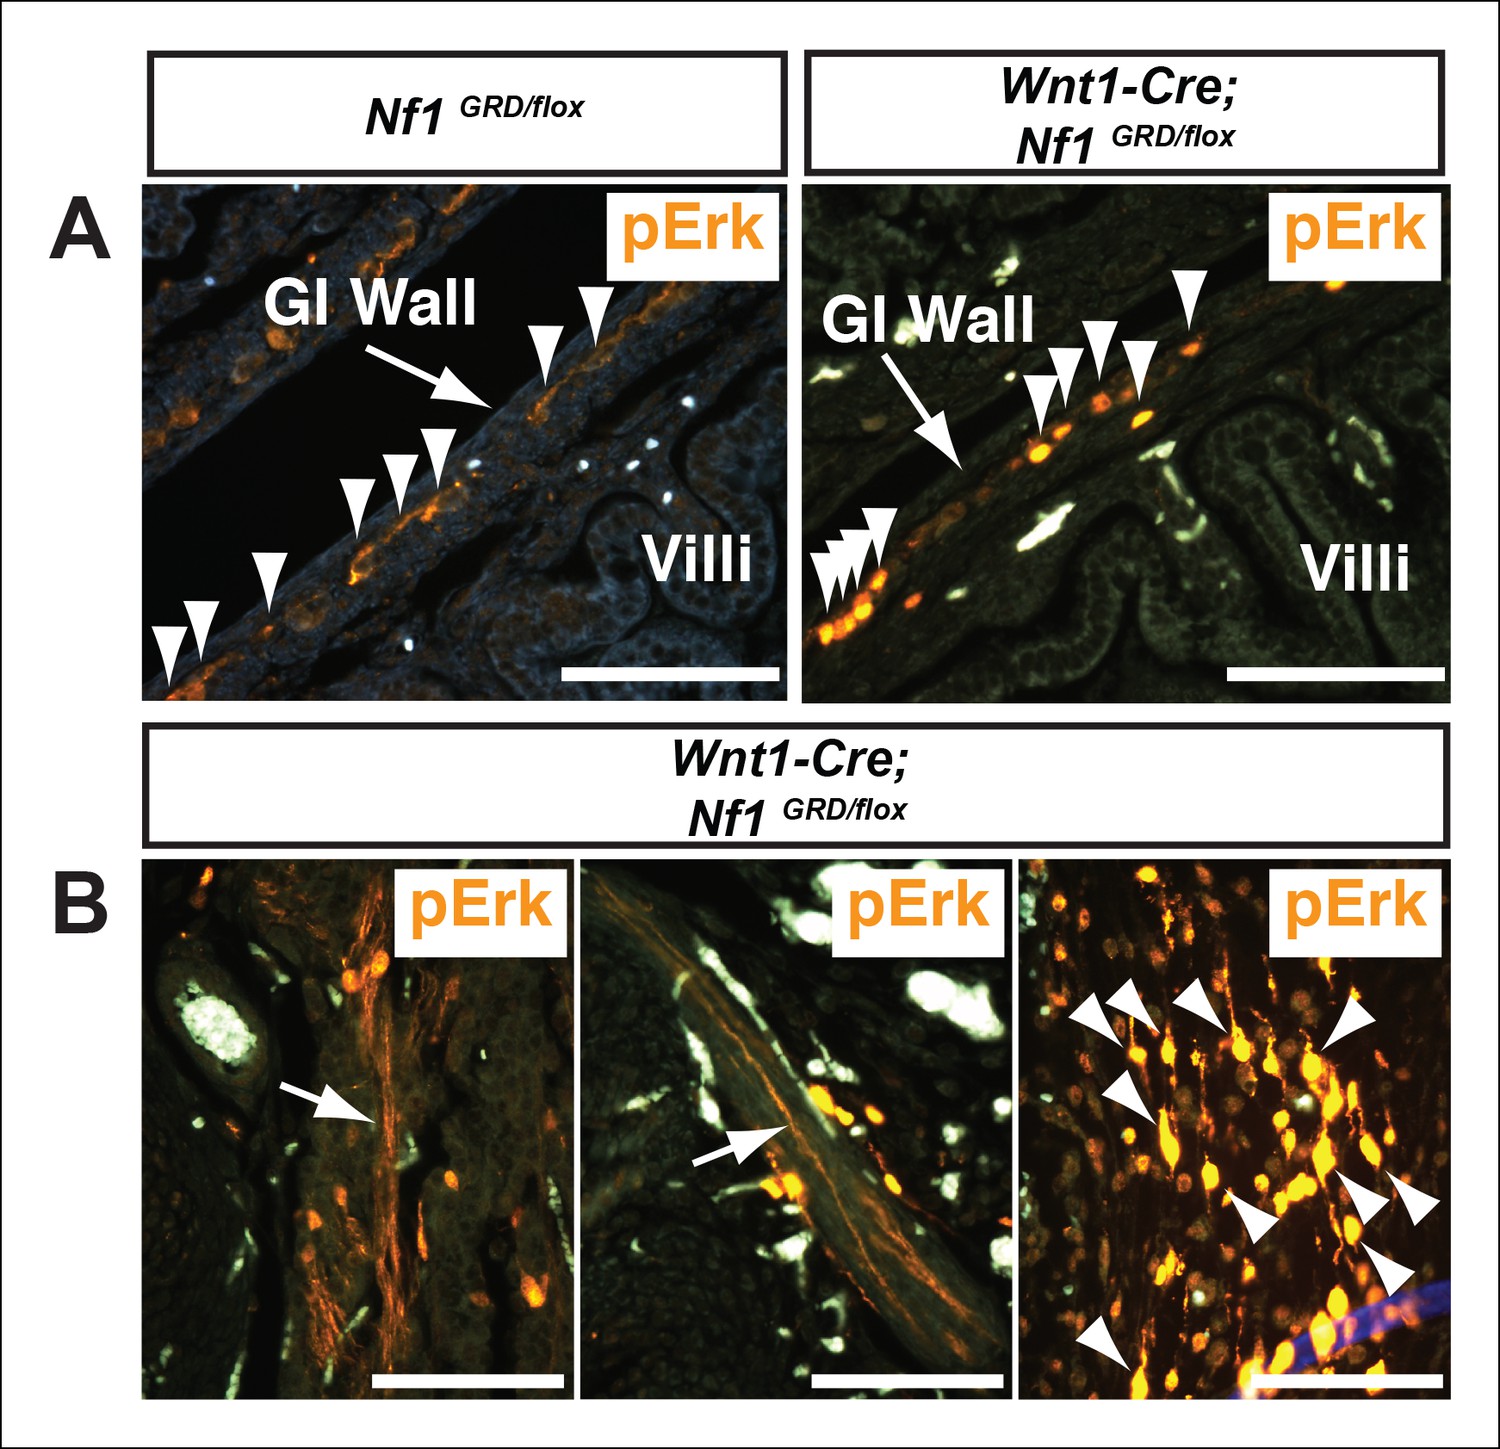
Increased pERK staining in neural crest derivatives of Nf1GRD/flox newborn animals following deletion by Wnt1-Cre.
(A) pERK staining was observed in neural crest-derived enteric ganglia within the intestinal wall that was more evident in Wnt1-Cre; Nf1GRD/flox animals (right panel). Arrowheads indicate cells exhibiting positive staining. (B) Both axons (arrows) and nerve cell bodies (arrowheads) were readily visualized in Wnt1-Cre; Nf1GRD/flox newborns but not in control animals (data not shown).
Figure 5
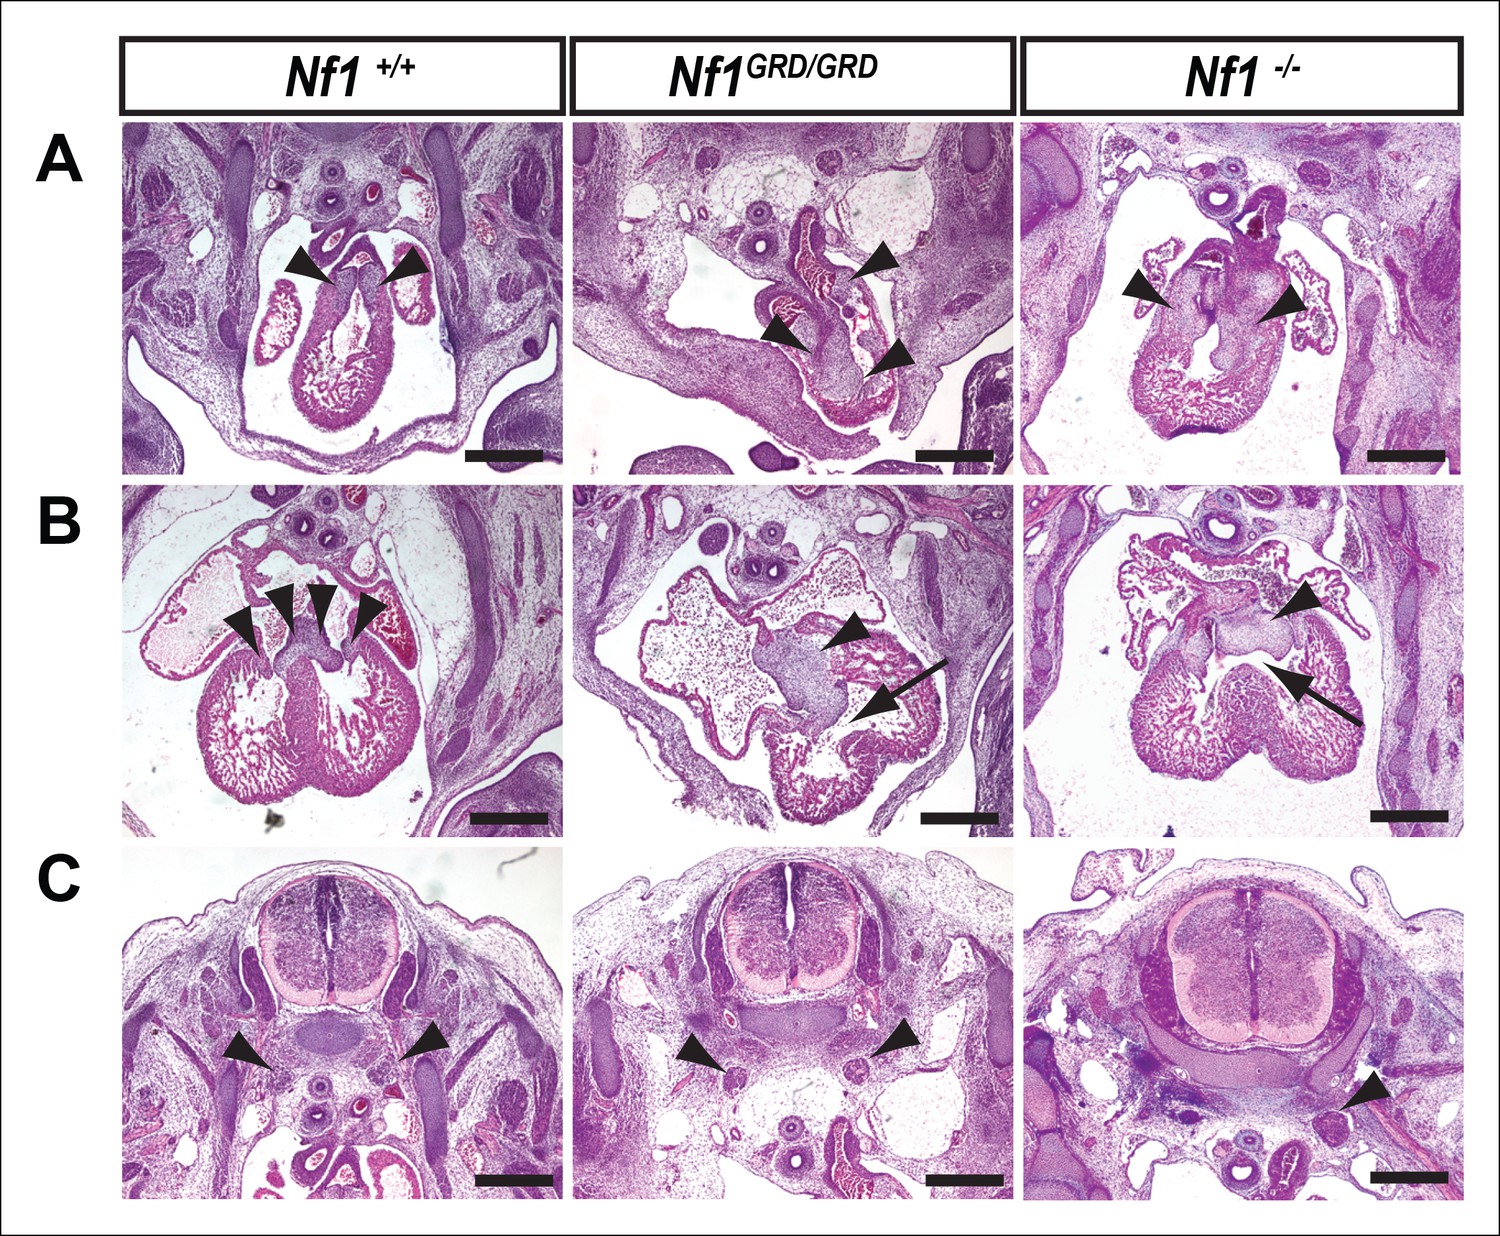
Inactivation of Nf1 GRD function affects heart and sympathetic ganglia development.
(A) Sections of hearts from E12.5-13.5 Nf1+/+, Nf1GRD/GRD, and Nf1-/- embryos. The enlarged endocardial cushions in hearts from Nf1GRD/GRD embryos (arrowheads) are similar to the oversized cushions of Nf1-/- embryos. (B) Enlarged atrioventricular endocardial cushions (arrowheads) and ventricular septa defects (arrows) in Nf1GRD/GRD and Nf1-/- embryos. (C) Sympathetic ganglia (arrowheads) are similarly enlarged in Nf1GRD/GRD and Nf1-/- embryos. Scale bars = 500 μm.
Figure 6
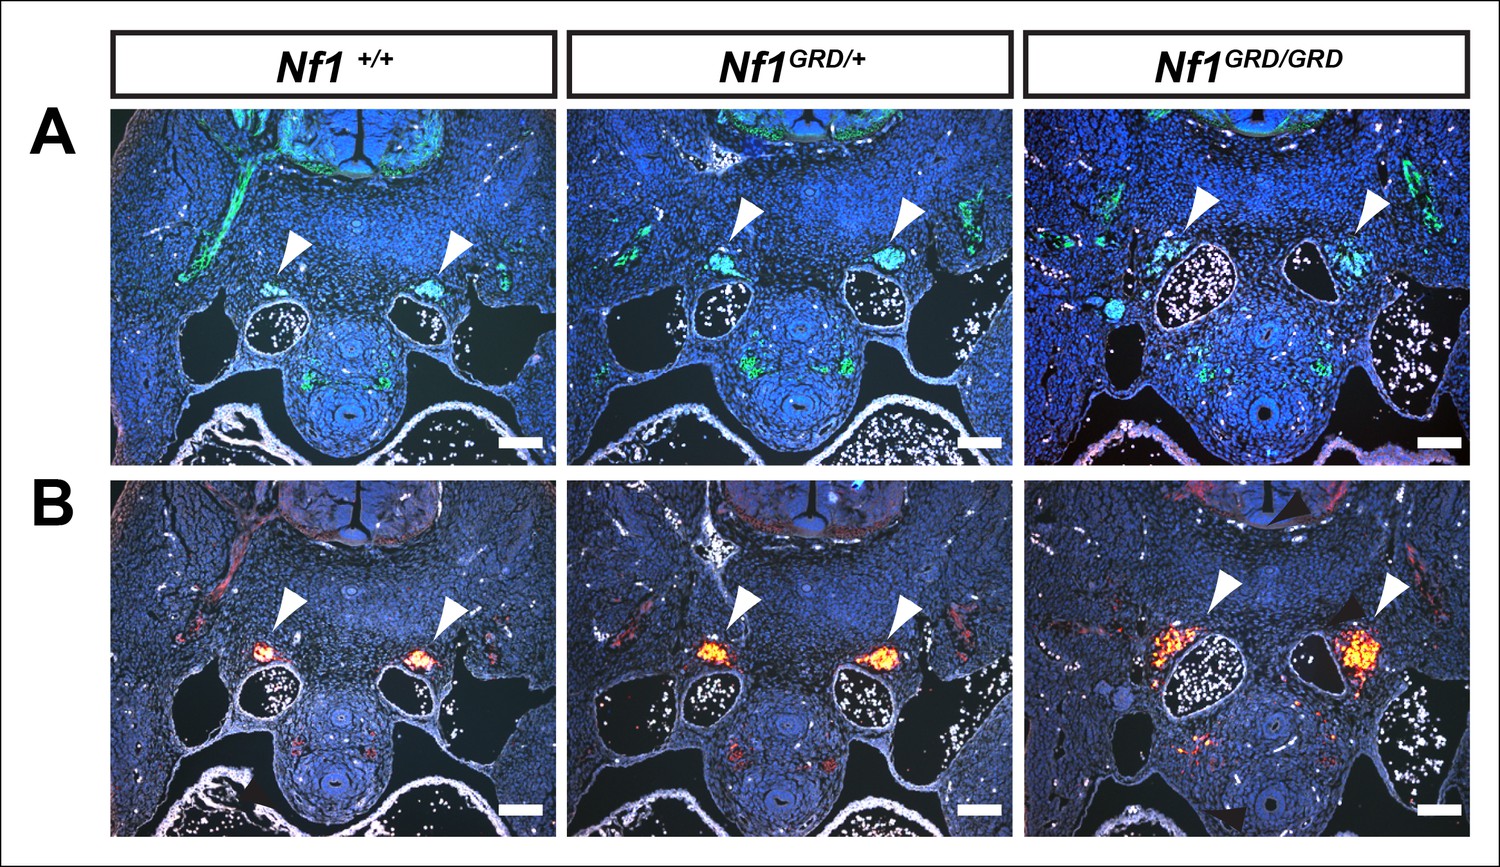
Enlarged sympathetic ganglia in E11.5 Nf1GRD/GRD embryos.
(A) Transverse sections of E11.5 Nf1+/+, Nf1GRD/+, and Nf1GRD/GRD embryos stained with antibodies against neurofilament. Arrowheads indicate sympathetic ganglia. (B) Transverse sections of E11.5 Nf1+/+, Nf1GRD/+, and Nf1GRD/GRD embryos stained with antibodies against tyrosine hydroxylase. Scale bars = 100 μm.
Figure 7
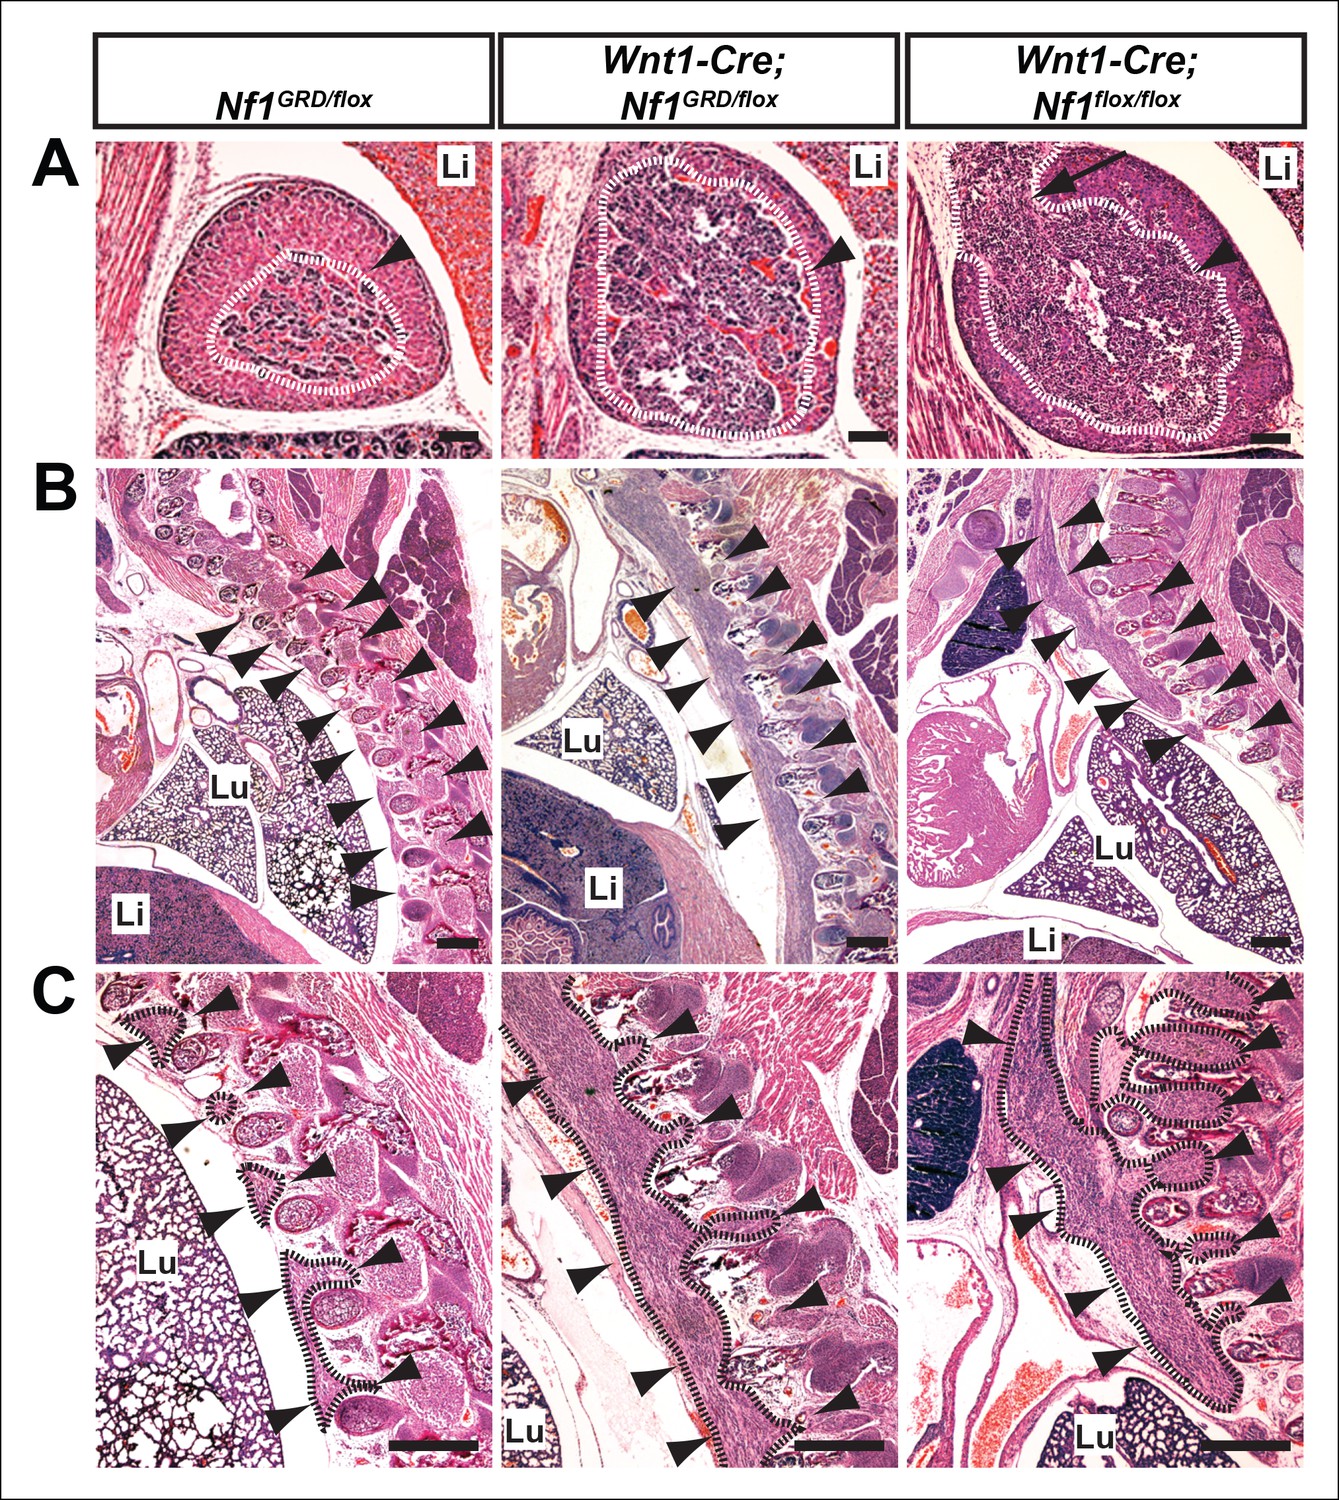
Hyperplasia of neural crest derivatives is similar in Nf1GRD/flox and Nf1flox/flox newborn animals in which Nf1 is deleted in neural crest cells with Wnt1-Cre.
(A) Adrenal medullary tissue (demarcated in white and indicated with an arrowhead) contained within an adrenal gland of P0 wild-type, P0 Wnt1-Cre; Nf1GRD/flox, or E16.5 Wnt1-Cre; Nf1flox/flox animals. The tissue is similarly overgrown in Wnt1-Cre; Nf1GRD/flox and Wnt1-Cre; Nf1flox/flox newborns/fetuses. Scale bars = 100 μm. The arrow indicates a tumor-like medullary protrusion. (B) Sagittal sections showing peripheral ganglia (arrowheads) in Nf1GRD/flox newborn pups, and abnormally enlarged ganglia and tumor-like overgrowth of nerve tissue adjacent to the lumbar spine in a Wnt1-Cre; Nf1GRD/flox newborn pup and an E16.5 Wnt1-Cre; Nf1flox/flox fetuse. Scale bars = 500 μm. (C) Magnifications of images in (B), with hyperplastic tissue demarcated in black and marked by arrowheads. Lu, lung; Li, liver; Scale bars = 500 μm.
Figure 8

E11.5 Nf1GRD/GRD embryos form ectopic cardiac blood islands.
(A) Gross view of E11.5 Nf1+/+, Nf1GRD/+ and Nf1GRD/GRD littermates. (B) Isolated hearts from E11.5 Nf1+/+, Nf1GRD/+ and Nf1GRD/GRD embryos. Black arrowheads indicate blood-filled protrusions on the ventricle of the Nf1GRD/GRD heart. (C) Confocal Z-projections (Z interval = 5 μm) of CD31 (red), CD41 (cyan) and Runx1 (green) immunostained E11.5 Nf1+/+, Nf1GRD/+ and Nf1GRD/GRD embryos. Arrowheads point to blood islands on the ventricle of the Nf1GRD/GRDembryo. Scale bars = 500 μm. (D) Cell aggregates resembling blood islands (arrowheads) in hearts of E12.5 Nf1+/+, Nf1-/- and Nf1GRD/GRD embryos. Lower panels, are magnifications of images in top panels. Scale bars = 100 μm. (E) Single optical projection through the cardiac blood islands of an E11.5 Nf1GRD/GRD embryo immunostained for CD31 (red), Runx1 (green) and CD41 (cyan). Scale bars = 50 μm. (F) Quantification of blood islands on the ventricles of E11.5 embryos. One-way ANOVA and Bonferroni’s multiple comparison test applied to determine significance, error bars represent the SD. (G) Number of erythroid and myeloid progenitors per flushed E11.5 ventricle. One-way ANOVA and Bonferroni’s multiple comparison test applied to determine significance; error bars represent SD. Nf1+/+ n = 21, Nf1GRD/+ n = 22 and Nf1GRD/GRD n = 8. * indicates that p≤0.05 and *** indicates that p≤0.001. V: ventricle; A: atrium; FL: fetal liver; Mk: megakaryocyte; Mix: granulocyte-erythroid-monocyte-megakaryocyte; BFU-E: burst forming unit-erythroid; G/M: granulocyte-macrophage colonies.
Tables
Table 1
Genotypes from Nf1GRD/+ X Nf1GRD/+ intercrosses.
| Age | Total | +/+ | Nf1GRD/+ | Nf1GRD/GRD |
|---|---|---|---|---|
| E11.5 | 63 | 13 | 39 | 11 |
| E12.5 | 61 | 19 | 41 | 1 |
| P0 | 62 | 23 | 39 | 0 |
Table 2
Genotypes from Wnt1-Cre; Nf1GRD/+ X Nf1flox/flox crosses.
| Age | Total | Nf1flox/+ | Nf1GRD/flox | Wnt1-Cre;Nf1flox/+ | Wnt1-Cre;Nf1GRD/flox |
|---|---|---|---|---|---|
| E12.5-–16.5 | 27 | 10 | 5 | 3 | 7 * |
| E18.5-P0 | 80 | 32 | 18 | 18 | 0 ** |
-
*2 non-viable Wnt1-Cre; Nf1GRD/flox embryos were recovered at E12.5-–16.5
-
**12 non-viable Wnt1-Cre; Nf1GRD/flox pups were recovered at E18.5-P
Download links
A two-part list of links to download the article, or parts of the article, in various formats.
Downloads (link to download the article as PDF)
Open citations (links to open the citations from this article in various online reference manager services)
Cite this article (links to download the citations from this article in formats compatible with various reference manager tools)
Loss of neurofibromin Ras-GAP activity enhances the formation of cardiac blood islands in murine embryos
eLife 4:e07780.
https://doi.org/10.7554/eLife.07780


