Epithelial cells supply Sonic Hedgehog to the perinatal dentate gyrus via transport by platelets
- University of California, San Francisco, United States
- Korea Brain Research Institute, Republic of Korea
Figures
Figure 1
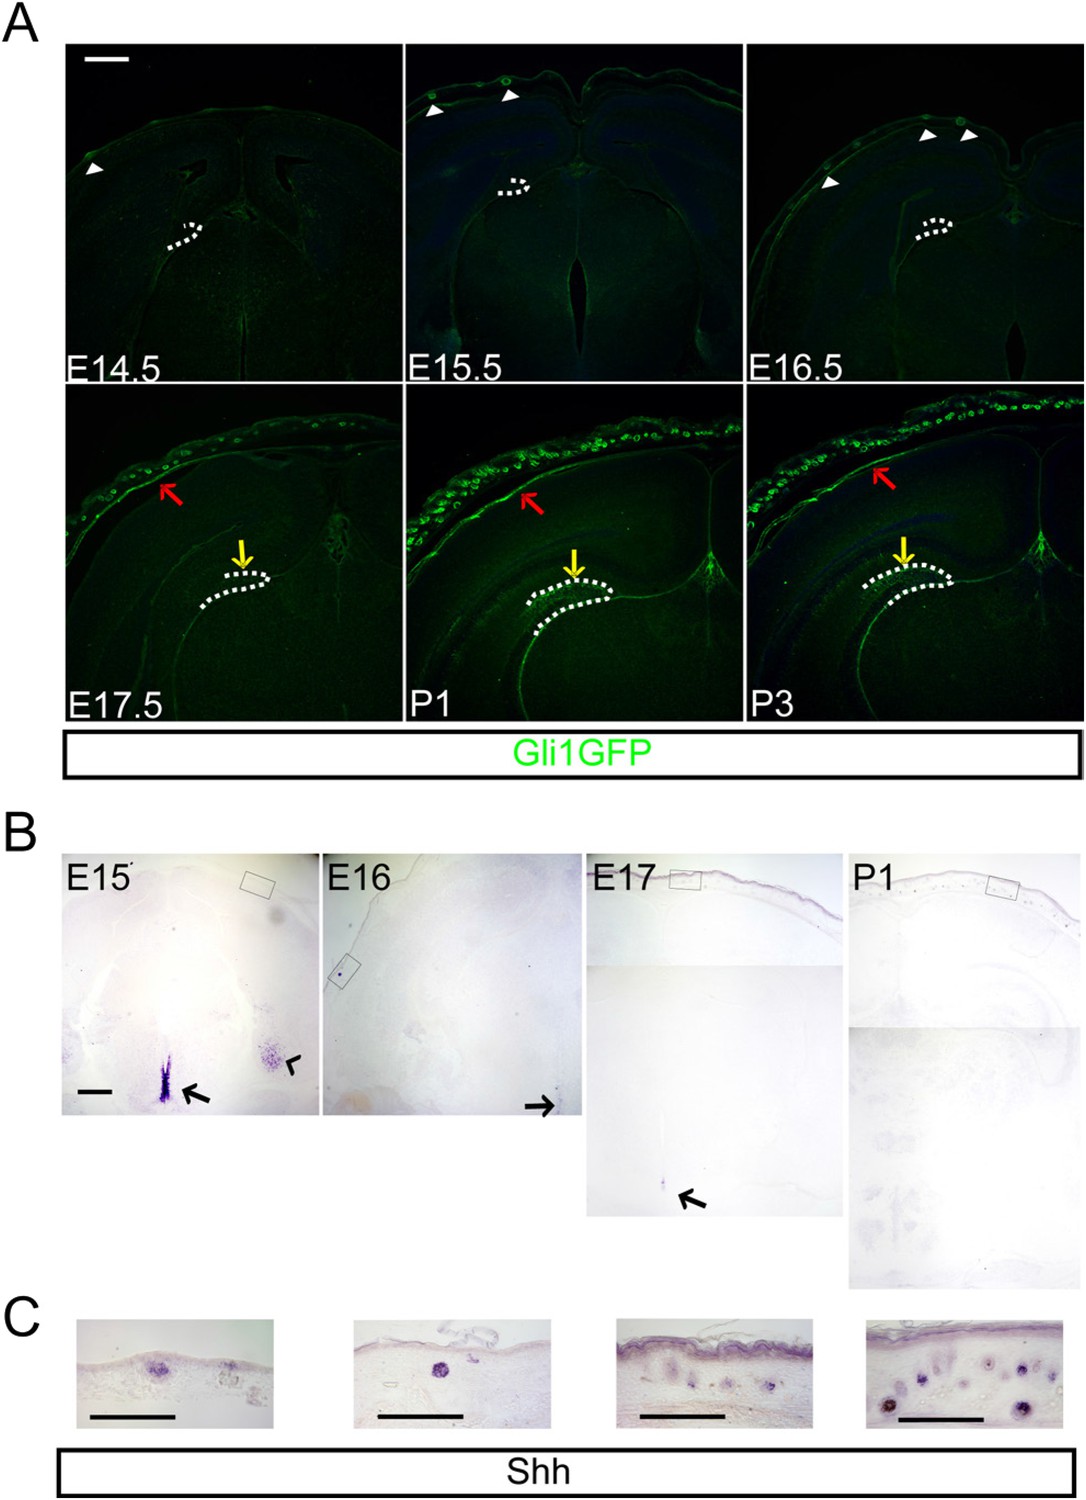
Hedgehog signaling is restricted in the dermal mesenchyme and dentate stem cells.
(A) Expression of Gli1-GFP shows the hedgehog-responding cells in the dermal mesenchyme (red arrows), and hair follicles (HFs) (arrow heads) and the dentate (yellow arrows) at the late embryogenesis. (B) Expression of Sonic hedgehog (Shh) is restricted in the HFs (boxes) and the periventricular area of the third ventricle (arrows) and the entorhinal cortex (arrow head). (C) High-power images of Shh expression in the HFs of boxed areas in (B). Scale bars: A, B = 400 μm, C = 100 μm.
Figure 2 with 1 supplement
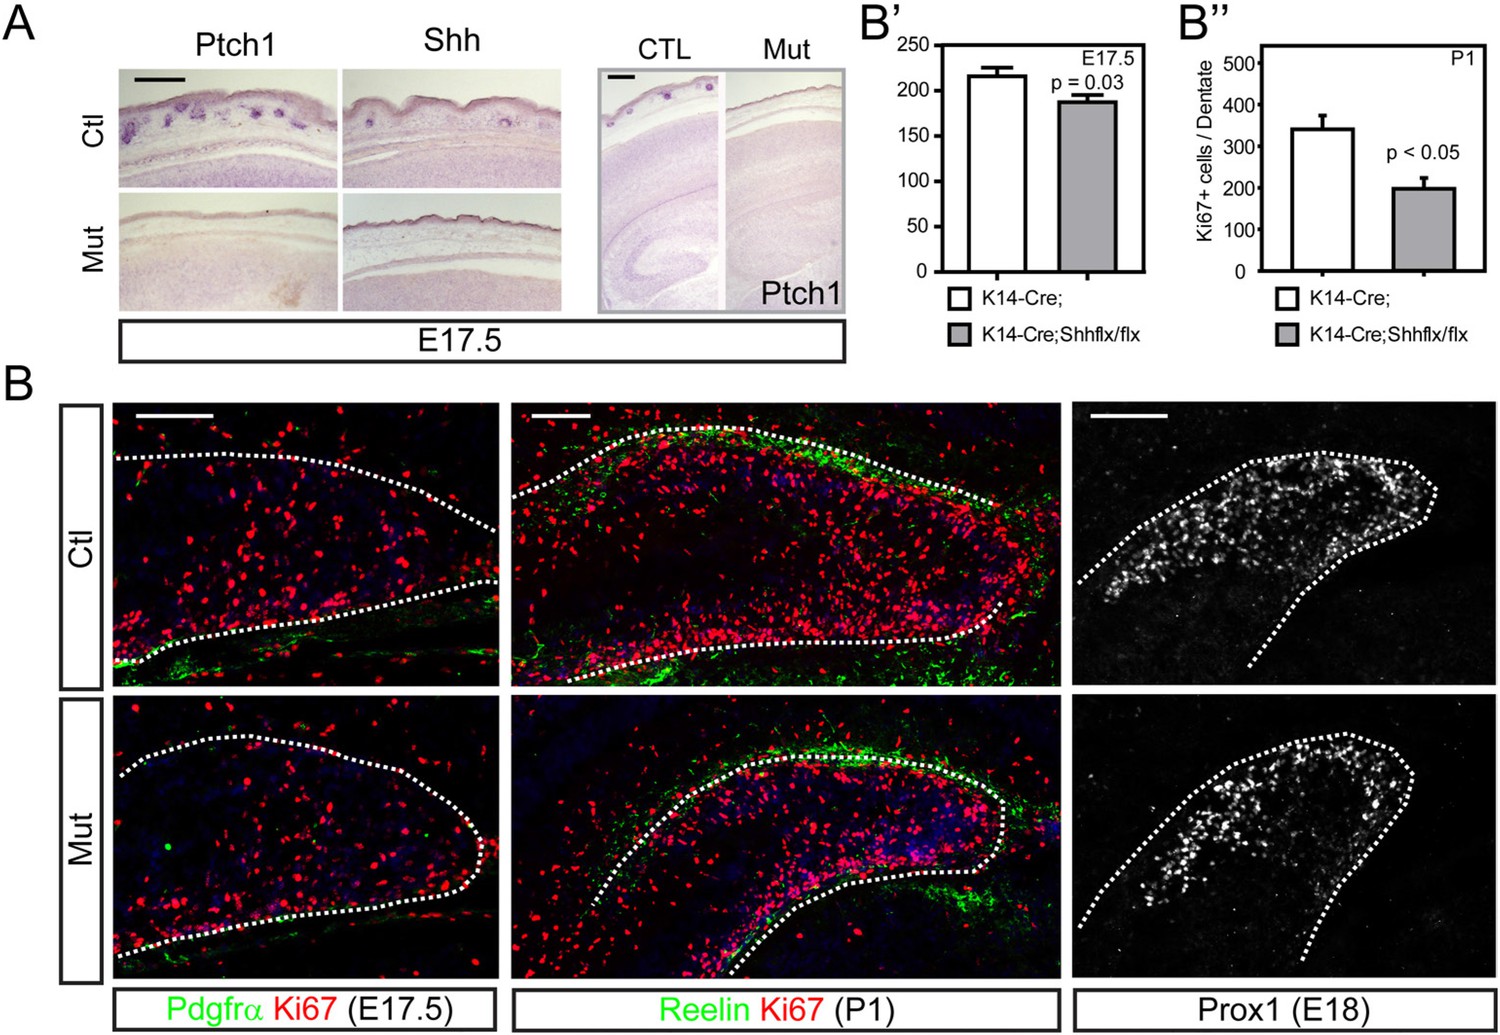
Conditional inhibition of dermal Shh expression led to reduced dentate progenitors.
(A) Krt14-Cre was used to conditionally delete Shh expression (Krt14-cre;Shhflx/flx, in short Mut in this figure). Expression of Ptch1, a downstream target gene of Shh signaling, and Shh showed absence of Shh expression in the mutant HFs. The right panel shows Ptch1 expression in the forebrain at E17.5. (B) Expression of a dentate progenitor marker Ki67 at E17.5 and P1. Pdgfrα and Reelin show meningeal cells and Cajal Retzius cells outlining the dentate gyrus (DG), respectively. Prox1 shows dentate granule neurons at E18.5. (B′, B″) Plots show Ki67 + cells in the dentate at E17.5 (B′) and P1 (B″). Student t-test was used to determine the significant difference between groups. Scale bars: A = 200 μm, B = 100 μm. p = 0.03 (B′), <0.05 (B″). Dashed lines were used to outline the dentate.
Figure 2—figure supplement 1
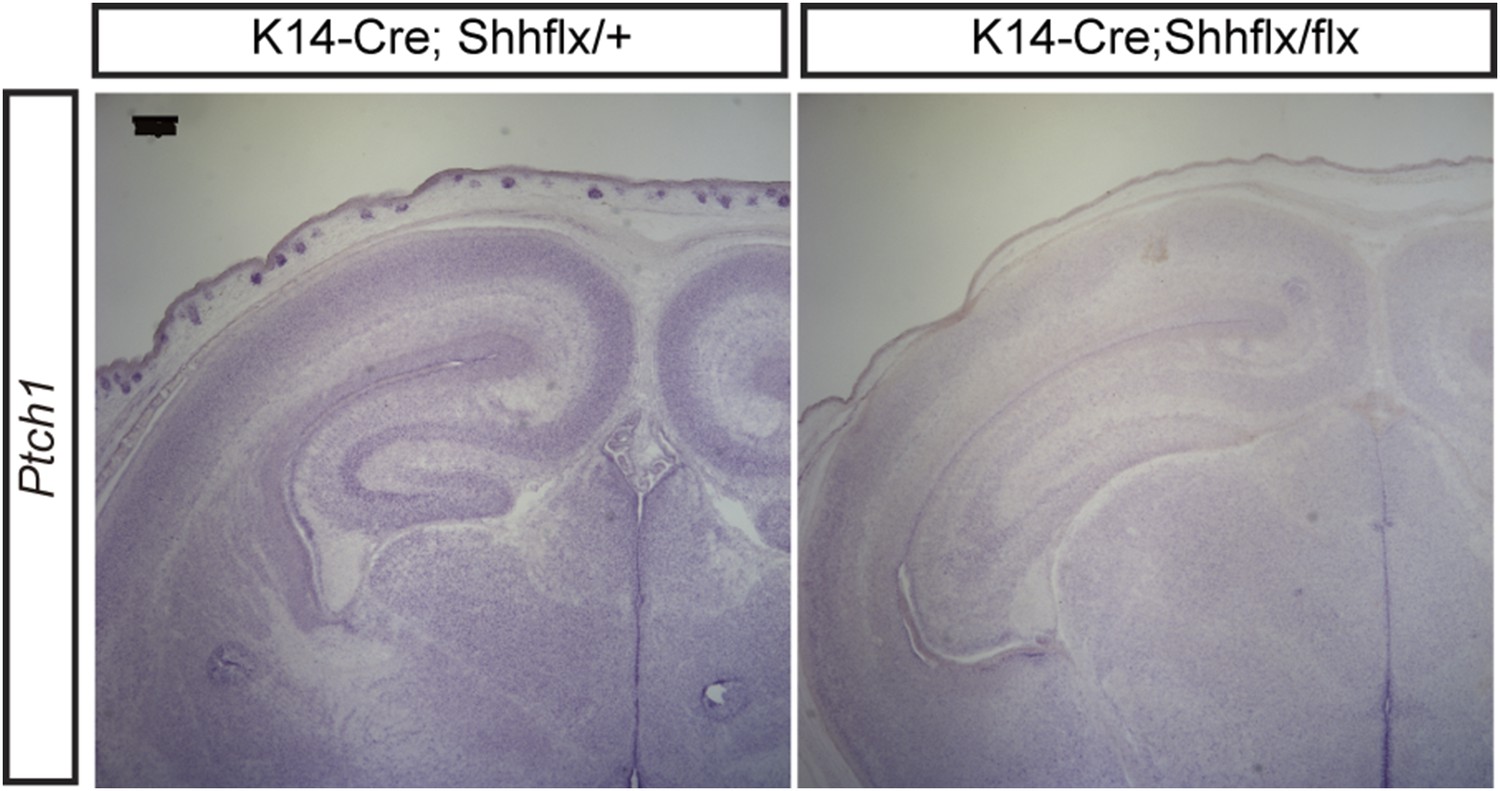
A representative image for in situ hybridization of Ptch1 using P1 Krt14-Cre;Shhflx mice.
Krt14-Cre;Shhflx/flx mutant shows reduction of Ptch1 in the skin but not in the ventral midline (scale bar = 200 μm).
Figure 3 with 2 supplements
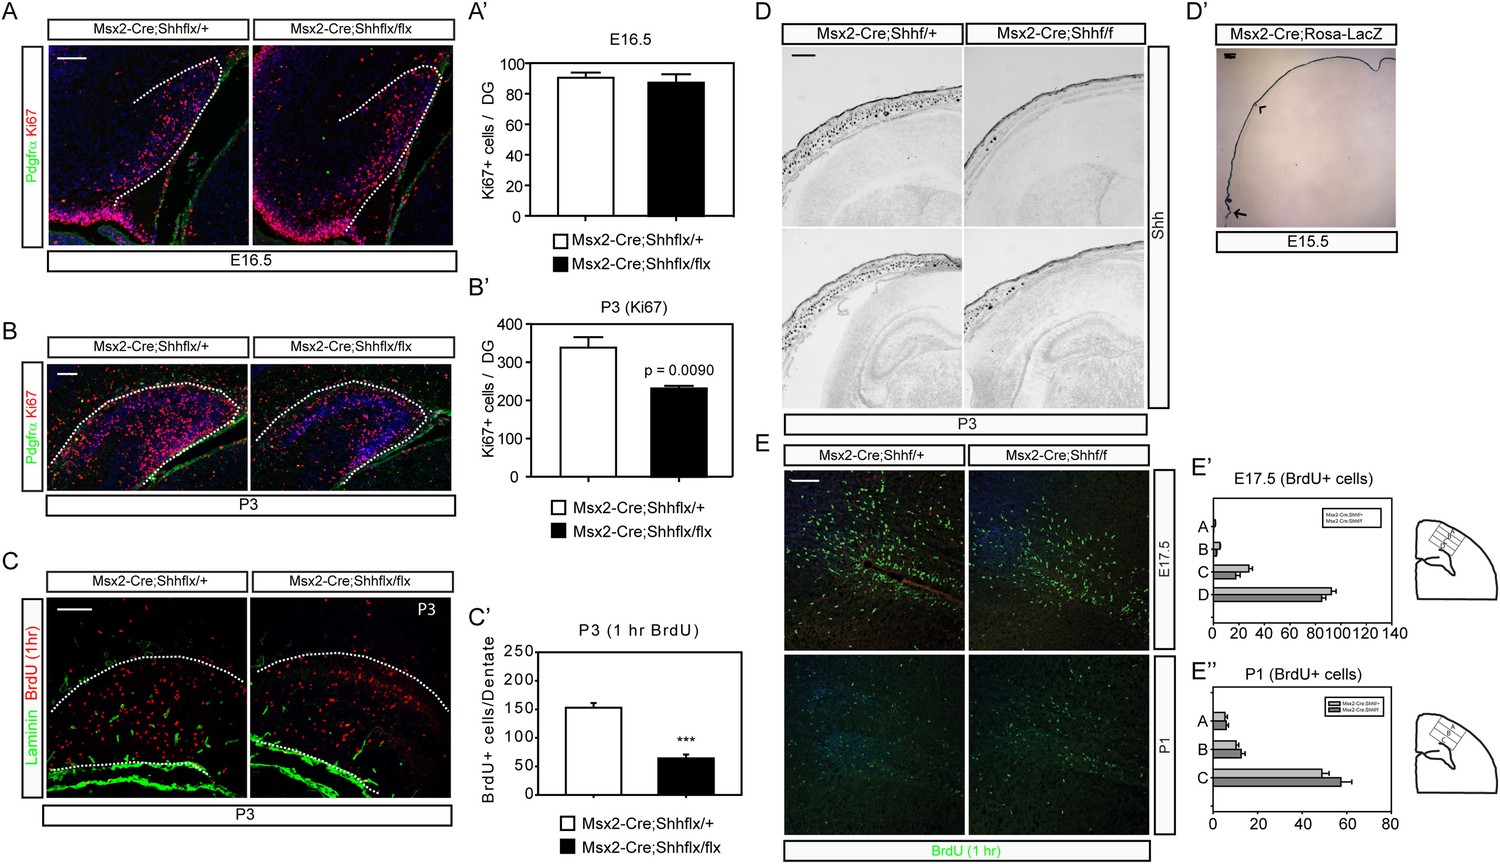
Msx2-Cre-mediated inhibition of dermal Shh expression reduced postnatal dentate progenitors.
(A–C) Dentate progenitors were stained with Ki67 (A, B) or BrdU (1 hr, (C)) from Msx2-Cre-mediated conditional inhibition of Shh expression at E16.5 (A) and P3 (B, C). (A′, B′, C′) The decrease of the dentate progenitors is presented at P3 from staining Ki67 or BrdU (1 hr) using embryos from six different litters (n = 6). (D) In situ hybridization of Shh at P3 shows the decrease of hair follicular Shh expression in the mutant (Msx2-Cre; Shhflx/flx). (E) Progenitors in the cortical subventricular zone (SVZ) were stained with 1 hr BrdU labeling. (E′, E″) Cortical BrdU expressing cells were measured by dividing the cortex into four (A-B-C-D, E17.5) or three (A-B-C, P1) bins from the pial layer to the ventricle as depicted in drawings on the right panel. Scale bars: A, B, C = 100 μm, D = 400 μm, E = 200 μm.
Figure 3—figure supplement 1
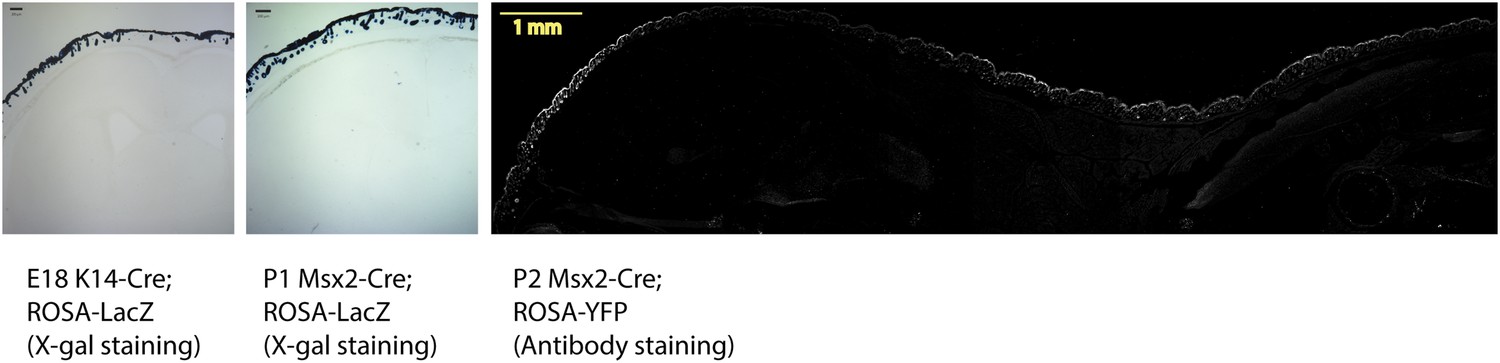
Two Cre reporter mice were used to reveal the expression of Krt14-Cre and Msx2-Cre in the skin.
For E18 Krt14-Cre and P1 Msx2-Cre, ROSA-LacZ reporter mice were used for X-gal staining (scale bar = 200 μm). A GFP-stained image for the sagittal section of P2 Msx2-Cre with a ROSA-Yfp reporter also show restricted Cre activities in the HFs and the skin (scale bar = 1 mm).
Figure 3—figure supplement 2
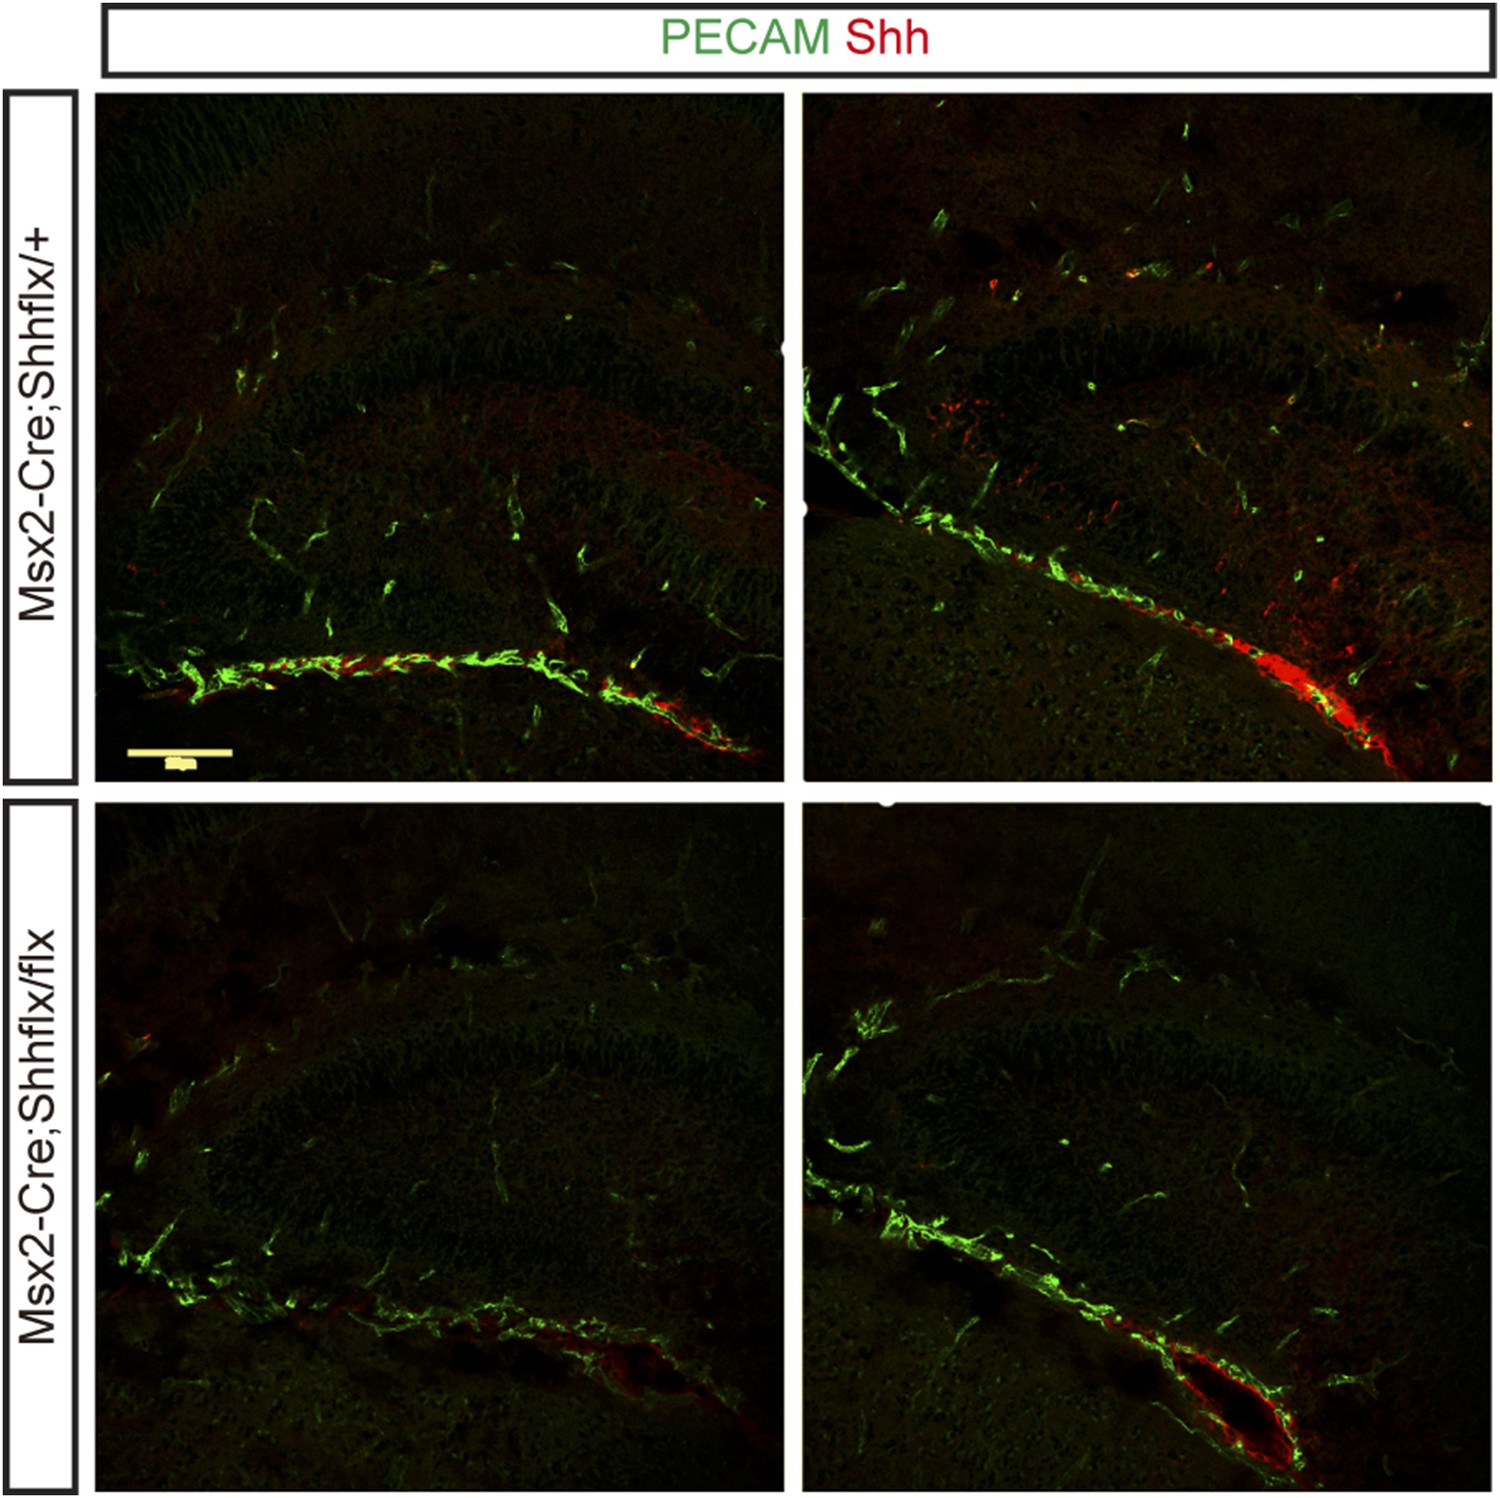
Immunostaining for Shh (Epitomics) and PECAM (BD Pharmigen, blood vessels) shows perivascular and dentate localization of Shh at P3.
Shh expression was reduced in both vascular and dentate areas of Msx2-Cre;Shhflx/flx mutants.
Figure 4 with 2 supplements

Reduced hedgehog-responding dentate progenitors in the postnatal mutant.
(A) To examine hedgehog signaling in the dentate, Ptch1-LacZ transgenic reporter mice were bred to Msx2-Cre;Shhflx/ mice. X-gal staining of the P3 DG shows reduced Ptch1+ cells in the mutant. (A′) X-gal + cells were quantified from sections obtained from three litters (n = 3). (B) Reduced hedgehog signaling in the skin was revealed by X-gal staining of skin tissues obtained from Msx2-Cre;Shhflx/+;Ptch1-LacZ and Msx2-Cre;Shhflx/flx;Ptch1-LacZ mice at P3. (C) Dentate progenitors were stained at P10 and P40 with BrdU (1 hr), Blbp, Lef1 (glial progenitors), Ki67 (intermediate progenitors). (C′) Numbers of marker positive cells were plotted. Four different litters were used to count cells from the DG (n = 4). Student t-test was used to address the statistical significance. **, p < 0.05; ***, p < 0.001. Scale bars: A, C = 100 μm, B = 200 μm.
Figure 4—figure supplement 1
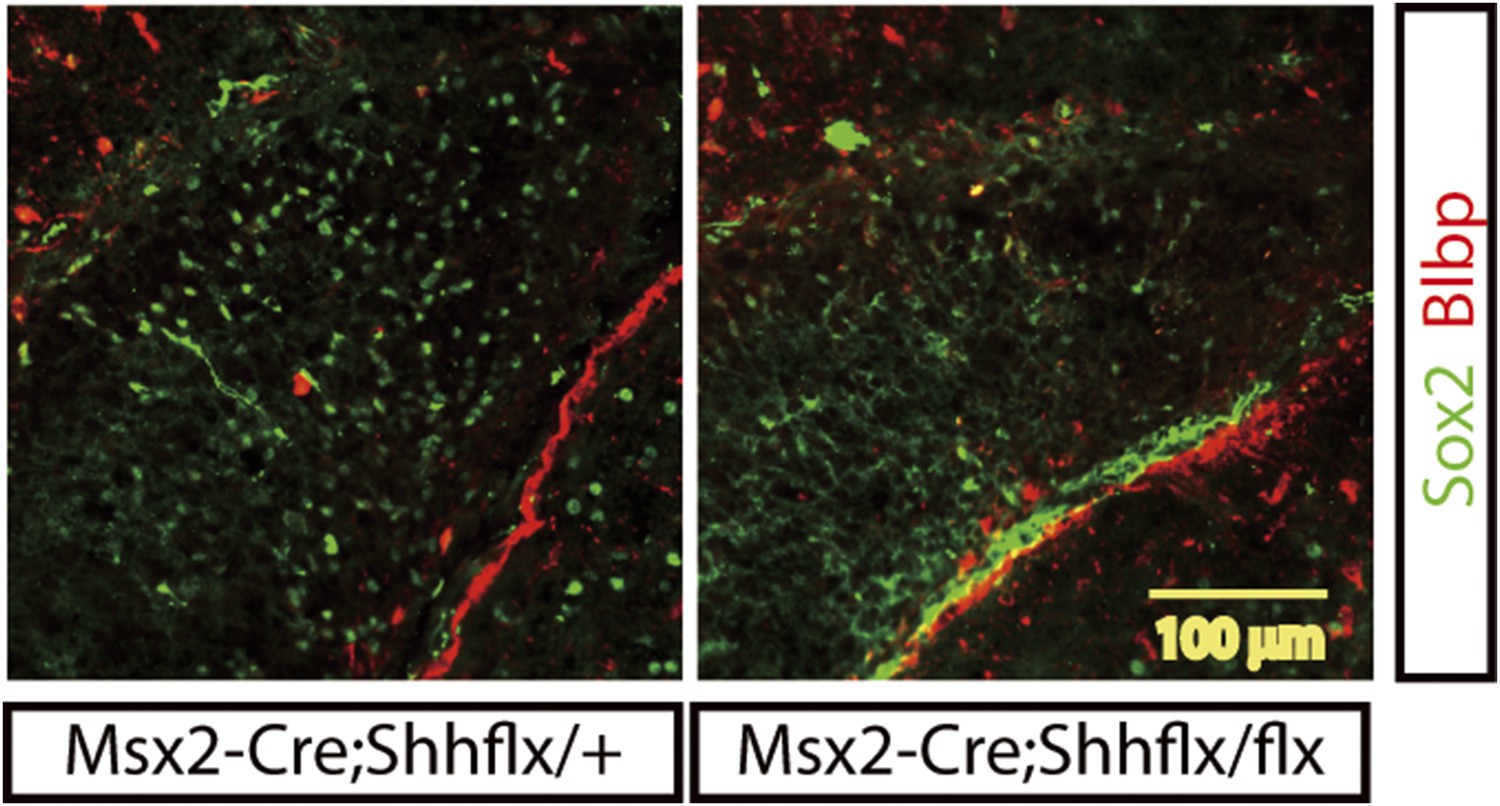
Expression of a neural stem cell marker, Sox2 (green), in the P1 DG.
Blbp (red) staining was used to mark the boundary of the DG, which shows perivascular glial cells and a few migrating glial cells in the infrapyramidal blade. Sox2-positive neural stem cells were scattered in the developing DG but a few Sox2-positive cells were detected in the upper blade of the Msx2-Cre;Shhflx/flx mutant DG (A, scale bar = 100 μm).
Figure 4—figure supplement 2
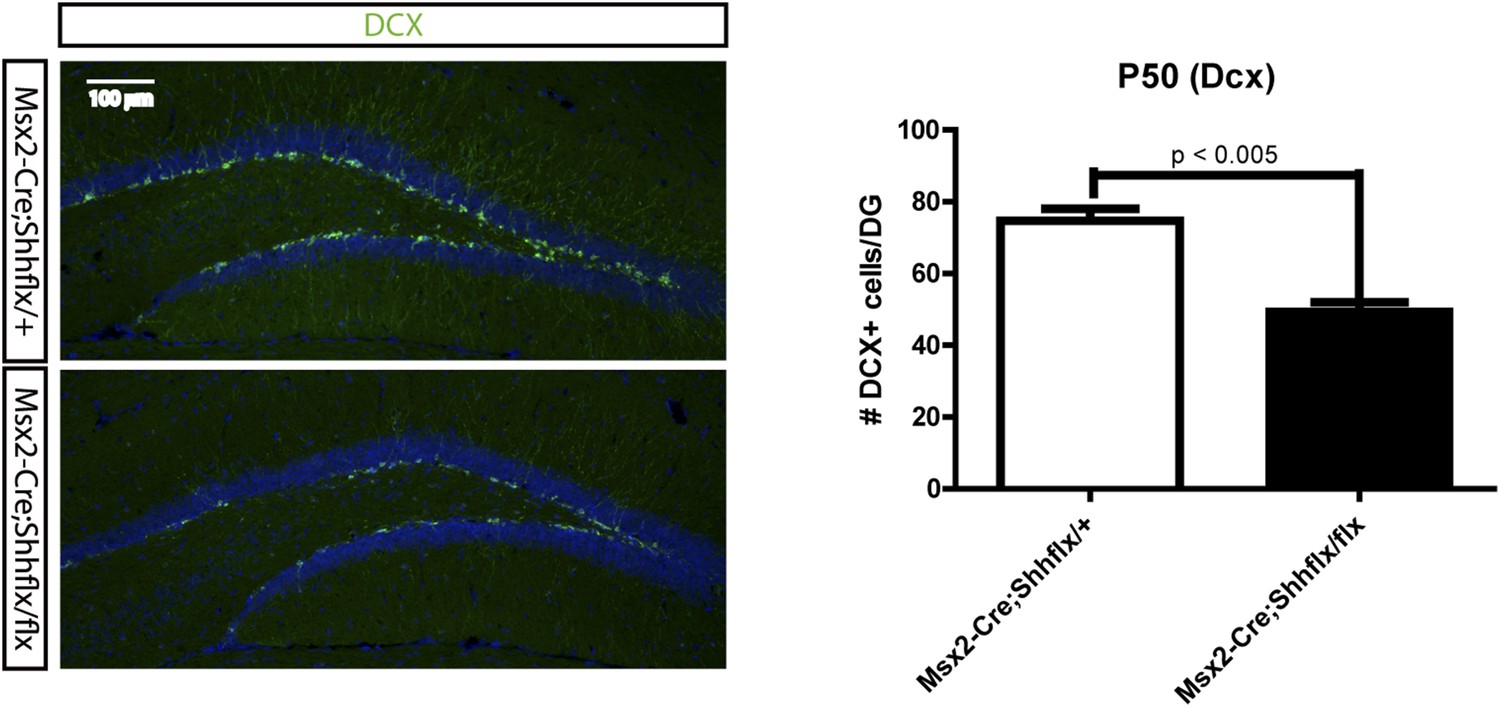
P50 Msx2-Cre;Shh mice were used to stain DCX to visualize the immature newly born neurons in the DG.
A rabbit anti-DCX antibody (Abcam) was used for the detection of newly born immature neurons of Msx2-Cre;Shhflx mice at P50. The upper blade of the DG was used to count DCX positive cells (scale = 100 μm).
Figure 5
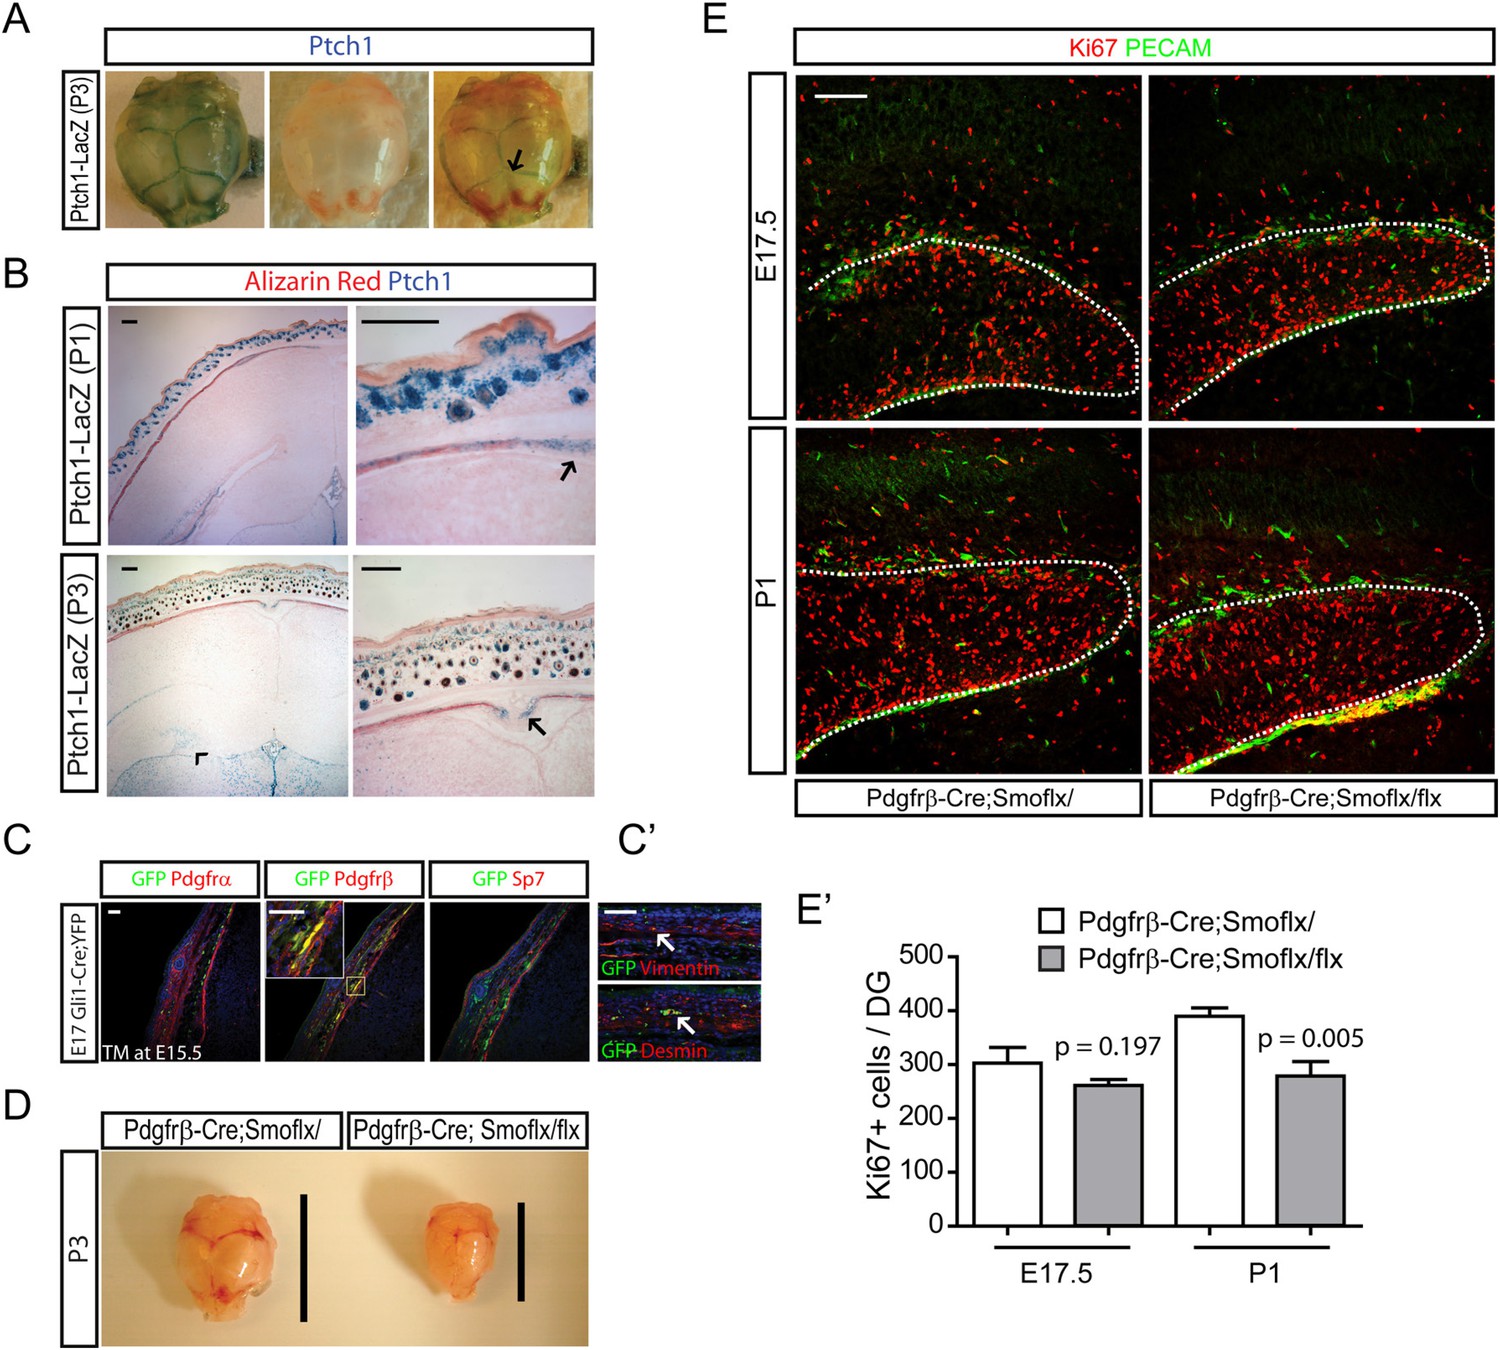
Development of perinatal dentate progenitors by inhibition of hedgehog signaling in the dermal mesenchyme.
(A) Ptch1-LacZ expression in the calvarium is presented. Arrow indicates X-gal staining of Ptch1-LacZ in the calvarial suture. (B) Ptch1-LacZ expression was detected in the fronts of developing calvarial bones (arrows). Ptch1-LacZ + dentate progenitors are obvious at P3 (arrow head). Fetal mouse heads were stained with X-gal and Alizarin red to counter-stain the calvarial bone. (C) Hedgehog-responding cells and their descendants in the calvarial and dermal mesenchymes are presented using E17.5 Gli1-CreERt2;Rosa-Yfp embryos that was injected with TM at E15.5. Sections were stained for GFP to label hedgehog-responding cells with mesenchymal markers such as Pdgfrα, Pdgfrβ (dermal mesenchyme, meninges), and Sp7 (calvarial mesenchyme). Inset shows co-localization of GFP and Pdgfrβ. (C′) GFP + cells were stained with pericyte markers such as Desmin and Vimentin. GFP + vascular cells are noted (arrows). (D) Hypoplasic skull bone development in the Pdgfrb-Cre;Smoflx/flx mutant at P3. Lines indicate the length of skull bones. (E) Dentate progenitors were stained for Ki67 using E17.5 and P1 Pdgfrb-Cre;Smoflx/+ and Pdgfrb-Cre;Smoflx/flx embryos. Dentate blood vessels were counter-stained with PECAM to outline the dentate (dashed lines). (E′) Four different litters were used to measure the decrease of dentate progenitors in the mutant (n = 4). Student t-test was used to test the significant difference of the number of Ki67 + cells. p values are presented in the graph. Scale bars: B, E = 200 μm, C, C′ = 100 μm.
Figure 6

The weak integrity of the BBB in the fetal dentate.
(A) E17.5 embryos and P1 pups were perfused with biotin-conjugated 70 KDa dextran and sections of the DG were stained for biotin. Arrows indicate the dextran outside blood vessels. (B) Gli1-CreERt2 pups (TM at E17.5) were used to stain hedgehog-responding cells (GFP+) and blood vessels (PECAM). Hedgehog-responding Gli1+ dentate progenitors have endfeet wrapping blood vessels forming neurovascular units. Magnified images on the right panels show representative GFP + cells. Yellow dashed lines mark the meningeal blood vessels of the DG. (C) P5 Gli1-GFP pups were perfused with biotin-conjugated cadaverine to reveal the area of the DG with leaky blood vessels. GFP + hedgehog-responding cells are surrounded by the dentate granule neurons uptaking the dyes (arrows). Dashed lines mark the meningeal blood vessels of the DG. (D) P5 CD1 pups were perfused with biotin-conjugated 70 KDa dextran and sections were stained for biotin. (D′) Biotin signals from the section of (D) were used to measure the permeability of blood vessels in the hippocampus (CA1), and the DG (DG). The area (100 μm2) surrounding blood vessels was selected to count the transcytosed dextran dyes (n = 6). (E) Staining for fibrinogen (Fib), a marker for leaky blood vessels, was conducted at E17.5 and P1 in the DG. Arrows indicate the leaky blood vessels. (F) CD41, a marker for platelets, was used to stain the dermal platelets (including megakaryocytes) and circulating platelets in sagittal sections at P1. The boxed area is presented as a high-power image on the right. Student t-test was used to address the statistical significance. ***, p < 0.001. Scale bars: A, D, F = 200 μm, B, C, E = 100 μm.
Figure 7 with 4 supplements
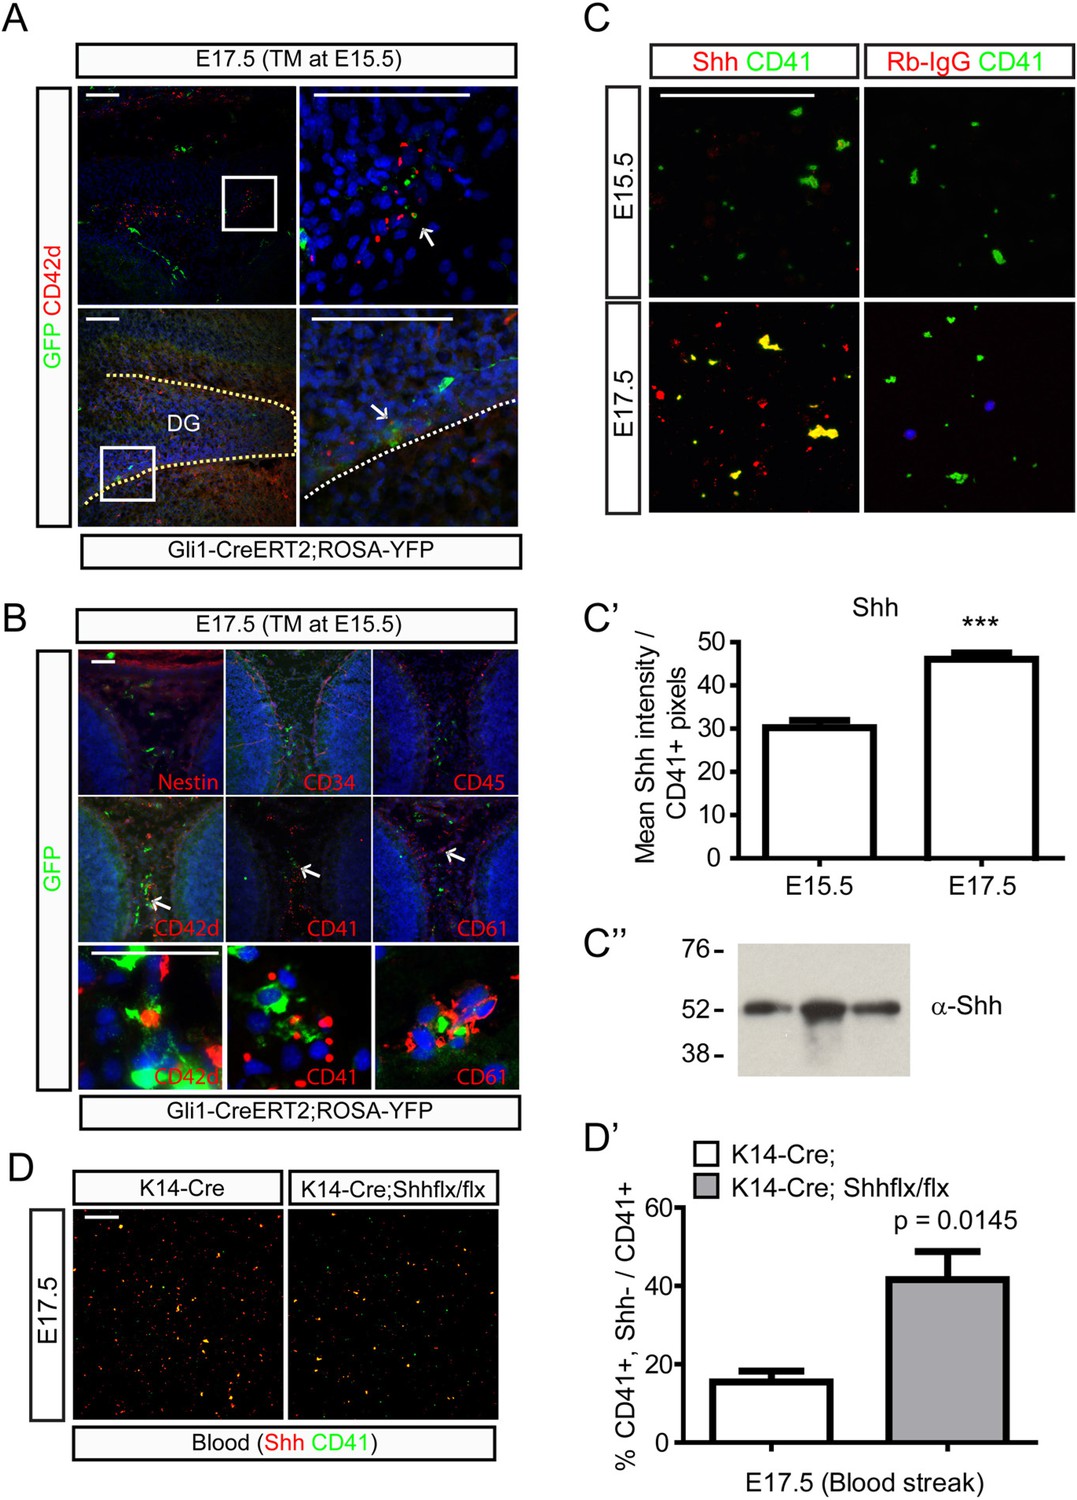
Platelets and their neighboring cells respond to hedgehog signaling in the dermal and the dentate blood circulation.
(A) Pregnant Gli1-CreERt2;Rosa-Yfp mice were injected with TM at E15.5 and embryos were collected at E17.5 to co-stain hedgehog-responding cells and a platelet marker, Cd42d. Top panels show the GFP+;CD42d + platelets (arrow) in the front of calvarial bone growth. Bottom panels show GFP+;CD42d + platelets (arrow) in the blood vessels covering the DG. Boxed areas are presented as a high-power image on the right. (B) E17.5 embryos (Gli1-CreERt2;Rosa-Yfp, TM at E15.5) were stained with Nestin, CD34 (hematopoietic, mesenchymal progenitor cells), CD45 (hematopoietic cells not in platelets), and platelet markers such as CD42d, CD41, and CD61. Arrows indicate GFP+;CD42d + platelets in the dorsal dermal mesenchyme. Bottom panels present high-power images of cells (arrows). (C) Blood streaks from E15.5 and E17.5 embryos were used to stain CD41 + platelets and Shh. Anti-rabbit IgG (Rb-IgG) was used for the negative control of Shh staining. (C′) Shh signal intensities from CD41 + platelets were measured to show the increase of Shh in the platelets at E17.5 (n = 6), which correlates with the expansion of hair follicular Shh. (C″) Western blot analysis was conducted using E17.5 blood samples immunoprecipitated with CD41 antibodies. Three different blood samples were loaded. (D) Blood streaks were obtained from E17.5 Krt14-Cre and Krt14-Cre;Shhflx/flx embryos to stain Shh and CD41. (D′) Ratio of CD41 + platelets without Shh from total CD41 + platelets was measured (n = 6). Student t-test was used to address the statistical significance. ***, p < 0.0001. Scale bars: A = 200 μm, B, C, D = 100 μm.
Figure 7—figure supplement 1
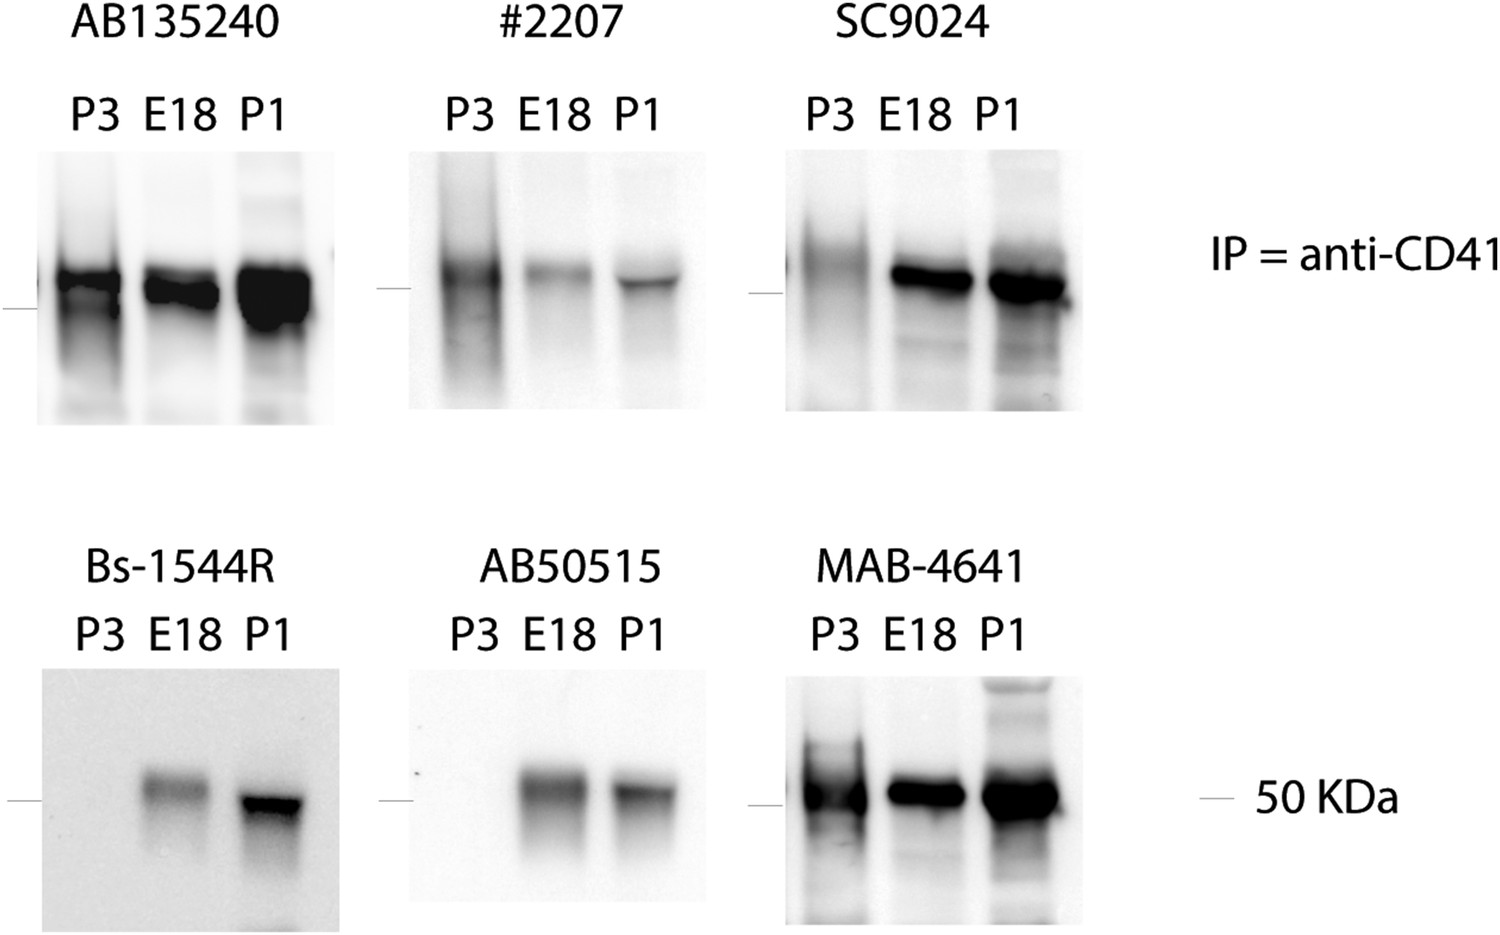
Plasma samples from perinatal mice (E18 – P3) were immunoprecipitated using anti-CD41 antibodies followed by Dynabead-conjugated Protein A (Life Technologies).
Immunoprecipitated protein extracts were detected using the Shh antibodies used in N-SIM imaging (Figure 7—figure supplement 2). Rabbit anti-Shh (#2207) was obtained from Cell Signaling Technology and did not detect Shh in cell staining experiment (Figure 7—figure supplement 1).
Figure 7—figure supplement 2
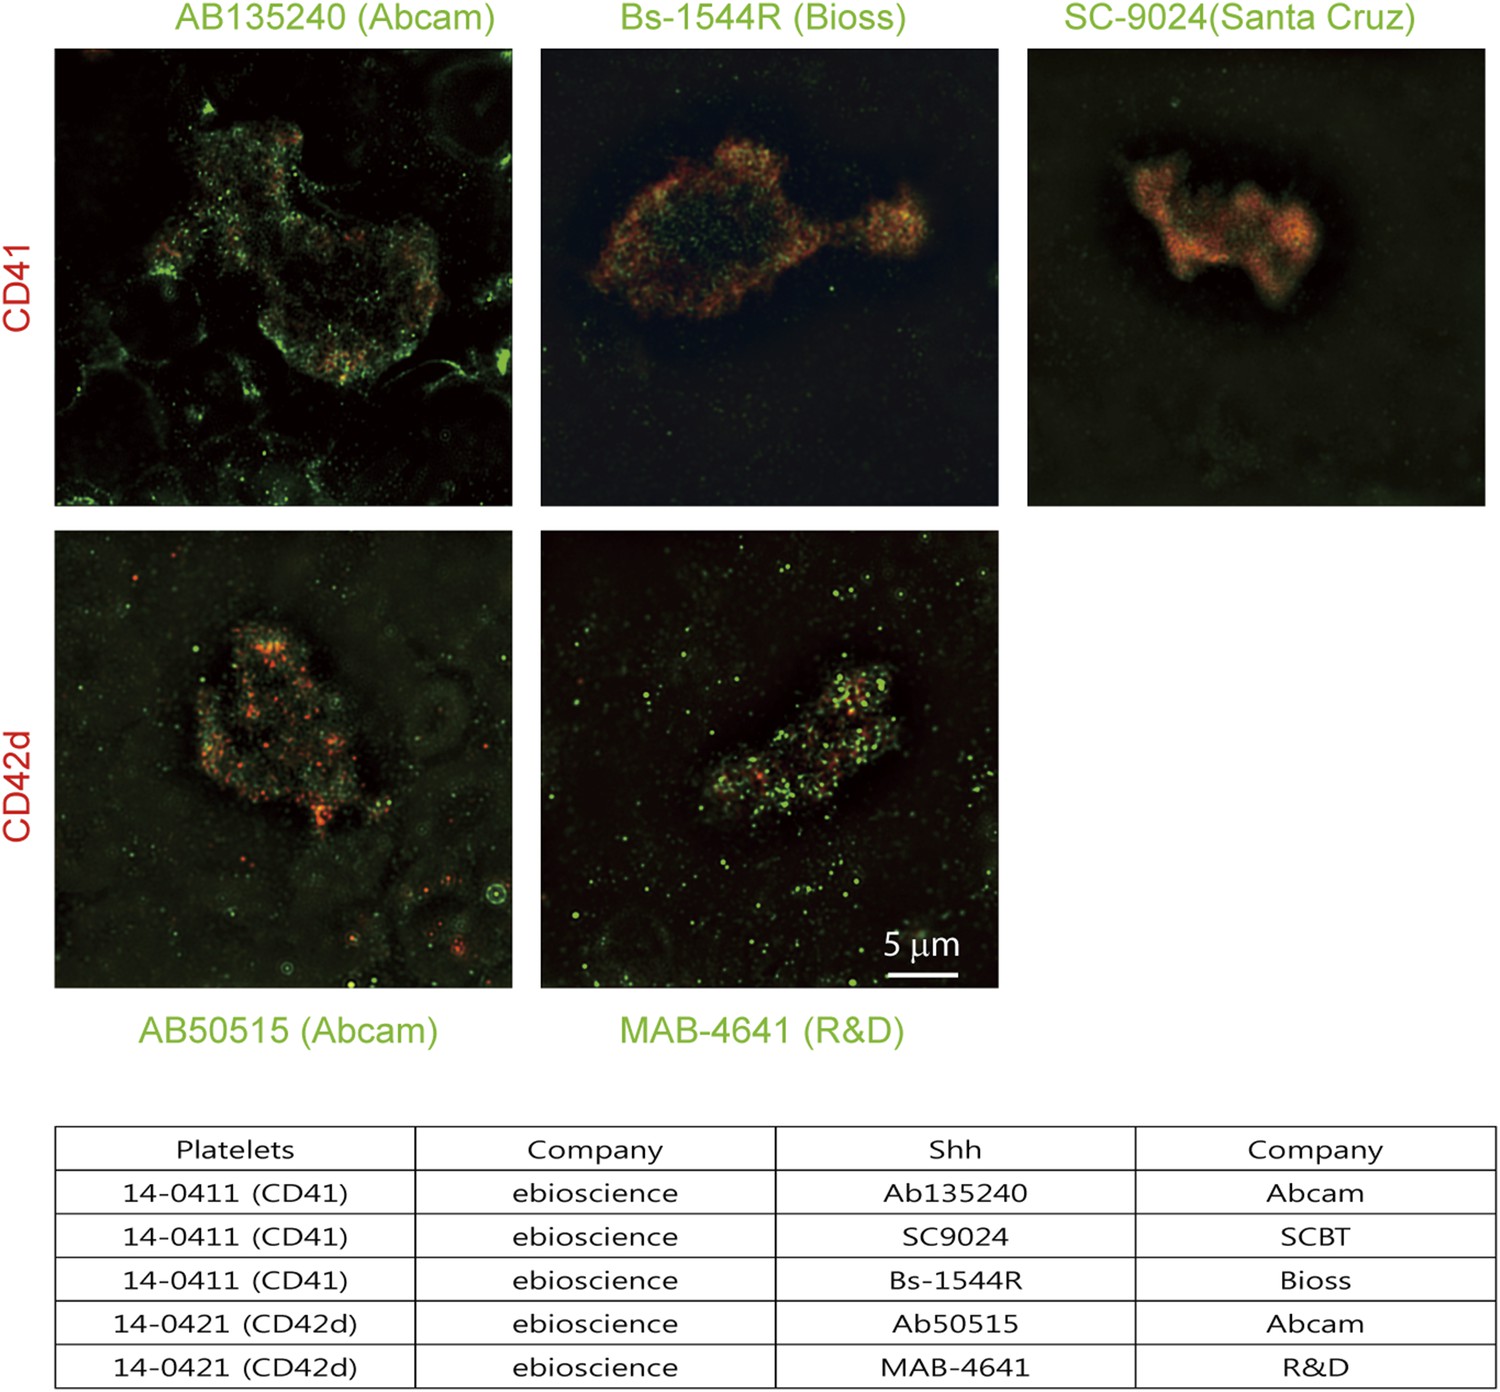
Super-resolution images of Shh + platelets were taken from N-SIM (Nikon) equipped with a 100X (N.A. 1.49) oil objective and 405-, 488-, and 561-nm lasers.
Anti-Shh antibodies showed localization of Shh (green) in the microvesicles of platelets co-stained for CD41 or CD42d (red), Table lists applied antibodies.
Figure 7—figure supplement 3
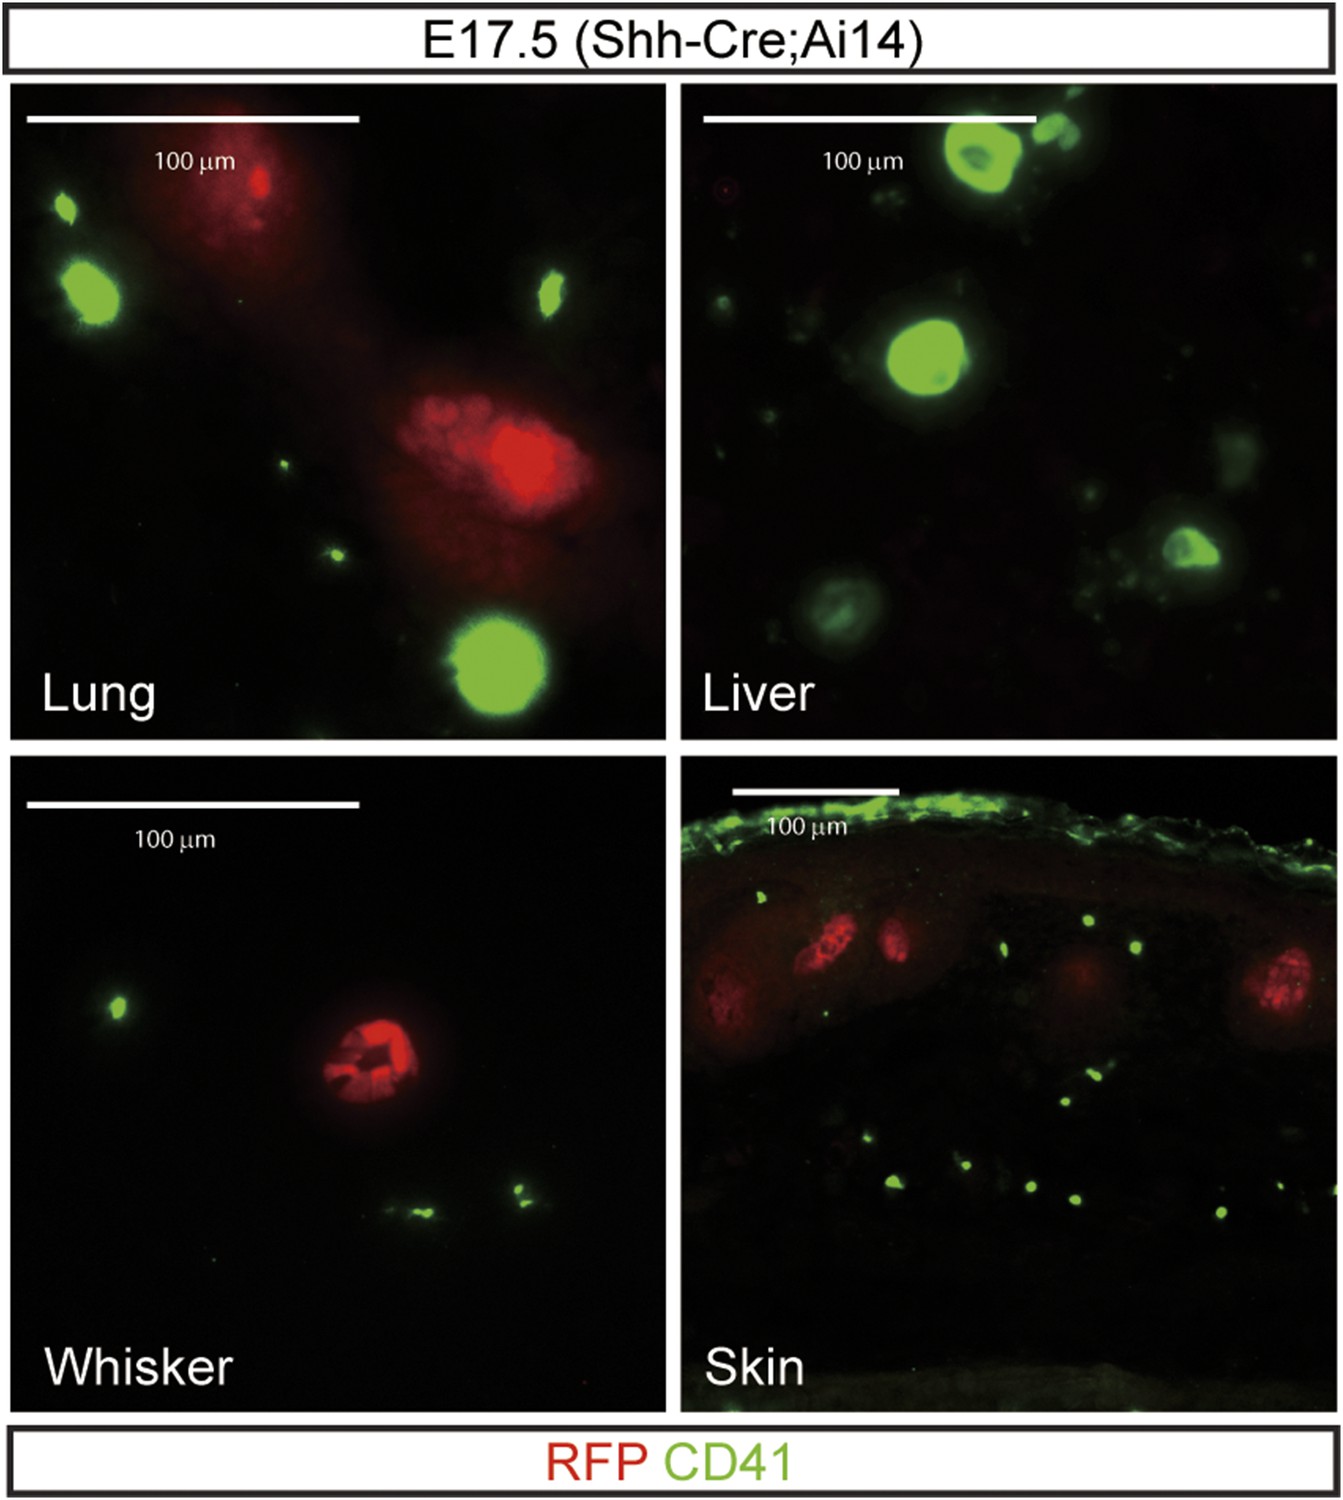
To examine Shh gene expression in platelets during development, Shh-Cre;Ai14 embryos were stained for RFP and CD41 (platelets).
Megakaryocytes or platelets did not express Shh-Cre as revealed by a Cre reporter, Ai14 (Jax) in the representative tissues such as the lung, liver, whisker, and skin (scale bar = 100 μm).
Figure 7—figure supplement 4
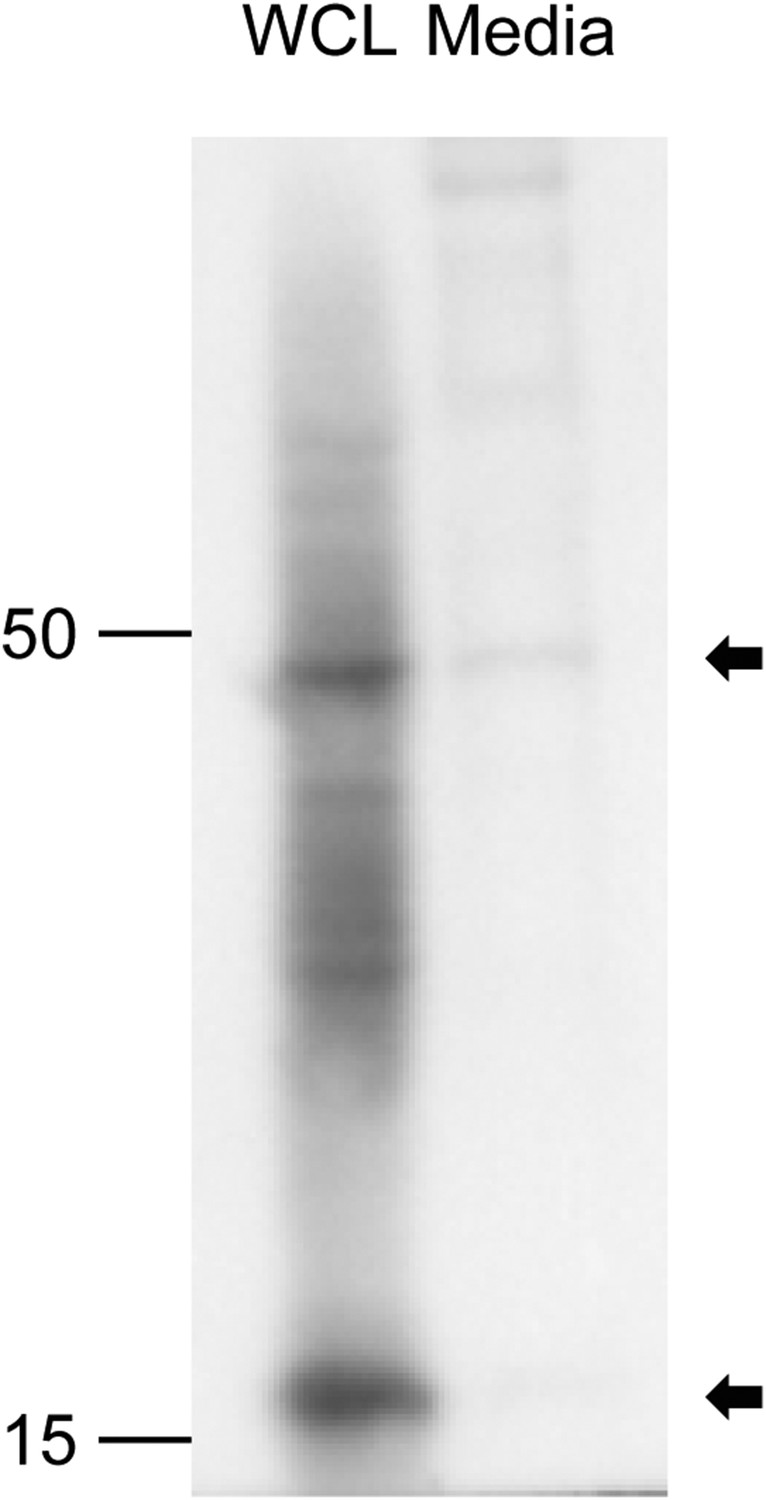
Dermal cells were isolated from P1 head skin harboring HFs and further expanded in 10% FBS/DMEM/F12 (50:50) media.
To remove microvesicles in the media, FBS was precleared by ultracentrifugation at 120,000 for 90 min. Cells were cultured for 2 days and condition media were collected by ultracentrifugation at 120,000 for 90 min followed by lysis in the 1× Laemmli sample buffer (Bio-Rad). Whole-cell lysates (WCLs) were directly lysed in the 1× Laemmli sample buffer for the Western blot analysis. Detection of Shh was done by using a rat anti-Shh antibody (R&D Systems). Unprocessed Shh was detected in the microvesicle collected from the conditioned media.
Figure 8 with 1 supplement

Diminished hedgehog-responding fetal dentate progenitors in a platelet mutant, Nfe2−/−.
(A) Heterozygote and mutant Nfe2 pups at P1 were used to stain CD41 (platelets) and Shh. Dashed line was used to outline the DG. Embryonic dermis (skin) and blood streaks were used for Shh and CD41 staining. HF = a hair follicle in the skin. (A′) The ratio of CD41+;Shh + platelets to total Shh + cells was measured (n = 6). (B, C) Nfe2 embryos at E16.5 or pups at P1 were used to stain dentate progenitors (Ki67) and Pdgfrα+ meninges or Reelin + Cajal Retzius cells were co-stained to outline the embryonic DG. (B′) Numbers of dentate progenitors (Ki67 + or Lef1+) were plotted (n = 6). (D, D′) The Ki67 + dentate progenitors were stained at P3. The plot shows the decreased Ki67 + dentate progenitors in Nfe2 mutants (n = 6, D′). (E, E′) The Ptch1-LacZ + dentate progenitors were stained at P3 using Nfe2;Ptch1-LacZ pups. The plot shows the decreased Ptch1-LacZ + dentate progenitors in Nfe2 mutants (n = 3, E′). (F, F′) The dentate progenitors (Ki67, Lef1, Blbp) were stained at P5 when a few Nfe2 mutant survived. The plot shows the decreased dentate progenitors in the Nfe2 mutant (n = 3, F′). Dashed lines denote the outline of the DG. Student t-test was used to address the statistical significance. **, p < 0.05, ***, p < 0.001, ****, p < 0.0001. Scale bars: all = 200 μm except A (skin and blood streak) = 50 μm.
Figure 8—figure supplement 1
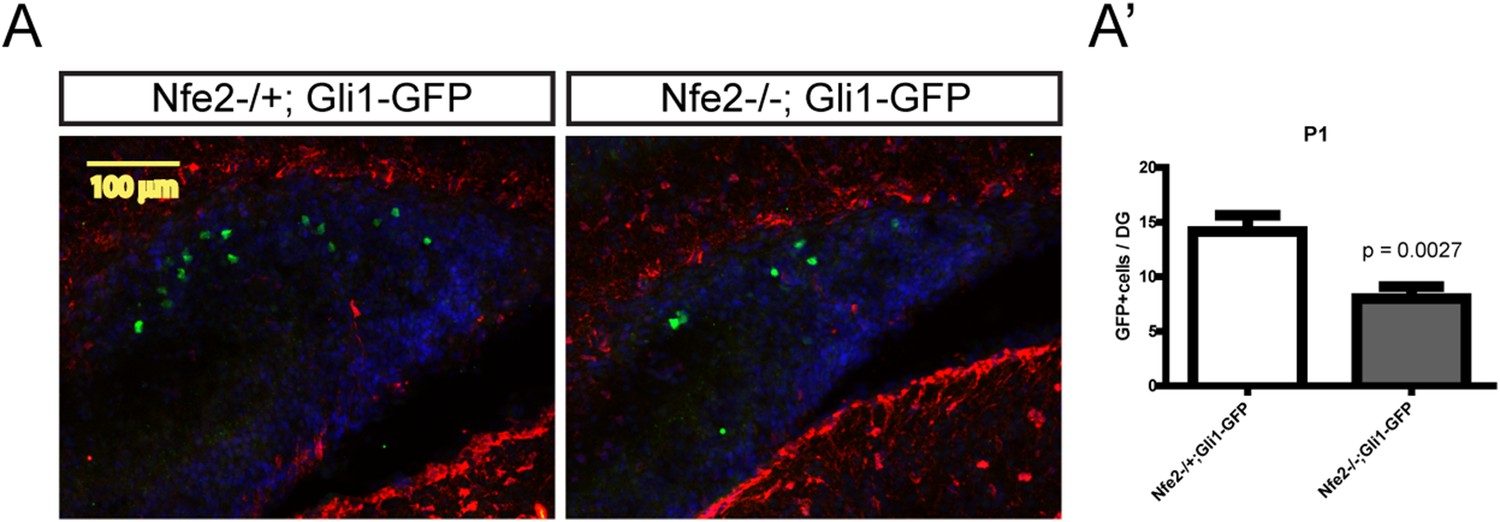
P1 pups from Nfe2 mutant mice with a Gli1-GFP reporter allele were stained for Blbp (marks glial cells surrounding the DG at P1) and GFP (marks Shh-responding cells) (A, scale bar = 100 μm).
Nfe2 mutant pups showed significantly reduced (p = 0.0027, n = 4) Gli1-GFP positive cells (A′).
Download links
A two-part list of links to download the article, or parts of the article, in various formats.
Downloads (link to download the article as PDF)
Open citations (links to open the citations from this article in various online reference manager services)
Cite this article (links to download the citations from this article in formats compatible with various reference manager tools)
Epithelial cells supply Sonic Hedgehog to the perinatal dentate gyrus via transport by platelets
eLife 4:e07834.
https://doi.org/10.7554/eLife.07834


