Quantitative and functional interrogation of parent-of-origin allelic expression biases in the brain
- Howard Hughes Medical Institute, Harvard University, United States
- Harvard University, United States
- University of Wyoming, United States
- Cell Press, United States
- National Chengchi University, Taiwan
Figures
Figure 1 with 1 supplement

Workflow of transcriptome-wide profiling of allele-specific expression.
(A) First, F1 hybrids were generated by crossing C57Bl/6J males with Cast/EiJ females (F1 initial) and reciprocally crossing Cast/EiJ males with females C57Bl/6J (F1 reciprocal). Second, RNA sequencing (RNA-seq) data from each of the F1 samples were mapped to a splice-junction-aware diploid C57Bl/6J, Cast/EiJ genome. Third, we transformed genomic alignments to transcriptomic alignments and filtered alignments that did not map to the transcript set using custom code. Fourth, expression levels and associated errors of all expressed transcripts in the diploid C57Bl/6J, Cast/EiJ transcriptome were estimated using MMSEQ (Turro et al., 2011) for each mapped RNA-seq sample. Finally, for each heterozygous-expressed-transcript in the diploid C57Bl/6J, Cast/EiJ transcriptome, the parental expression bias and the effects of the mouse cross, the age, and sex were estimated using Bayesian regression allelic imbalance model (BRAIM). (B) Histograms of the distributions of the marginal posterior probabilities (PPs) of the parental expression biases, and the effects of cross, age, and sex of all 38,066 autosomal heterozygous transcripts in the diploid C57Bl/6J, Cast/EiJ transcriptome to which BRAIM was fitted. (C) Proportion of previously reported imprinted genes as well as newly identified imprinted genes subjected to pyrosequencing validation. (D) Relationship between pyrosequencing and RNA-seq estimates of parental biases as indicated by the percentage of expression contributed by the preferred parental allele. Note: the orange dot at ∼0.8, 0.8 is considered a false positive because the preferred allele observed in the RNA-seq data is opposite to the one observed by pyrosequencing. (E) Number of genes exhibiting preferential expression of the maternal allele (red), paternal allele (blue), or in which the maternal and paternal alleles preferentially express different isoforms (purple) in the cerebellum. (F) Distribution of the magnitudes of the parental bias (% of total expression from the preferred allele) in the cerebellum.
Figure 1—figure supplement 1
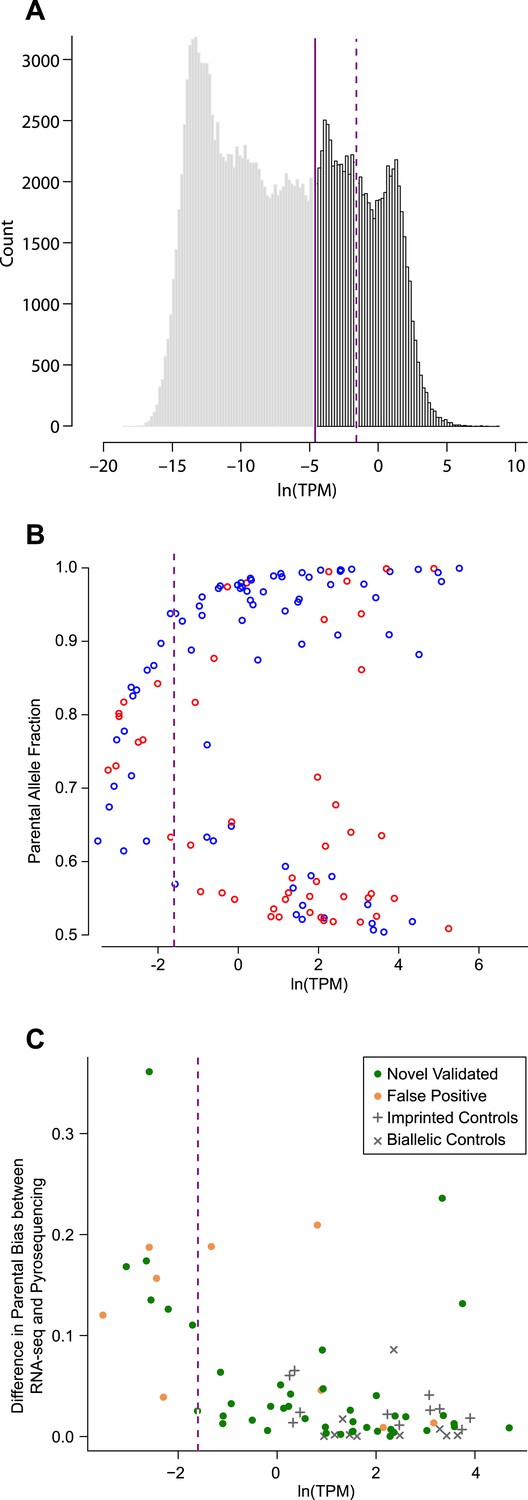
Determining expression level cutoff in RNA-seq data.
(A) Distribution of average allele-specific expression levels of all transcripts (posterior median of MMSEQ estimated natural log of transcripts per million (TPM) units (ln(TPM)) across all 48 RNA-seq cerebellar samples. The solid line represents the expression cutoff below which all expression levels are set to zero. The dashed line represents a more stringent expression level cutoff (see C). (B) Each transcript with a significant parental effect is represented by the fraction of expression of the preferred allele (Y-axis) (blue and red for the paternal and maternal allele, respectively) and its expression level in ln(TPM) units (X-axis). The lower concentration of points left to the dashed line (see C) indicates that detection of significant parental effects below that expression level is less robust. (C) Discrepancy between the estimated percentage of expression contributed by the preferred parental allele according to pyrosequencing and RNA-seq. At low expression levels the discrepancy is pronounced and the fraction of false positives is relatively high. A more stringent expression level cutoff was placed where the discrepancy dramatically drops (dashed line at ln(TPM) = −1.6).
Figure 2
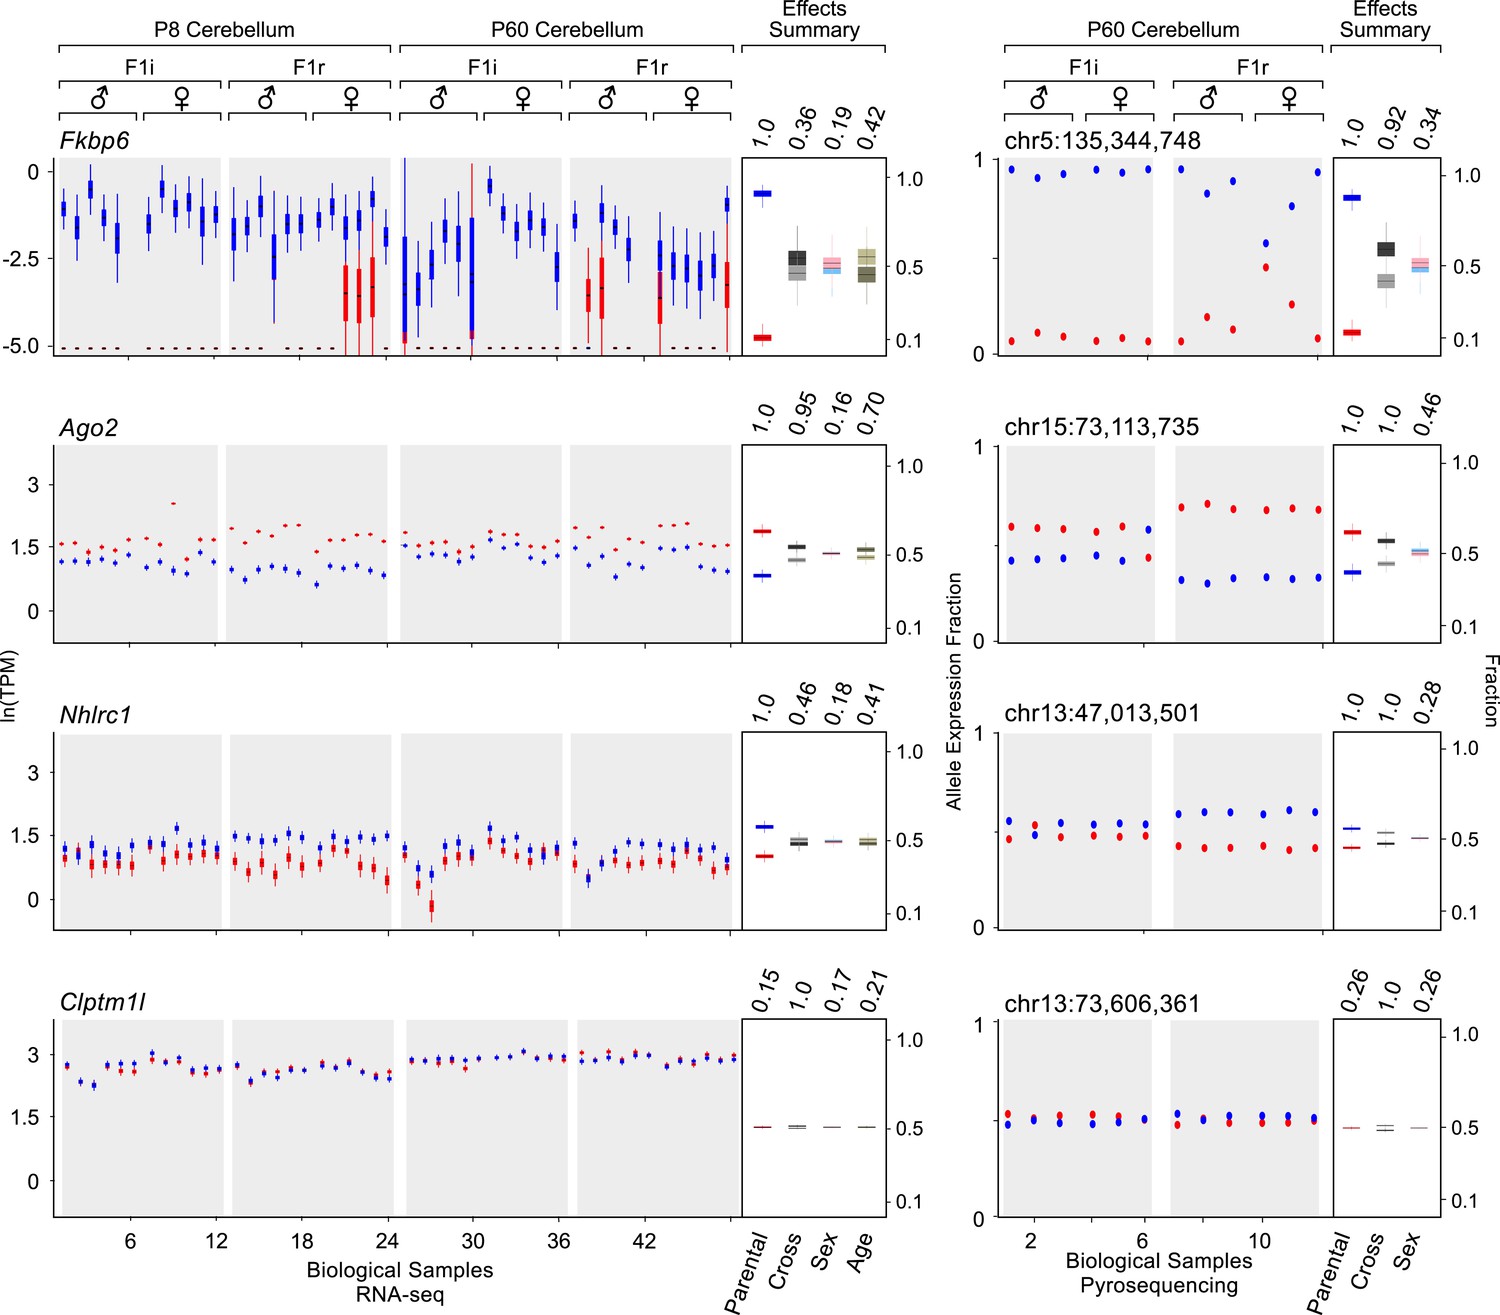
Examples of genes imprinted in the cerebellum and of a biallelic control.
Fkbp6, Ago2, and Nhlrc1 show parentally-biased expression in the cerebellum as observed by RNA-seq (left) and confirmed with pyrosequencing (right). Clptm1l shows biallelic expression in the cerebellum in both RNA-seq and pyrosequencing experiments. For each replicate (N = 48), red indicates maternal expression while blue indicates paternal expression. The Y-axis shows the RNA-seq expression level in natural log of TPM units (ln(TPM)), as derived from the posterior distribution of expression levels reported by MMSEQ. Each box is centered at the posterior mean, extends one posterior standard deviation away, and the bottom and top notches are the minimum and maximum posterior samples, respectively. Effects summary shows the posterior distributions of the effects of all experimental factors: parental, cross, sex, and age (box centered at the posterior mean, extends one posterior standard deviation away, and bottom and top notches are the minimum and maximum posterior samples, respectively) with their respective PPs on top. For the parental effect, blue represents paternal and red represents maternal expression. For the cross effect, gray represents F1r and black represents F1i. For the sex effect, pink represents female and cyan represents male. For the age effect, light khaki represents P8 and dark khaki represents P60.
Figure 3
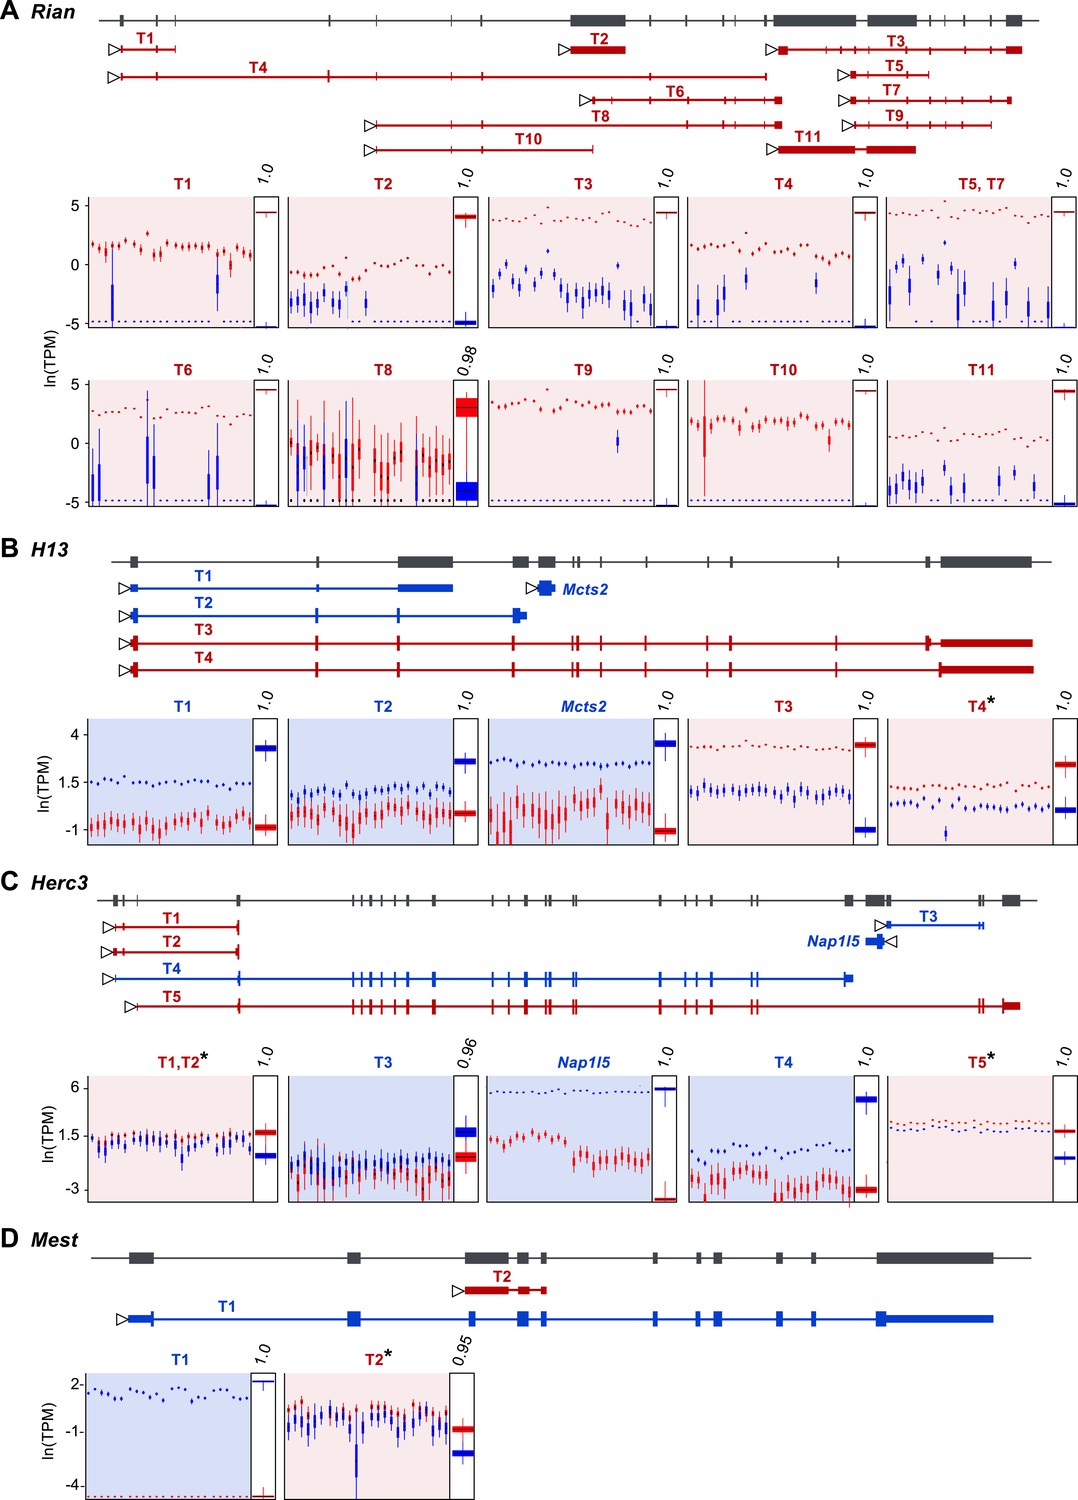
Assessment of imprinting at the transcript level.
(A) Imprinting in all identified spliced variants of Rian in the P8 cerebellum. (B) Imprinting of Mcts2 and H13 transcripts in the P8 cerebellum. (C) Imprinting of Nap1l5 and Herc3 transcripts in the P60 cerebellum. (D) Imprinting in transcripts of Mest in the P60 cerebellum. In all figures, gene models are in dark gray and transcript models are colored according to the preferentially expressed parental allele (maternal in red and paternal in blue). Parental-specific expression across all replicates is shown below transcript models in natural log of TPM units (ln(TPM)), with the posterior distribution of the parental biases across replicates indicated in the right inset boxes with corresponding PPs on top. Asterisks indicate that the associated transcript is developmentally regulated.
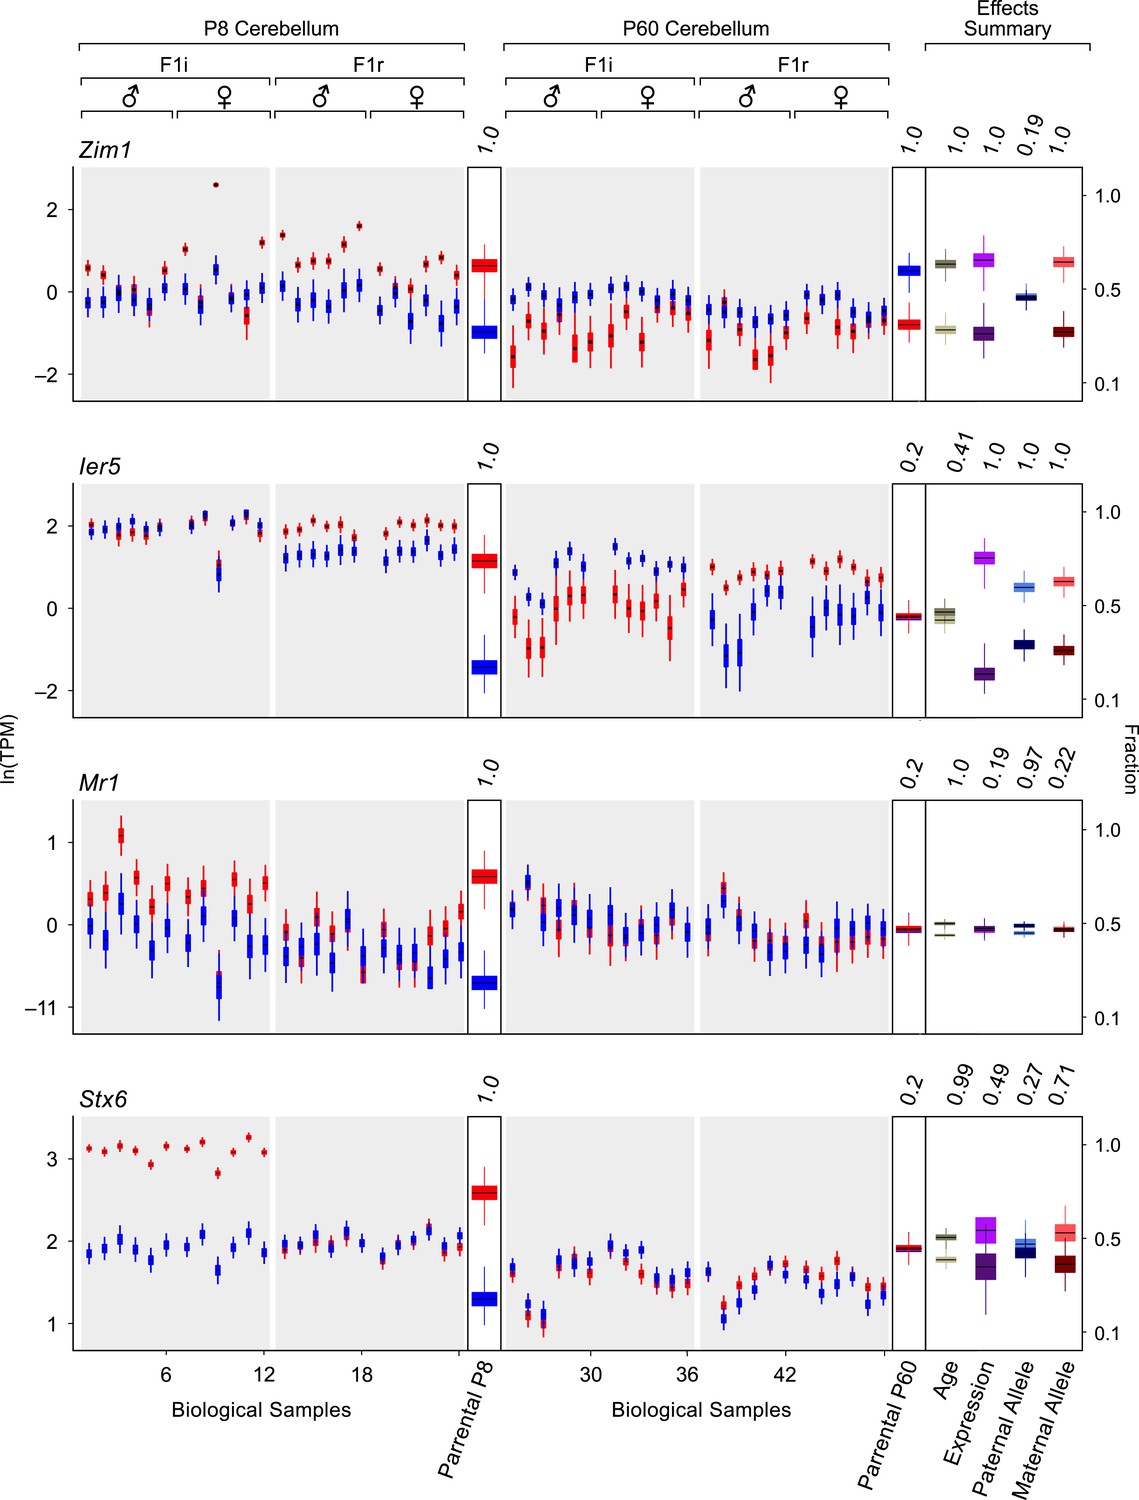
Figure 4 with 2 supplements

Age regulation of imprinted genes in the cerebellum.
(A) Venn diagram of imprinted genes at P8 and at P60. (B) Proportions of imprinted genes in which the parental bias is regulated during cerebellum development. Age regulated genes (in green) include genes with significantly higher parental bias at P8 (dark green) and genes with significantly higher parental bias at P60 (light green). (C) Proportions of imprinted genes with overall expression regulated according to the developmental stage of the cerebellum. Age regulated genes (in green) include genes with significantly higher overall expression at P8 (dark green) and genes with significantly higher overall expression at P60 (light green). (D) Relation between age fold change (ln(P8/P60)) of the overall expression level of imprinted genes and their parental bias. Genes located in the top right quadrant exhibit higher overall expression and stronger parental biases at P8 than at P60. Genes located in the lower left quadrant exhibit lower overall expression and lower parental biases at P8 than at P60. Genes located in the top left quadrant exhibit lower overall expression but stronger parental biases at P8 than at P60. Genes located in the bottom right quadrant exhibit stronger expression but lower parental biases at P8 than at P60. Although the age-invariant genes (salmon colored circles) overlap to some extent with the age-regulated genes (green colored circles), their age PPs are lower than the 0.95 cutoff. (E) Relation between age fold change (ln(P8/P60)) of the expression of the preferred (PA) and the non-preferred allele (Non-PA) of imprinted genes. Genes aligned along the X-axis display age regulated expression of the PA, while genes aligned along the Y-axis show age regulated expression of the non-PA. Points aligned on the diagonal are imprinted genes with age-regulated expression of both alleles. Genes in which a significant age effect on parental bias and/or overall expression requires change in both alleles are displayed by points scattered around the origin of axes. (F) Three examples of age-regulated imprinted genes. For each replicate (N = 48), maternal expression is in red and paternal expression is in blue. Y-axis is the RNA-seq expression level in natural log of TPM units (ln(TPM)). Effects summary shows the posterior distributions of the effects of the experimental factors with their respective PPs on top. For the age effect, light khaki represents P8 and dark khaki represents P60. Expression effect shows the fraction of overall expression at P8 and P60 in magenta and purple, respectively. Paternal-allele effect shows the fraction of expression exclusively form the paternal allele at P8 and P60 in light blue and royal blue, respectively. Maternal-allele effect shows the fraction of expression exclusively form the maternal allele at P8 and P60 in light red and dark red, respectively. (G) A novel imprinted cluster at distal chromosome 1 exhibits age-dependent regulation of parental bias (corresponding PPs of the parental biases are indicated).
Figure 4—figure supplement 1
Detection of changes in both parentally biased expression and overall expression levels.
Additional examples of age-regulated imprinted genes. For each replicate (N = 48), red indicates maternal expression and blue indicates paternal expression. Y-axis is RNA-seq expression level in natural log of TPM units (ln(TPM)). Effects summary shows the posterior distributions of the effects of the experimental factors. For the age effect, light khaki represents P8 and dark khaki represents P60. Expression effect shows the fraction of overall expression at P8 and P60 in magenta and purple, respectively. Paternal Allele effect shows the fraction of expression exclusively form the paternal allele at P8 and P60 in light blue and royal blue, respectively. Maternal Allele effect shows the fraction of expression exclusively form the maternal allele at P8 and P60 in light red and dark red, respectively.
Figure 4—figure supplement 2
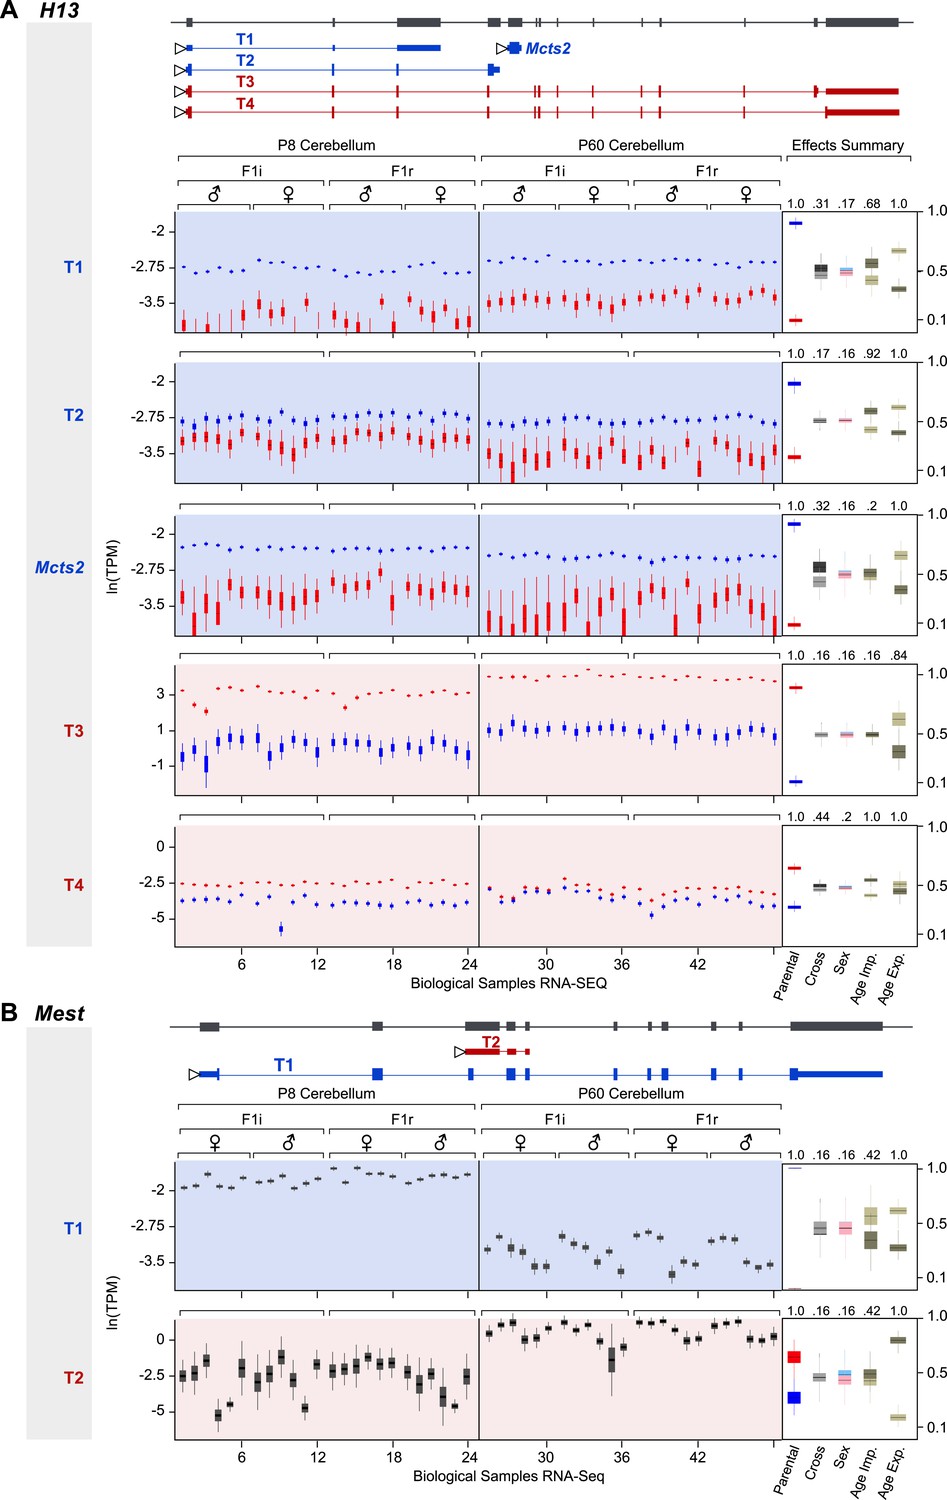
Developmental regulation of isoform-specific imprinting and/or expression.
(A) Imprinting of Mcts2 and H13 transcripts at the P8 and P60 cerebellum. (B) Overall expression changes of the Mest paternally expressed T1 transcript and maternally biased T2 transcript between the P8 and P60 cerebellum.
Figure 5

Genomic patterns of mild to moderate parental biases.
(A) Distribution of imprinted genes according to the level of parental bias and genomic location relative to the nearest imprinted gene. (B) Chromosomal locations of novel imprinted genes (green: novel imprinted genes within 1 MB of known ones, purple: isolated novel imprinted genes). (C) Example of an imprinted cluster on chromosome 9 where the monoallelically expressed imprinted gene Rasgfr1 is flanked by newly identified imprinted genes exhibiting moderate parental biases. (D) The decay of parental bias, as a function of the distance from an imprinted cluster center. Magenta: regression line, gray polygon: corresponding standard errors. (E) Example of mammalian conservation of the micro-synteny of the Tgfb1i1, Bag3, and Inpp5f genes within an imprinted cluster on distal chromosome 7. (F) Distribution of the mammalian conservation of micro-synteny of mouse gene-pair orthologs. The numbers of weakly imprinted gene-pair orthologs are indicated at the bottom and the vertical dashed line indicates the mean conservation across all pairs. (See ‘Materials and methods’ for further details.)
Figure 6 with 2 supplements

Spatial regulation of imprinted genes.
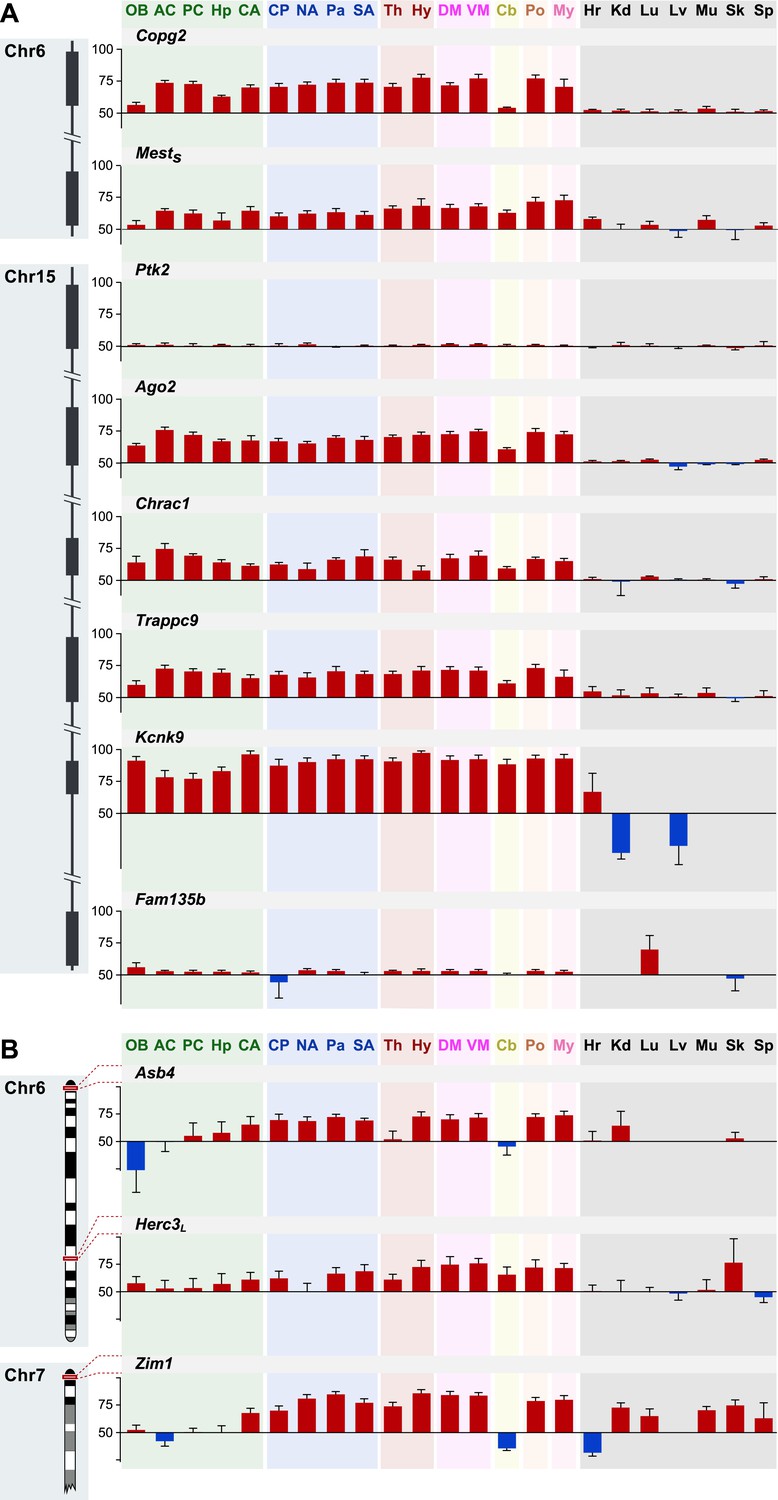
(A) Legend of brain regions analyzed, colored according to their broad developmental relatedness. OB: Olfactory Bulb, AC: Anterior Cortex, PC: Posterior Cortex, Hp: Hippocampus, CA: Cortical Amygdala (which is lateral to the brain midline and hence not captured by this sagittal section), CP: Caudate Putamen, NA: Nucleus Accumbens, Pa: Pallidum, SA: Striatum-like Amygdala, Th: Thalamus, Hy: Hypothalamus, DM: Dorsal Midbrain, VM: Ventral Midbrain, Cb: Cerebellum, Po: Pons, My: Medulla. (B) Legend of body tissues analyzed. Lg: Lung, Hr: Hearth, Sp: Spleen, Lv: Liver, Kd: Kidney, Sk: Skin, Mu: Muscle. (C) Examples of genes whose parental bias is regulated according to organ (brain vs body tissues) and of genes whose parental bias is dynamically regulated across the brain. Origins of bar graphs represent biallelic expression. Positive values represent preferential maternal expression (colored red) while negative values represent preferential expression of the paternal allele (colored blue). N = 6 in each bar. (D) Hierarchical clustering of the heat map representing deviations from biallelic expression (N = 6 in each square) in imprinted genes. To the right of the heat map are the ANOVA p-values testing for variability of parental bias across the brain regions (left columns) and paired t-test p-values testing for differential parental bias in brain vs body (right column).
Figure 6—figure supplement 1
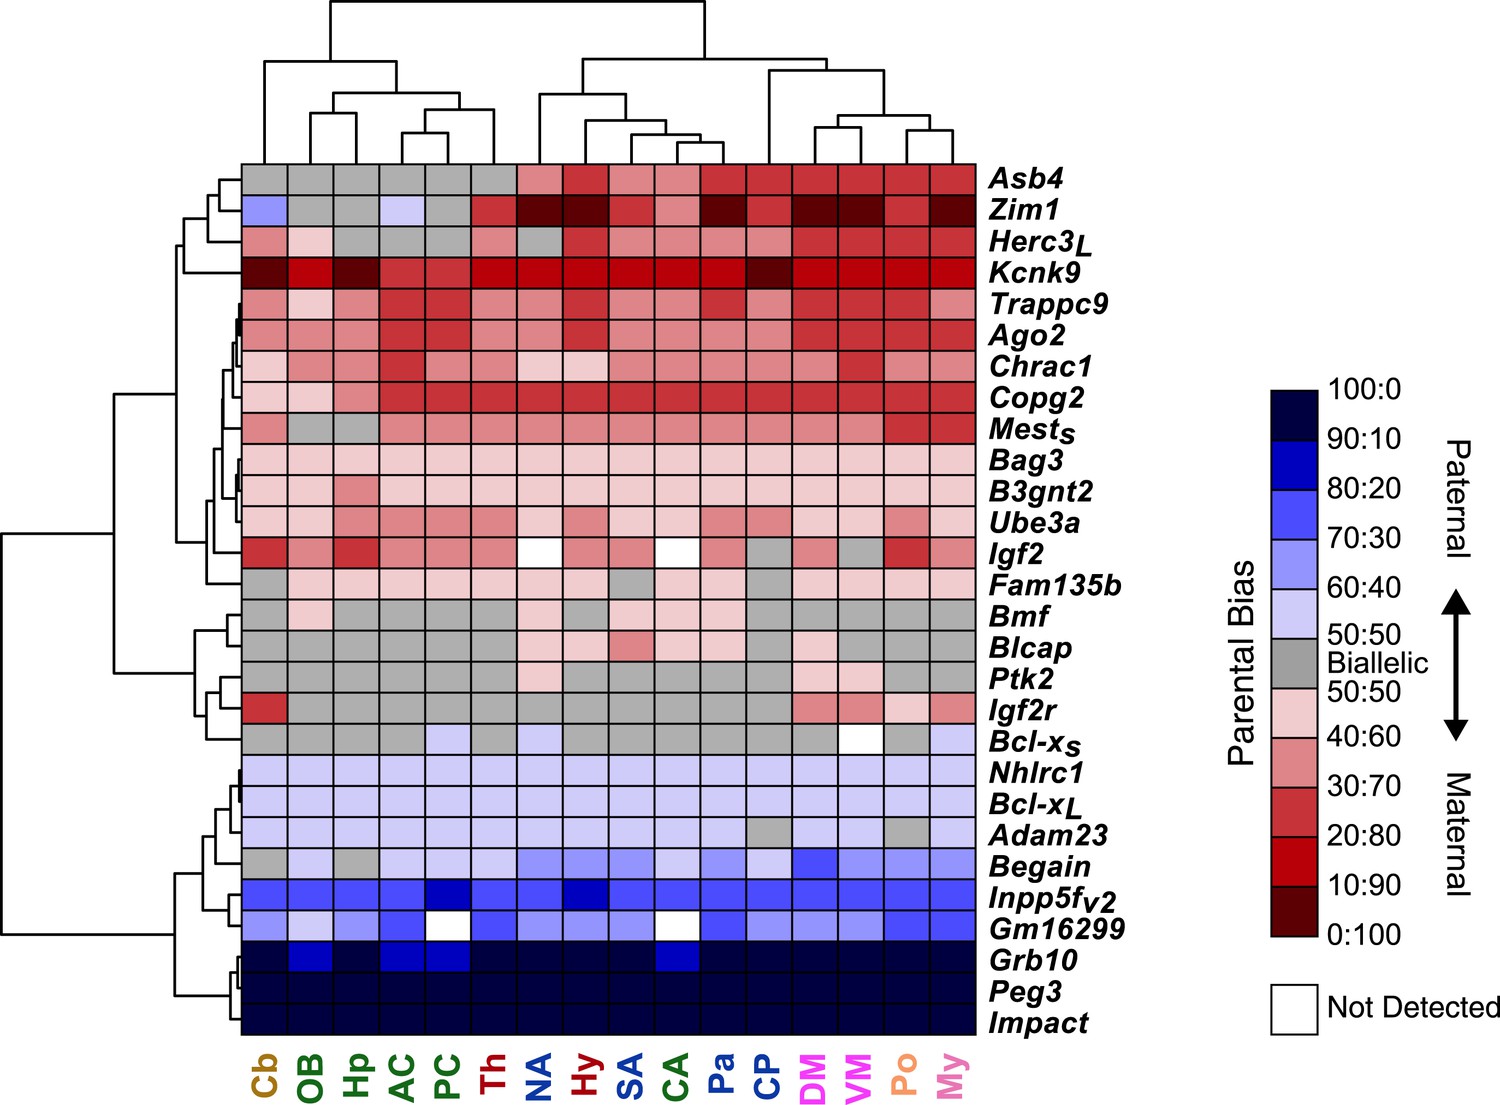
Hierarchical clustering of the heat map representing deviations from biallelic expression of imprinted genes in the brain.
https://doi.org/10.7554/eLife.07860.012
Figure 6—figure supplement 2
Shared patterns of spatial regulation of parental biases for different imprinted genes in the brain.
(A) Shared patterns in the maternal biases of genes in an imprinted cluster on distal chromosome 15. The patterns also correlate with the spatial regulation of maternally biased genes in an imprinted cluster on proximal chromosome 6. (B) Example of three imprinted genes in separate genomic locations exhibiting similar patterns in the regulation of parental biases.
Figure 7

Spatiotemporal regulation of imprinted genes.
(A) Analysis of parental biases at different time points during development of the whole brain (WB) at embryonic day 15, and of the cortex, hypothalamus, and cerebellum at four post-natal stages. Origins of bar graphs (N = 6 in each bar) represent biallelic expression. Positive values represent preferential maternal expression (colored red), and negative values represent preferential expression of the paternal allele (colored blue). (B) Hierarchical clustering of the heat map representing deviations from biallelic expression in imprinted genes (N = 6 in each square).
Figure 8 with 2 supplements
The role of genomic imprinting in the apoptotic pathway in the brain.
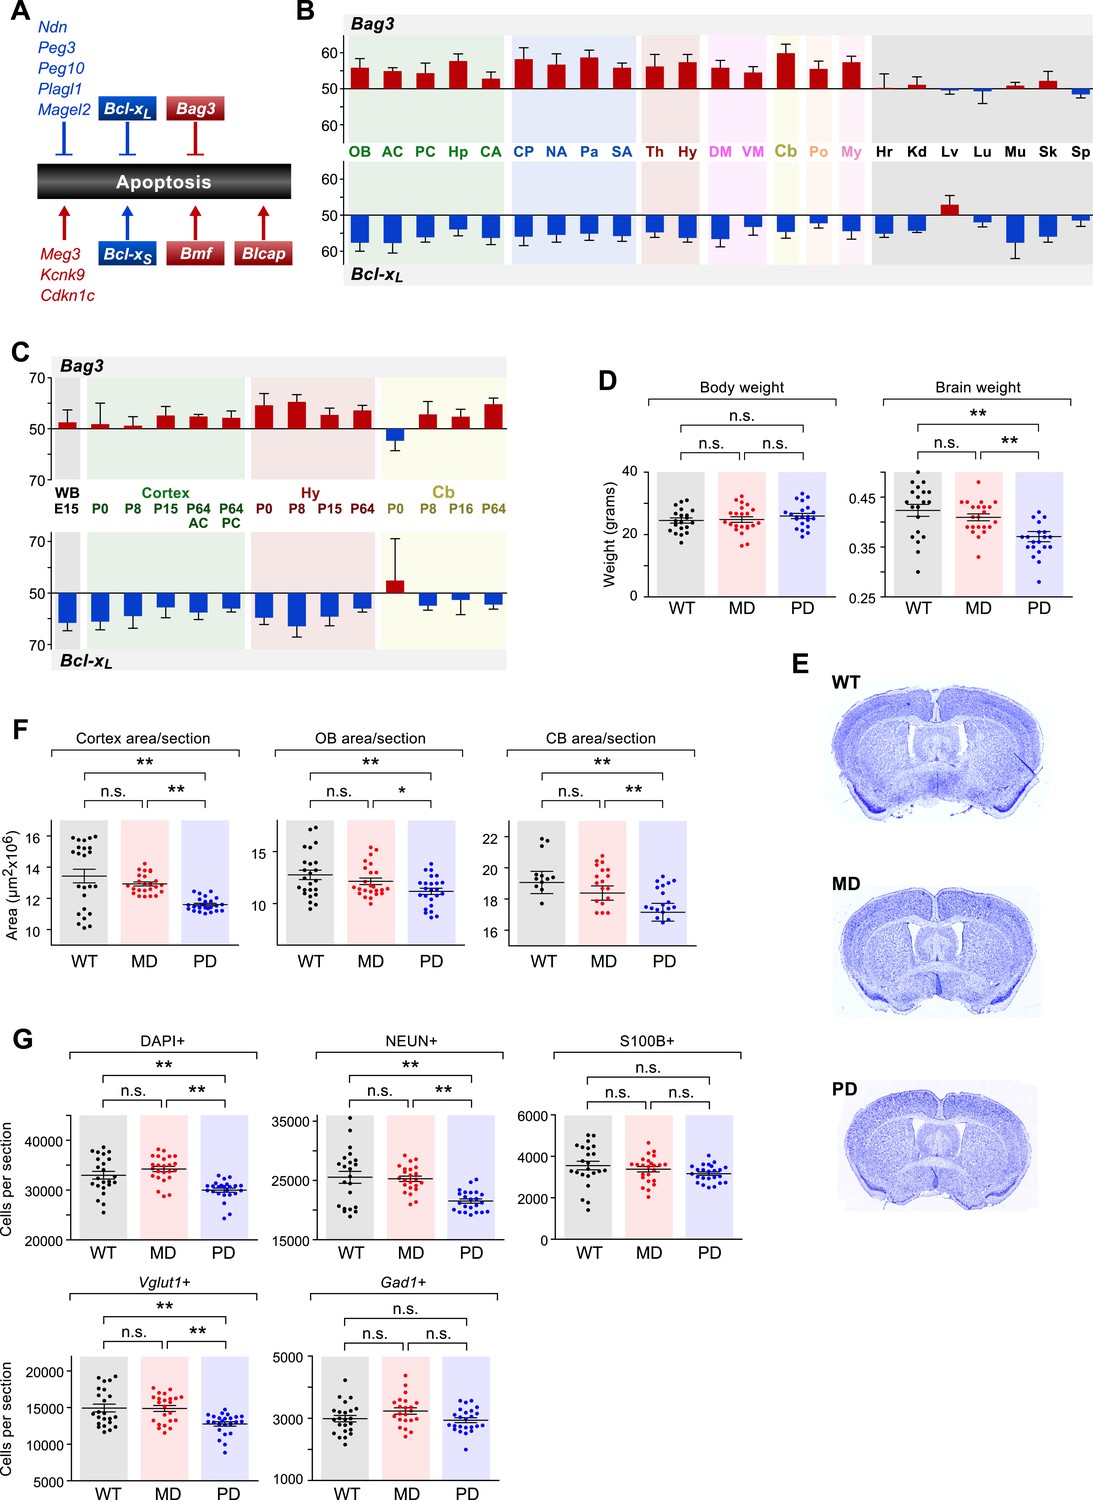
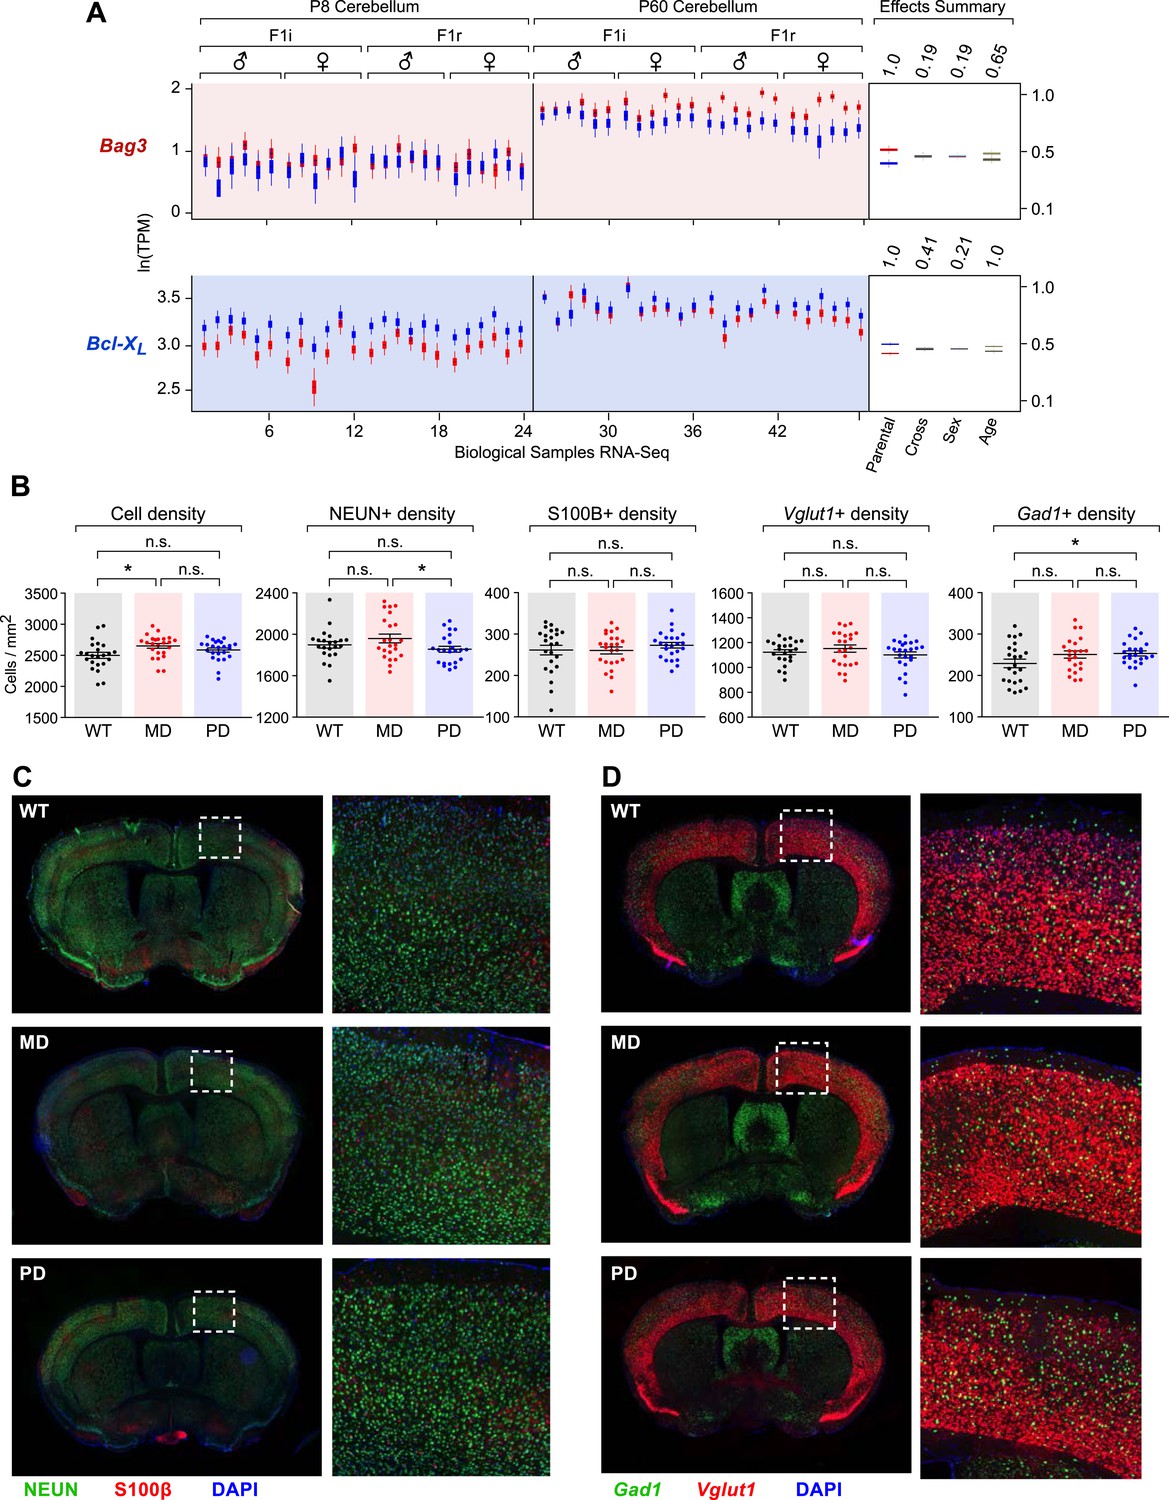
(A) Imprinted genes (color coded by parental bias: red for maternal and blue for paternal) involved in the regulation of apoptosis. Colored boxes denote genes exhibiting weak to moderate parental biases. Lines with arrowheads indicate pro-apoptotic function and notched lines indicate anti-apoptotic function. (B) Anti-correlated spatial regulation of Bcl-xL and Bag3 biases in the adult brain and body (Pearson correlation coefficient = −0.56; p-value = 0.04). (C) Regulation of Bcl-xL and Bag3 biases in the developing brain. (D) Body and brain weights of adult (P80) mice bearing nervous system-specific deletions of the maternal (MD), paternal (PD), or neither (wild type (WT)) allele of Bcl-x. Each data point represents an individual mouse. Data include both males and females, as no significant gender-specific differences were observed. (E) Representative images of NISSL-stained coronal sections that were used for measuring cortical areas. Tissue sections shown are from P80 male mice of each genotype. (F) Cross-sectional areas of cortex, olfactory bulb (OB), and cerebellum (Cb) for each genotype. Each data point represents a coronal section from a total of six P80 male mice. (G) Quantification within the cortex of the number of cells per section labeled with specific markers: DAPI (all cells), NEUN (neurons), S100ß (subset of glia), Vglut1 (Slc17a7, subset of excitatory neurons), and Gad1 (subset of inhibitory neurons). Each data point represents a coronal section from a total of six P80 male mice.
Figure 8—figure supplement 1
Cell-type specific effects in the cortex of brain-specific deletion of the paternal and maternal Bcl-x alleles.
(A) Bag3 shows biallelic expression in the developing cerebellum, maternally biased expression in the adult cerebellum, and its overall expression is up regulated from P8 to P60. Bcl-xL shows paternally biased expression in the developing cerebellum that is significantly reduced in the adult cerebellum, and its overall expression is up regulated from P8 to P60. (B) Quantification within the cortex of the density of cells per section labeled with specific markers: DAPI (all cells), NEUN (neurons), S100ß (glia), Vglut1 (Slc17a7, excitatory neurons), and Gad1 (inhibitory neurons). Each data point represents a coronal section from a total of six P80 male mice. (C) Representative images from two-color immunofluorescence analyses of NEUN (green) and S100β (red) expression within the cortex. Tissue sections shown are from P80 male mice of each genotype. Magnified views of boxed regions are shown (right). (D) Representative images from two-color RNA fluorescent in situ hybridization analyses of Vglut1 and Gad1 expression within the cortex. Tissue sections shown are from P80 male mice of each genotype. Magnified views of boxed regions are shown (right).
Figure 8—figure supplement 2
Effects of brain-specific deletion of the paternal and maternal Bcl-x alleles.
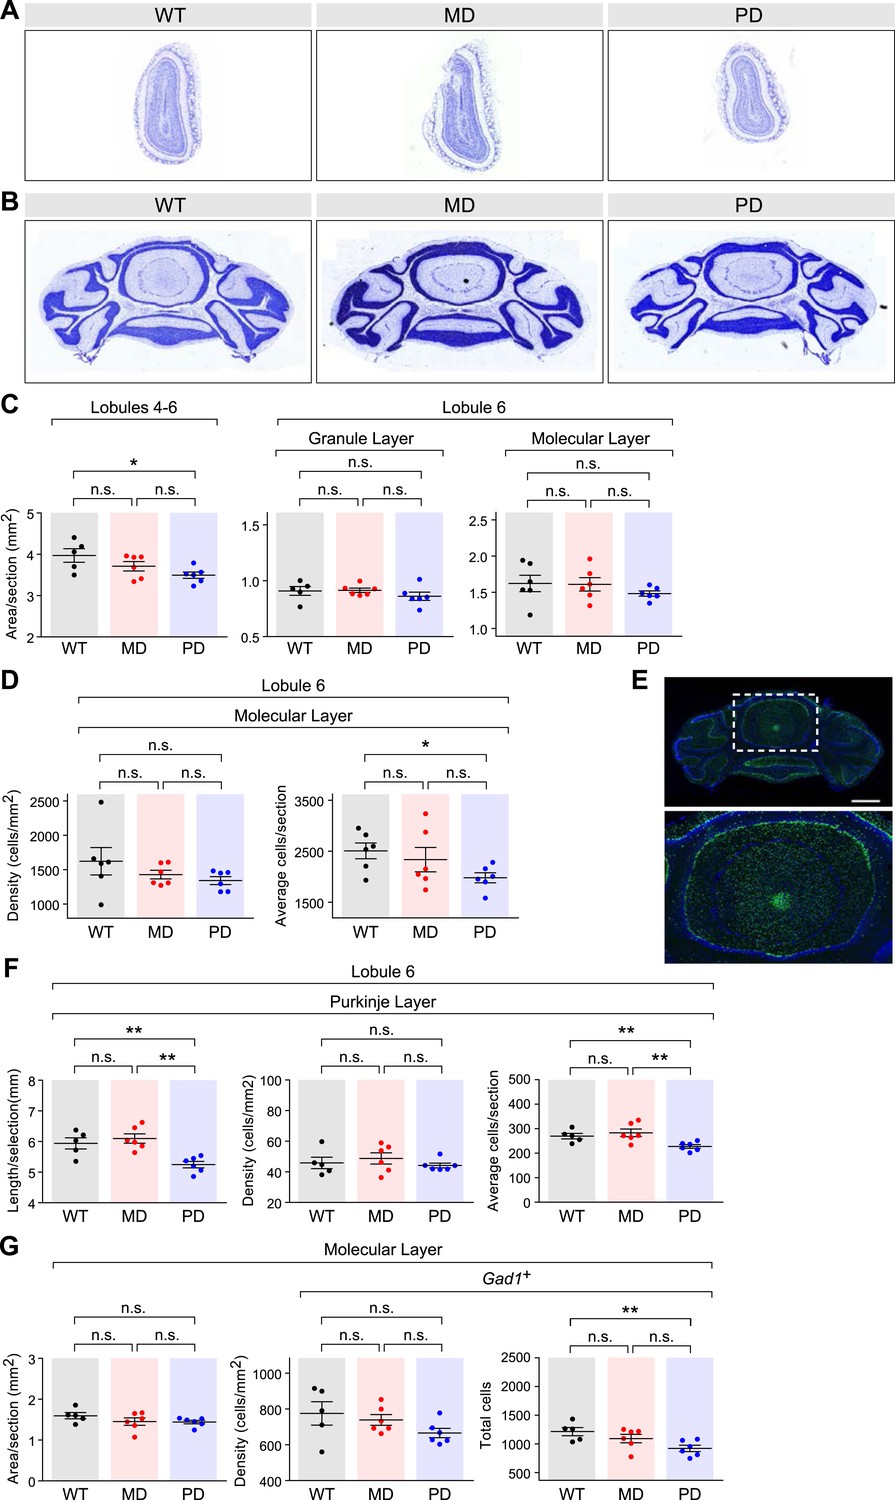
(A and B) Representative images of NISSL-stained coronal sections that were used for measuring olfactory bulb (A) and cerebellum (B) areas. Tissue sections shown are from P80 male mice of each genotype. (C) Cross-sectional areas per section for lobules 4–6 (left), the granular layer of lobule 6 (middle), and the molecular layer of lobule 6 (right) of cerebella from mice of each genotype. Each data point represents the average of three coronal sections from a single P80 male mouse. (D) Quantification of the density of cells (left) and average number of cells (right) per section within the molecular layer of lobule 6 of the cerebella from mice of each genotype. Each data point represents the average of three coronal sections from a single P80 male mouse. (E) Representative image of RNA fluorescent in situ hybridization staining for Gad1 transcripts in a coronal section of the cerebellum of a WT P80 male mouse. A magnified view of the boxed region is shown (right). (F) Quantification of the perimeter length (left), density (middle), and average number (right) of Purkinje cells per section within lobule 6 of the cerebella from mice of each genotype. Each data point represents the average of three coronal sections from a single P80 male mouse. (G) Quantification of the area (left), density (middle), and total number (right) of Gad1+ cells per section within the molecular layer (excluding Purkinje cells) of lobule 6 of the cerebella from mice of each genotype. Each data point represents the average of three coronal sections from a single P80 male mouse.
Figure 9
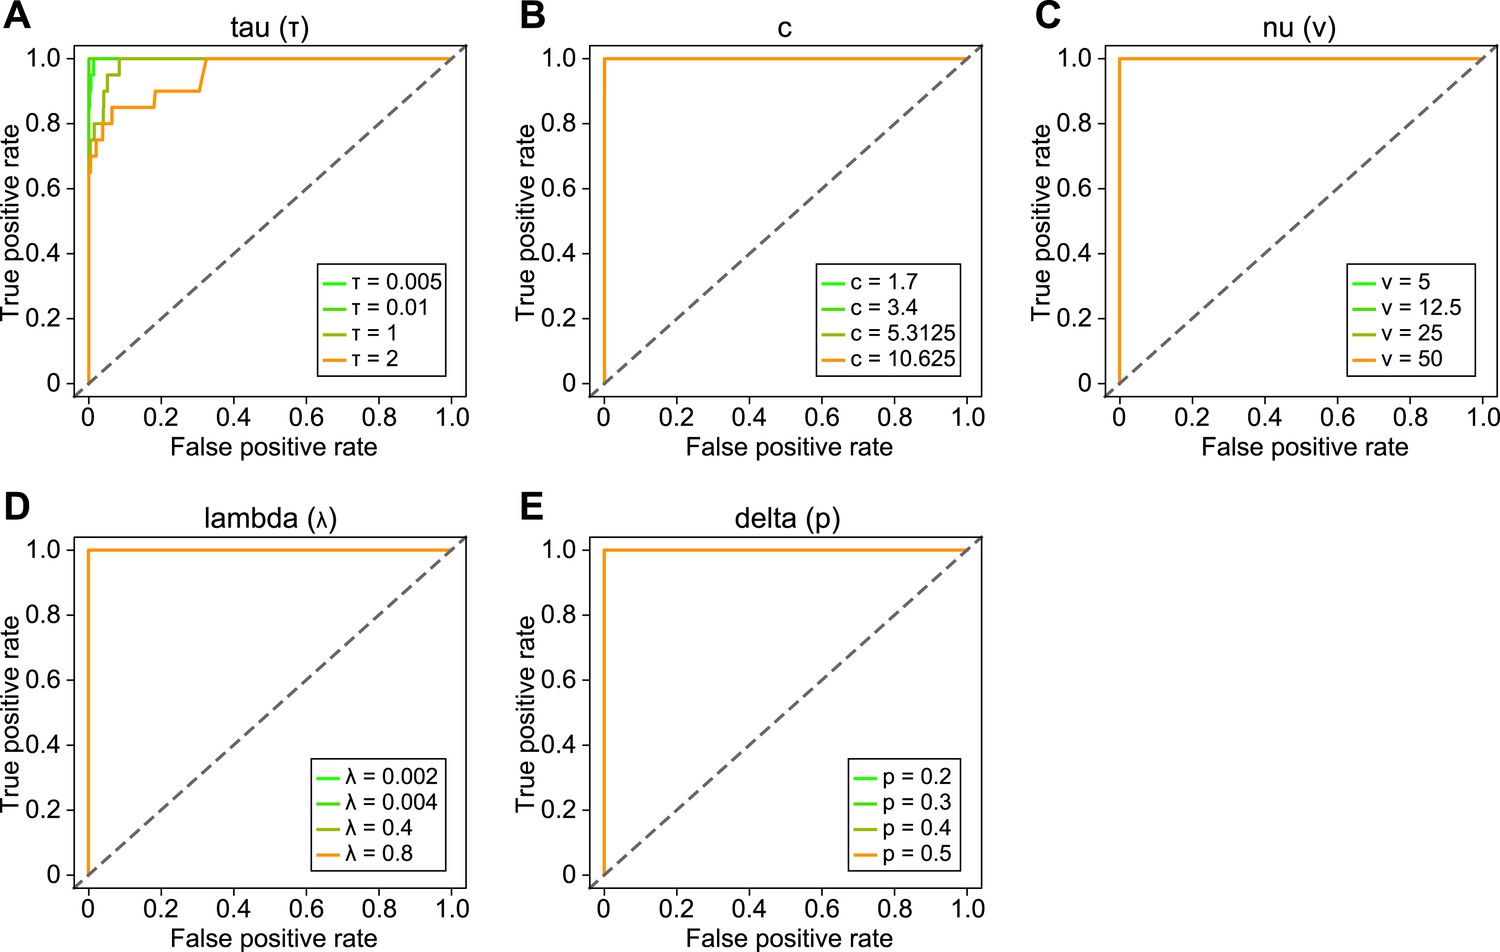
Sensitivity analysis of BRAIM to the choice of hyper-parameter values.
Receiver operating characteristic curves describing the performance of BRAIM in detecting imprinted genes using perturbed values of τ (A), c (B), ν (C), λ (D), and the prior of δ, p (E) hyper-parameters.
Additional files
-
Supplementary file 1
(A) Results of BRAIM Analysis of the Autosomal Transcriptomes in the P8 and P60 Cerebellum. (B) Results of BRAIM Analysis of the Autosomal Transcriptome in the P8 Cerebellum. (C) Results of BRAIM Analysis of the Autosomal Transcriptome in the P60 Cerebellum. (D) Results of BRAIM Analysis of X-linked Transcriptomes in the P8 and P60 Cerebellum. (E) Results of BRAIM Analysis of X-linked Transcriptome in the P8 Cerebellum. (F) Results of BRAIM Analysis of X-linked Transcriptome in the P60 Cerebellum. (G) List of Imprinted Genes Identified in the Mouse Cerebellum. (H) Curated List of Genes Reported in the Literature to be Imprinted in the Mouse. (I) Results of Pyrosequencing Validation of BRAIM-Reported Imprinted Genes in the Mouse Cerebellum. (J) Pyrosequencing Quantification of Parental Biases of Imprinted Genes Across Multiple Brain Regions and Body Tissues. (K) Comparison of Parental Biases of Imprinted Genes Between Brain and Body Tissues. (L) Analysis of the Variance of Parental Biases Across Brain Regions. (M) Pyrosequencing Quantification of Parental Biases of Imprinted Genes From Multiple Brain Regions at Different Developmental Stages.
- https://doi.org/10.7554/eLife.07860.019
-
Source code 1
The compressed source code folder, braimSourceCode.zip, includes the BRAIM R code along with example parameters and output and a help readme file which explains how to run the code.
- https://doi.org/10.7554/eLife.07860.020
Download links
A two-part list of links to download the article, or parts of the article, in various formats.
Downloads (link to download the article as PDF)
Open citations (links to open the citations from this article in various online reference manager services)
Cite this article (links to download the citations from this article in formats compatible with various reference manager tools)
Quantitative and functional interrogation of parent-of-origin allelic expression biases in the brain
eLife 4:e07860.
https://doi.org/10.7554/eLife.07860


