Phytotoxin production in Aspergillus terreus is regulated by independent environmental signals
- Hans Knoell Institute, Germany
- Friedrich Schiller University, Germany
- University of Nottingham, United Kingdom
Figures
Figure 1 with 2 supplements
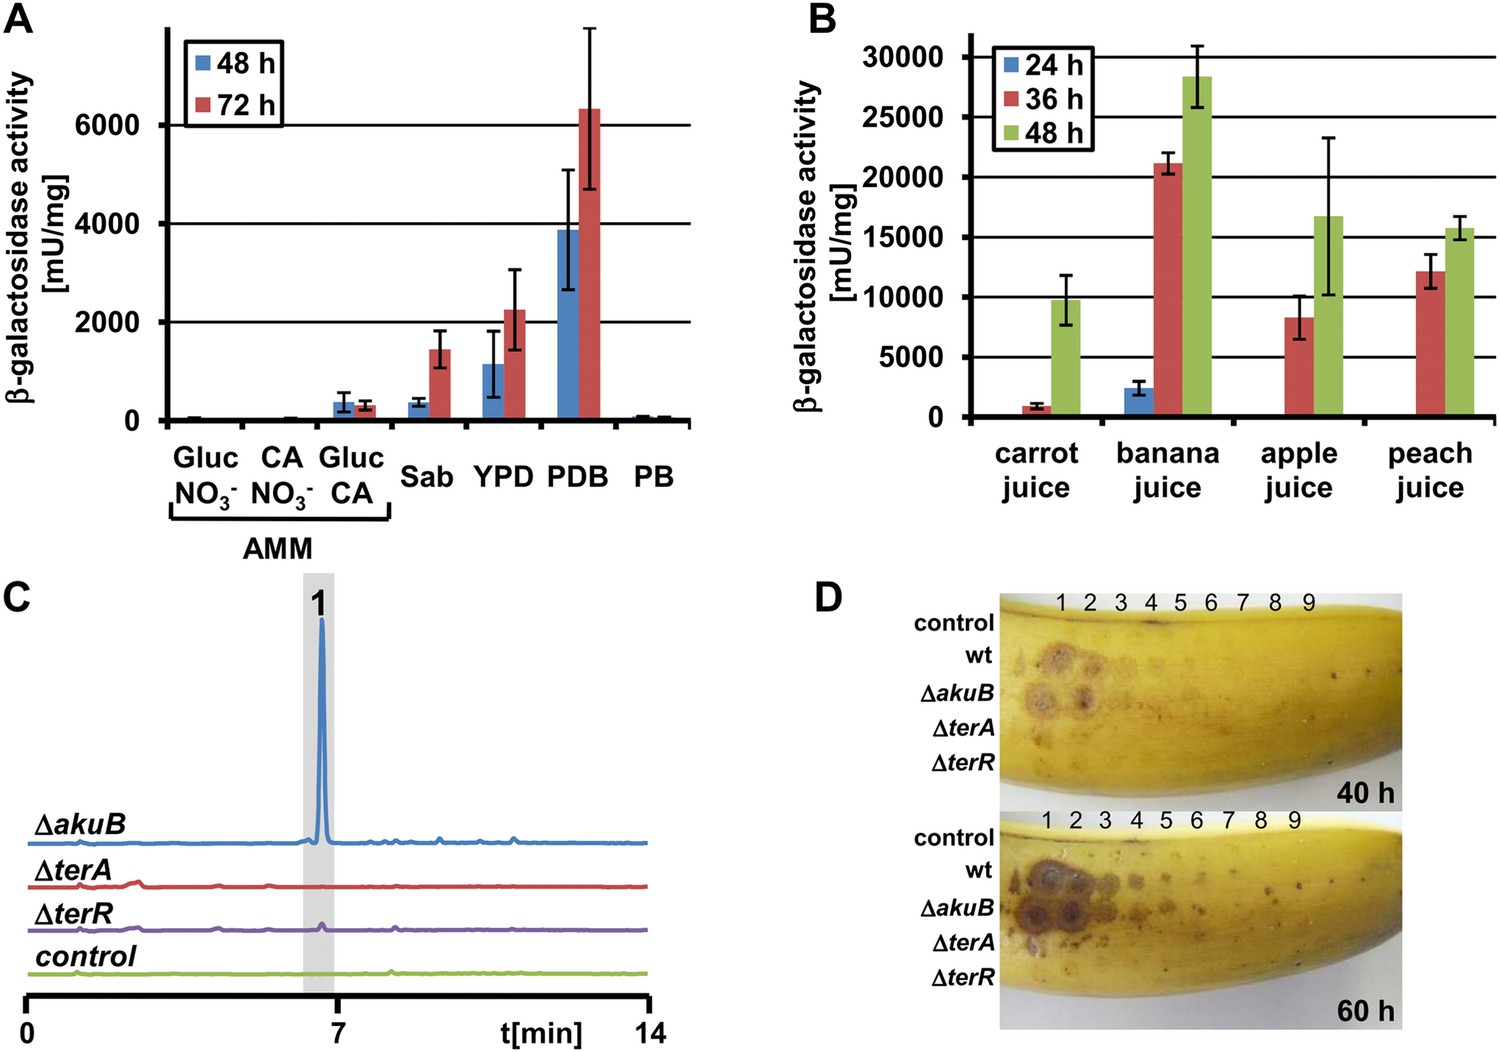
Terrein production and expression of terA on plant-derived media.
(A) Promoter activity of strain PterA:lacZ after 48 hr and 72 hr on minimal media supplemented with glucose (Gluc), casamino acids (CA), or glucose + casamino acids (Gluc CA) or the complex media Sabouraud (Sab), yeast extract-peptone-dextrose (YPD), potato dextrose broth (PDB) or potato extract (PB). (B) Promoter activity of strain PterA:lacZ grown for 24, 36 and 48 hr in carrot, banana, apple, and peach juice. (C) High performance liquid chromatography analysis of banana extracts infected with Aspergillus terreus SBUG844 strains ΔakuB, ΔakuBΔterA or ΔakuBΔterR. A mock-infected fruit served as control. 1—terrein. (D) Lesion formation on banana surfaces caused by extracts shown in (C). Photographs were taken after 40 and 60 hr. Lesions only occur with extracts from the wild-type and the parental strain of the mutants (ΔakuB). Numbers indicate the serial twofold dilution of the extracts starting from undiluted crude extracts down to 1:256 dilutions.
Figure 1—figure supplement 1
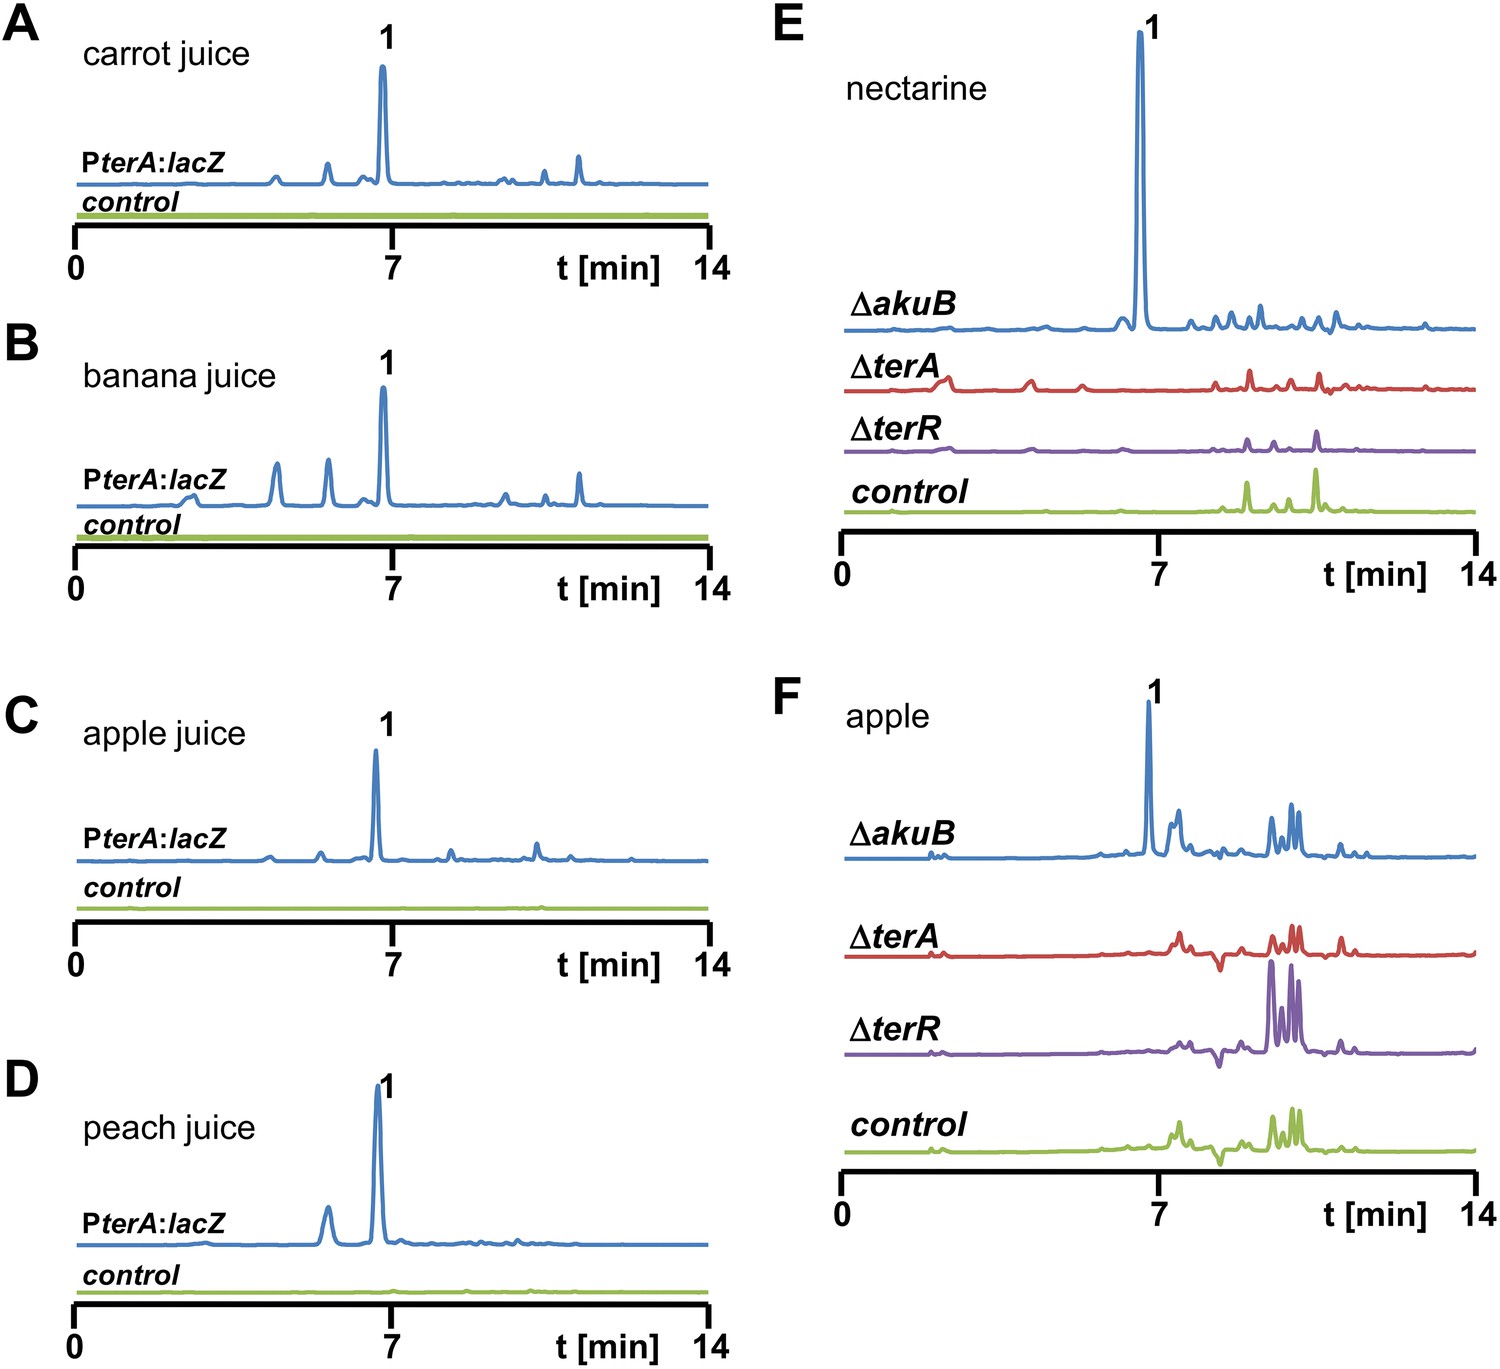
High performance liquid chromatography (HPLC) analysis of extracts from Aspergillus terreus strains after cultivation in fruit juices and from infected nectarines and apples.
(A–D) HPLC analyses of culture extracts from fruit juices after inoculation with SBUG844_PterA:lacZ (blue line) and mock-inoculated juices that served as negative controls (green line). Culture supernatants were extracted 48 hr post inoculation: (A) carrot juice, (B) banana juice, (C) apple juice, (D) peach juice. 1 = terrein. (E, F) HPLC analyses of fruit extracts after infection with A. terreus wild-type SBUG844ΔakuB (blue line) and terrein biosynthesis gene cluster mutants ΔterA (red) and ΔterR (violet). Mock-infected fruits served as negative controls (green line): (E) nectarine, (F) apple. 1 = terrein.
Figure 1—figure supplement 2
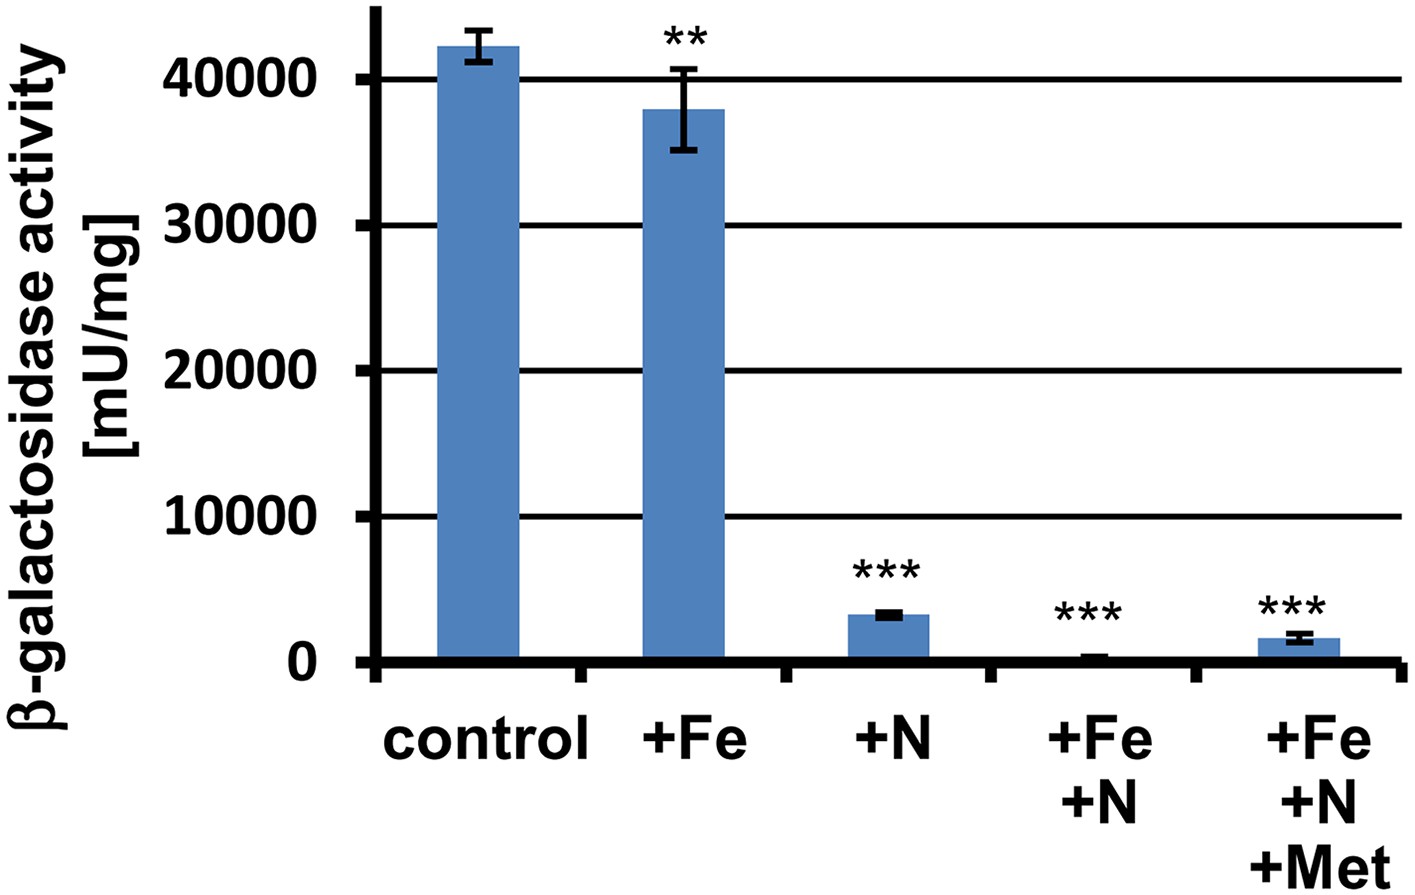
β-Galactosidase activity of PterA:lacZ grown in banana juice without (control) or with different supplementations.
+Fe = 30 µM FeCl3; +N = 70 mM NH4Cl; +Met = 10 mM L-methionine. Tests were performed in biological triplicates that were analysed in technical triplicates. Promoter activity of terA is reduced by nitrogen supplementation and is completely repressed in the presence of nitrogen and iron in the medium. The addition of methionine partially overwrites this repression. Statistical significance was calculated in comparison to the control condition without supplementation using the Student's paired t-test with a two-tailed distribution: **p<0.01, ***p<0.001.
Figure 2 with 1 supplement
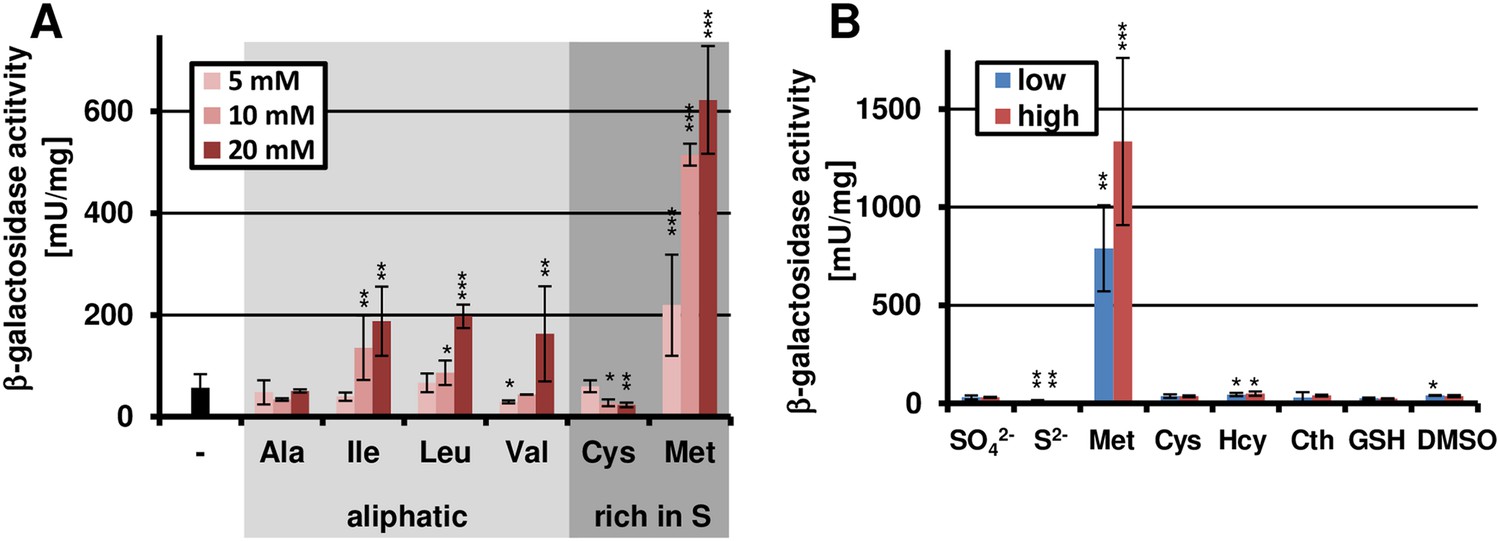
Methionine-dependent terA expression.
(A) β-Galactosidase activity of SBUG844_PterA:lacZ after 48 hr of cultivation in glutamine-containing minimal media in combination with 5, 10, or 20 mM of the aliphatic (Ala, Ile, Leu, Val) or sulphur-containing amino acid (Cys, Met). Significance calculated against the glutamine control. (B) β-Galactosidase assay of SBUG844_PterA:lacZ in the presence of various sulphur sources. Glutamines containing minimal media were supplemented with low (5 mM) or high (10 mM) concentrations of Na2SO4, Na2S, methionine (Met), cysteine (Cys), homocysteine (Hcy), reduced gluthathione (GSH), and dimethylsulfoxide (DMSO). Cystathionine (Cth) was used in final concentrations of 1 and 3 mM. Activity was determined after 48 hr of growth. Significance calculated against medium supplemented with sodium sulfate. All cultivations were performed in biological triplicates and activity determinations were made in technical duplicates. Statistical significance was calculated by the Student's paired t-test with a two-tailed distribution: *p<0.05, **p<0.01; ***p<0.001.
Figure 2—figure supplement 1
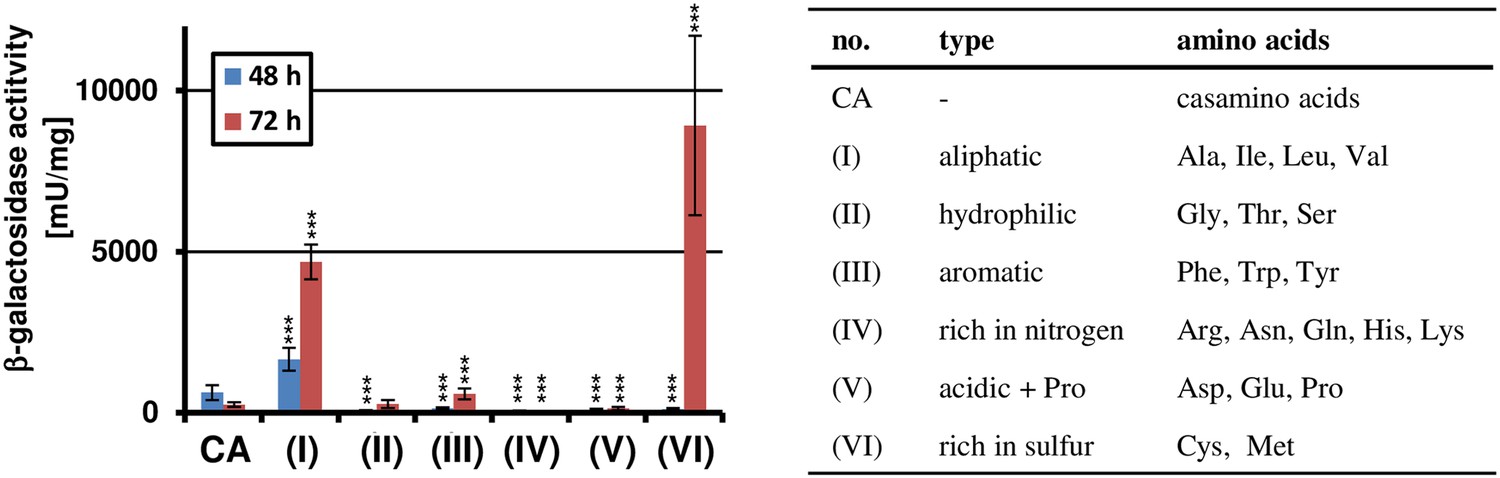
Amino acid-dependent terA expression.
All cultivations were performed in biological triplicates and activity determinations were made in technical duplicates. Statistical significance was calculated by the Student's paired t-test with a two-tailed distribution: *p<0.05, **p<0.01; ***p<0.001. β-Galactosidase assay of SBUG844_PterA:lacZ grown in AMM(-N)G100 with 1% casamino acids (CA) or 50 mM of various amino acid pools as indicated in the table on the right. The promoter activity of terA was determined after 48 and 72 hr. Significance calculated against CA control.
Figure 3

Terrein biosynthesis gene cluster activation under nitrogen starvation.
(A) β-Galactosidase activity of SBUG844_PterA:lacZ was cultivated for 24, 36, 48, 72, and 96 hr in glucose minimal medium supplemented with different concentrations of various nitrogen sources: 70 mM and 10 mM NaNO3 or NH4Cl, 1% or 0.1% of casamino acids (CA), and 50 or 10 mM aspartate (Asp), asparagine (Asn), glutamate (Glu), or glutamine (Gln). (B) Correlation of nitrogen consumption and terA promoter activity determined by β-galactosidase activity and ammonia consumption of SBUG844_PterA:lacZ in glucose minimal medium with 10 mM NH4Cl. (C) β-Galactosidase activity of SBUG844_PterA:lacZ in nitrogen shift experiments. Cultures grown for 48 hr in glucose minimal medium with 70 mM NH4Cl (PC) were washed and transferred to medium with (+N) or without 70 mM NH4Cl (−N) and promoter activity was determined after 15 hr of cultivation. (D) Carbon source dependent terA promoter activation under nitrogen starved conditions. Strain SBUG844_PterA:lacZ was pre-cultured for 48 hr on casamino acids without sugar supplementation. The mycelium was washed and transferred to nitrogen-free media with different carbon sources. Reporter activity was determined 24 hr after the shift. (E) β-Galactosidase activity from bananas infected with conidia suspension of SBUG844 wild-type and PterA:lacZ. Sections (red boxes) were cut from bananas, ground to a fine powder and subjected to β-galactosidase activity determination. Activity was only detected from the reporter strain. (F) Quantification of terrein from wild-type infected bananas with or without ammonium supplementation. All tests were performed in biological triplicates and technical duplicates; p values were calculated by the Student's paired t-test with a two-tailed distribution: **p<0.01.
Figure 4 with 5 supplements
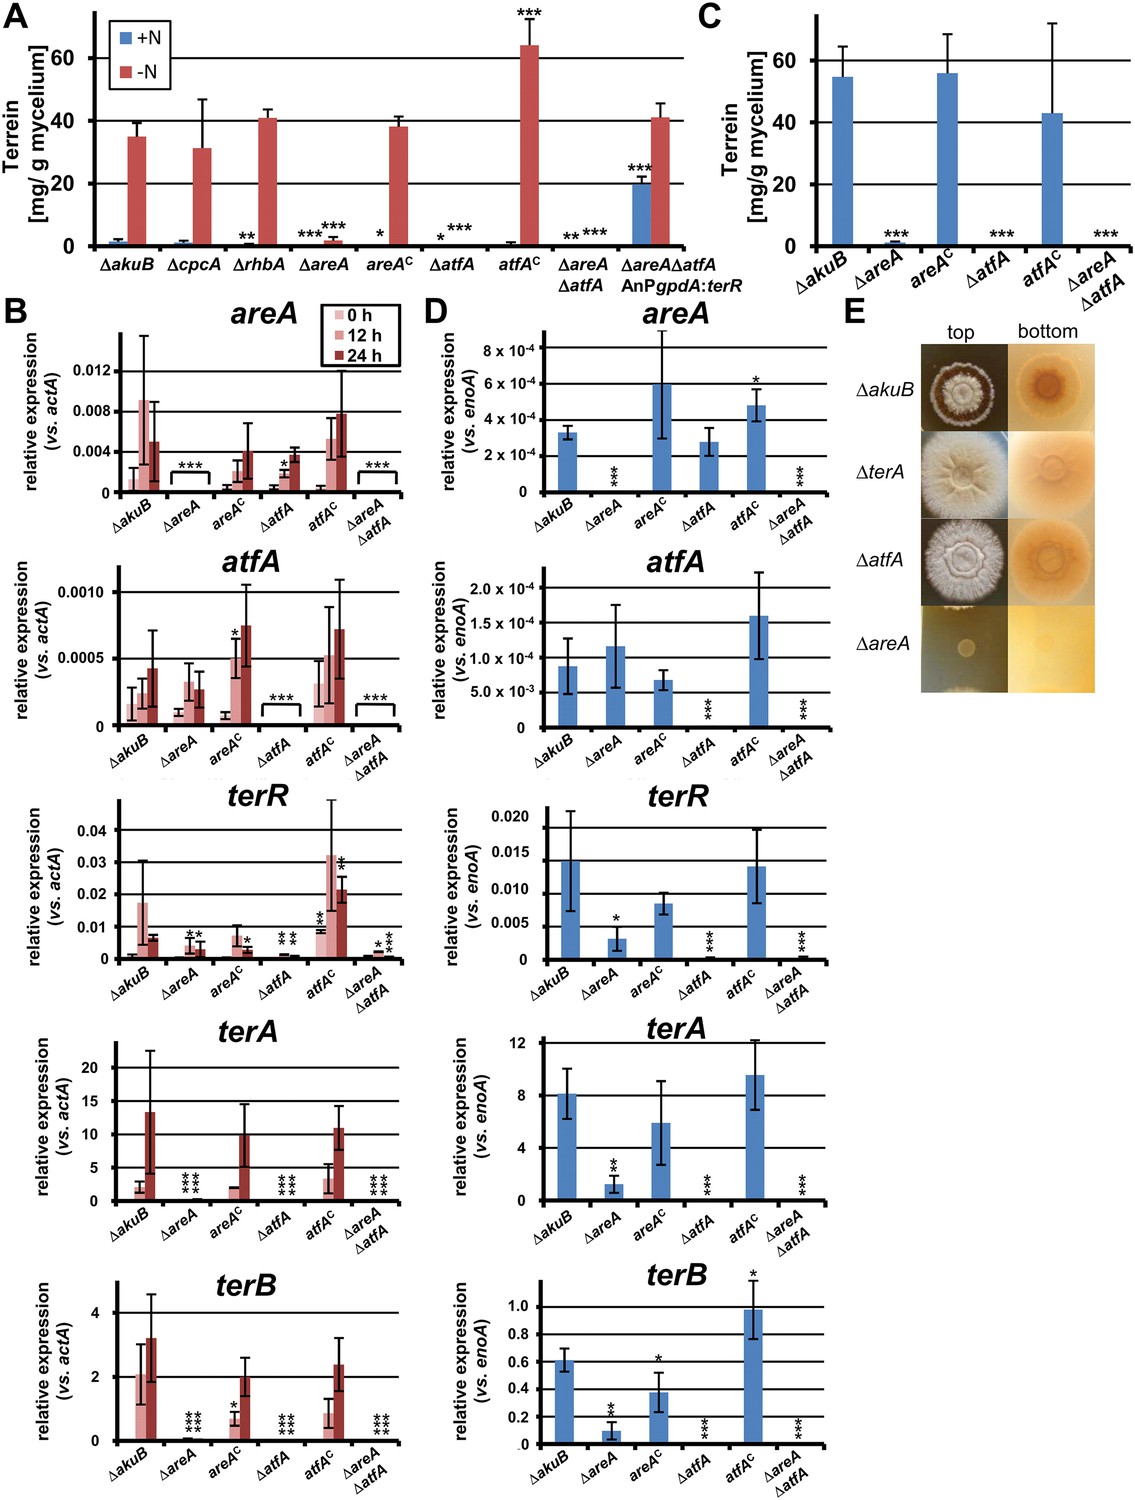
Terrein quantification and expression of terrein cluster genes in nitrogen regulator mutants.
(A) Terrein quantification from the parental strains SBUG844ΔakuB (ΔakuB), regulator mutants (ΔcpcA), (ΔrhbA), (ΔareA), (ΔatfA), (ΔareAΔatfA), complemented mutants (areAC), (atfAC), and strain SBUG844ΔakuBΔareAΔatfAΔ::AnPgpdA:terR with terR overexpression in the ΔareAΔatfA background. Mycelia were pre-grown in glutamine-supplemented media, washed and transferred to minimal medium with (+N) or without (−N) 50 mM glutamine. Terrein was quantified from supernatants 24 hr after the shift. (B) qRT-PCR of strains ΔakuB, ΔareA, areAC, ΔatfA, atfAC, and ΔareAΔatfA were pre-cultivated for 40 hr in glutamine-supplemented media and transferred to nitrogen starvation. RNA was isolated at 0, 12, and 24 hr of starvation. Transcript levels were normalised against the actin gene actA by fold expression = 2^(CTtarget − CTactA). (C) Terrein quantification from strains shown in (B) after 72 hr of cultivation in glutamine-containing minimal medium supplemented with 10 mM methionine. (D) qRT-PCR from RNA of strains shown in (C) isolated after 48 hr of cultivation. Transcript levels were normalized against the enolase gene enoA by fold expression = 2^(CTtarget − CTenoA). (E) Top and bottom view of colonies of Aspergillus terreus wild-type (ΔakuB) and mutants (ΔterA, ΔatfA, ΔareA) grown for 72 hr on solid minimal media supplemented with 25 mM methionine as sole nitrogen source. The red pigmentation of the wild-type (bottom view) is lost in the ΔterA and ΔatfA mutants that show some enhanced growth while unable to produce terrein. The ΔareA strain is unable to grow. In all experiments biological triplicates with technical duplicates were analysed. Statistical significances in comparison to the parental ΔakuB strain were calculated by the Student's paired t-test with a two-tailed distribution: *p<0.05, **p<0.01; ***p<0.001.
-
Figure 4—source data 1
Genotypes of strains used in the study.
- https://doi.org/10.7554/eLife.07861.010
-
Figure 4—source data 2
List of oligo nucleotides used in the study.
- https://doi.org/10.7554/eLife.07861.011
Figure 4—figure supplement 1
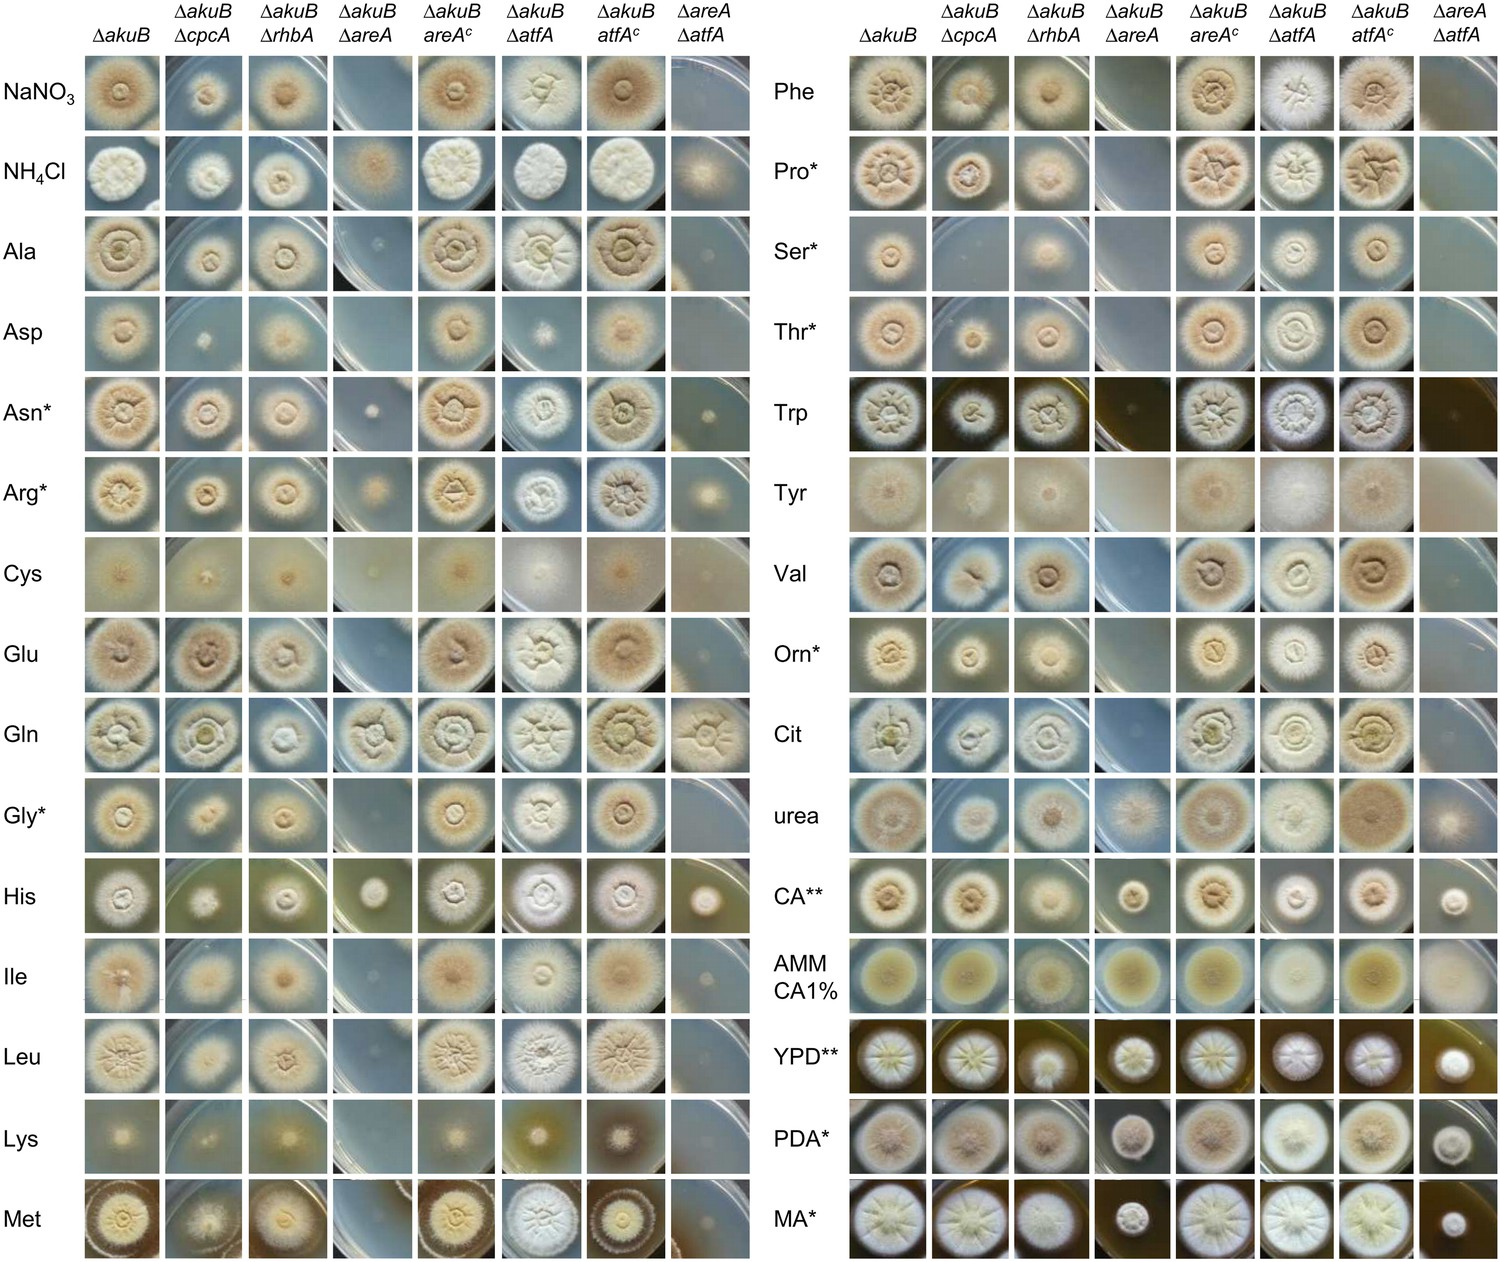
Analysis of colony formation and growth phenotypes of nitrogen regulator mutants in the presence of different nitrogen sources
As basal medium AMM-G100 without nitrogen was used, which was supplemented with 70 mM inorganic nitrogen (NaNO3 or NH4Cl), 50 mM of standard amino acids, ornithine (Orn), citrulline (Cit), urea, or 1% casamino acids (CA). Additionally, AMM-CA1% (without glucose) and the complex media yeast extract-peptone-dextrose (YPD), potato dextrose agar (PDA), and malt extract agar (MA) were used. Photographs were generally taken after 96 hr of incubation at 37°C. Asterisks denote different incubation times: * = 72 hr; ** = 48 hr. Note the severely reduced colony formation of the ΔareA strain on virtually all single amino acids except for arginine, glutamine, and histidine. Additionally, note the loss of conidia colouration in the ΔatfA strain.
Figure 4—figure supplement 2
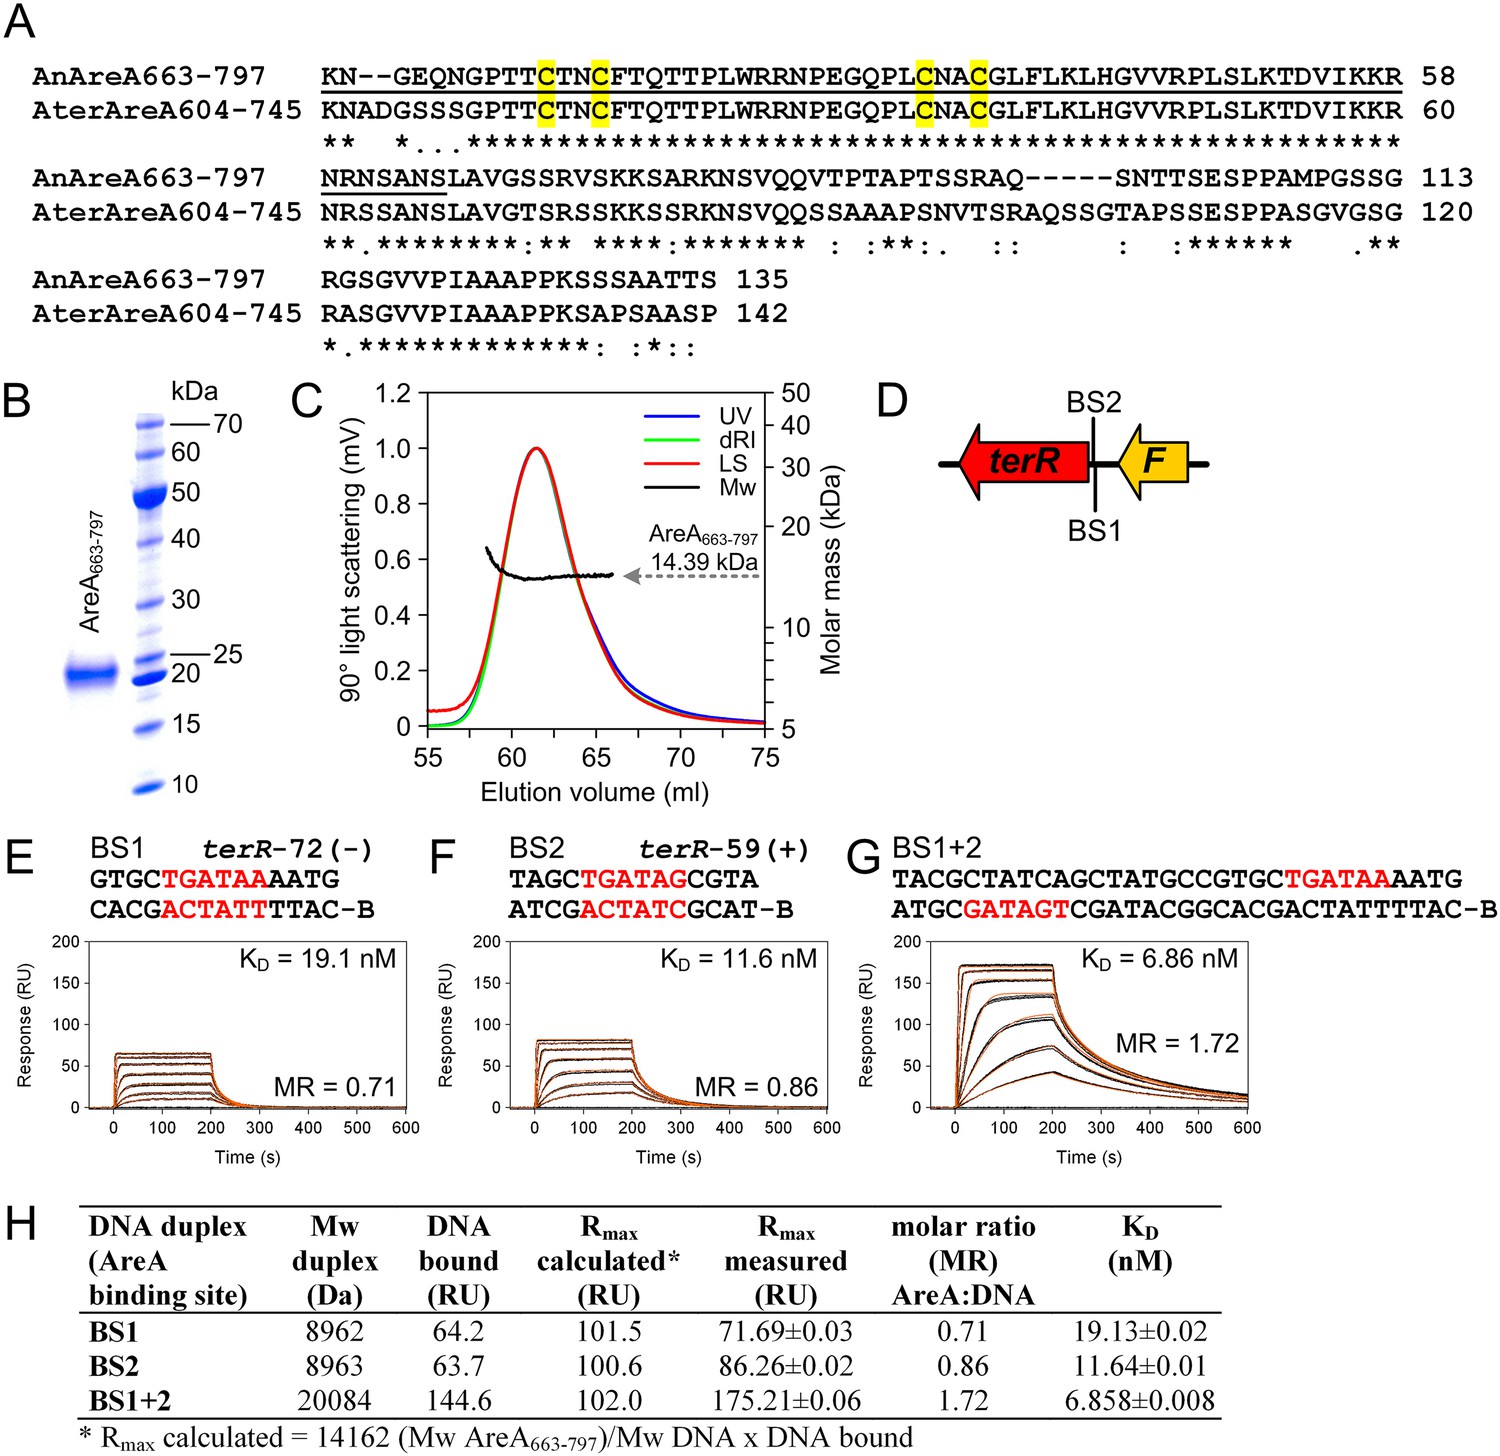
Biochemical characterisation of the recombinant AreA DNA-binding domain and in vitro binding to HGATAR motifs identified in the terR promoter of the Aspergillus terreus terrein biosynthesis gene cluster.
(A) Amino acid sequence alignment of the AreA DNA binding domains from Aspergillus nidulans and A. terreus. Underlined amino acids denote the 65-residue peptide used for solving the solution structure of the AreA:DNA complex (Starich et al., 1998). Cysteine residues of the Cys2–Cys2 zinc finger module are highlighted in yellow. (B) SDS-PAGE analysis of purified AreA663-797. (C) In solution oligomeric state analysis of AreA663-797 as determined via size exclusion chromatography and multiangle static light scattering. The light scattering signal (LS) is shown overlaid with the calculated molar mass (Mw) across the elution profile as monitored by the absorbance at 280 nm (UV) and changes of the refractive index (dRI). (D) Schematic presentation of putative GATA AreA binding sites (BS 1 and 2) in the terR promoter. (E–G) Real-time in vitro surface plasmon resonance (SPR) interaction analysis of AreA663-797 with DNA containing the identified GATA motifs from the terR promoter of the terrein biosynthesis gene cluster. Sequences of DNA duplexes used for SPR analysis are shown on top of the sensorgrams. Numbers represent the GATA motif positions relative to the start of the open reading frame. HGATAR sites are highlighted in red. (H) Dissociation constants and stoichiometry of analysed AreA663–797:DNA interactions analysed by SPR.
Figure 4—figure supplement 3
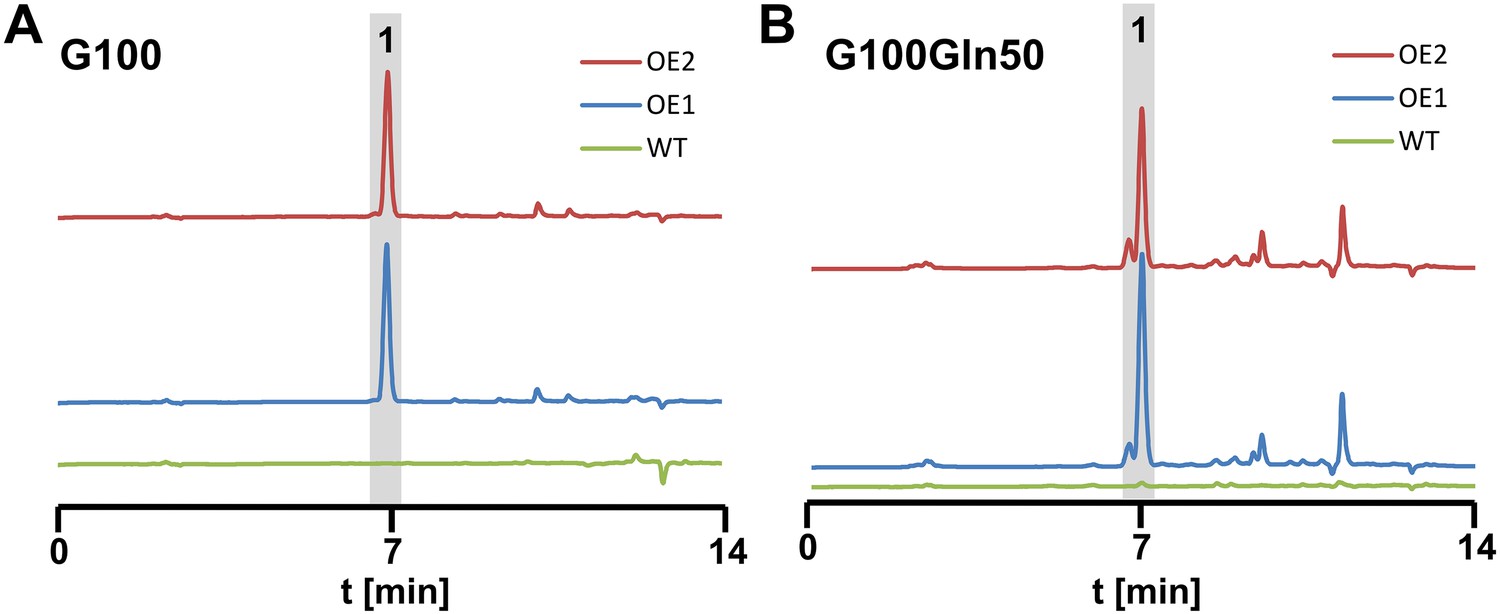
High performance liquid chromatography analyses from culture filtrates of SBUG844 wild-type and two independent atfA overexpression mutants (AnPgpdA:atfA; OE 1 and 2).
Strains were cultivated under non-inducing conditions for the wild-type. (A) AMM-G100; (B) AMM-G100Gln50. 1 = terrein. Terrein and its side products are detected from the atfA overexpressing strains but not from the wild-type.
Figure 4—figure supplement 4
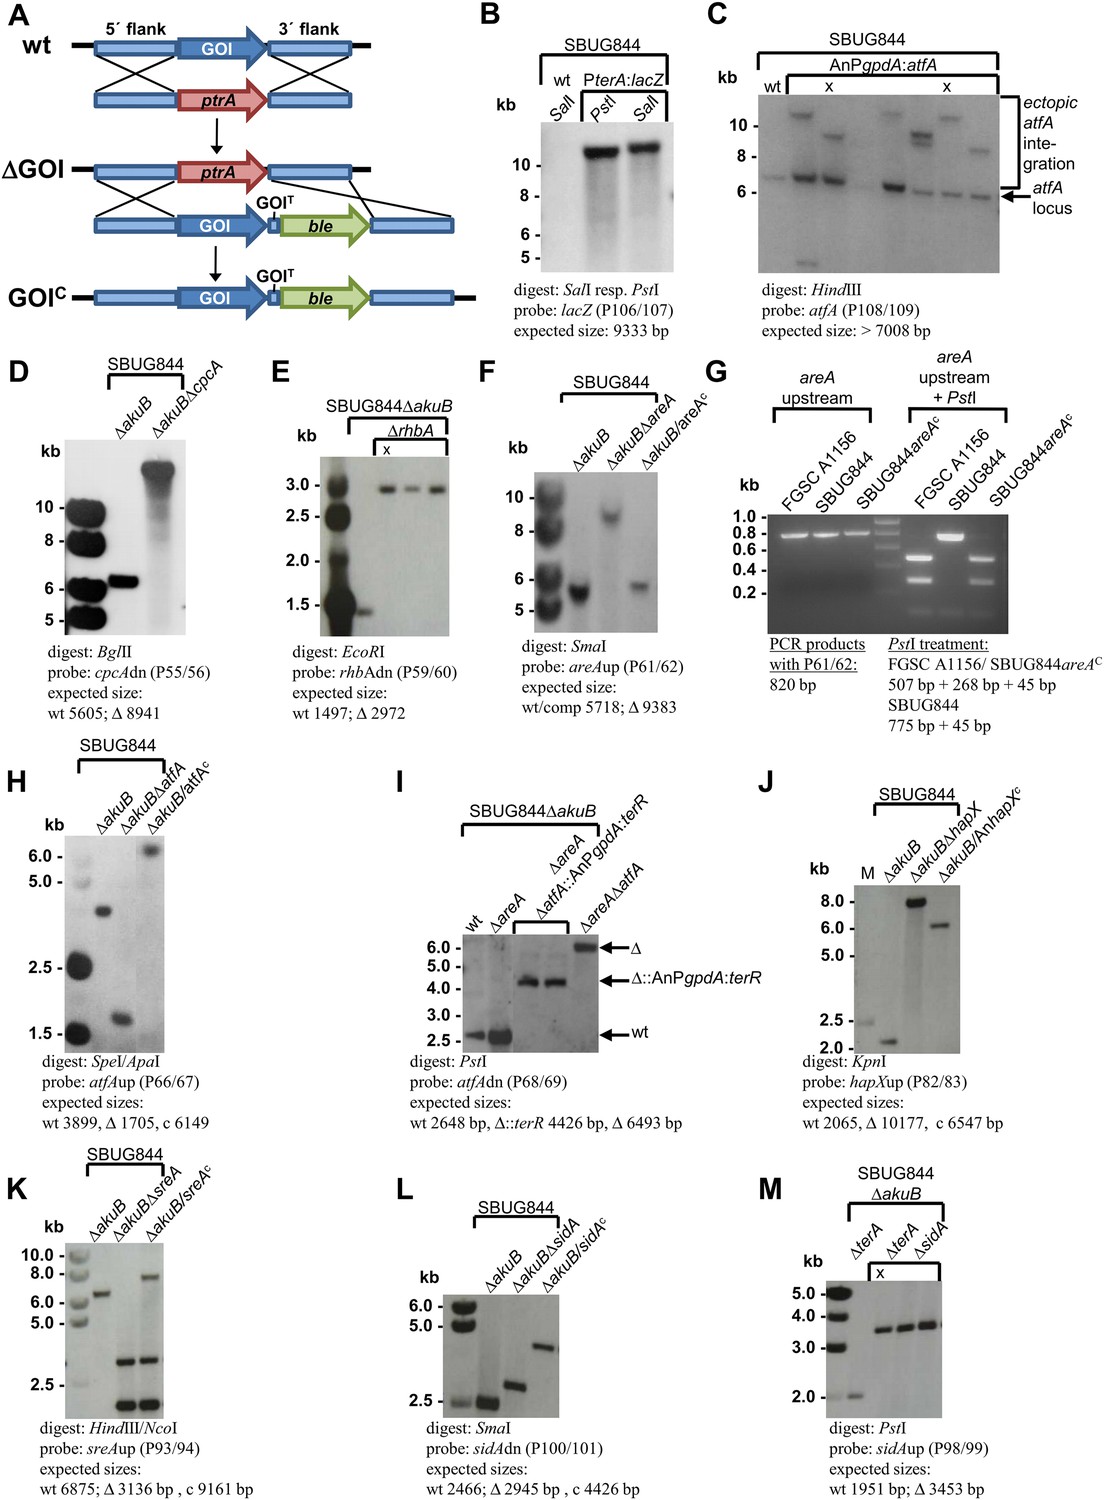
Southern blot analyses for Aspergillus terreus strains generated in this study.
Genomic DNA was isolated and restricted with the respective restriction enzymes indicated in each panel. Digoxygenin-labelled probes were used in all experiments and were amplified by the oligonucleotide couples as indicated. Signals were detected by the CDPstar chemiluminescent substrate. Expected fragment sizes are also shown. (A) General scheme for generation of gene deletions using the pyrithiamine (ptrA) resistance cassette (ΔGOI) and for complementation of deletion mutants using the phleomycine (ble) resistance cassette (GOIC) via homologous recombination. (B) Generation of the β-galactosidase reporter strain SBUG844_PterA:lacZ in A. terreus SBUG844 wild-type. (C) Overexpression of atfA in SBUG844 under control of the A. nidulans gpdA promoter. The native atfA locus (signal at 7008 bp) is still intact in strains that integrated the overexpression construct. Strains with ectopic single copy integration of the construct used for downstream experiments are denoted by ‘X’. (D) Deletion of the cpcA locus (ATEG_03131) in SBUG844ΔakuB. (E) Deletion of the rhbA locus (ATEG_09480) in SBUG844ΔakuB. (F) Deletion of the areA locus (ATEG_07264) in SBUG844ΔakuB and complementation with FGSC A1156 areA. (G) PCR and PstI digest of PCR products from the areA upstream fragments amplified from genomic DNA from FGSC A1156, SBUG844, and SBUG844/areAC. The complemented strain shows the identical PstI restriction pattern as the amplified product from FGSC A1156, whereas no PstI restriction site is present in the SBUG844 product, confirming the complementation of the ΔareA strain by the areA gene from A1156. (H) Deletion of the atfA locus (ATEG_04664) in SBUG844ΔakuB and complementation with SBUG844 atfA. (I) Deletion of the atfA locus (ATEG_04664) in the areA negative background of SBUG844ΔakuBΔareA (Δ) and replacement of atfA in SBUG844ΔakuBΔareA with the terR overexpression construct under control of the A. nidulans gpdA promoter (Δ::AnPgpdA:terR). (J) Partial deletion of the hapX locus (ATEG_08,014) in SBUG844ΔakuB and complementation with the Aspergillus nidulans FGSC A4 hapX (AN08251). (K) Deletion of the sreA locus (ATEG_07714) in SBUG844ΔakuB and complementation with SBUG844 sreA. (L) Deletion of the sidA locus (ATEG_06879) in SBUG844ΔakuB and complementation with SBUG844 sidA. (M) Deletion of sidA (ATEG_06879) in the terA negative background of SBUG844ΔakuBΔterA.
Figure 4—figure supplement 5
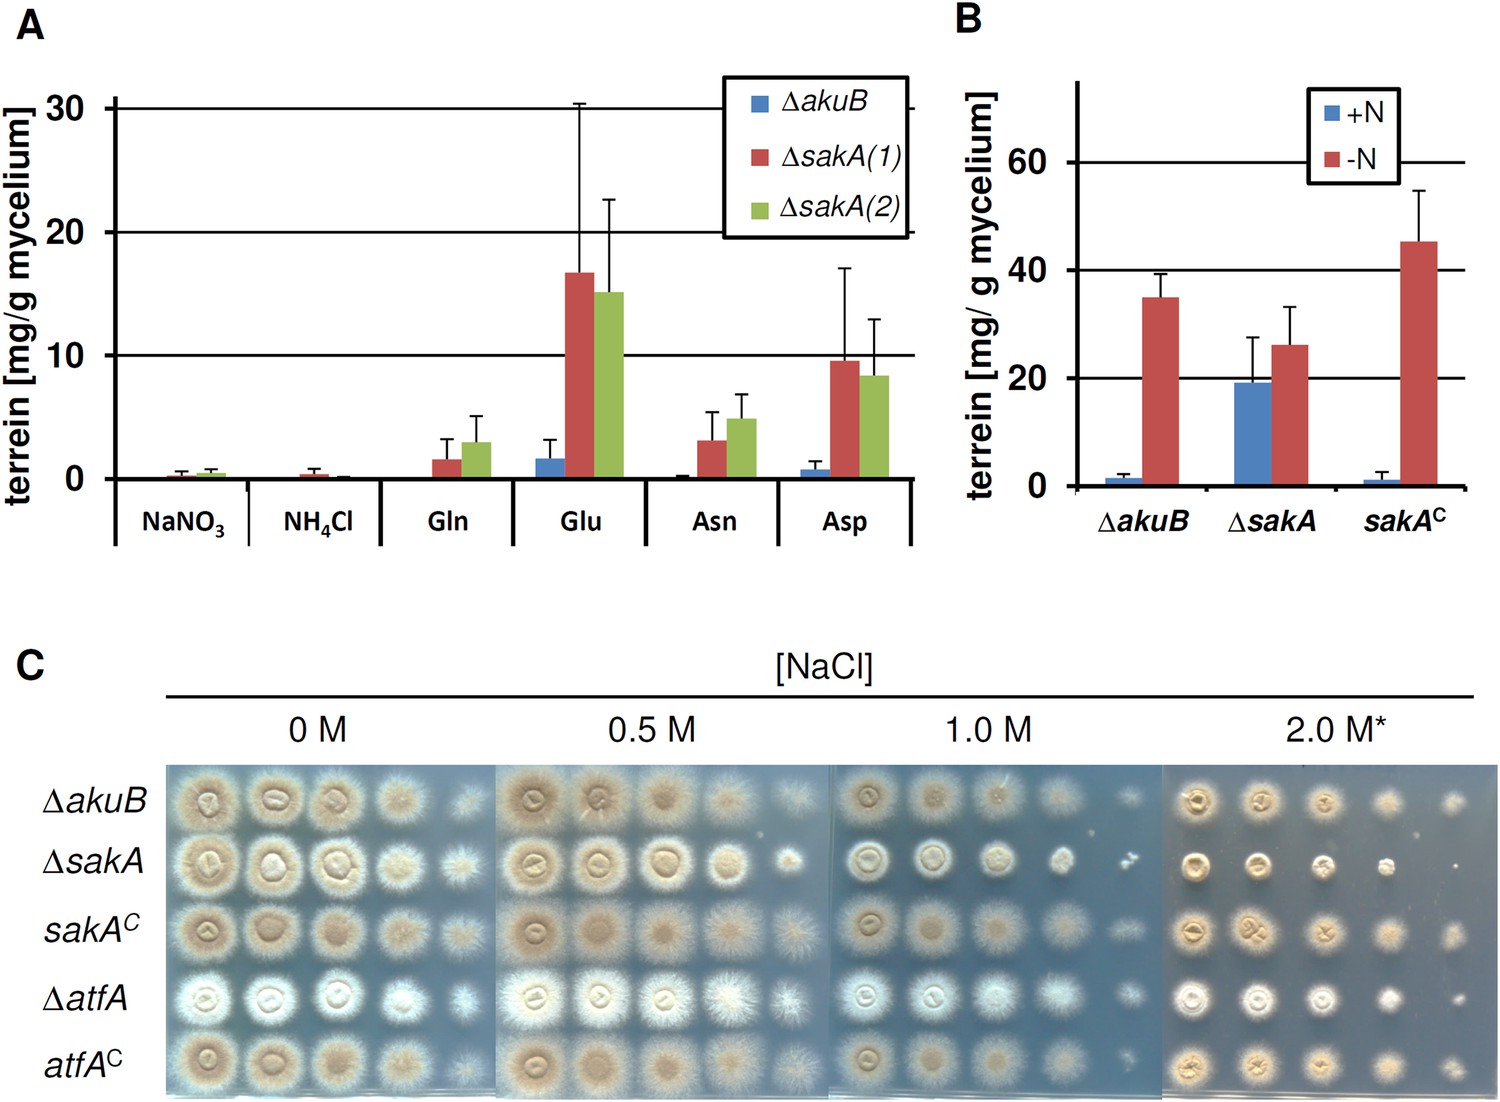
Terrein production and susceptibility to osmotic stress in a sakA mutant.
In all experiments biological triplicates with technical duplicates were analysed. (A) Terrein quantification from strains SBUG844ΔakuB (ΔakuB) and two sakA deletion strains SBUG844ΔakuBΔsakA (1) and (2) (ΔsakA) cultivated in AMM(-N)G100 for 72 hr in the presence of either 70 mM inorganic (NaNO3, NH4Cl) or 50 mM organic nitrogen (Glu, Gln, Asp, Asn). (B) Terrein quantification from strains SBUG844ΔakuB (ΔakuB), SBUG844ΔakuBΔsakA and the complemented strain SBUG844ΔakuBΔsakA/sakAC (sakAC). Cultures were pre-grown in nitrogen-rich AMM-G100Gln50, mycelia were washed and transferred to AMM(-N)G100 with (+N) or without (−N) 50 mM Gln. Terrein was quantified from supernatants 24 hr after the shift. (C) Susceptibility assay towards NaCl stress. 105 to 101 conidia of strain SBUG844ΔakuB (ΔakuB), the deletion mutants SBUG844ΔakuBΔsakA (ΔsakA) and SBUG844ΔakuBΔatfA (ΔatfA) or their complemented strains SBUG844ΔakuBΔsakA/sakAC (sakAC) and SBUG844ΔakuBΔatfA/atfAC (atfAC) were point inoculated on AMM(-N)G100 plates supplemented with 10 mM Gln and 0, 0.5, 1.0, and 2.0 M NaCl. Plates were incubated 72 hr or 5 d (*) at 37°C.
Figure 5 with 5 supplements
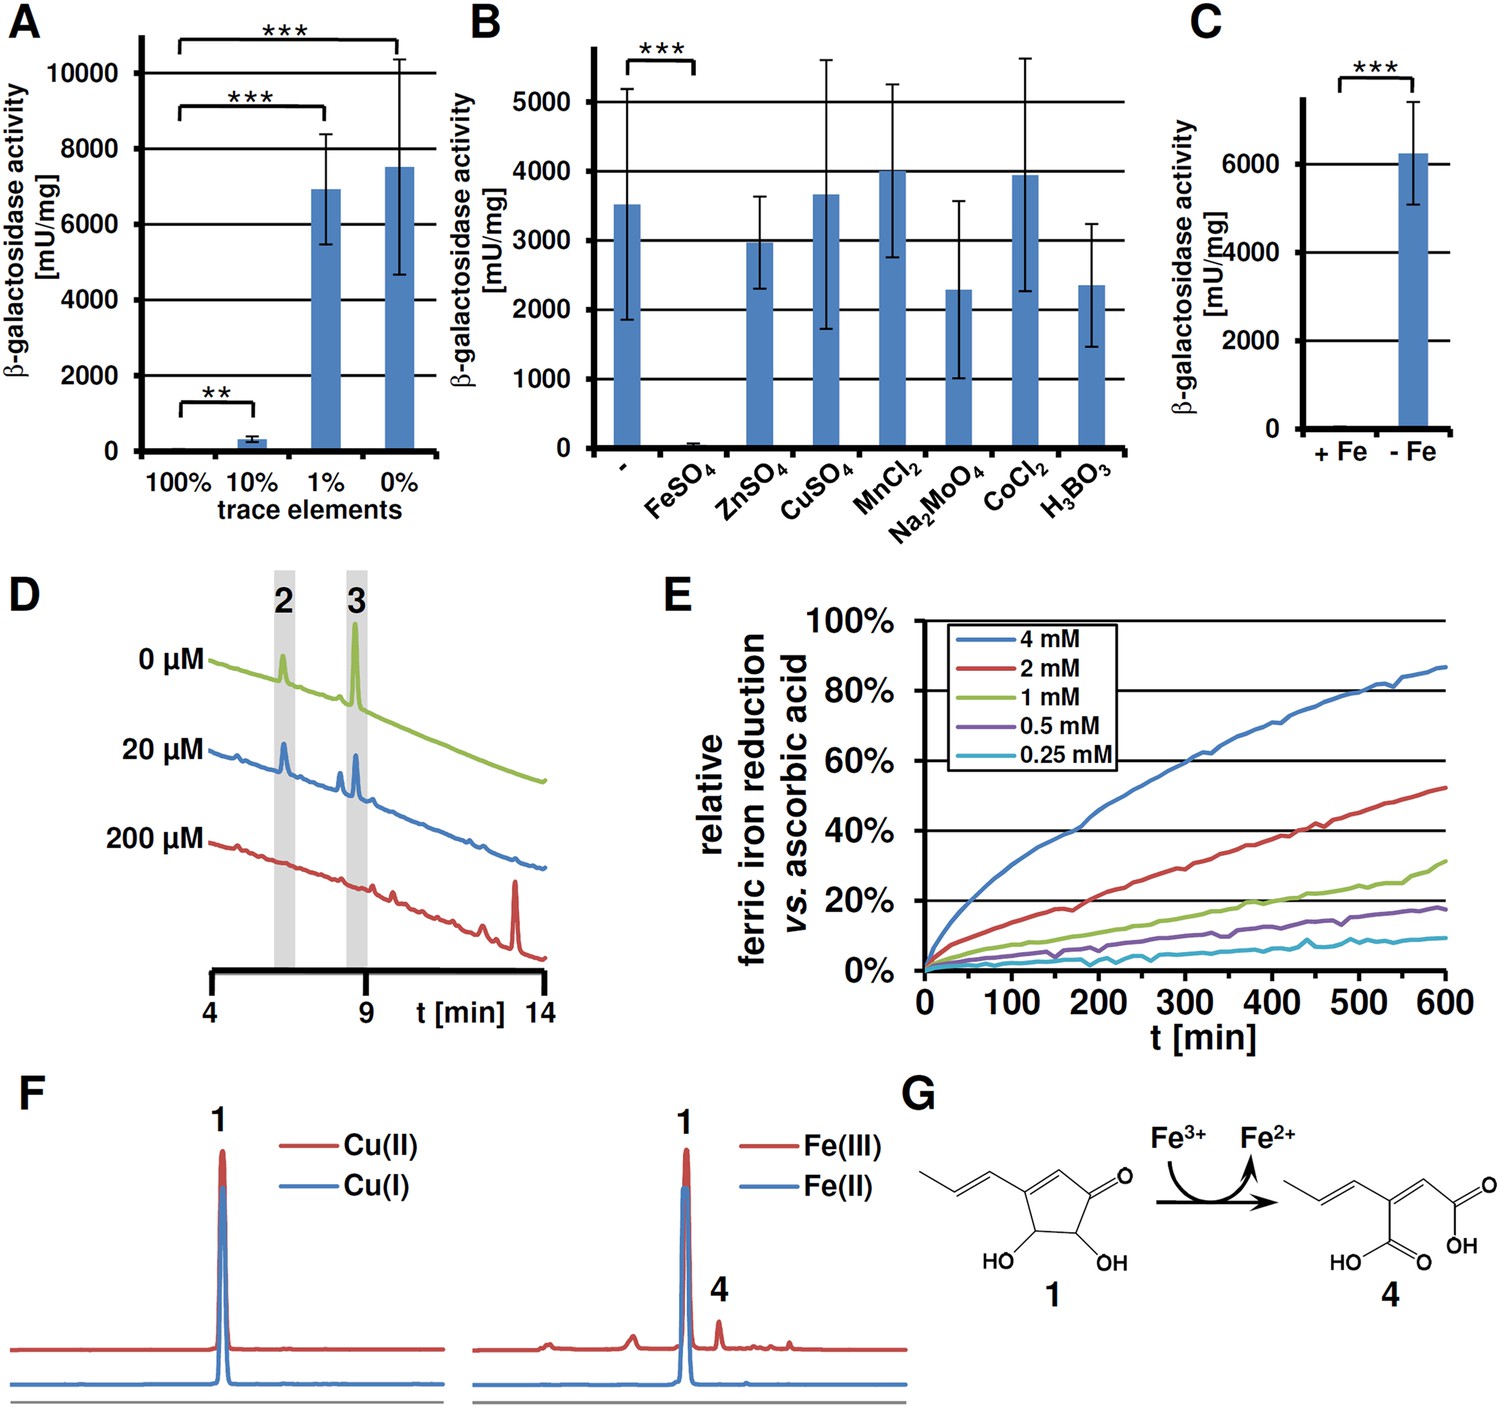
Expression of terA, production of siderophores under iron limited conditions and iron reducing properties of terrein.
All analyses were performed in biological triplicates and technical duplicates. Statistical significances were calculated by the Student's paired t-test with a two-tailed distribution. (A) β-Galactosidase activity from SBUG844_PterA:lacZ in AMM(-N)G100Gln50 medium with limited amounts of trace elements. Asterisks indicate p values vs 100% trace elements: **p<0.01; ***p<0.001. (B) β -Galactosidase activity from SBUG844_PterA:lacZ in AMM(-N)G100Gln50 medium with 1% trace elements supplemented with 20 µM of specific trace elements: FeSO4, ZnSO4, CuSO4, MnCl2, Na2MoO4, CoCl2, or H3BO3. Asterisks indicate p values vs activity without supplementation: ***p<0.001. (C) β-Galactosidase activity from SBUG844_PterA:lacZ in AMM(-N)G100Gln50 medium with and without 40 µM FeCl3. Asterisks indicate p values vs 40 µM FeCl3: ***p<0.001. (D) High performance liquid chromatography (HPLC) profiles of lyophilised culture supernatants of ΔterA after 72 hr of cultivation in AMM(-N)G100Gln50 supplemented with 0, 20, or 200 µM FeCl3. Peaks for the siderophores ferrichrysin (2) and coprogen (3) are indicated. (E) Fe(III) reduction by terrein determined by the TPTZ assay. Ascorbic acid served as control and maximum reduction by ascorbic acid was set as 100%. Analyses were made from duplicates. (F) HPLC profiles of terrein after incubation with different oxidised (upper, red lines) or reduced (lower, blue lines) metal ions. Left: Cu(II)SO4 and Cu(I)Ac; right: Fe(III)Cl3 and Fe(II)SO4. 1 = terrein; 4 = propylene maleic acid. (G) Scheme of terrein oxidation during iron reduction leading to the formation of propylene maleic acid.
-
Figure 5—source data 1
Analytical data of coprogen.
- https://doi.org/10.7554/eLife.07861.018
-
Figure 5—source data 2
Analytical data of ferrichrysin.
- https://doi.org/10.7554/eLife.07861.019
Figure 5—figure supplement 1
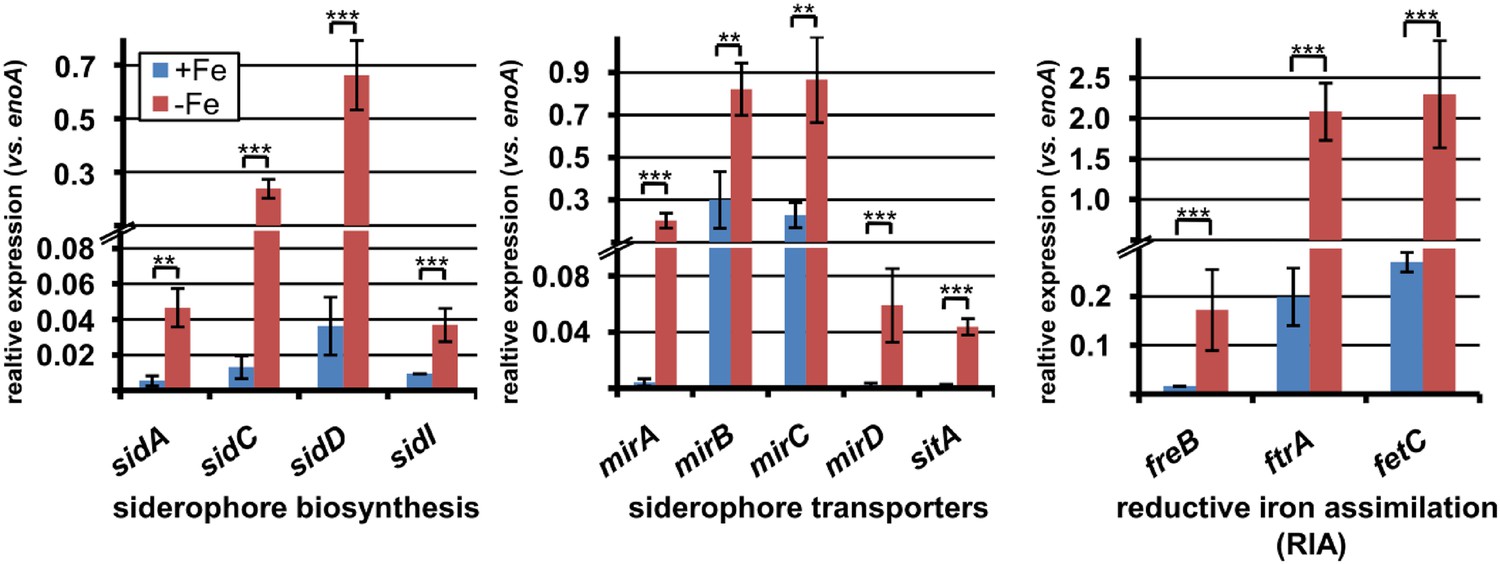
qRT-PCR expression analysis of genes from iron acquisition systems under iron-supplemented and limited conditions.
All analyses were performed from biological triplicates and technical duplicates. Statistical significances were calculated by the Student's paired t-test with a two-tailed distribution. SBUG844 wild-type was grown in AMM-G100Gln50 under iron-supplemented (40 µM; +Fe) and starved conditions (−Fe). qRT-PCR was performed on genes assumed to be responsible for siderophore biosynthesis, siderophore transport, or reductive iron assimilation. Transcript quantities were normalised against enoA by fold expression = 2^(CTtarget − CTeno). Asterisks indicate p values vs 0 µM FeCl3: **p<0.01; ***p<0.001.
Figure 5—figure supplement 2
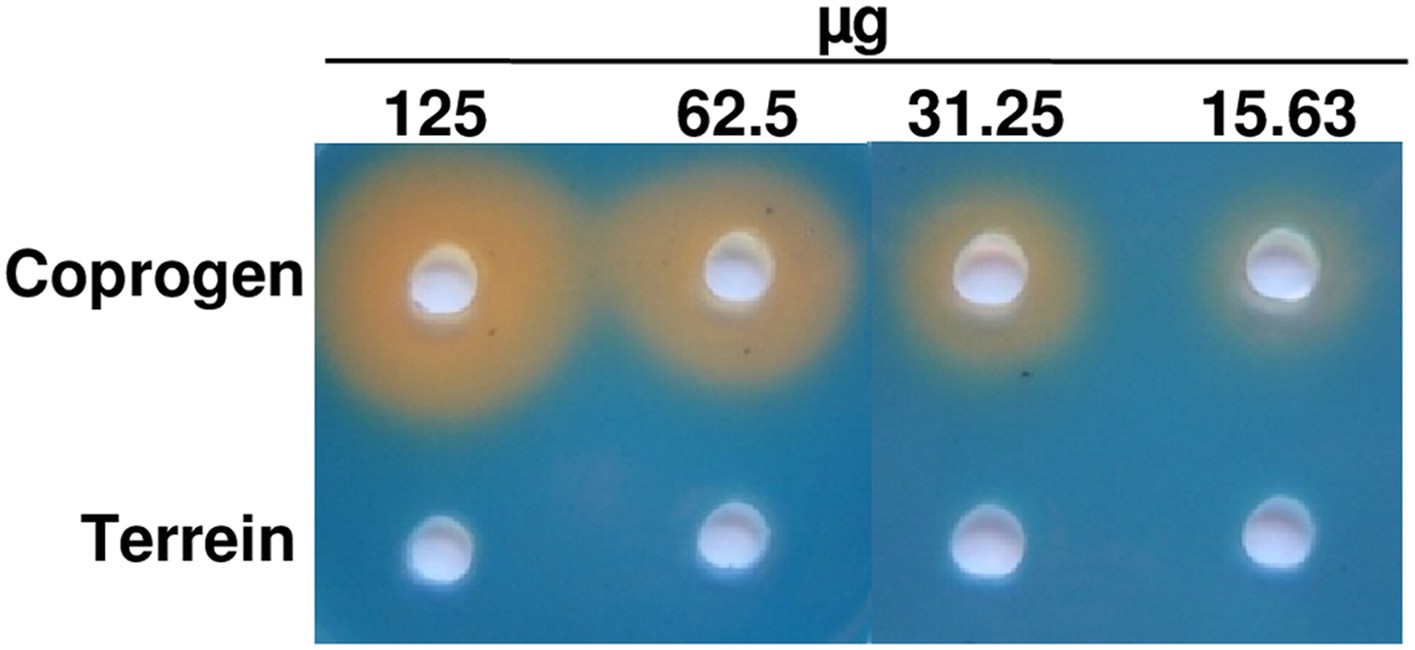
Chrome azol S (CAS) assay of coprogen and terrein.
Both substances were dissolved in methanol and serial dilutions (125–15.63 µg) were added to punched holes of CAS plates. Photographs were taken 48 hr after incubation at 30°C.
Figure 5—figure supplement 3
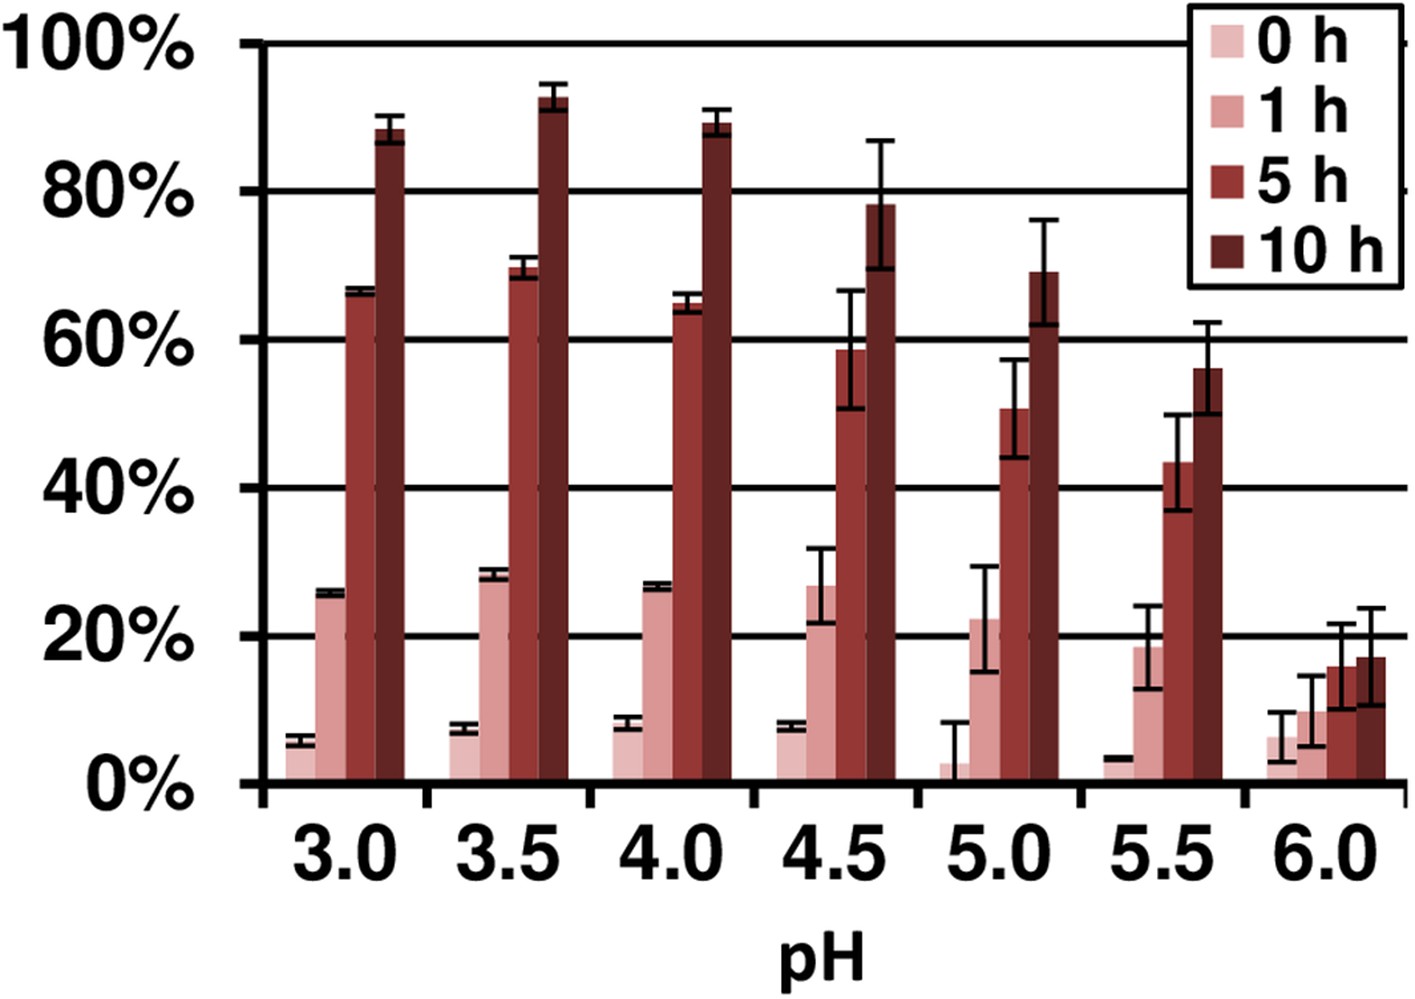
pH- and time-dependent Fe(III) reduction by terrein assayed by TPTZ.
10 µM FeCl3 were incubated with 4 mM fixed concentration of terrein in acetate buffer in a pH range from 3.0 to 6.0. The analyses were performed from duplicates.
Figure 5—figure supplement 4
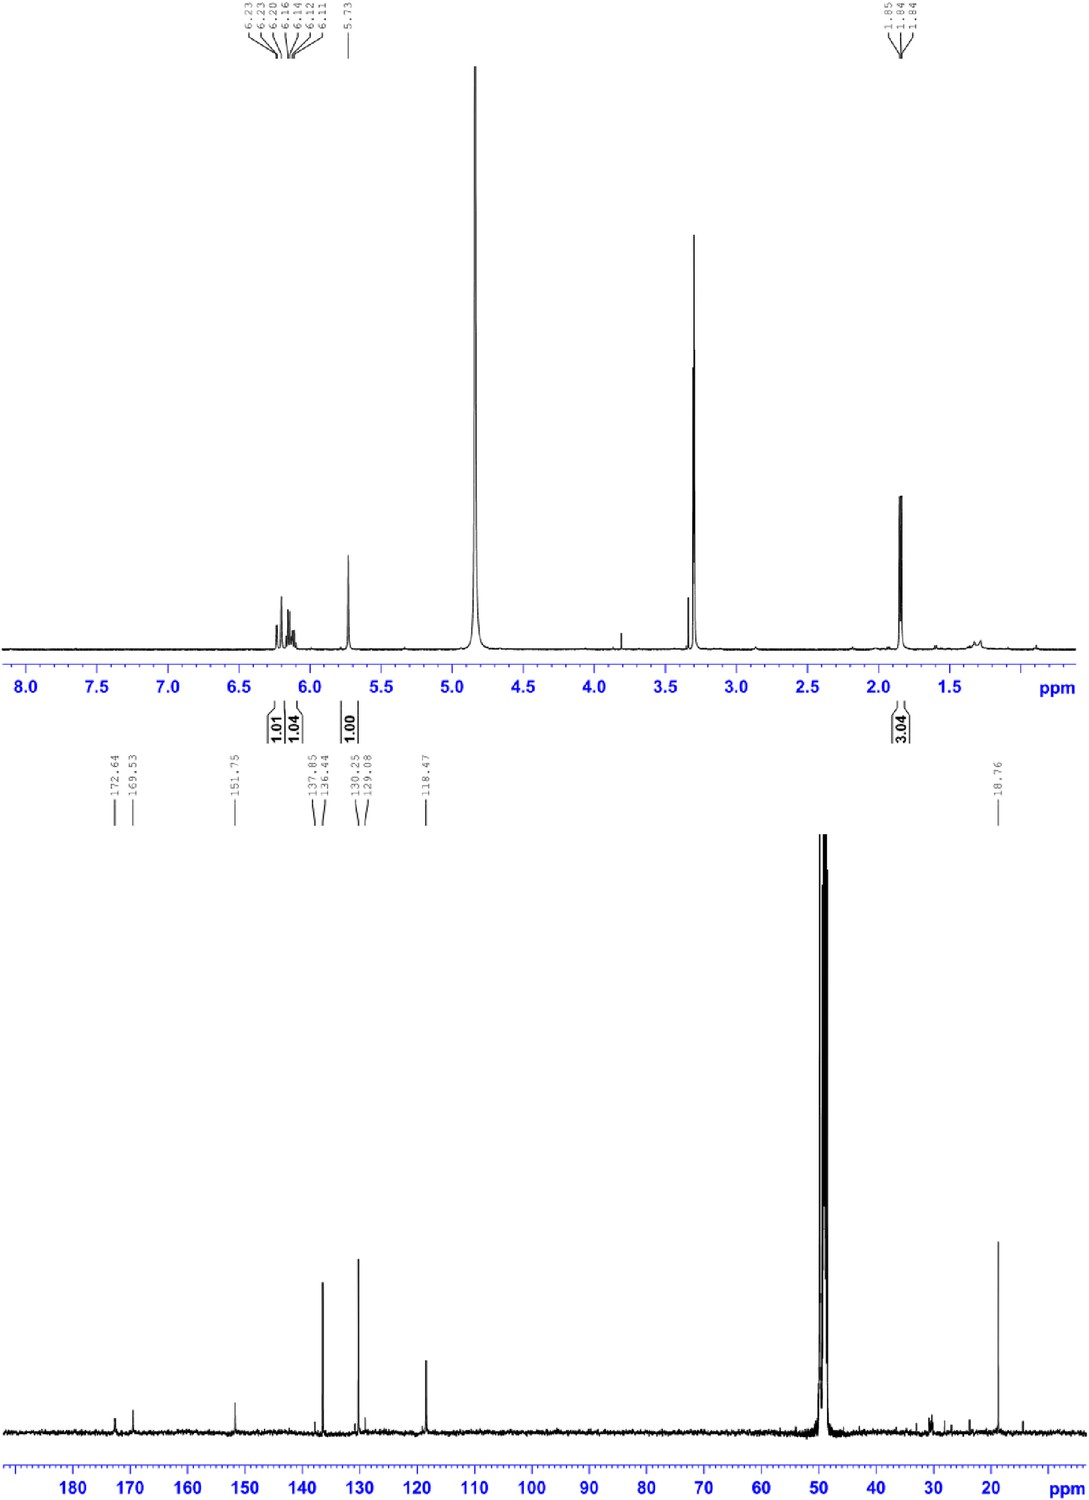
1H NMR (500 MHz, MeOD; upper panel) and 13C NMR (150 MHz, MeOD; lower panel) of compound 4, 2-((E)-prop-1-en-1-yl)maleic acid.
1H NMR (500 MHz, MeOD): δ 6.22 (1H, d, 3J = 15.8 Hz), 6.15 (1H, dq, 3J = 15.8 Hz, 3J = 6.5 Hz,), 5.73 (1H, s), 1.85 ppm (3H, d, 3J = 6.5 Hz); 13C NMR (600 MHz, MeOH): δ 172.6, 169.5, 151.7, 136.4, 130.2, 118.5, 18.8 ppm; HRMS: (ESI+): m/z calculated for C7H9O4: 157.0495, found 157.0495 [M + H]+.
Figure 5—figure supplement 5
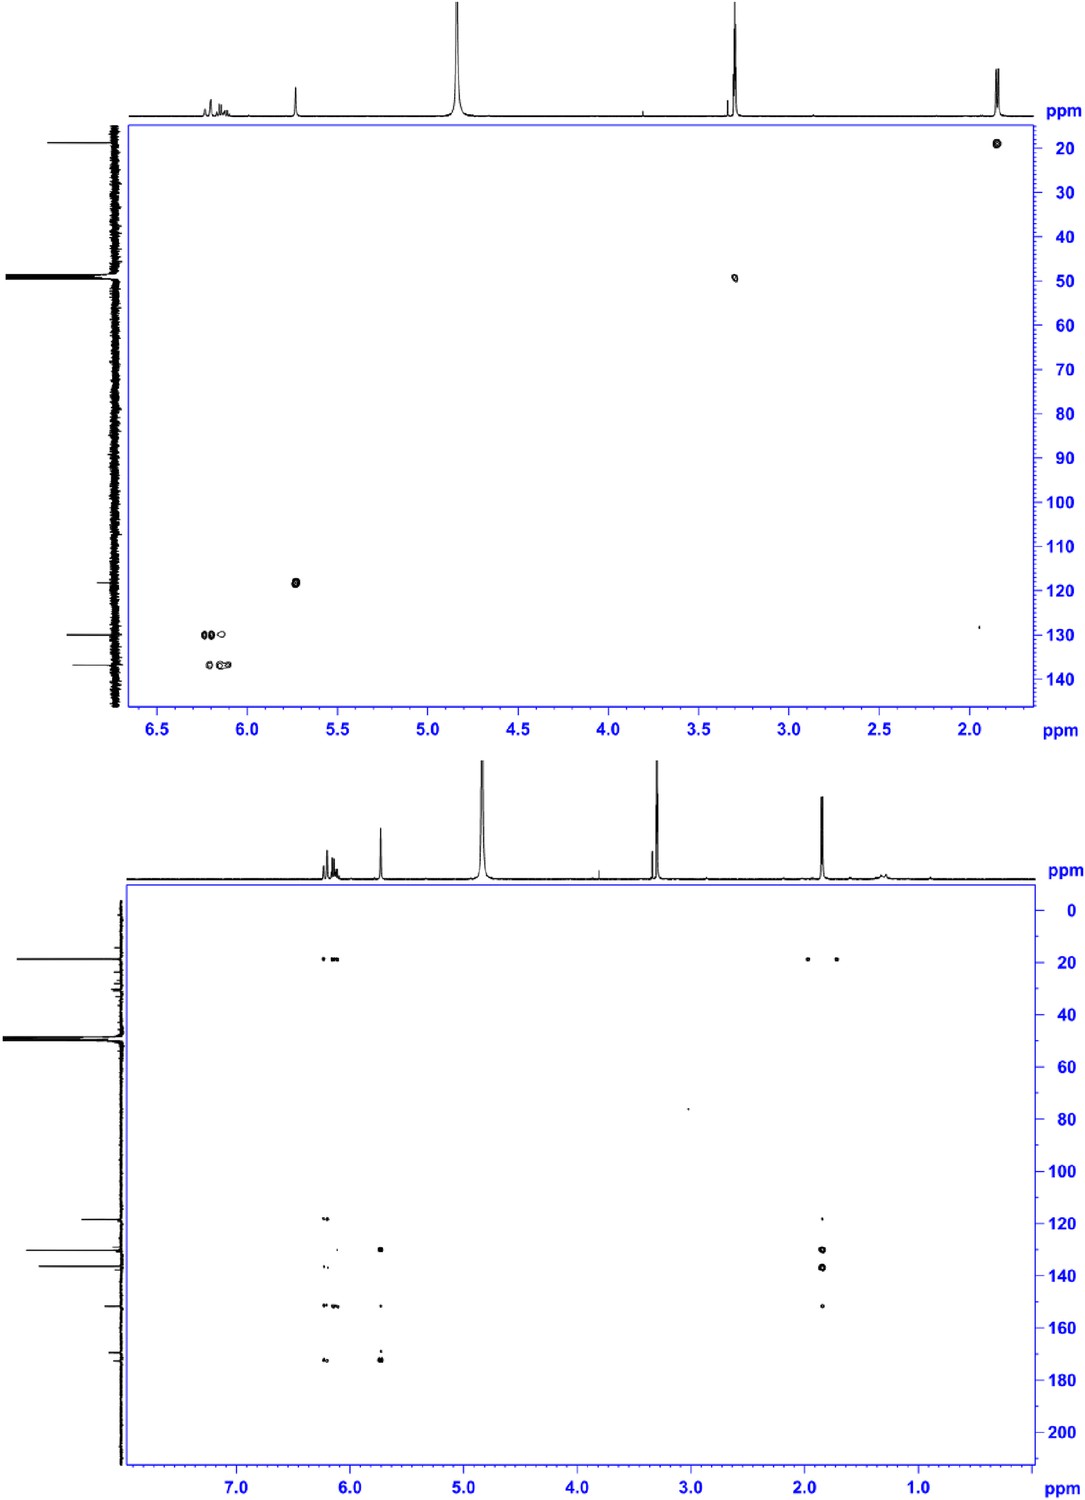
HSQC NMR (600 MHz, MeOD; upper panel) and HMBC NMR (600 MHz, MeOD; lower panel) of compound 4, 2-((E)-prop-1-en-1-yl)maleic acid.
https://doi.org/10.7554/eLife.07861.024
Figure 6 with 1 supplement
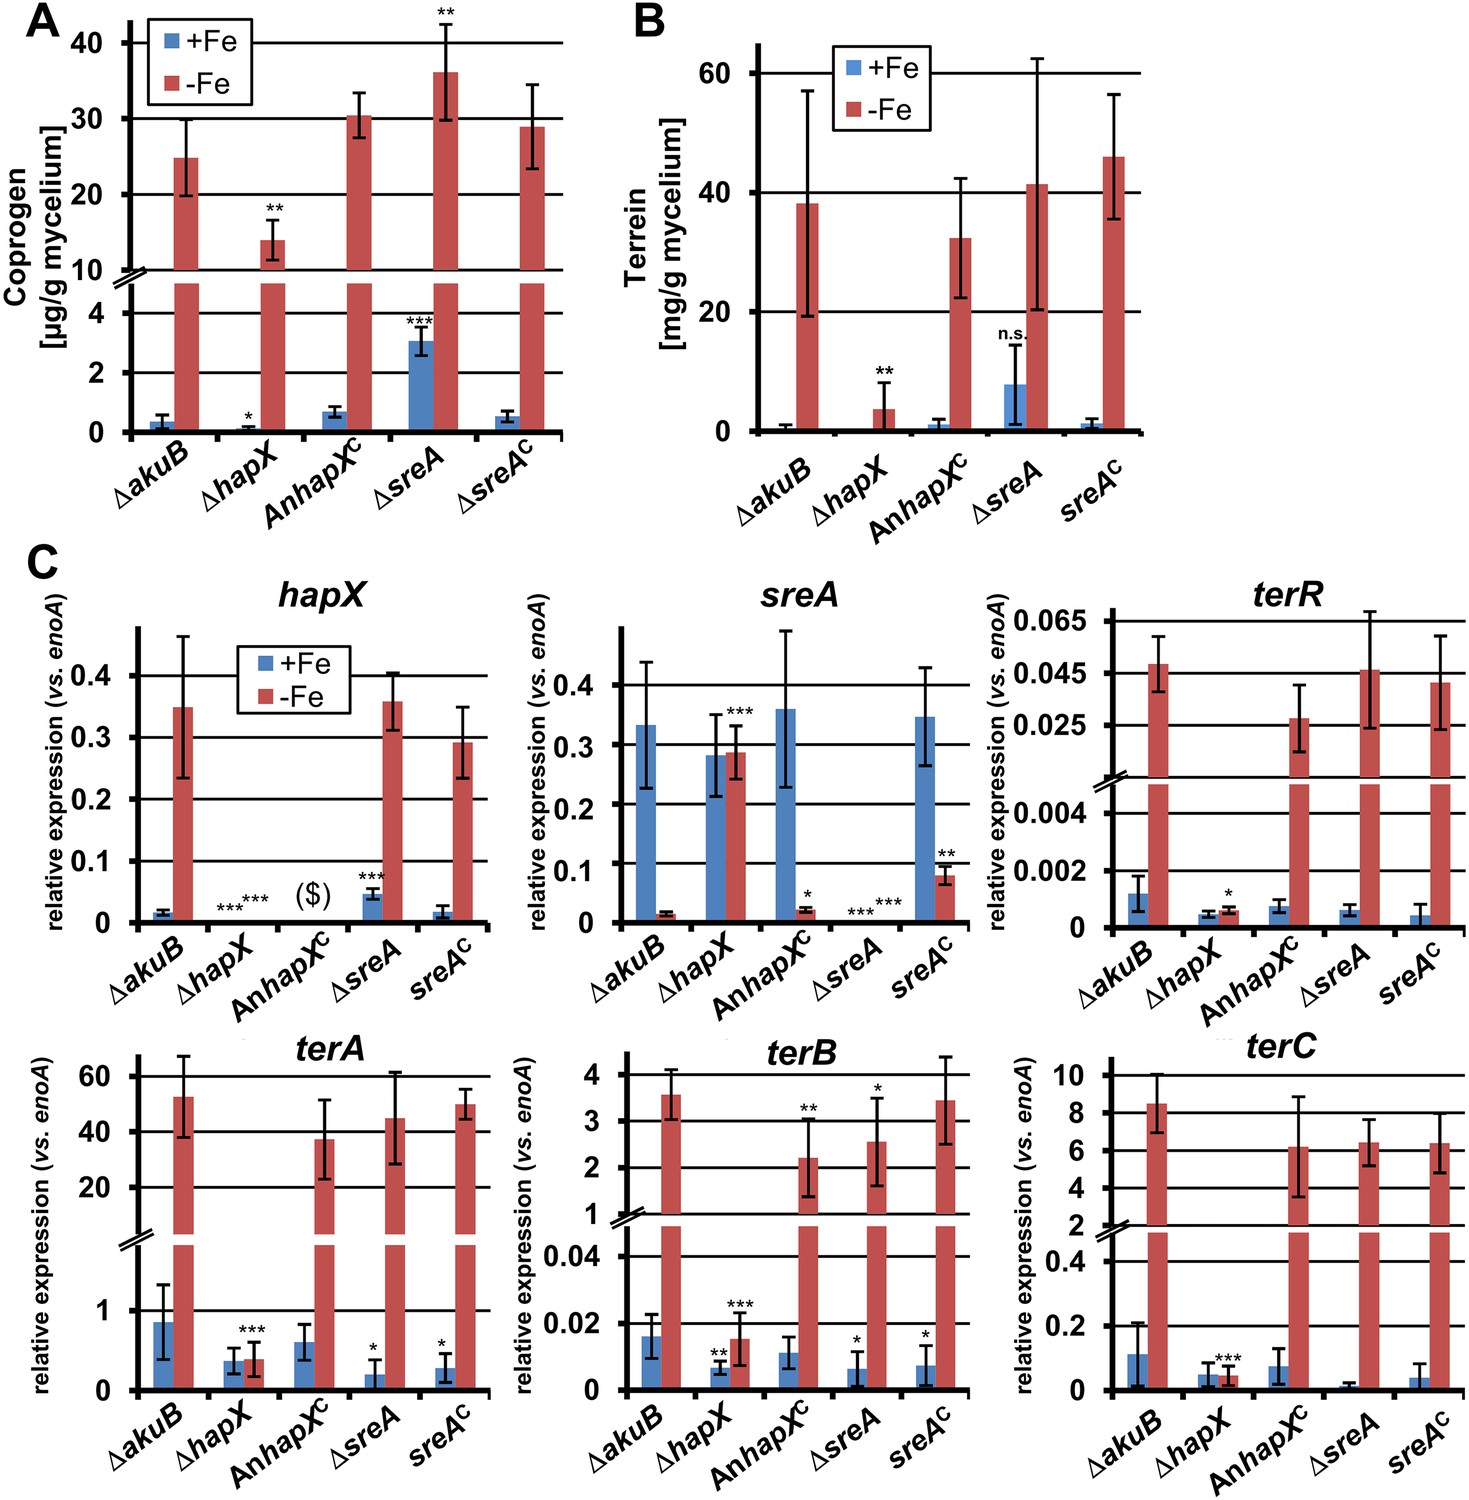
Effect of hapX and sreA deletion on terrein and coprogen biosynthesis.
(A) Coprogen or (B) terrein quantification from SBUG844ΔakuB (ΔakuB), SBUG844ΔakuBΔhapX (ΔhapX), SBUG844ΔakuBΔhapX/AnhapXC (AnhapXC), SBUG844ΔakuBΔsreA (ΔsreA), and SBUG844ΔakuBΔsreA/sreAC (sreAC) grown for 72 hr in AMM_G100Gln50 with (+Fe) or without 40 µM FeCl3 (−Fe). Coprogen was quantified from lyophilised culture supernatants and terrein from culture extracts. (C) qRT-PCR from strains and media described in (A) and (B). RNA was isolated after 40 hr of cultivation. Transcript levels were normalised against enoA by fold expression = 2^(CTtarget − CTenoA). ($) denotes the lack of hapX transcripts from the complemented ΔhapX strain, since the Aspergillus nidulans hapX was used for complementation. qRT-PCR on the complemented mutant with oligonucleotides specific for AnhapX are shown in Figure 6—figure supplement 1. All analyses were performed from biological triplicates and technical duplicates. Statistical significances were calculated in comparison to the parental ΔakuB strain by the Student's paired t-test with a two-tailed distribution: *p<0.05; **p<0.01; ***p<0.001.
Figure 6—figure supplement 1
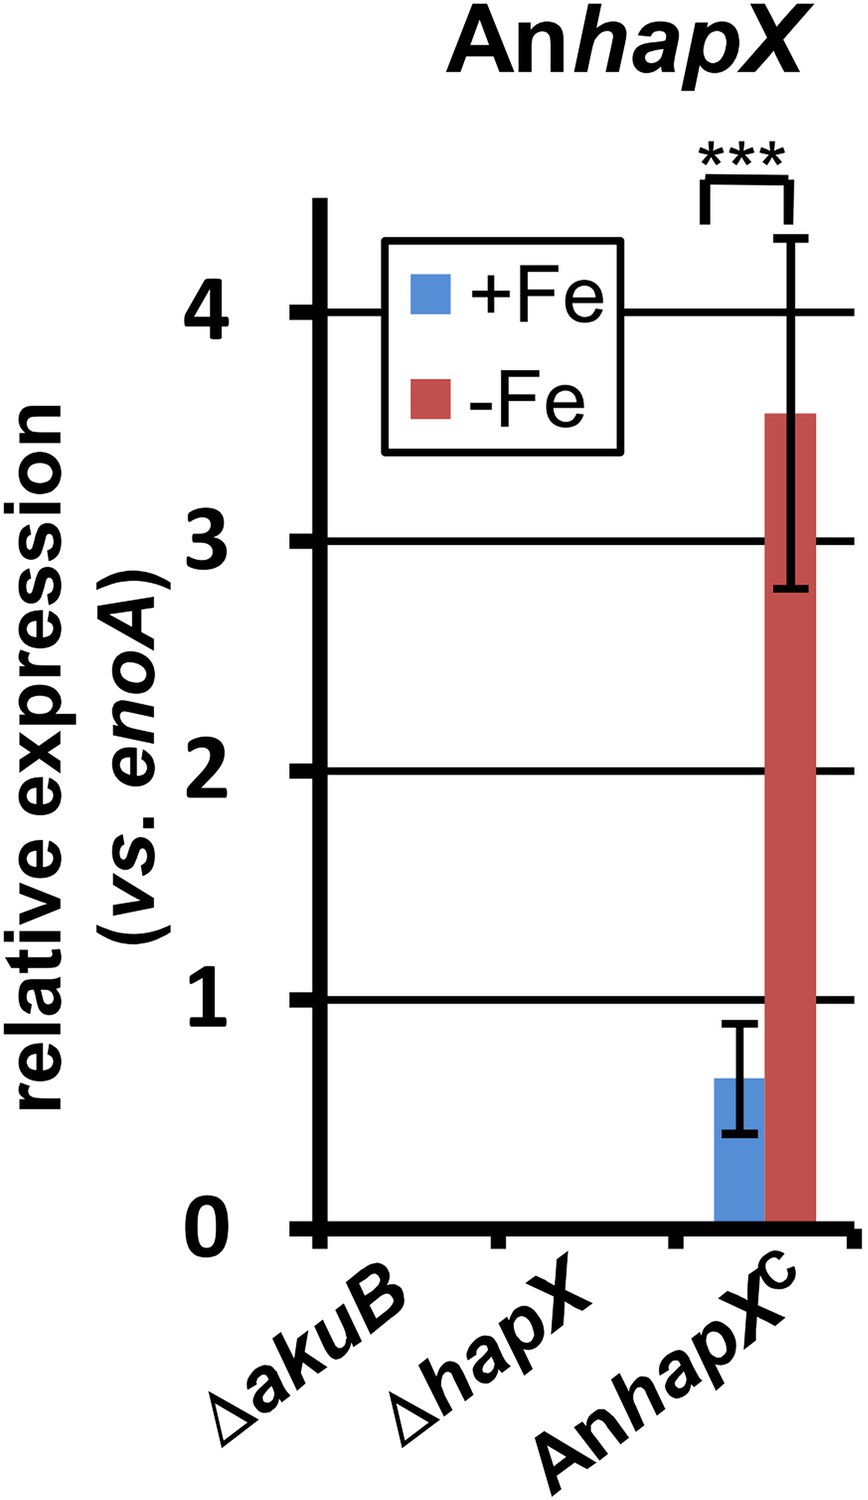
qRT-PCR analysis of Aspergillus nidulans hapX expression in the Aspergillus terreus wild-type SBUG844ΔakuB, the hapX mutant SBUG844ΔakuBΔhapX and its complemented strain SBUG844ΔakuBΔhapX/AnhapXC.
All analyses were performed from biological triplicates and in technical duplicates. All strains were grown for 40 hr in the presence (+Fe) or absence (−Fe) of 40 µM FeCl3. Transcript levels of AnhapX were normalised against enoA gene from A. terreus by fold expression = 2^(CTtarget − CTeno). The heterologously expressed AnhapX gene behaves in a similar way to the native hapX gene from A. terreus (compare with Figure 6). Statistical significances were calculated by the Student's paired t-test with a two-tailed distribution: Asterisks indicate p values vs 0 µM FeCl3: ***p<0.001.
Figure 7 with 3 supplements
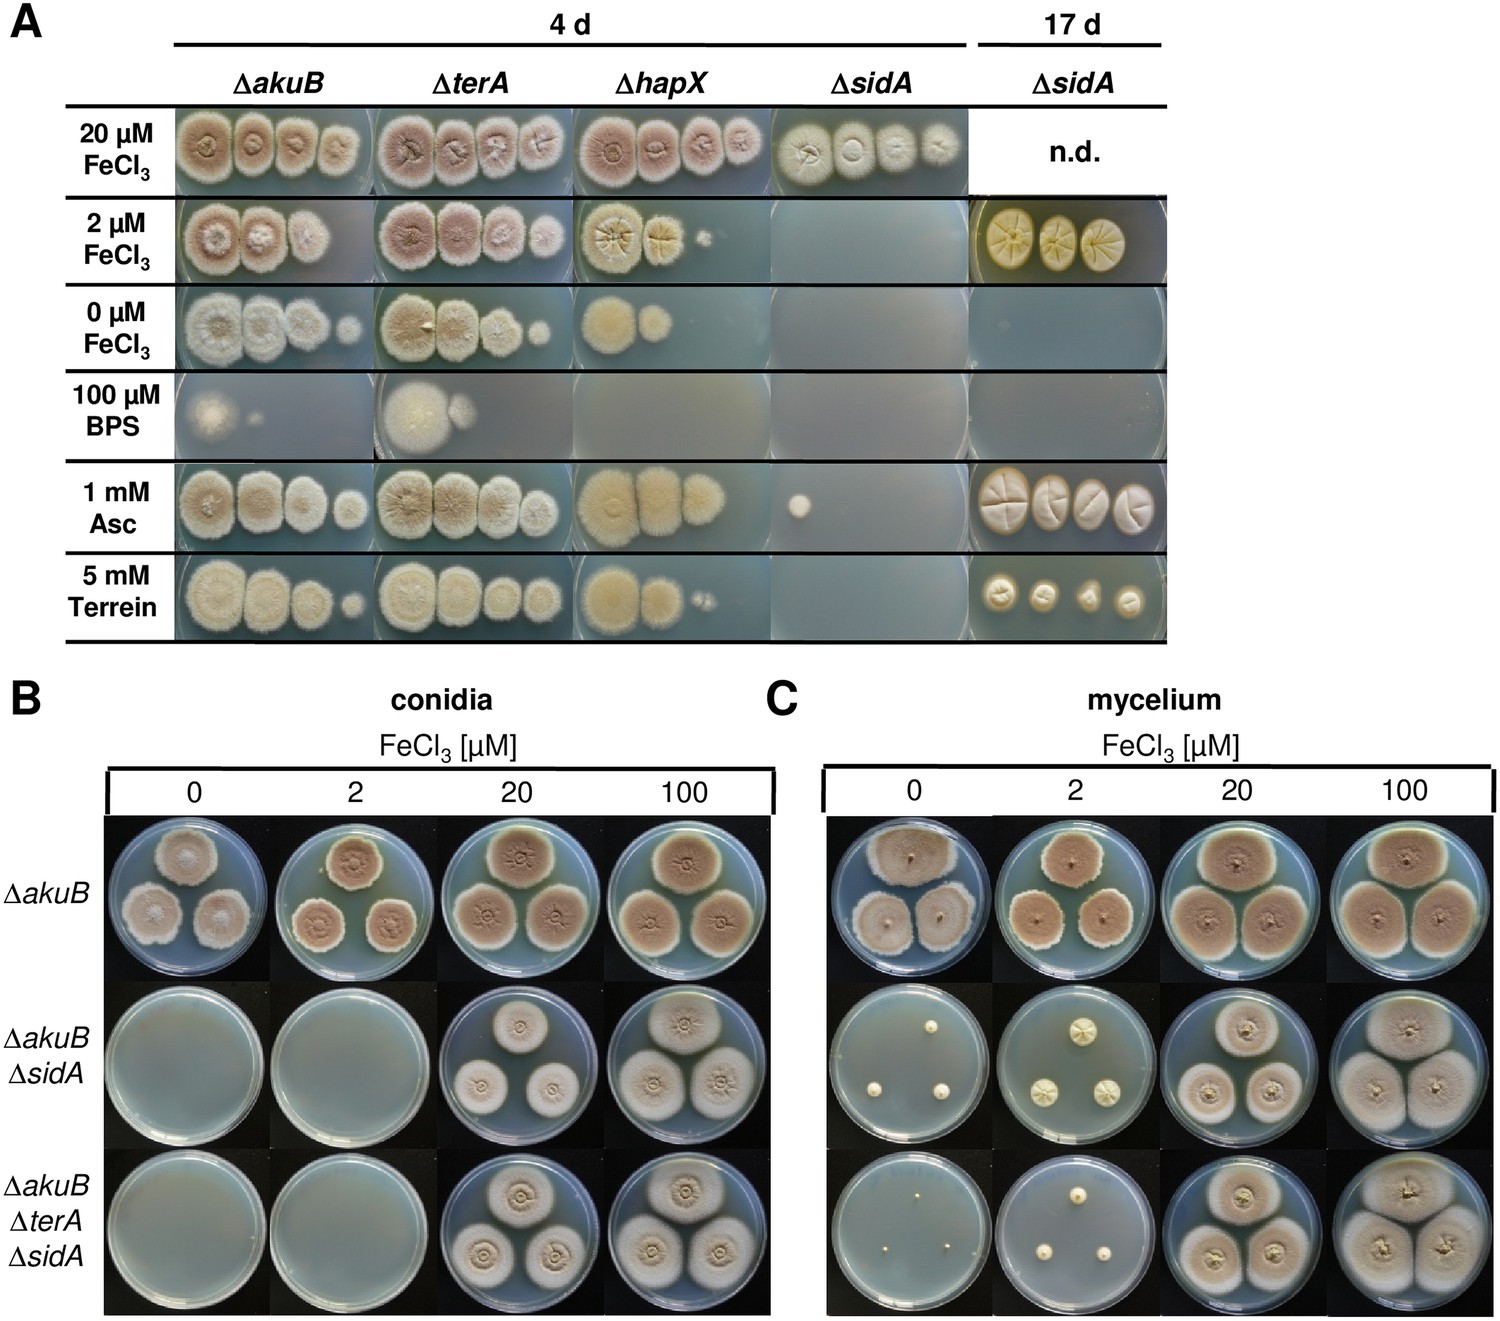
Siderophore production in sidA mutants and growth-supporting effect of terrein under iron limitation.
(A) Growth of wild-type ΔakuB, ΔterA, ΔhapX, and ΔsidA on AMM(−N)G100Gln10 plates containing different iron concentrations. Photographs were taken after 4 d and, as indicated, after 17 d of incubation at 37°C. Iron-free medium was supplemented with 100, 20, 2, or 0 µM FeCl3. Additionally, plates without iron were supplemented with bathophenanthroline disulfonate (BPS; 100 µM) to simulate harsh starvation conditions or with either ascorbic acid (1 mM) or terrein (5 or 10 mM). (B, C) Impact of terrein production on growth of ΔsidA mutants. AMM-G100Gln50 plates were supplemented with 0, 2, 20, or 100 µM FeCl3 and either inoculated with (B) conidia or (C) mycelial pellets from cultures pre-grown for 40 hr in AMM-G100Gln50 with 200 µM FeCl3. The parental Aspergillus terreus wild-type ΔakuB, the ΔakuBΔsidA strain, and the ΔakuBΔterAΔsidA are shown. Mycelia from a 40 hr culture in AMM-G100Gln50 with 200 µM FeCl3 was washed with iron-free medium and three pellets were applied to the plates. Plates were incubated at 37°C for 5 d.
Figure 7—figure supplement 1
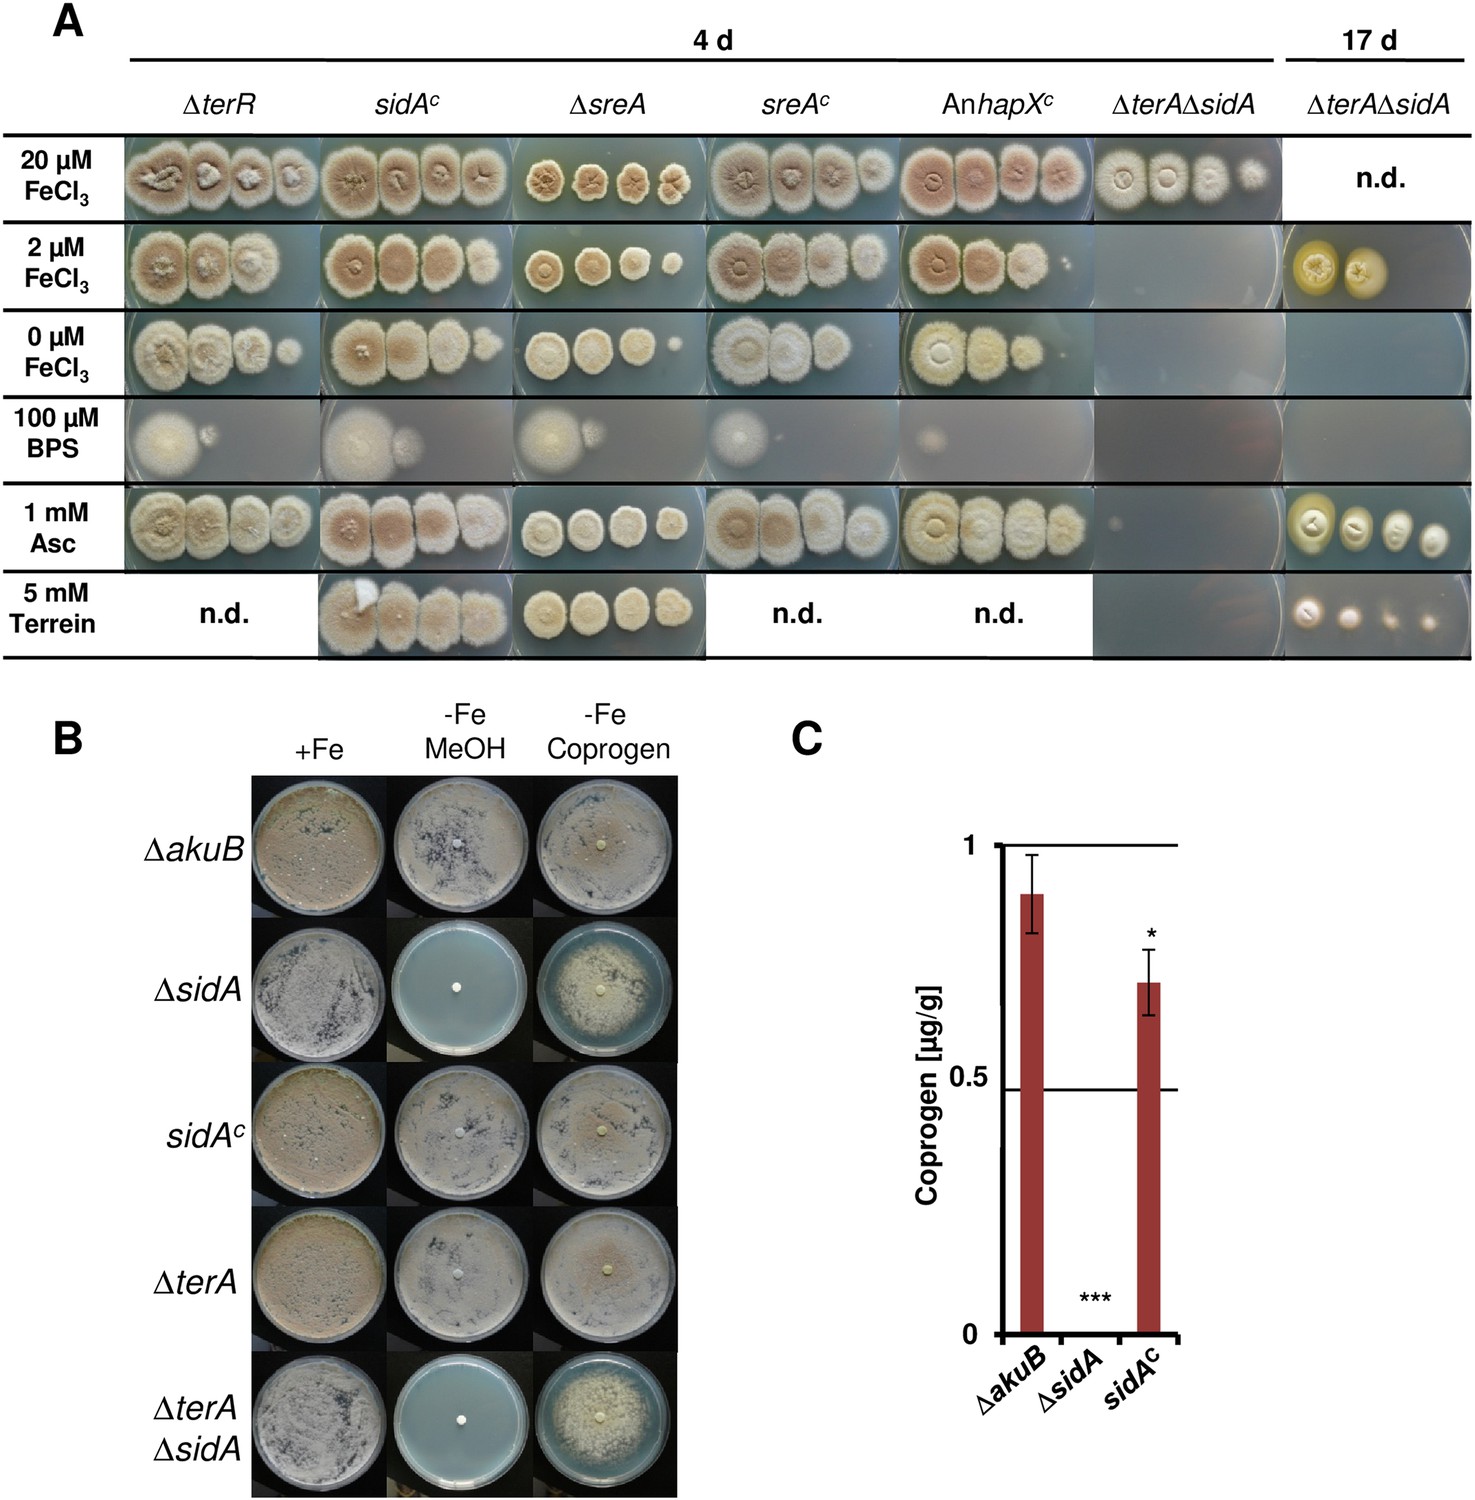
Dependence of colony formation of Aspergillus terreus mutants on iron availabilty, ascorbic acid, terrein, and coprogen.
(A) As basic media AMM(-N)G100Gln10(-Fe) agar plates were used that were supplemented either with different iron concentrations (100, 20, 2, or 0 µM FeCl3), the iron chelator bathophenanthroline disulfonate (BPS; 100 µM), ascorbic acid (Asc, 1 mM), or terrein (10 mM). Plates were incubated for 4 d at 37°C, except for the ΔterAΔsidA mutant that was further incubated for up to 17 d (B) Effect of purified coprogen on growth of A. terreus mutants and complemented strains under iron starvation. Conidia (1 × 10⁵) of A. terreus SBUG844ΔakuB, SBUG844ΔakuBΔsidA, SBUG844ΔakuBΔsidA/sidAC, SBUG844ΔakuBΔterA, or SBUG844ΔakuBΔterAΔsidA were plated on AMM-G100Gln10 plates supplemented with (+Fe) or without 20 µM FeCl3 (−Fe). To (−Fe) media filter disks soaked with either 20 µl methanol (MeOH, negative control) or 20 µl of 2.5 mg/ml coprogen (in methanol) were applied. Plates were incubated at 37°C for 72 hr until photographed. (C) Coprogen quantification from ΔakuB wild-type, ΔsidA mutant and complemented mutant sidAC. Strains were cultivated for 40 hr in AMM(-N)G100Gln50 supplemented with 200 µM FeCl3. The mycelium was washed and transferred to iron-free AMM(−N)G100Gln50 medium. Coprogen was quantified after 30 hr of incubation. Analyses were performed from biological triplicates and technical triplicates. Statistical significance was calculated in comparison to the parental ΔakuB strain by the Student's paired t-test with a two-tailed distribution: *p<0.05; ***p<0.001.
Figure 7—figure supplement 2
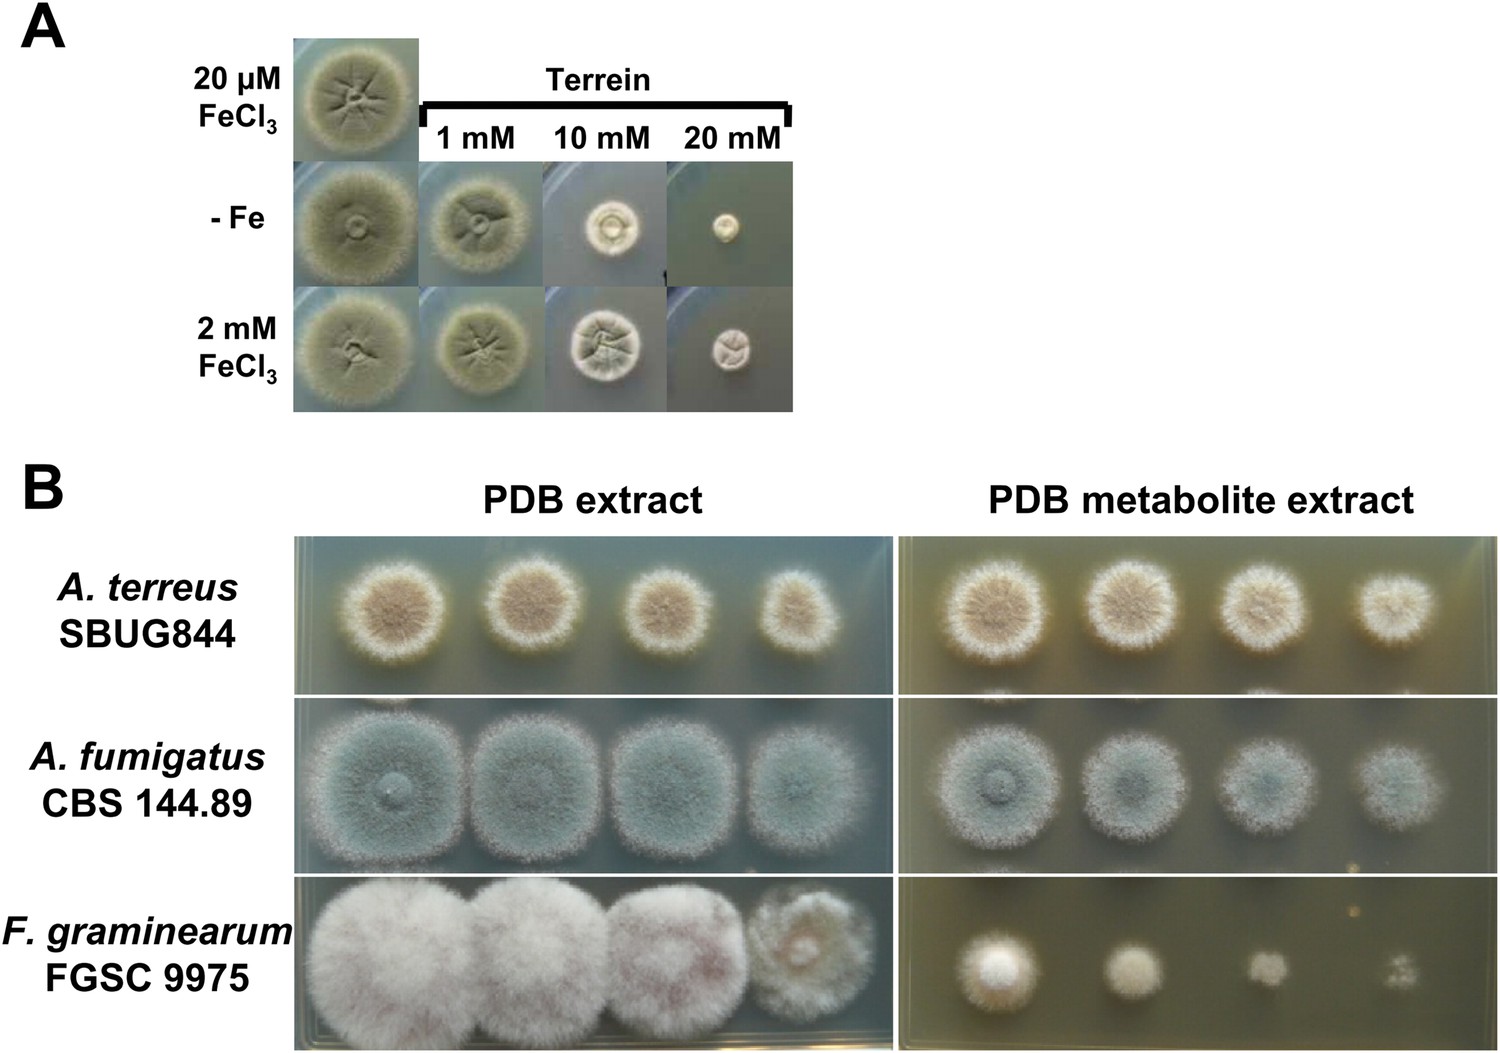
Antifungal activity of terrein and potato dextrose broth (PDB) medium from Aspergillus terreus wild-type cultivations.
(A) AMM-G100Gln10 containing no iron addition (−Fe) or 2 mM FeCl3 were supplemented with 0, 1, 10, or 20 mM terrein and inoculated with conidia of Aspergillus fumigatus wild-type ATCC46645. Plates were incubated for 84 hr at 37°C until photographed. Terrein inhibits growth of A. fumigatus independently of the available iron concentration. (B) Analysis of the effect of A. terreus inoculated PDB culture broth on growth of A. terreus, A. fumigatus, and Fusarium graminearum. The basal medium for A. terreus and A. fumigatus was AMM-G50 medium with nitrate as the nitrogen source, whereas the medium for F. graminearum was additionally supplemented with 0.2% potato broth (AMM-G50 + 0.2%PB). All plates were supplemented either with 150 µl of PDB ethyl acetate extract from a mock-inoculated culture (PDB extract) or inoculated with A. terreus SBUG844 and cultivated for 4 d at 30°C (PDB metabolite extract). Photographs were taken after 4 d of incubation at 30°C.
Figure 7—figure supplement 3
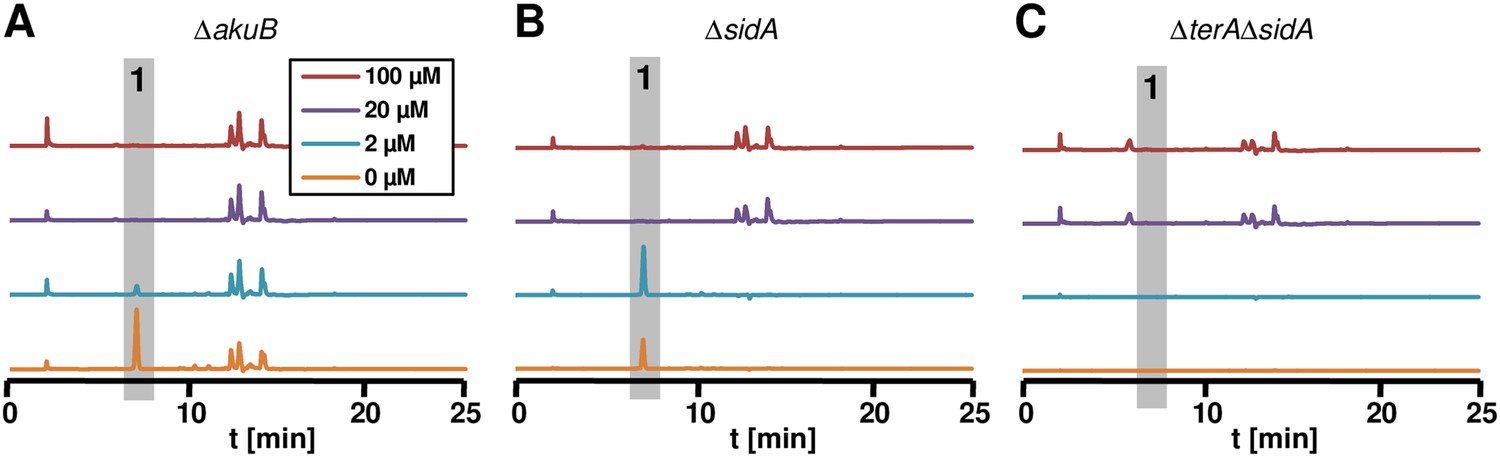
Terrein determination in siderophor deletion mutants.
High performance liquid chromatography profiles of agar plugs were recorded from plates shown in panel Figure 7C. Wild-type (A) and ΔsidA mutant (B) produced terrein (1) under iron-limited conditions, whereas no terrein was formed by the ΔterAΔsidA mutant (C).
Figure 8
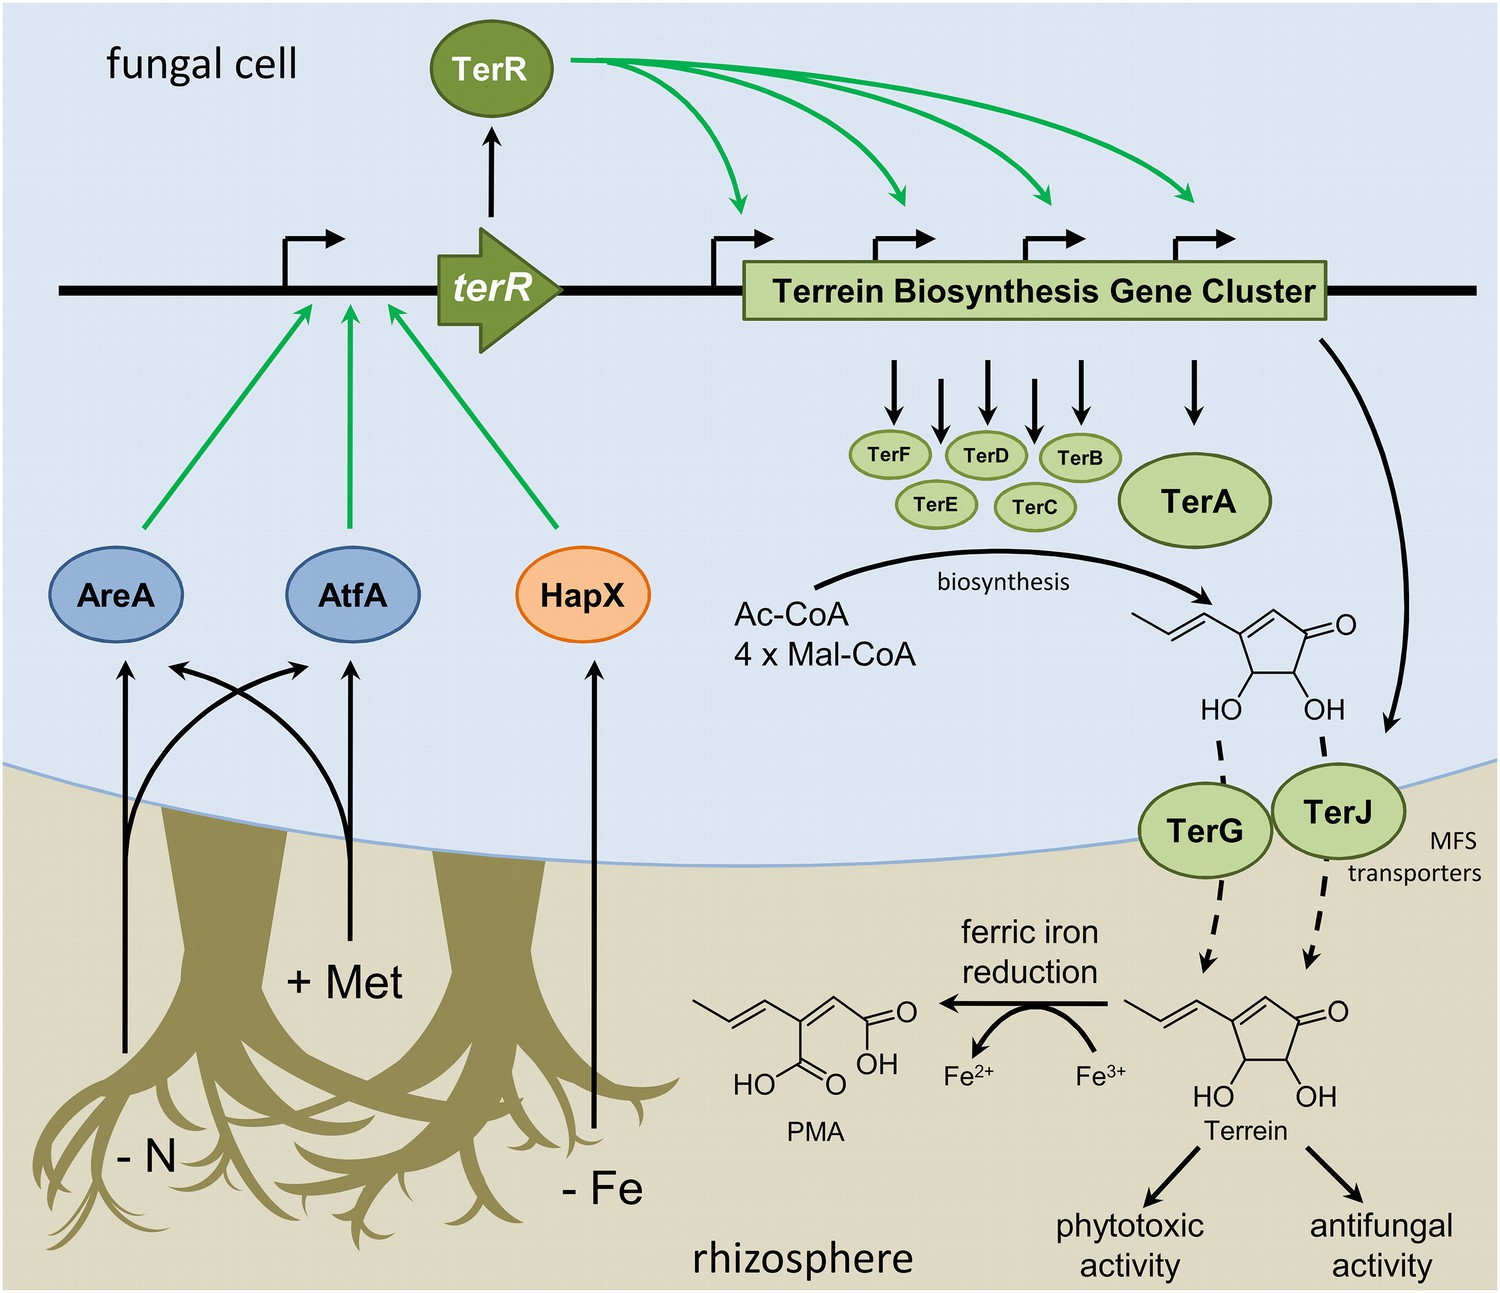
Scheme of the regulation of terrein biosynthesis gene cluster expression during interactions in the rhizosphere.
Plants secrete methionine (+Met) with root exudates into the soil. Additionally, competing microorganisms reduce the available pool of nitrogen sources (−N) and iron (−Fe). Signals from nitrogen limitation and methionine are sensed via AreA and AtfA, whereas iron limitation is sensed via HapX. All three transcription factors activate the promoter of the terrein biosynthesis gene cluster-specific transcription factor. TerR leads to transcription of the structural genes required for terrein biosynthesis and terrein is produced from acetyl- and malonyl-CoA units. The two-cluster specific major facilitator superfamily (MFS) transporters export terrein into the rhizosphere. Here terrein can counteract iron limitation by its ferric iron reducing activity, supports degradation of organic matter by its phytotoxic activities, and reduces growth of competitors by its antifungal activity.
Tables
Table 1
BLASTp analysis of homologous genes for iron uptake and regulation of iron homeostasis (adapted by [Haas, 2012])
| Aspergillus fumigatus function | Gene code‡ | Expression | Aspergillus terreus gene code | Identity/similarity | |
|---|---|---|---|---|---|
| Reductive iron assimilation (RIA ) | |||||
| FetC | Ferroxidase | AFUA_5G03790 | −Fe | ATEG_08032 | 79%/89% |
| FreB | Ferric reductase | AFUA_1G17270 | −Fe | ATEG_10322 | 53%/64% |
| FtrA | Iron permease | AFUA_5G03800 | −Fe | ATEG_08031 | 75%/84% |
| Siderophore biosynthesis (SB) | |||||
| EstA | TAFC esterase | AFUA_3G03660 | −Fe | ATEG_04072 | 44%/58% |
| NpgA/PptA | Phosphopantetheinyl transferase | AFUA_2G08590 | − | ATEG_09695 | 56%/65% |
| SidA | Ornithine monooxygenase | AFUA_2G07680 | −Fe | ATEG_06879 | 78%/85% |
| SidC | FC NRPS | AFUA_1G17200 | −Fe | ATEG_05073 | 60%/76% |
| SidD | FSC NRPS | AFUA_3G03420 | −Fe | ATEG_07488 | 43%/59% |
| SidF | Transacylase | AFUA_3G03400 | −Fe | ATEG_05075 | 52%/67% |
| SidG | Transacetylase | AFUA_3G03650 | −Fe | none | – |
| SidH | Mevalonyl hydratase | AFUA_3G03410 | −Fe | ATEG_01509 | 53%/67% |
| SidI | Mevalonyl ligase | AFUA_1G17190 | −Fe | ATEG_05074 | 86%/91% |
| SidL | Transacetylase | AFUA_1G04450 | – | ATEG_03770 | 64%/76% |
| Siderophore transporter (SIT) | |||||
| MirA | Enterobactin transporter | AN7800; - | −Fe | ATEG_04071 | 68%/77% |
| MirB | TAFC transporter | AN8540; -AFUA_3G03640 | −Fe | ATEG_02711 | 50%/68% |
| MirC* | AN7485; AFUA_2G05730 | −Fe | ATEG_06762 | 78%/87% | |
| MirD† | Trichotecene efflux pump | AFUA_3G03440 | – | ATEG_07487 | 40%/58% |
| SitA/SitT* | AN5378; AFUA_7G06060 | −Fe | ATEG_06329 | 62%/73% | |
| Regulatory proteins | |||||
| HapX | bZip-TF | AFUA_5G03920 | −Fe | ATEG_08014 | 77%/83% (hapX re-annotated) |
| SreA | GATA TF | AFUA_5G11260 | +Fe | ATEG_07741 | 67%/75% |
| SrbA† | HLH TF | AFUA_2G01260 | −Fe | ATEG_08156 | 72%/82% |
-
Genes selected for qPCR analyses are highlighted in bold.
-
*
Genes annotated according to (Schrettl et al., 2008).
-
†
Genes annotated according to (Blatzer et al., 2011).
-
‡
Gene codes ANxxxx refer to the A. nidulans genome.
Download links
A two-part list of links to download the article, or parts of the article, in various formats.
Downloads (link to download the article as PDF)
Open citations (links to open the citations from this article in various online reference manager services)
Cite this article (links to download the citations from this article in formats compatible with various reference manager tools)
Phytotoxin production in Aspergillus terreus is regulated by independent environmental signals
eLife 4:e07861.
https://doi.org/10.7554/eLife.07861


