STIL binding to Polo-box 3 of PLK4 regulates centriole duplication
- University of Basel, Switzerland
Figures
Figure 1 with 2 supplements
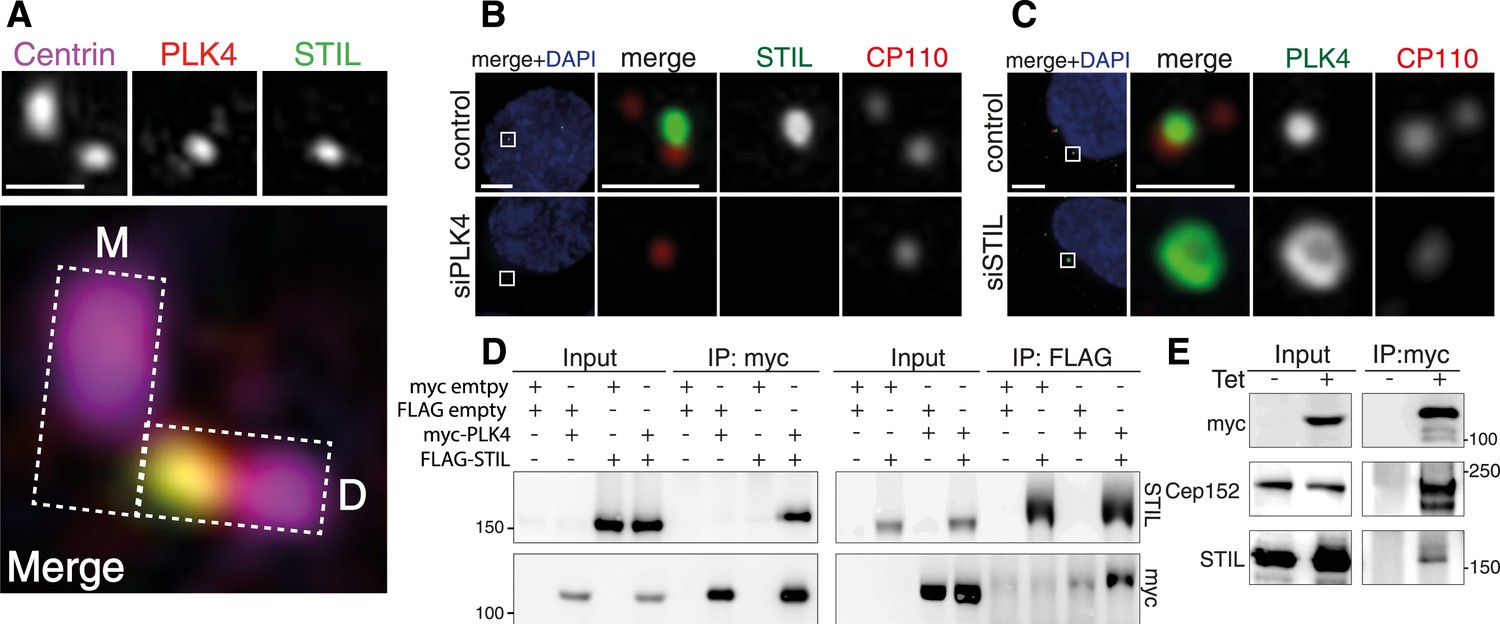
STIL is an interaction partner of PLK4.
(A) U2OS cells were fixed and stained with the indicated antibodies for 3D-SIM imaging. A representative 3D-SIM image is shown, demonstrating the co-localization of PLK4 and STIL at the daughter centriole. Top panel: centrin (purple), PLK4 (red), STIL (green). Scale bar: 0.5 µm. Bottom panel: magnified view of the centrosome (overlay image). The rectangles illustrate the orientation of the mother (M) and daughter (D) centrioles. (B) Immunostaining of STIL localization in U2OS cells depleted of endogenous PLK4. Cells were transfected for 72 hr with control or PLK4 siRNA oligonucleotides and stained with the indicated antibodies. DAPI is shown in blue. Scale bars: 1 µm. (C) Immunostaining of PLK4 localization in U2OS cells depleted of endogenous STIL (control and siSTIL). ‘Material and methods’ as in (B). In (B) and (C), only prophase cells harboring 1–2 centrioles were analyzed (indicative of successful PLK4 or STIL depletion, respectively). (D) Western blots showing the interaction of myc-tagged PLK4 and FLAG-tagged STIL in HEK293T cells. Cells were transfected with the indicated plasmids for 36 hr, followed by lysis and immunoprecipitation using anti-myc or anti-FLAG antibodies. Antibodies used for Western blot detection are indicated. (E) Western blot showing the interaction of myc-PLK4 with endogenous STIL. Myc-PLK4 expression was induced by addition of tetracycline to U2OS T-REx cells stably harboring the myc-PLK4 transgene (± Tet, 24 hr). Cells were processed for anti-myc co-immunoprecipitations and Western blot analysis using the indicated antibodies.
Figure 1—figure supplement 1
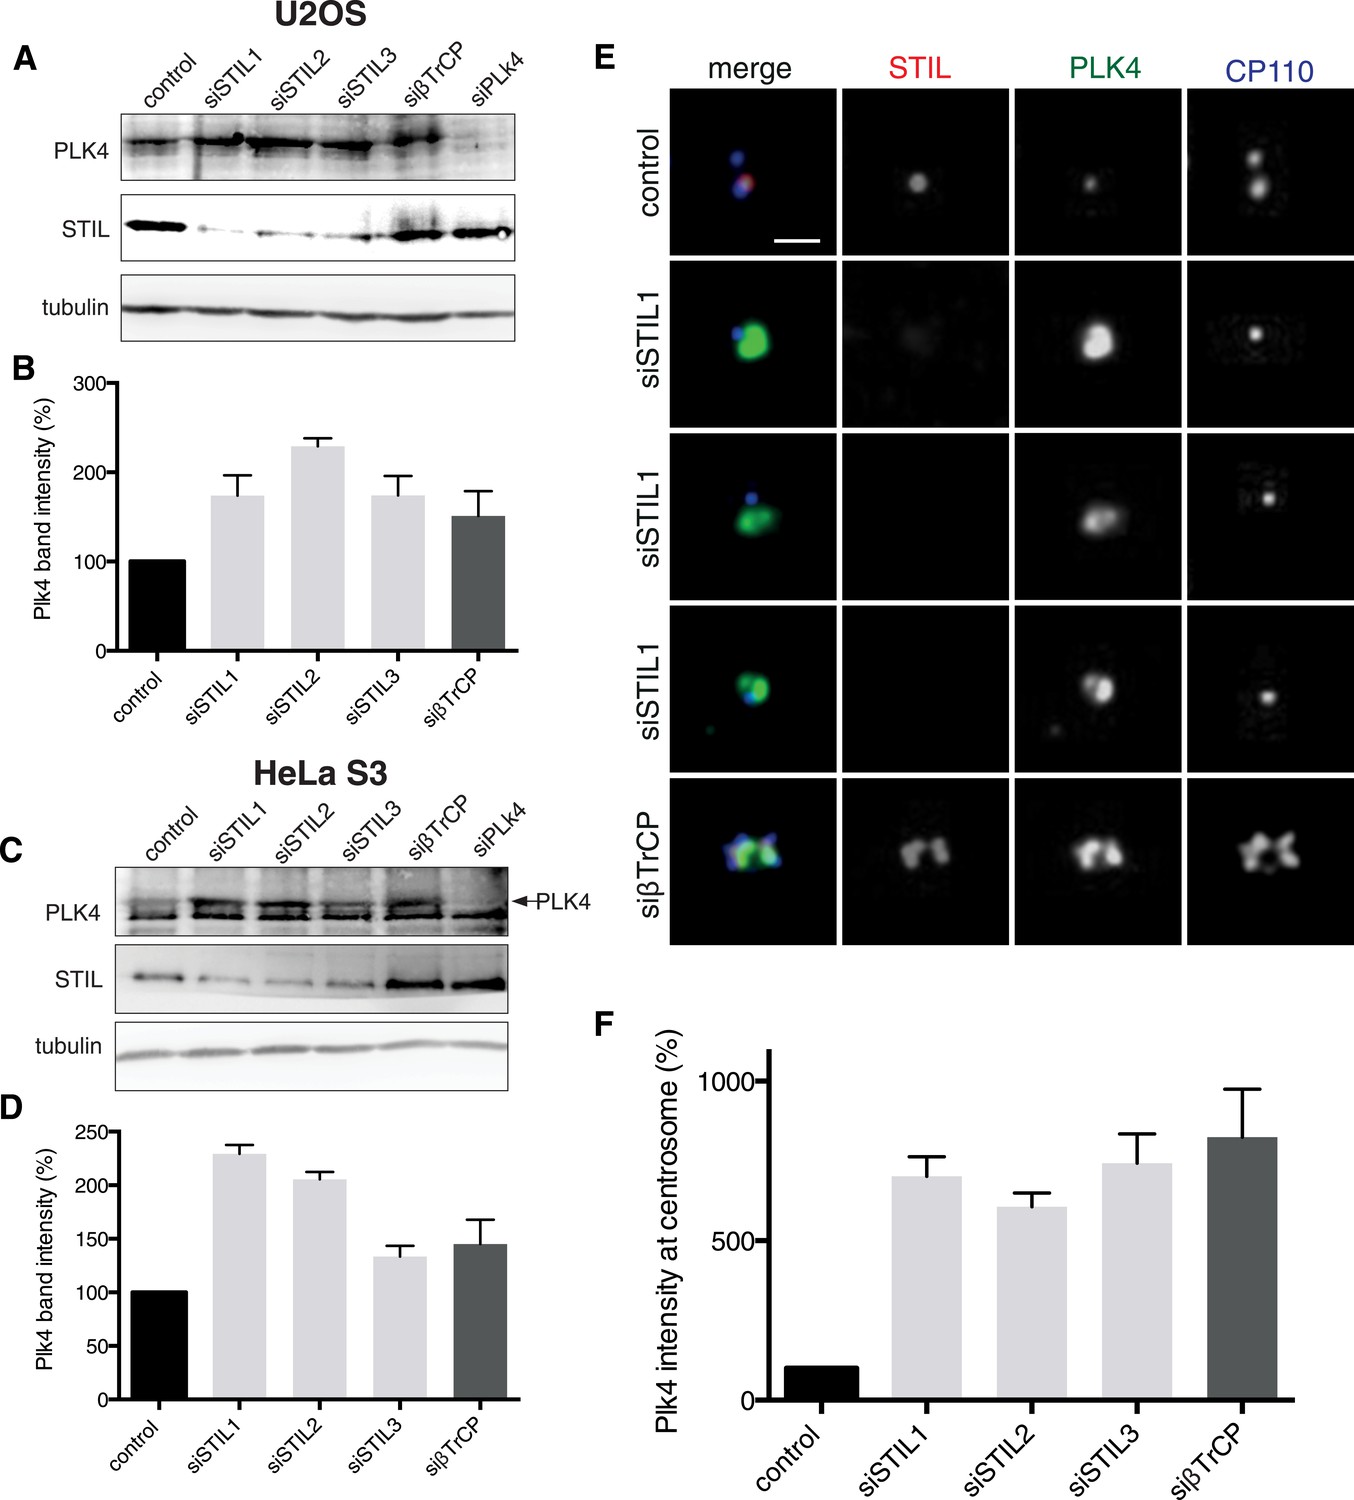
Plk4 levels are elevated in STIL depleted cells.
(A) U2OS cells were transfected with control (siGL2), three different STIL (siSTIL1-3), βTrCP and Plk4 siRNA oligonucleotides for 72 hr, lysed and subjected to Western blot analysis using the indicated antibodies. (B) Graph representing Plk4 band intensities measured in Western blots from two independent experiments as described in (A). Error bars represent SEM. (C) HeLa S3 cells were transfected with control (siGL2), three different STIL (siSTIL1-3), βTrCP and Plk4 siRNA oligonucleotides for 72 hr, lysed and subjected to Western blot analysis using the indicated antibodies. (D) Graph representing Plk4 band intensities measured in Western blots from two independent experiments as described in (C). Error bars represent SEM. (E) U2OS cells were transfected with control (siGL2), three different STIL (siSTIL1-3), βTrCP and Plk4 siRNA oligonucleotides for 72 hr, fixed, stained with indicated antibodies and analysed in immunofluorescence microscopy. Representative images are shown. Scale bar: 1 µm. (F) Graph representing Plk4 levels measured in the centrosomal region of images as described in (E). 15 cells were measured for each condition in three independent experiments, error bars denote SEM.
Figure 1—figure supplement 2
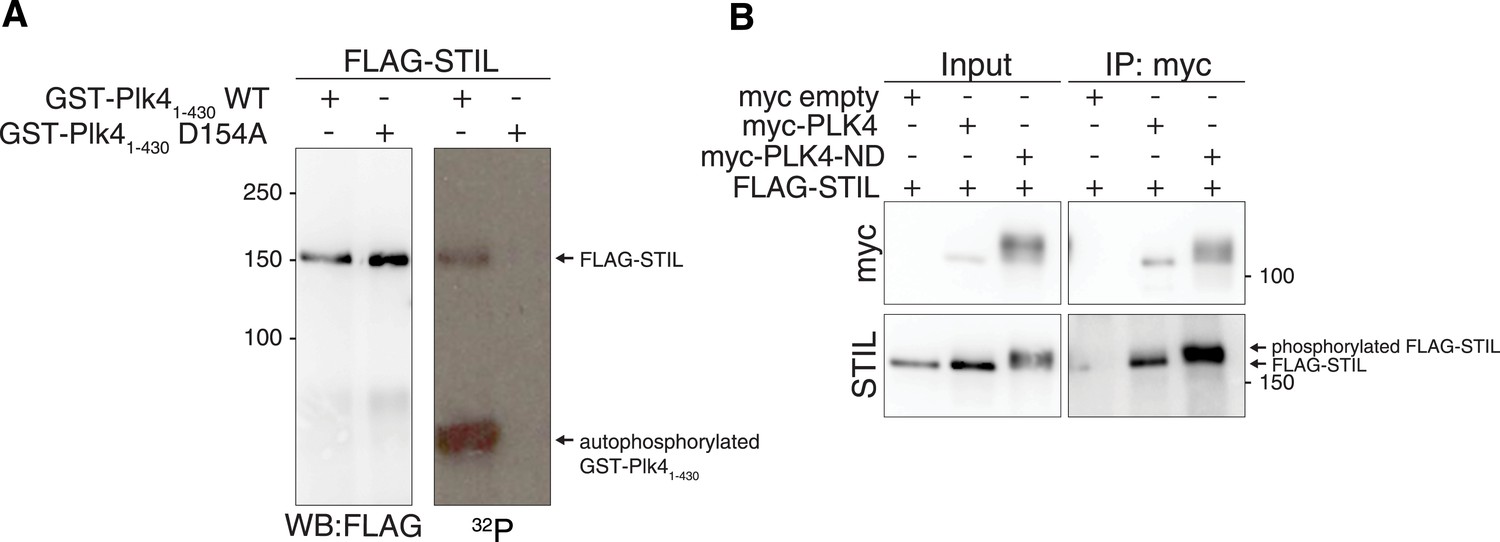
STIL is a phosphorylation target of PLK4 and PLK4-ND.
(A) FLAG-STIL is phosphorylated by GST-PLK41–430 in vitro. HEK293T cells were transfected with FLAG-STIL for 48 hr. After cell lysis, FLAG-STIL was purified using anti-FLAG antibodies and subjected to an in vitro kinase assay with recombinant GST-PLK41–430 or, as a control, with a kinase-inactive version of GST-PLK41–430 (D154A). On the left, the Western blot probed with anti-FLAG antibody shows the amounts of FLAG-STIL used for the reactions. The autoradiograph (right side) shows the phosphorylation of FLAG-STIL by GST-PLK41–430 (upper band) as well as the autophosphorylation of GST-PLK41–430 (lower band). (B) HEK293T cells were transfected with the indicated plasmids and cell extracts were subjected to anti-myc co-immunoprecipitations followed by Western blot analysis. PLK4-ND—the non-degradable PLK4 mutant used throughout this study (S285A and T289A [Guderian et al., 2010])—exhibits enhanced stabilization and thus facilitates visualization of STIL binding (higher amounts of FLAG-STIL were detected in the precipitate of myc-PLK4-ND compared to wild-type myc-PLK4). Note the upshift of the STIL band upon co-expression with PLK4-ND, indicating that FLAG-STIL is phosphorylated by myc-PLK4-ND.
Figure 2

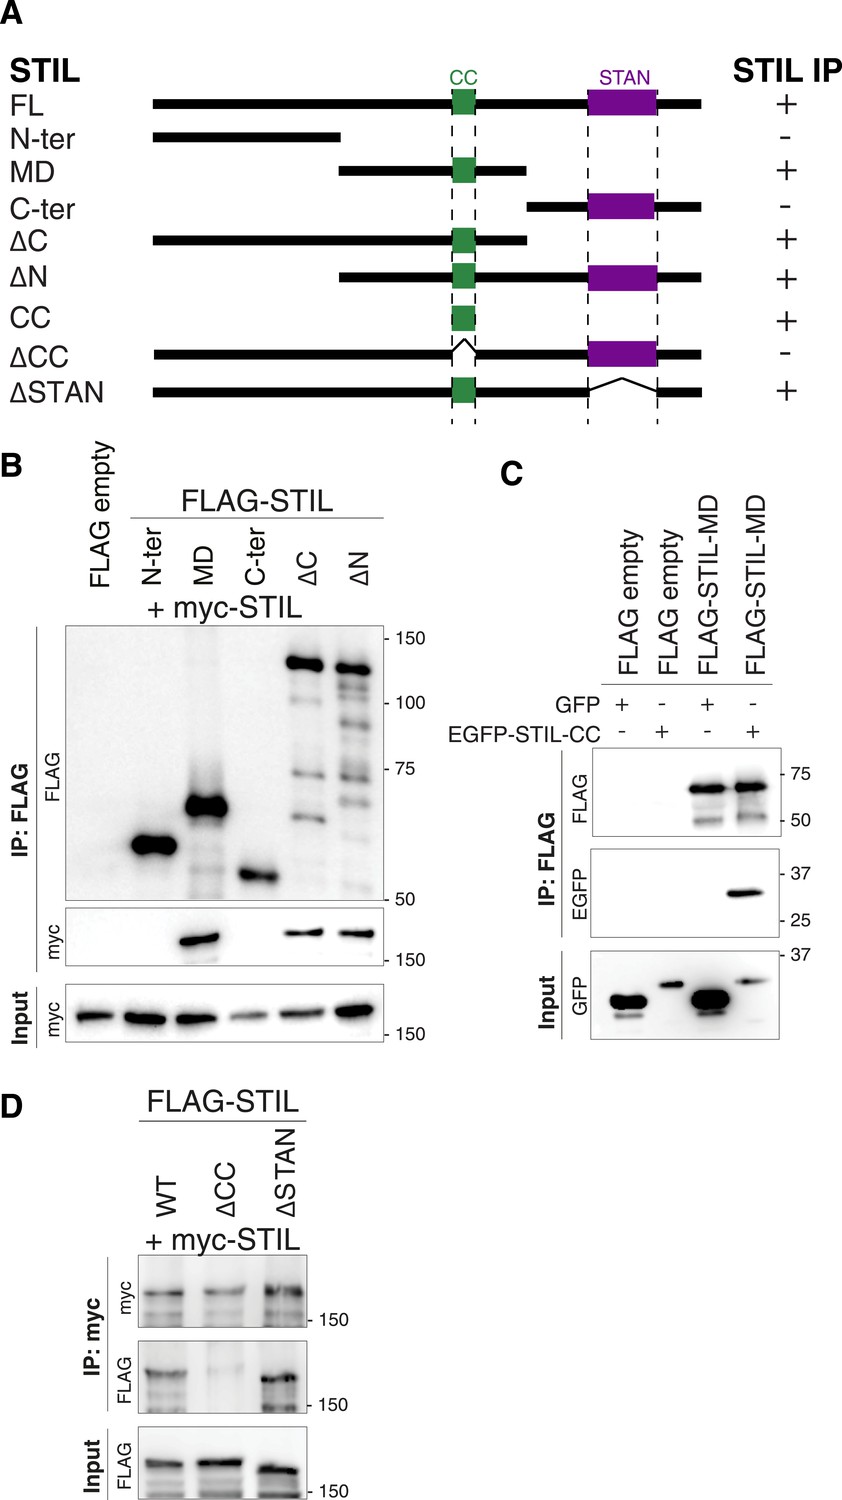
The STIL-CC motif binds to PLK4.
(A) Schematic illustration of STIL constructs used to map the PLK4-binding region in STIL. On the right, the relative strengths of the interactions as determined by co-immunoprecipitation experiments are indicated (+, strong; ±, weak; -, not detected). (B–E) Western blot analysis of co-immunoprecipitation experiments from HEK293T cells co-expressing STIL fragments or STIL-ΔCC/ΔSTAN mutants and myc-PLK4-ND. Cells were transfected for 36 hr with the indicated plasmids and whole cell lysates were used for co-immunoprecipitation experiments with anti-myc, anti-FLAG or anti-EGFP antibodies. Antibodies for Western blot detection are indicated.
Figure 3 with 1 supplement
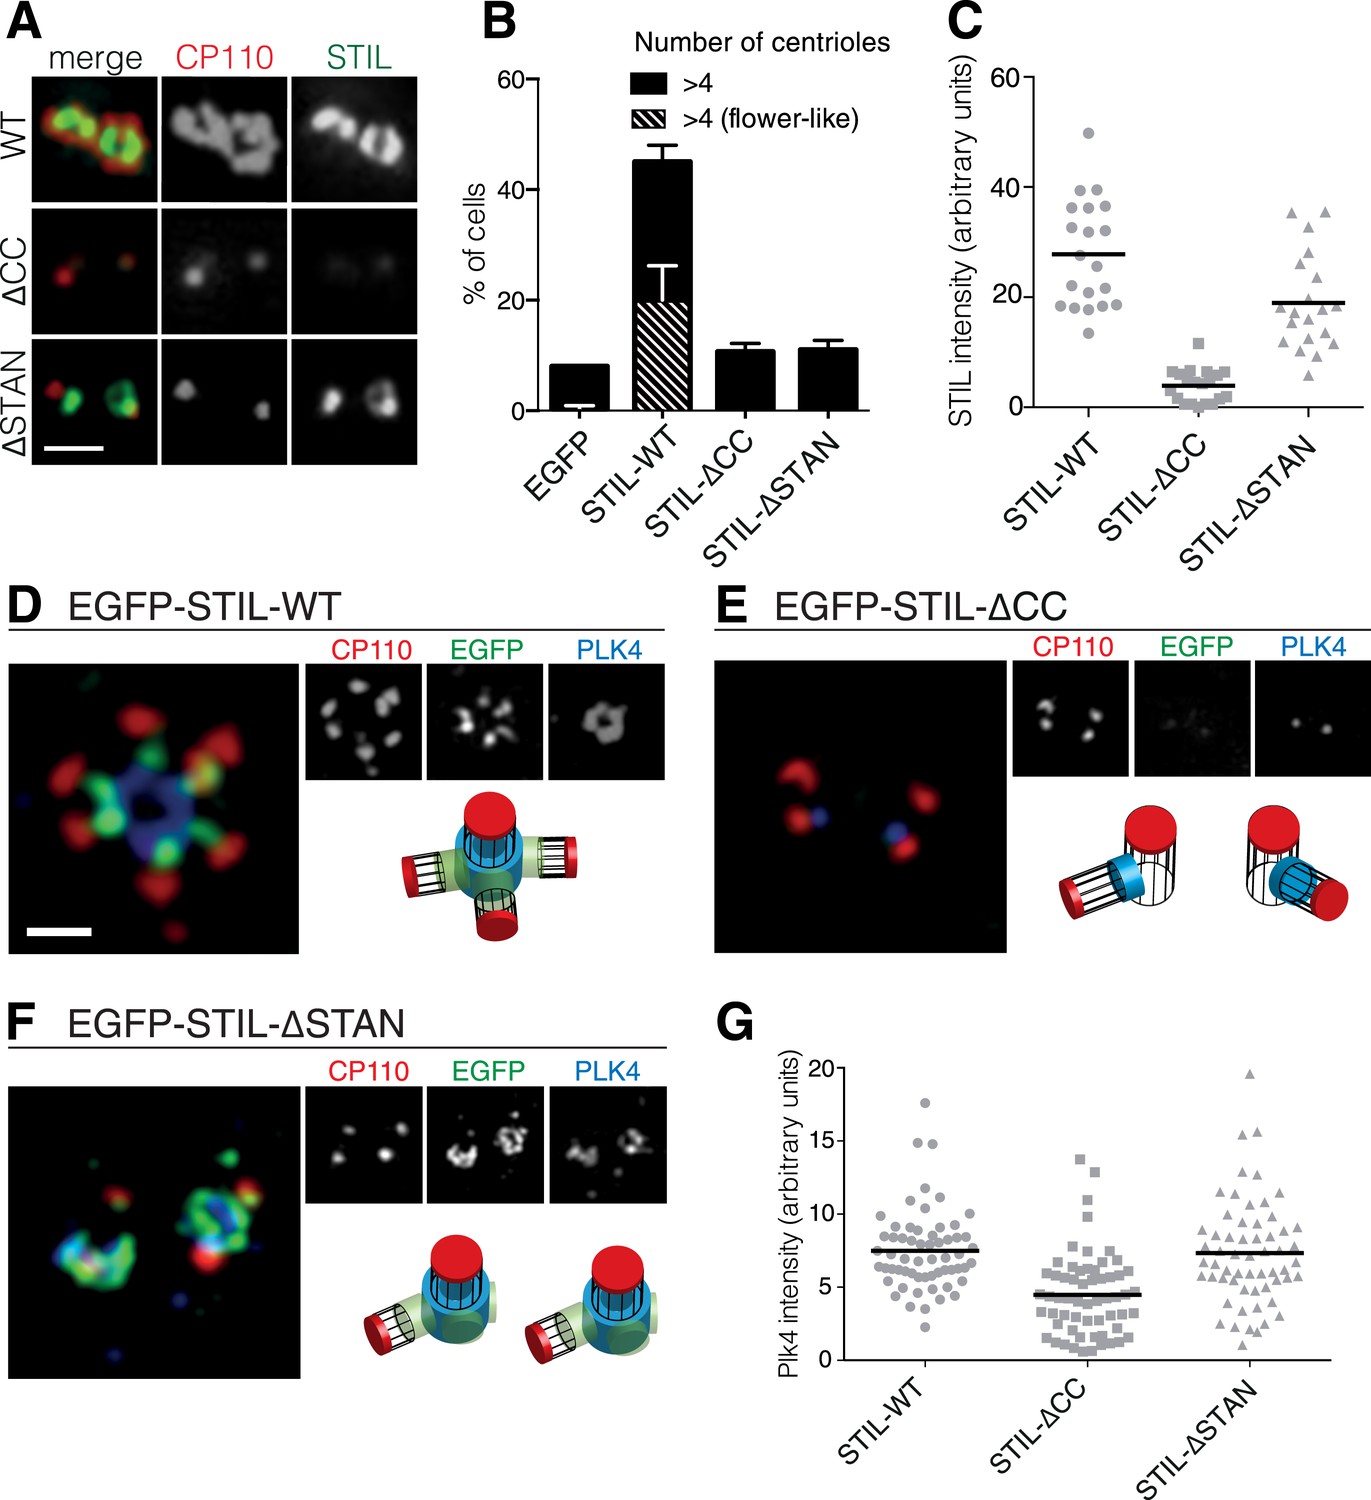
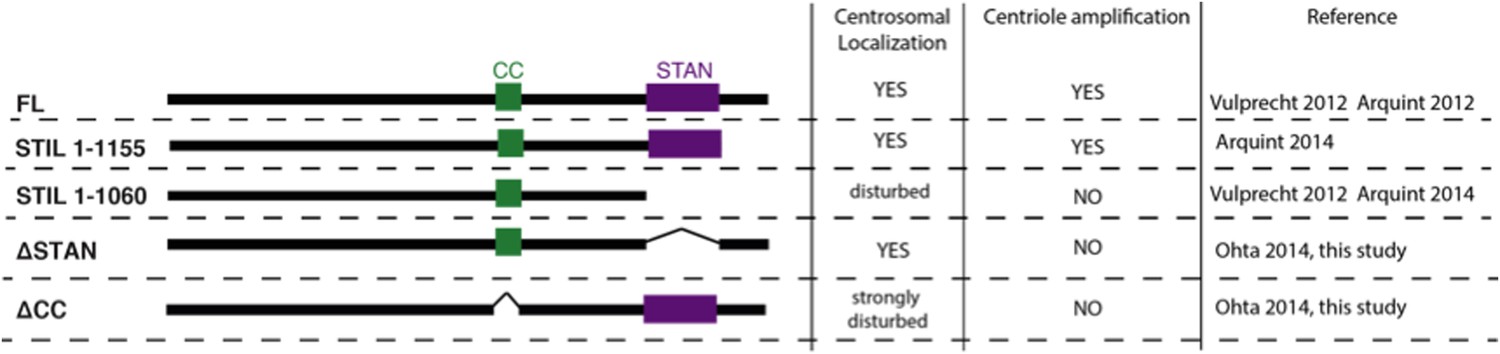
The STIL-CC motif is essential for centriole duplication.
(A) Immunofluorescence microscopy of U2OS cells transfected with STIL-WT, STIL-ΔCC or STIL-ΔSTAN for 48 hr. Cells were fixed and stained with the indicated antibodies. Scale bar denotes 1 µm. (B) Quantification of centriole numbers in U2OS cells after overexpression of the indicated STIL plasmids (3 experiments, a total of 300 cells were analyzed for each condition). Error bars denote SD. (C) Scatter plot to illustrate STIL signal intensity at centrosomes, after overexpression of STIL-WT, STIL-ΔCC or STIL-ΔSTAN (20 centrosomes were analyzed for each condition). (D–F) 3D-SIM images of U2OS cells that have been transfected with EGFP-tagged STIL-WT, STIL-ΔCC and STIL-ΔSTAN and stained with the indicated antibodies. (G) Scatter plot to illustrate measured PLK4 signal intensities at centrosomes, after overexpression of STIL-WT/ΔCC or ΔSTAN (60 centrosomes were analyzed for each condition). Scale bar denotes 1 µm.
Figure 3—figure supplement 1
The STIL-CC domain is essential for STIL oligomerization.
(A) Schematic illustration of STIL constructs used for the co-immunoprecipitation experiments shown in (B–D). On the right, the relative strengths of the interactions are indicated (+, strong; ±, weak; -, not detected). (B–D) Western blot analysis of co-immunoprecipitation experiments to map the region required for STIL self-association. HEK293T cells were transfected with the indicated plasmids to co-express the corresponding STIL constructs for 24–36 hr. Subsequently, cells were lysed and co-immunoprecipitations were performed with anti-myc or anti-FLAG antibodies.
Figure 4
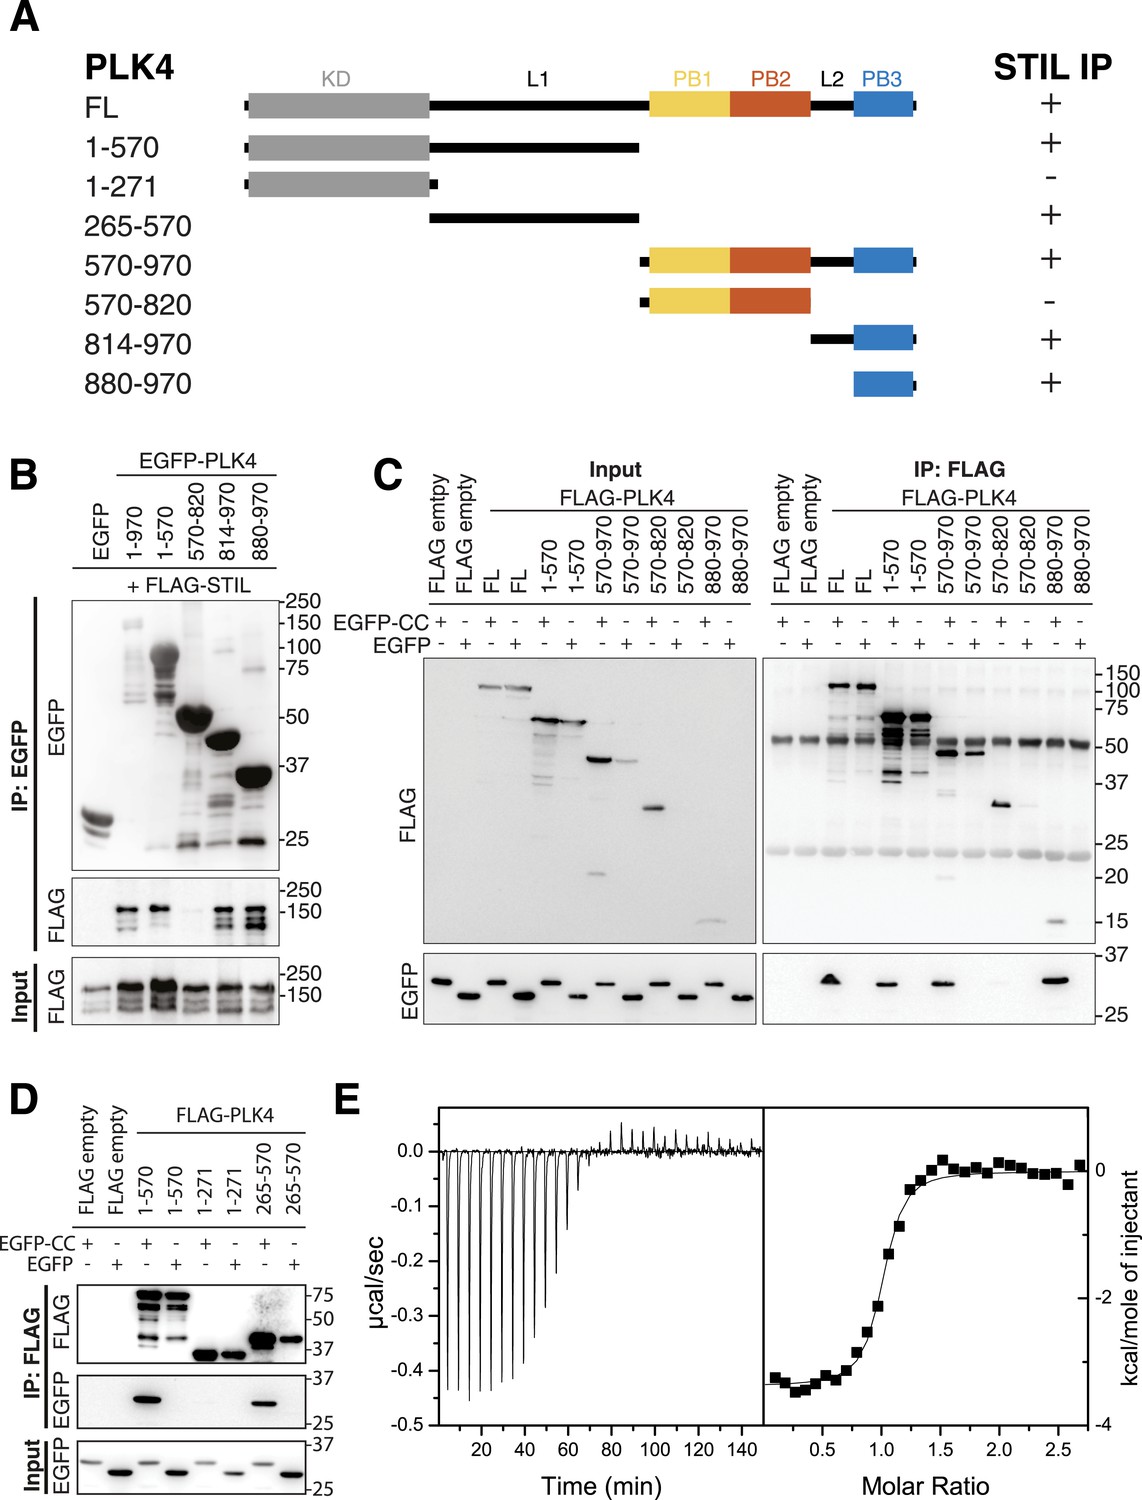
PB3 of PLK4 directly interacts with STIL-CC.
(A) Schematic illustration of PLK4 fragments used to map the STIL-CC binding site. Kinase domain (KD), grey; PB1, yellow; PB2, orange; PB3, blue. The relative strengths of the interactions are indicated (+, strong; -, not detected). (B–D) Western blots of co-immunoprecipitation experiments using HEK293T cells co-transfected with plasmids expressing PLK4 fragments and FLAG-STIL (B) or EGFP-STIL-CC (C and D). Antibodies used for Western blot detection are indicated. (E) Isothermal titration calorimetry of STIL-CC into a solution of PLK4-PB3. Left panel: Direct measurement of the Gibbs energy associated with STIL-CC binding to PLK4-PB3. Right panel: integrated and fitted raw data using a one-site binding model.
Figure 5 with 4 supplements
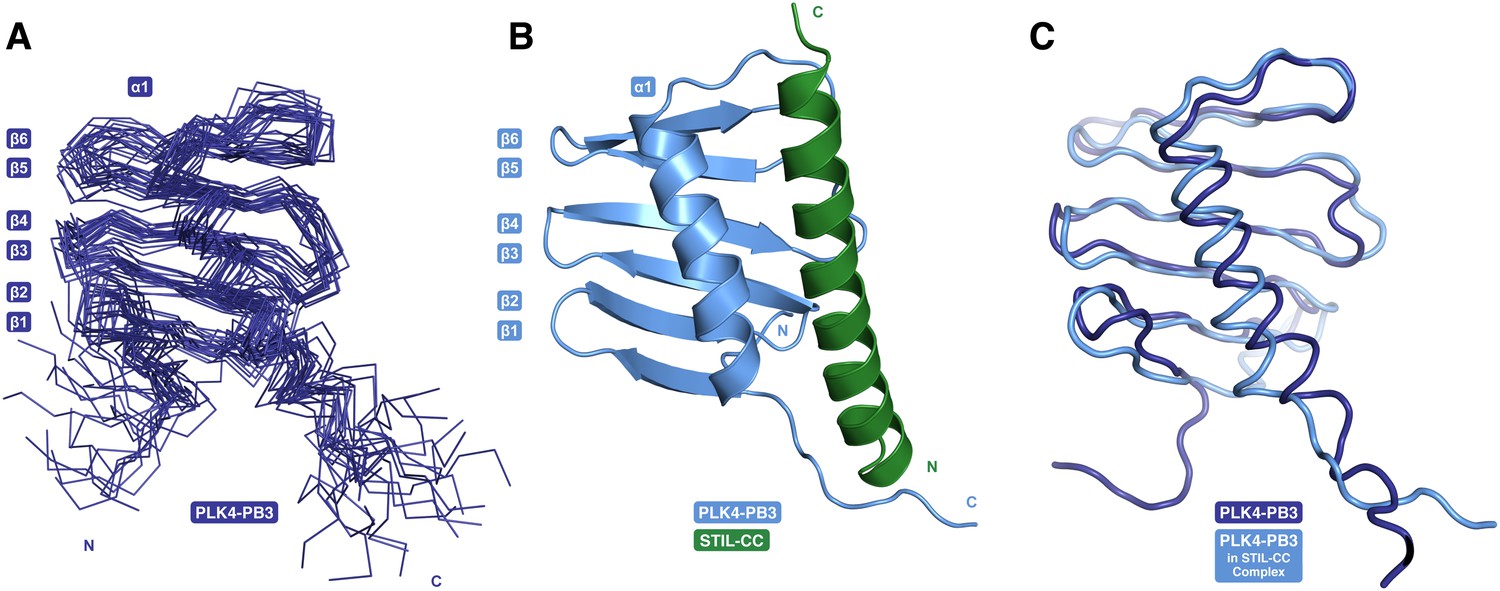
PB3 adopts a canonical Polo-box fold.
(A) Ensemble of 20 NMR conformers with the lowest target function of free PLK4-PB3 (dark blue) (B) the X-ray structure of the PLK4-PB3/STIL-CC complex (light blue/green) and (C) comparison of the free PLK4-PB3 (dark blue) to the PLK4-PB3 (light blue) in complex with STIL-CC by structural superposition (STIL-CC not shown for clarity).
Figure 5—figure supplement 1
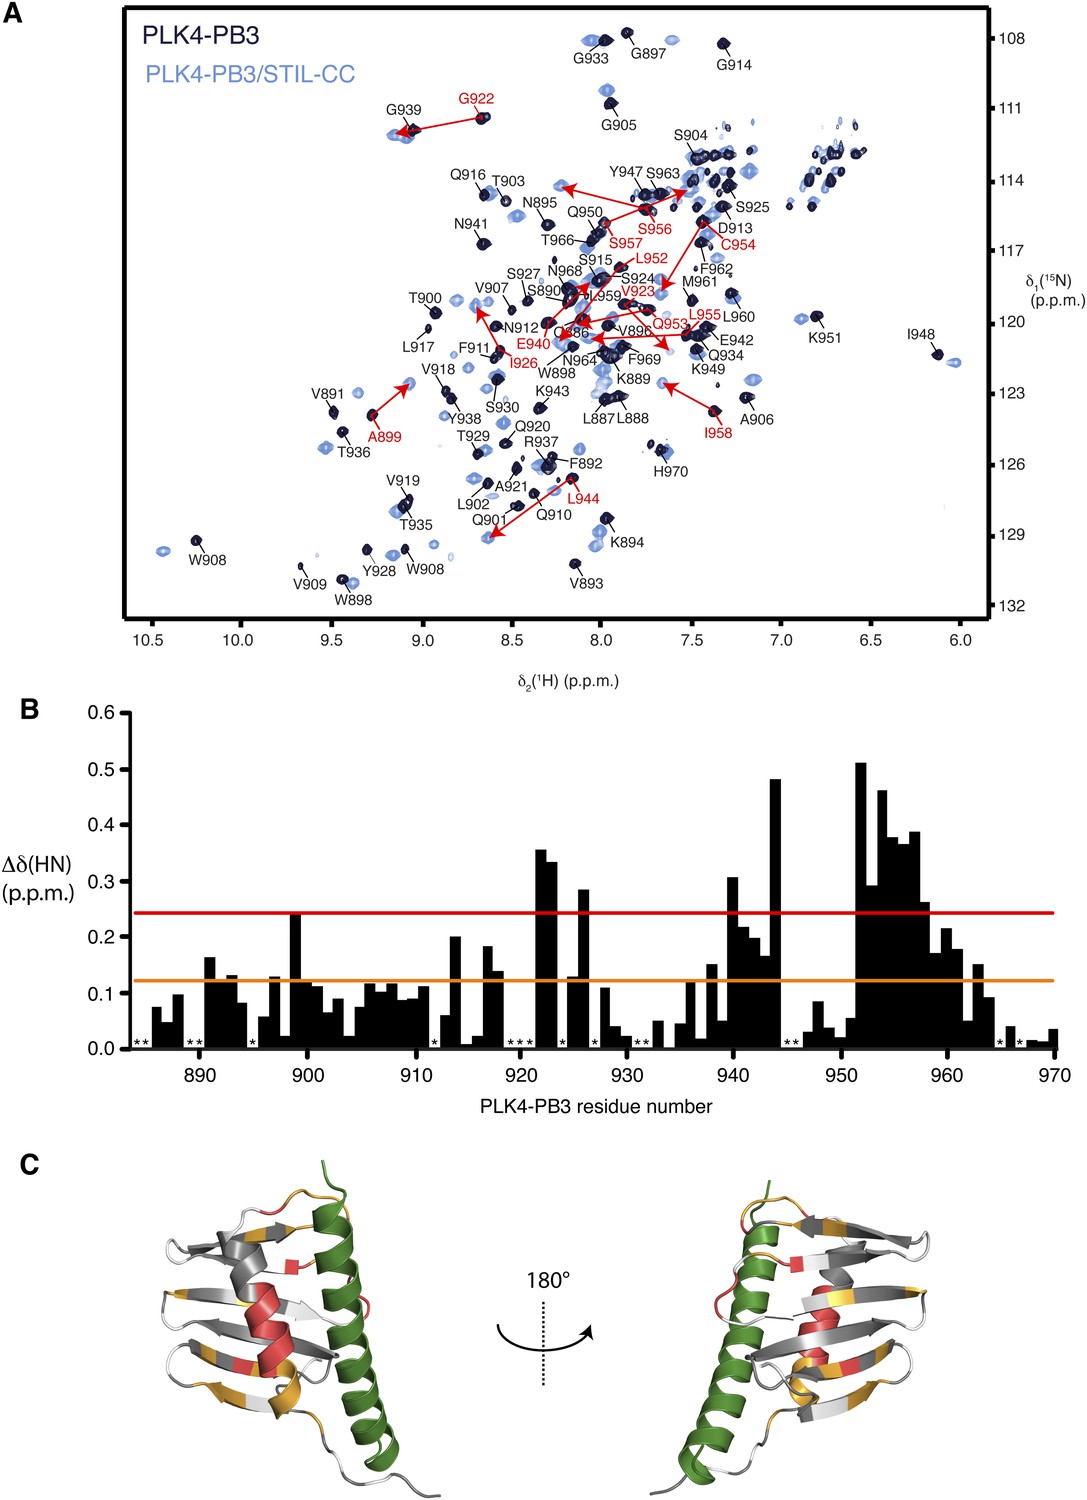
Binding of STIL-CC to PLK4-PB3.
(A) Overlay of 2D [15N,1H]-TROSY spectra of 0.8 mM [U-15N]-PLK4-PB3 (dark blue) and 0.6 mM [U-15N]-PLK4-PB3 in complex with unlabeled STIL-CC (light blue) recorded at 20°C. The sequence-specific resonance assignments for PLK4-PB3 are indicated. The assignments for PLK4-PB3 in complex with STIL-CC are not shown for clarity. Corresponding backbone amide resonances with chemical shift difference larger than two s.d. (see below) between apo and holo PLK4-PB3 are connected by red arrows. (B) Chemical shift perturbation of PLK4-PB3 amide moieties upon STIL–CC binding. The magnitude of one s.d. (0.12 p.p.m.) is indicated by an orange line and the magnitude of two s.d. (0.24 p.p.m.) is indicated by a red line. Asterisks indicate residues that are not assigned in both forms. (C) Chemical shift perturbation of PLK4-PB3 upon STIL binding, as mapped on the crystal structure of PLK4-PB3/STIL-CC in ribbon representation. Residues with (Δδ(HN) < 0.12 p.p.m.), (0.12 p.p.m. < Δδ(HN) < 0.24 p.p.m.), and (0.24 p.p.m. < Δδ(HN)) are shown in grey, orange and red, respectively. Unassigned residues are shaded in light grey. The STIL helix is shown green.
Figure 5—figure supplement 2

Backbone dynamics of PLK4-PB3.
Measurements of the 15N{1H}-NOE, which is sensitive to local dynamics on the ps–ns time scale. Backbone dynamics of PLK4-PB3 (dark blue, top) and PLK4-PB3 as part of the PLK4-PB3/STIL–CC complex (light blue, center) and their difference (black, bottom). Asterisks indicate residues that are unassigned in at least one of two forms.
Figure 5—figure supplement 3
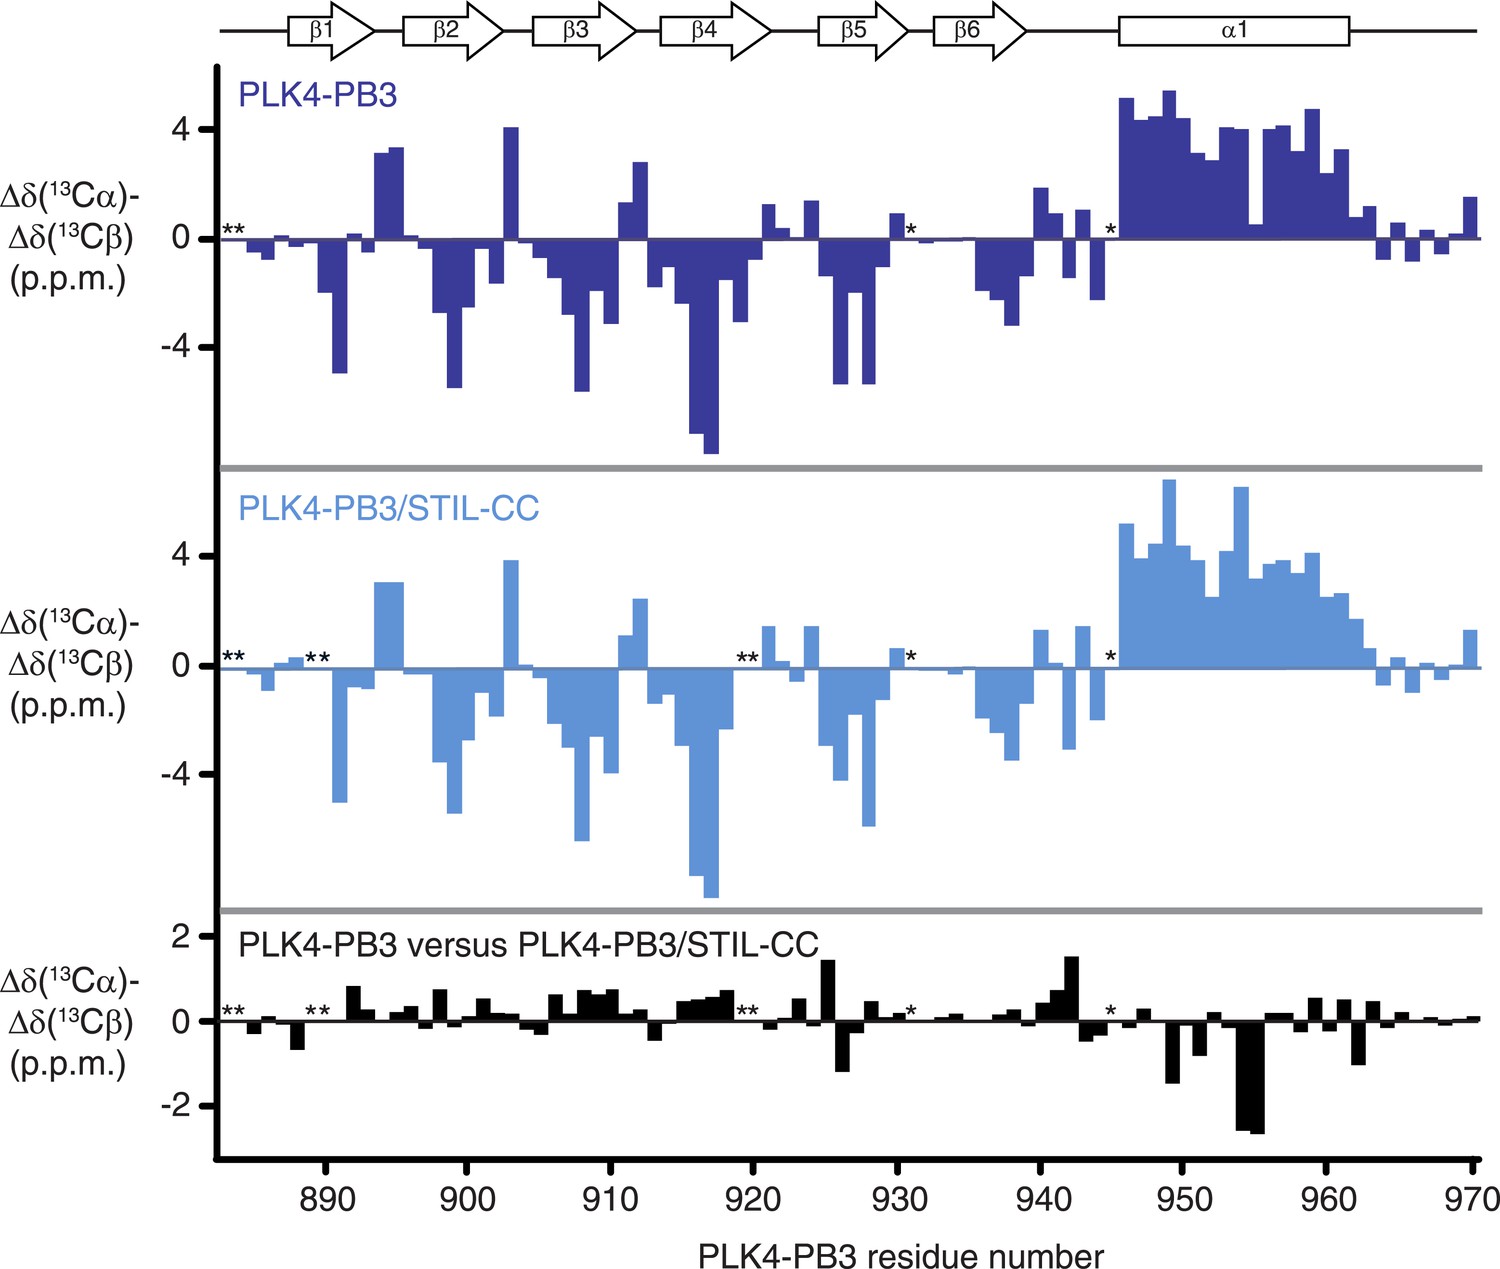
Secondary structure elements of PLK4-PB3 in solution.
Secondary backbone 13C-chemical shifts of PLK4-PB3 (dark blue) and PLK4-PB3 as part of the PLK4-PB3/STIL–CC complex (light blue) and their differences (black), plotted against the amino acid residue number of PLK4-PB3. Asterisks indicate unassigned residues. Secondary structural elements as identified in the PLK4-PB3/STIL-CC crystal structure are shown at the top. STIL–CC binding increases the helicity at residues 954 and 955 in helix α1, as indicated by an increase of secondary 13C chemical shifts.
Figure 5—figure supplement 4
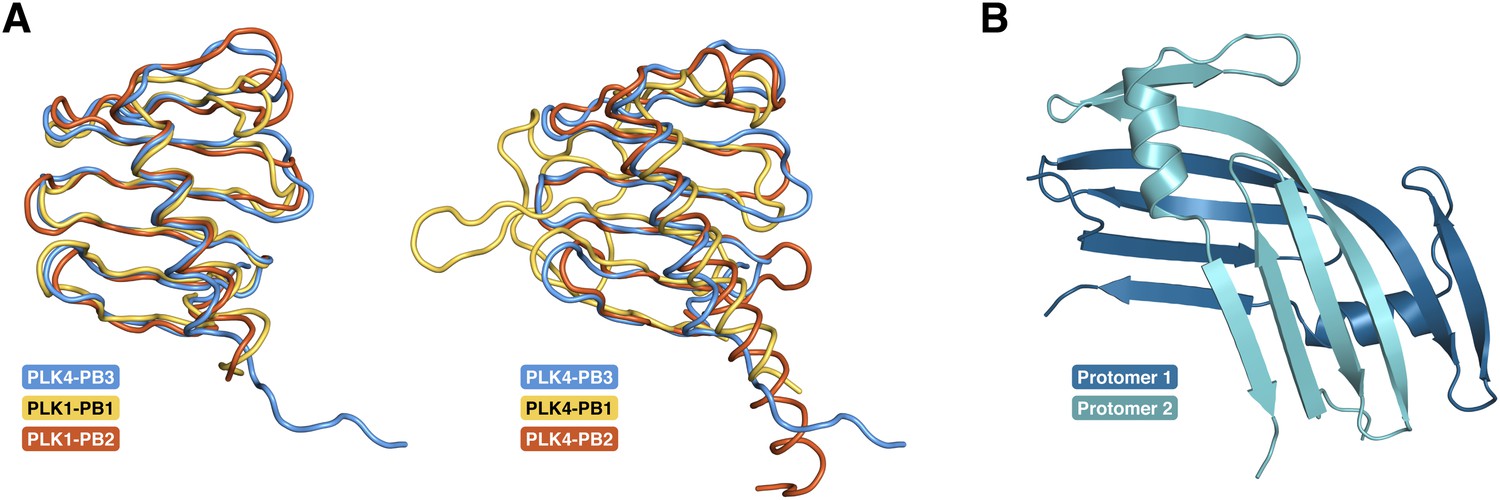
PB3 adopts a canonical Polo-box fold.
(A) Comparison of the fold of PLK4-PB3 (lightblue) to the folds of PB1 (1.7 Å rmsd, 72 Cα) and PB2 (1.3 Å rmsd, 79 Cα) of PLK1 (PDB accession code: 1Q4O, left) (Cheng et al., 2003) and of PB1 (2.5 Å rmsd, 66 Cα) and PB2 (1.4 Å rmsd, 68 Cα) of PLK4 (PDB accession code: 4N9J, right)(Park et al., 2014) by structural superposition (Krissinel and Henrick, 2004). For the alignments the crystal structure of PLK4-PB3 was used. (B) Crystal structure of the domain-swapped dimer of the PLK4-PB3 murine ortholog SAK in cartoon representation (Leung et al., 2002).
Figure 6 with 2 supplements

Analysis of structure-based STIL-CC mutants.
(A) Close-up view of the STIL-CC/PLK4-PB3 binding interface. Key contributing residues to the hydrophobic interaction between the PLK4-PB3 (light blue) α-helix and the STIL-CC (green) α-helix are indicated. (B) Multiple sequence alignment (ClustalW) of the STIL-CC domain. Residues that directly participate in the PLK4-PB3 interaction are marked on top. Hydropathy index values (according to Kyte-Doolittle) for each amino acid are depicted in red. CC probability values (according to MARCOIL prediction) for each amino acid are depicted in black below the alignment. The position of each amino acid in the predicted heptad repeat (labelled a-g, whereas a and d are hydrophobic positions) is shown in green on top of the alignment. (C, D) Control, WT or mutant versions (M1-7) of HA-S-EGFP-tagged STIL-CC were co-transfected with either PLK4-L2-PB3 (814–970) (C) or N-terminal PLK4 (1–570) (D) in HEK293T cells. EGFP-immunoprecipitations were performed and analysed by Western blotting with the indicated antibodies. (E, F) To assess centriole amplification, EGFP-tagged WT and mutants of full-length STIL (M1-7) were overexpressed in U2OS cells (48 hr). EGFP was used as control. (E) Quantification of transfected cells with more than 4 centrioles (n = 3, 50 cells each). (F) Immunofluorescence images of U2OS cells after overexpression of EGFP-tagged STIL-WT or mutants M1-7 (48 hr). Centrioles were visualized by staining with antibodies against CP110 and γ-Tubulin (gTub) was used as marker for centrosomes. Scale bar: 1 µm.
Figure 6—figure supplement 1
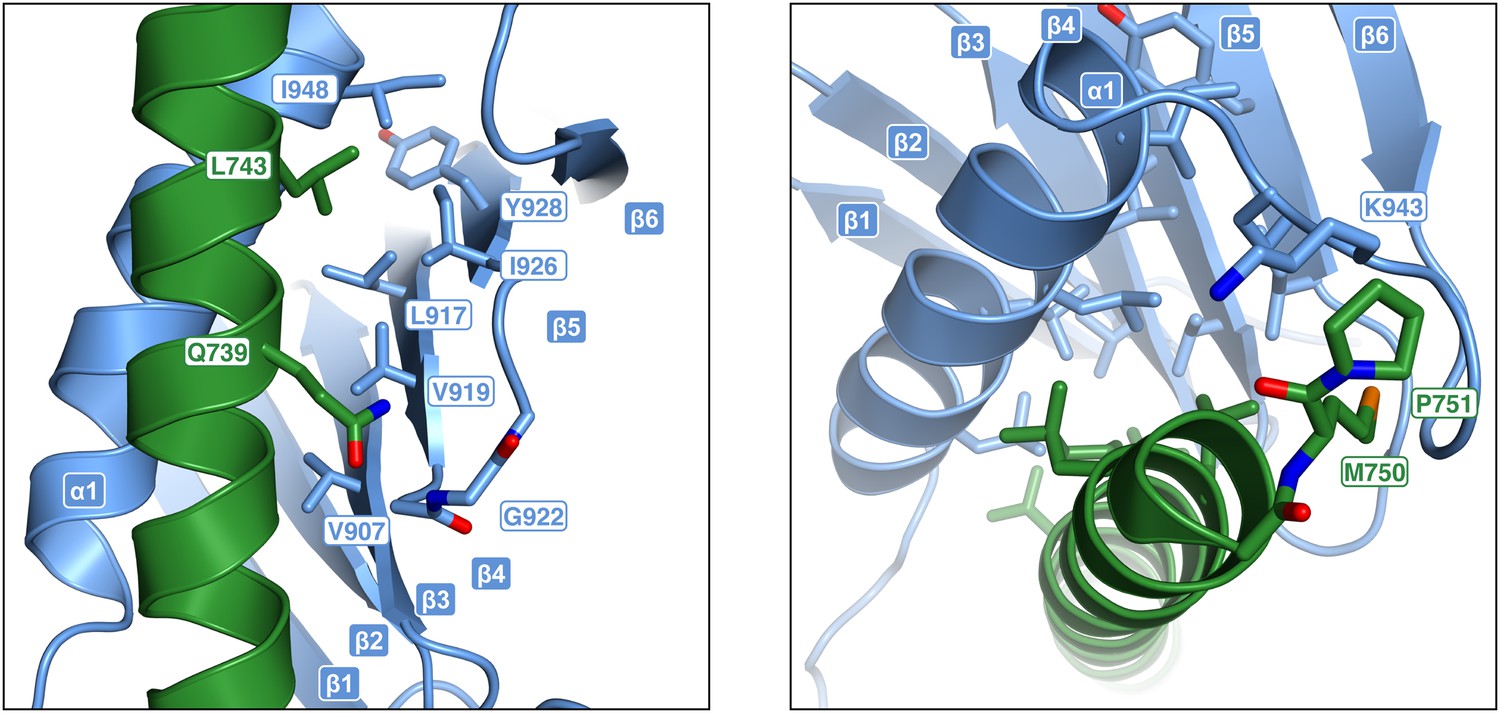
STIL–CC binding to PLK4-PB3 mimics coiled-coil interactions.
Close-up views of the STIL-CC/PLK4-PB3 binding interface. Key contributing residues to the interaction between PLK4-PB3 (light blue) and STIL-CC (green) are indicated.
Figure 6—figure supplement 2
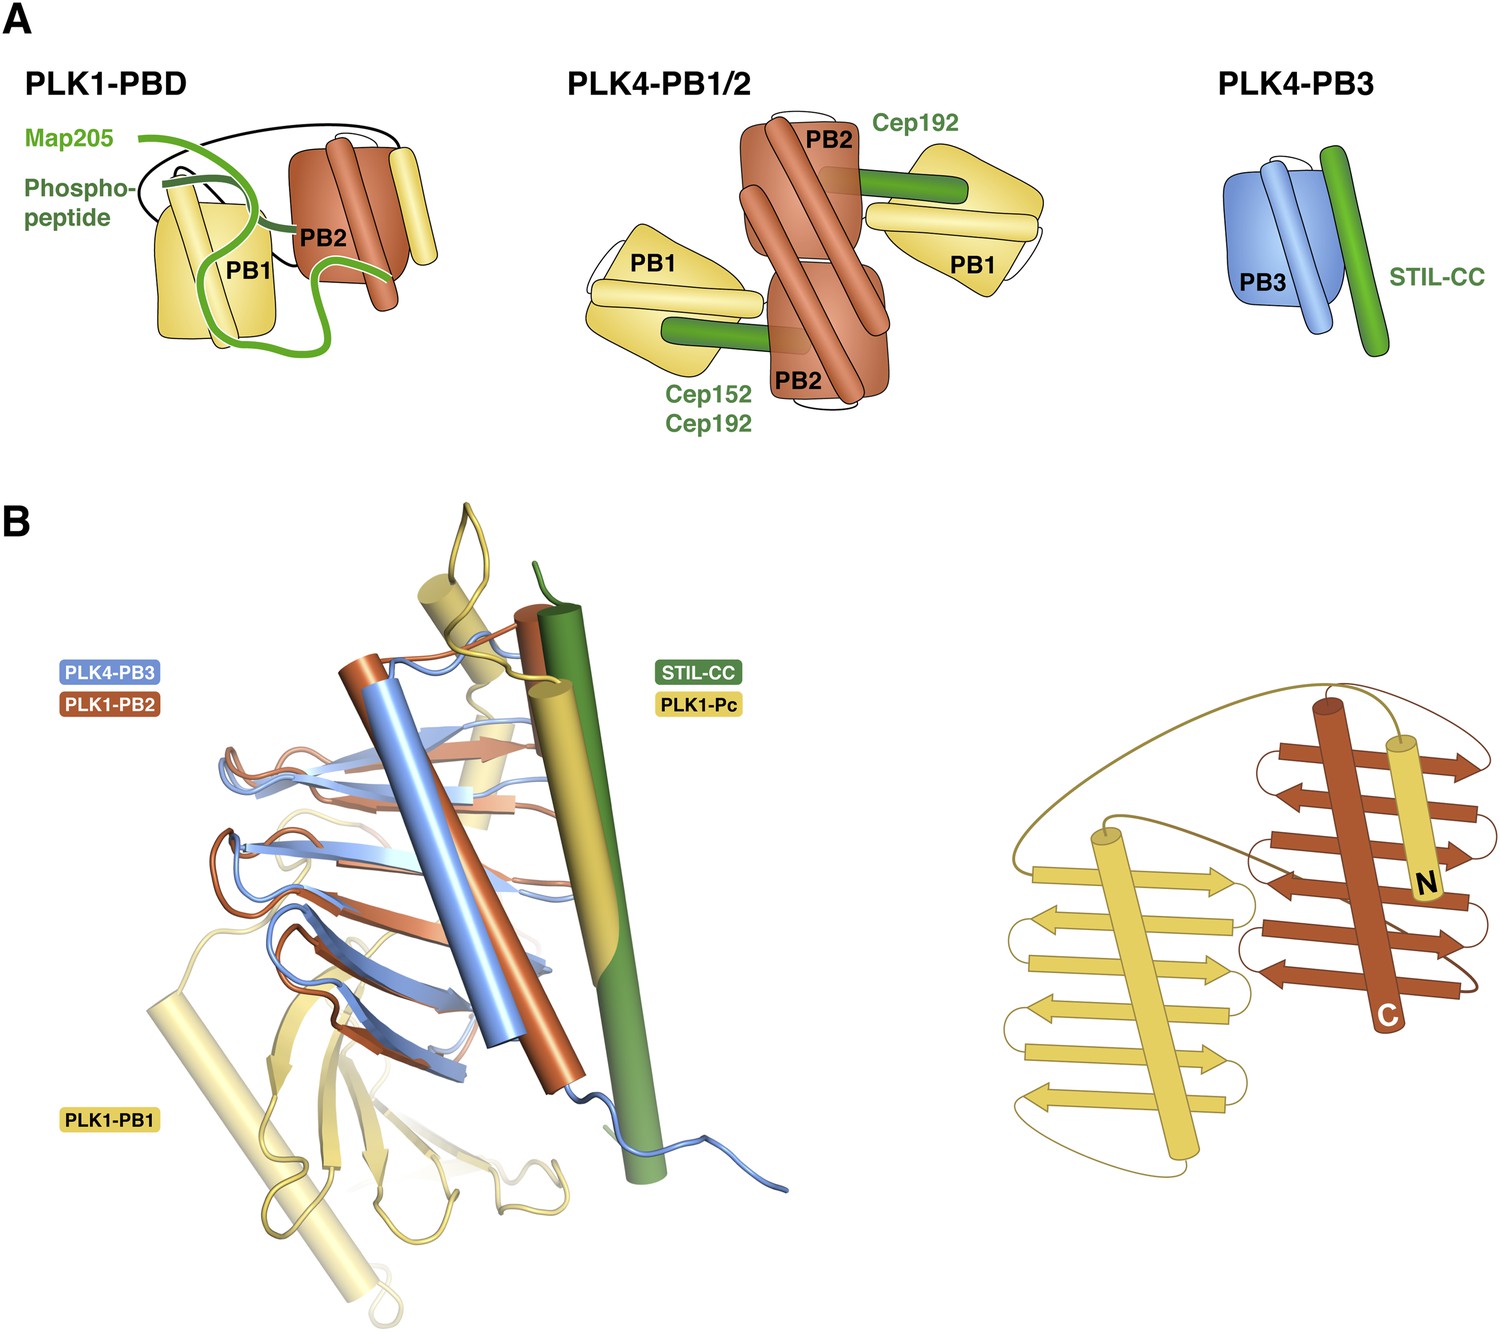
STIL–CC binding to PLK4-PB3 resembles an intramolecular interaction of PB2 and Pc in PLK1.
(A) Schematic representation of previously observed substrate peptide binding modes in Polo-boxes (Cheng et al., 2003; Elia et al., 2003b; Xu et al., 2013; Park et al., 2014). (B) Left: Structural superposition of PLK4-PB3 (light blue) onto PB2 (orange) in the intact PLK1-PB1/2 structure (Elia et al., 2003b). The bound STIL-CC peptide (green) occupies the same position on PLK4-PB3 as the Polo-cap helix (PLK1-Pc, yellow), which binds intramolecularly in the PLK1-PB1/2 structure. Right: Schematic representation of the relative orientation of PLK1-PB1 and PLK1-PB2 and the position of the PLK1-Pc.
Figure 7
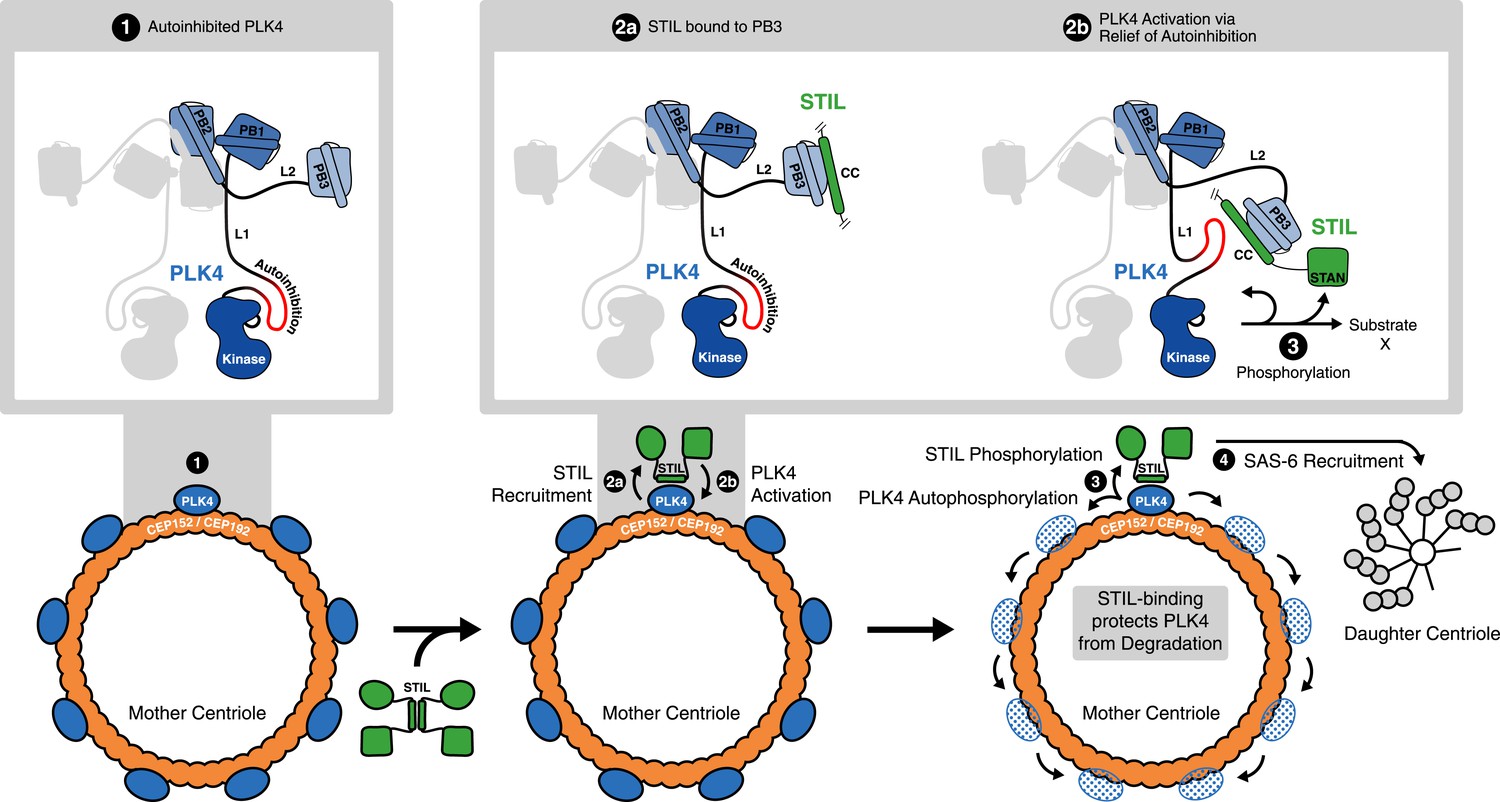
STIL binding to PLK4 regulates centriole duplication.
Hypothetical mechanism for STIL-mediated PLK4 activation: (1) PLK4 is bound to the mother centriole. It is intrinsically inactive, likely due to an autoinhibition by linker L1. (2a) STIL binds to PLK4 that has been recruited to centrioles through interactions with CEP192 and/or Cep152. (2b) STIL binding relieves the autoinhibition of PLK4, thus activating PLK4. (3) Activated PLK4 phosphorylates STIL in the STAN motif, which induces SAS-6 recruitment and daughter centriole biogenesis (4). Activated PLK4 also phosphorylates neighboring PLK4s in the degradation motif, triggering their degradation. At the site of cartwheel formation, the STIL-bound PLK4 is protected against degradation.
Author response image 1
Tables
Table 1
NMR and X-ray data collection and refinement statistics
| PLK4-PB3 | |
|---|---|
| NMR distance and dihedral constraints | |
| Distance constraints | |
| Total NOE | 399 |
| Intra-residue | 49 |
| Inter-residue | 350 |
| Sequential (|i − j| = 1) | 109 |
| Medium-range (|i − j| < 4) | 100 |
| Long-range (|i − j| > 5) | 141 |
| Hydrogen bonds | 16 |
| Total dihedral angle restraints | 122 |
| ϕ | 61 |
| ψ | 61 |
| Structure statistics | |
| Violations (mean and s.d.) | |
| Distance constraints (Å) | 0.0158 ± 0.0028 |
| Dihedral angle constraints (°) | 1.686 ± 0.147 |
| Max. dihedral angle violation (°) | 8.40 |
| Max. distance constraint violation (Å) | 0.278 |
| Deviations from idealized geometry | |
| Bond lengths (Å) | 0.004 ± 0.000 |
| Bond angles (°) | 0.483 ± 0.017 |
| Impropers (°) | 1.391 ± 0.102 |
| Average pairwise r.m.s. deviation* (Å) | |
| Heavy† | 1.60 ± 0.21 |
| Backbone† | 1.09 ± 0.25 |
| PLK4-PB3/STIL-CC | |
|---|---|
| X-ray data collection | |
| Space group | C2221 |
| Cell dimensions | |
| a, b, c (Å) | 86.6, 136.3, 33.4 |
| α, β, γ (°) | 90.0, 90.0, 90.0 |
| Resolution (Å) | 68.1–2.60 (2.60–2.76) |
| Rmerge | 0.15 (2.37) |
| CC1/2 outer shell | 0.63 |
| I/σI | 10.3 (0.9) |
| Completeness (%) | 99.7 (99) |
| Redundancy | 6.4 (6.6) |
| Refinement | |
| Resolution (Å) | 20.80–2.60 |
| No. reflections | 6409 |
| Rwork/Rfree | 0.22/0.25 |
| No. atoms | |
| Protein | 1829 |
| Water | 15 |
| B-factors | |
| Protein | 89.7 |
| Water | 78.6 |
| R.m.s. deviations | |
| Bond lengths (Å) | 0.01 |
| Bond angles (°) | 1.15 |
-
*
Pairwise r.m.s. deviation was calculated among 20 refined structures.
-
†
Statistics applied for ordered regions (residues 890–961).
Additional files
-
Supplementary file 1
Molecular mass determination by lateral diffusion measurements.
- https://doi.org/10.7554/eLife.07888.020
Download links
A two-part list of links to download the article, or parts of the article, in various formats.
Downloads (link to download the article as PDF)
Open citations (links to open the citations from this article in various online reference manager services)
Cite this article (links to download the citations from this article in formats compatible with various reference manager tools)
STIL binding to Polo-box 3 of PLK4 regulates centriole duplication
eLife 4:e07888.
https://doi.org/10.7554/eLife.07888


