Dissociable roles of the inferior longitudinal fasciculus and fornix in face and place perception
- Cardiff University, Wales
Figures
Figure 1 with 1 supplement
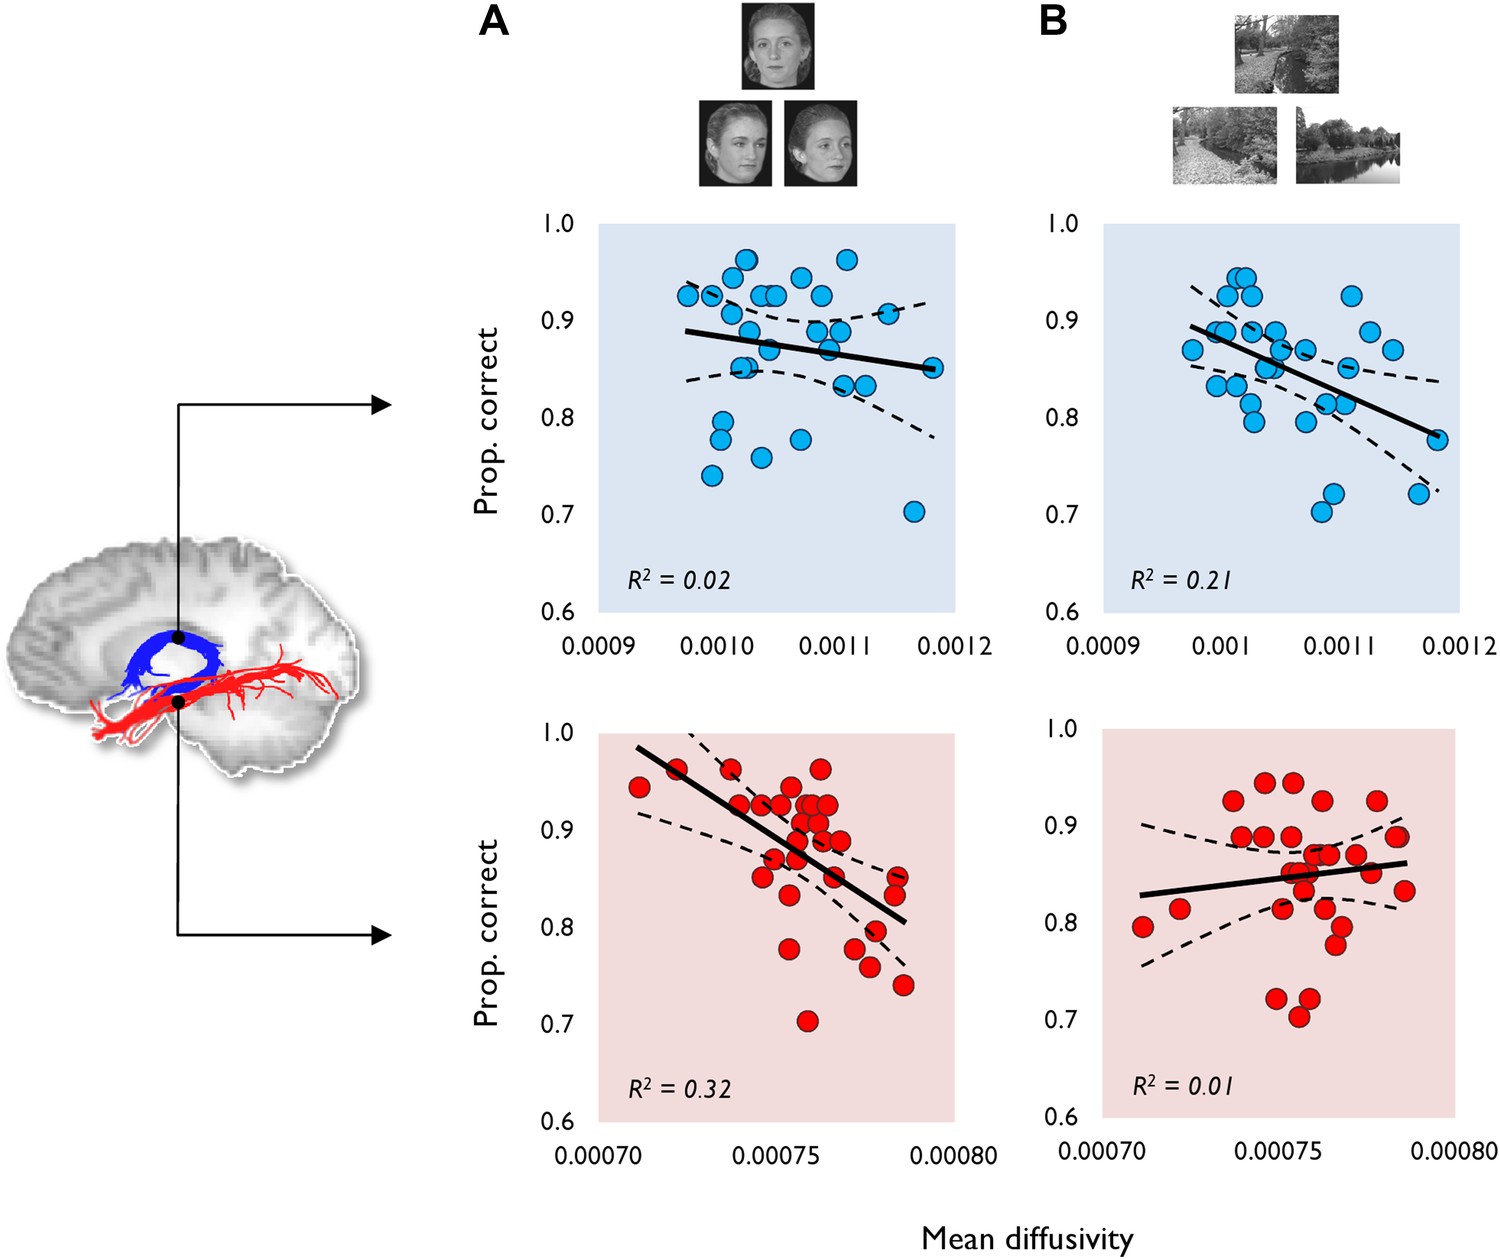
The relationship between tract MD and oddity performance (proportion correct).
This is shown for (A) face and (B) scene oddity. The best fitting linear regression line and 95% confidence interval (CI) are displayed on each scatter plot. Reconstructions of the fornix (blue) and inferior longitudinal fasciculus (ILF) (red) are depicted on the sagittal midline slice of a participant's T1-weighted brain image. Data obtained from the fornix and ILF are indicated with blue and red data markers, respectively, with 29 data points appearing on all graphs. Scatter plots for both the fractional anisotropy (FA) data and the size oddity condition are depicted in Figure 1—figure supplement 1.
Figure 1—figure supplement 1
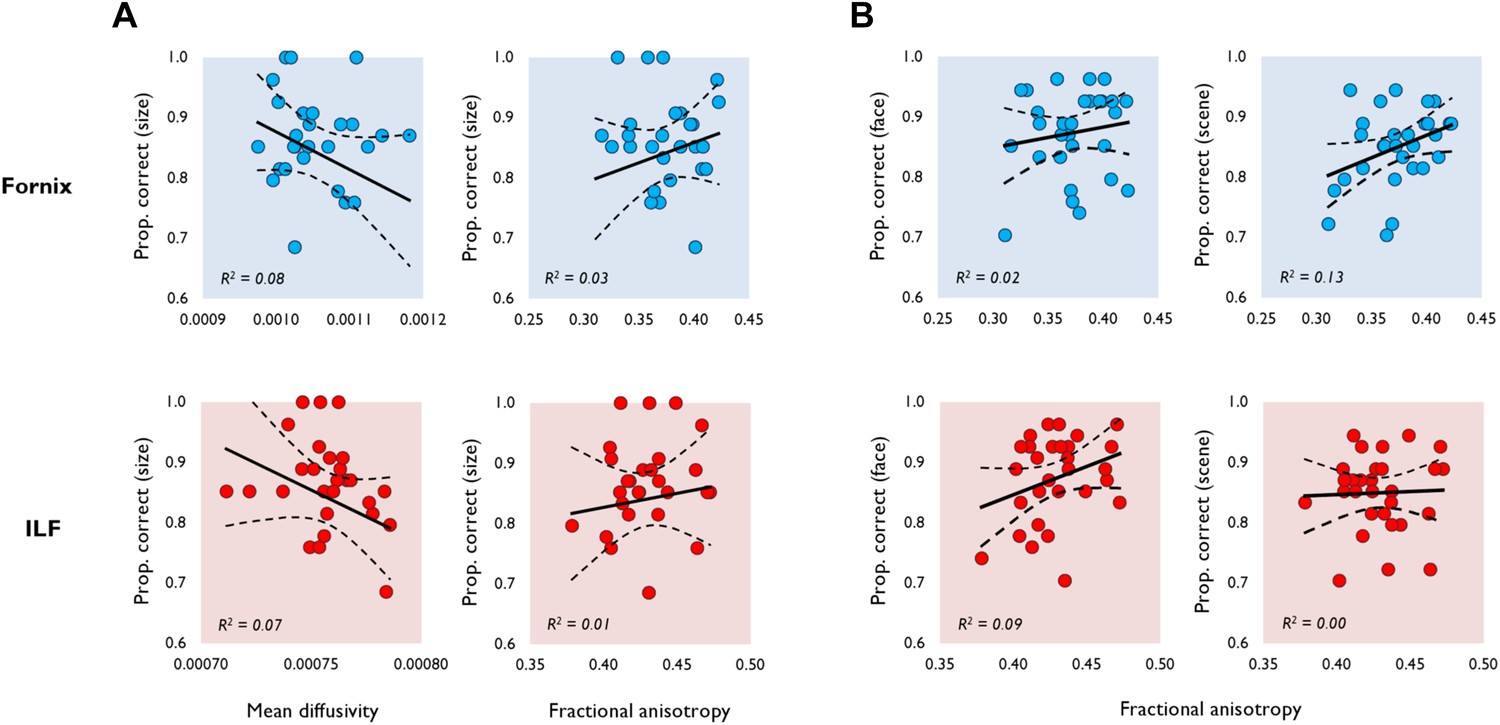
Additional results for the diffusion tensor imaging (DTI)-behaviour correlational analyses.
(A) The relationship between white matter microstructure (MD, FA) and size oddity performance (proportion correct). (B) The relationship between FA and proportion correct for faces (left) and scenes (right; see the main paper for MD). Data obtained from the fornix (top) and ILF (bottom) are indicated by blue and red data markers, respectively, with 29 data points appearing on all graphs. The best fitting linear regression line and 95% CI are displayed on each scatter plot.
Figure 2
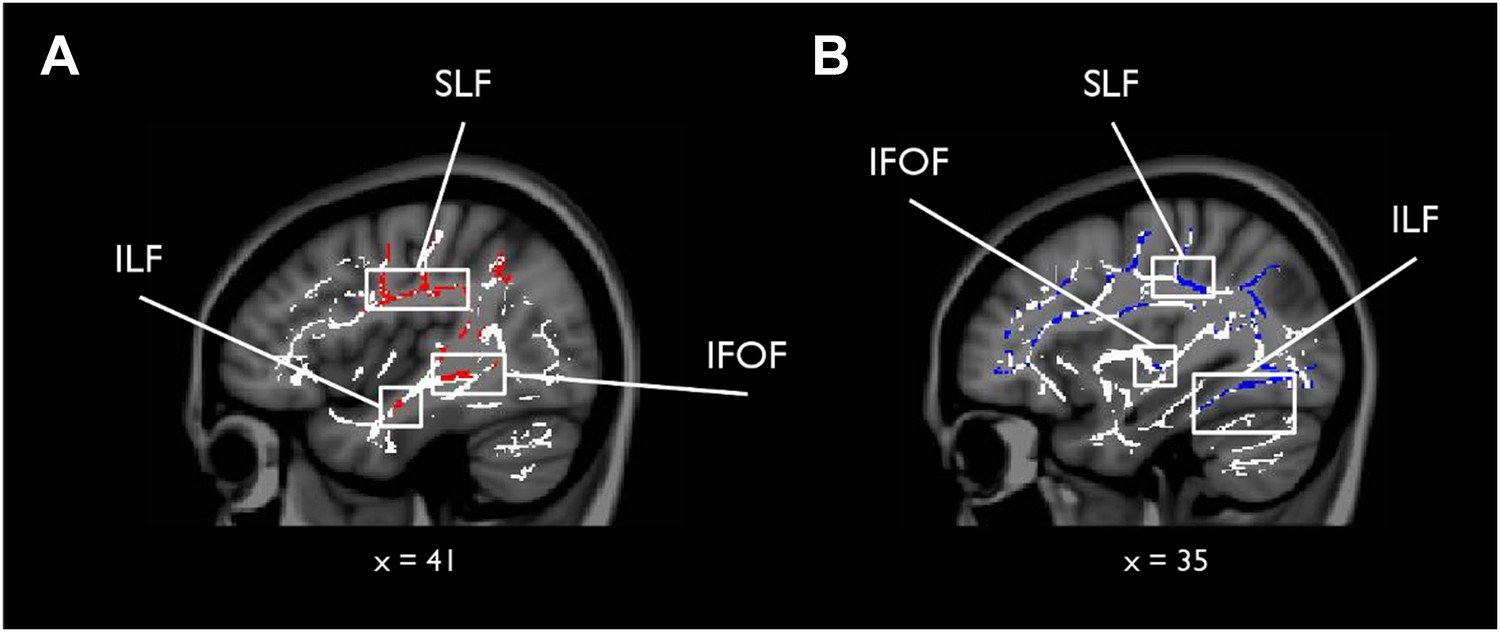
Results of the whole-brain tract-based spatial statistics (TBSS) analysis.
White matter (WM) voxels identified by TBSS that show a stronger relationship for F > S and (A) mean diffusivity (MD) (negative correlation, red clusters), and (B) FA (positive correlation, blue clusters). Abbreviated WM structures include SLF (superior longitudinal fasciculus), IFOF (inferior fronto-occipital fasciculus), and ILF (inferior longitudinal fasciculus). There were no whole-brain WM voxels showing a significantly greater association with S > F (for both MD and FA). A table of peak coordinates for the TBSS analysis can be found in Supplementary file 1.
Figure 3
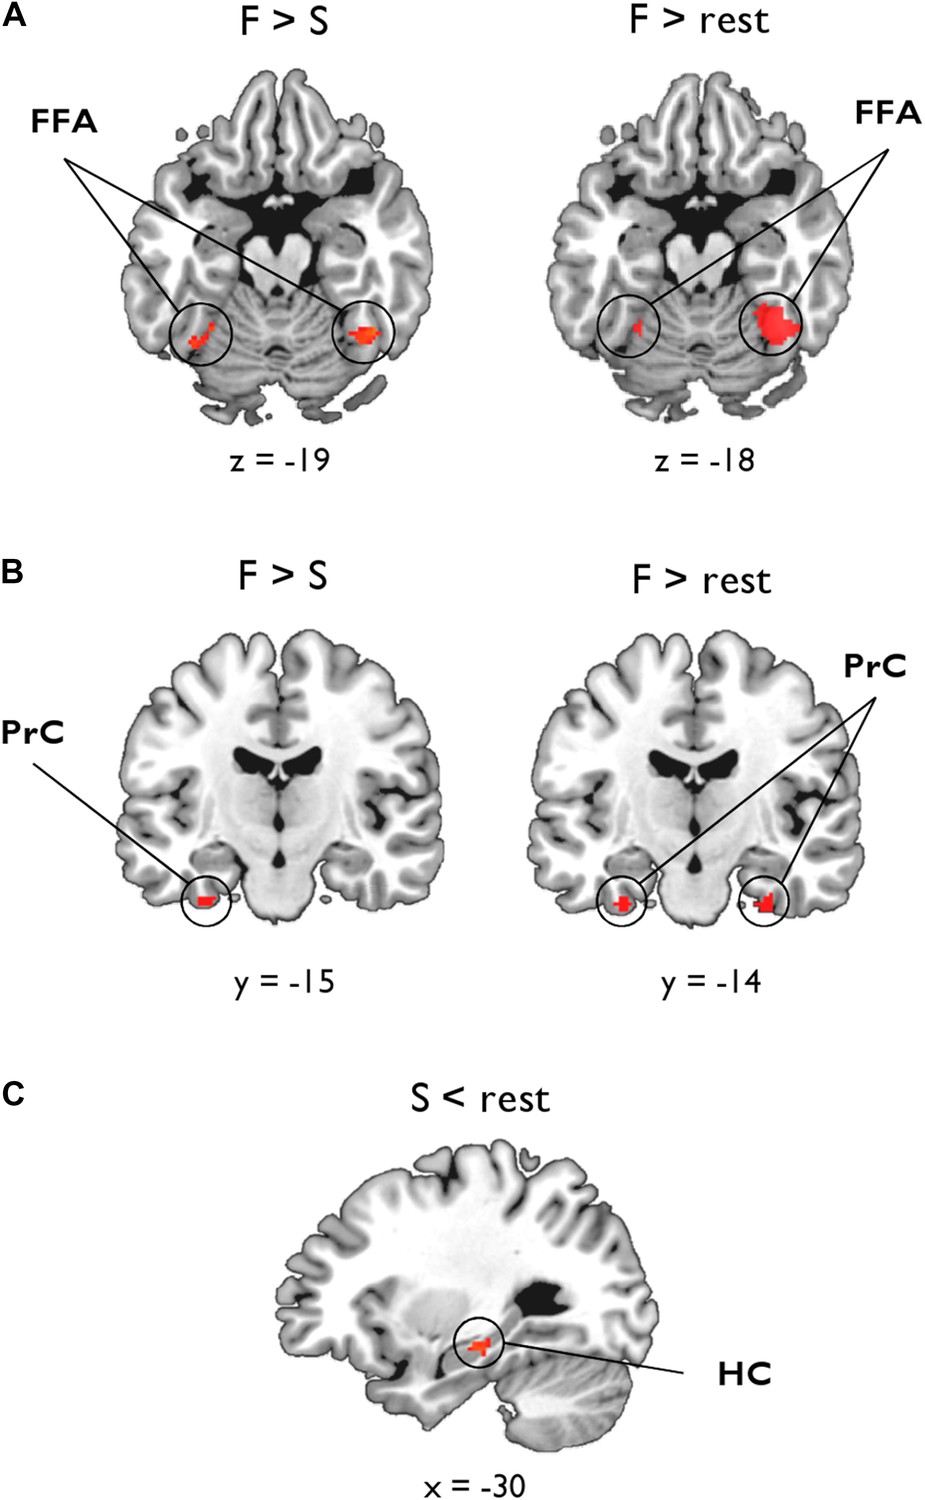
Voxel-wise linear associations between WM microstructure and category-sensitive blood oxygen level-dependent (BOLD) response.
A group-level region-of-interest (ROI) analysis of the fMRI data was conducted to identify clusters reflecting a significant relationship between BOLD response for faces and scenes and tissue microstructure of the ILF and fornix, respectively. (A) Fusiform face area (FFA): significant bilateral clusters reflecting a negative association between BOLD response during face oddity judgements (F > S, left; F > rest, right) and ILF MD. (B) Perirhinal cortex (PrC): bilateral clusters reflecting a significant negative association between face-sensitive BOLD (F > rest) and ILF MD (right). A sub-threshold cluster for F > S is shown on the left. (C) Hippocampus (HC): a significant cluster was identified in the intermediate HC that corresponds to a positive association between task-induced scene deactivations (against rest) and fornix FA.
Figure 4
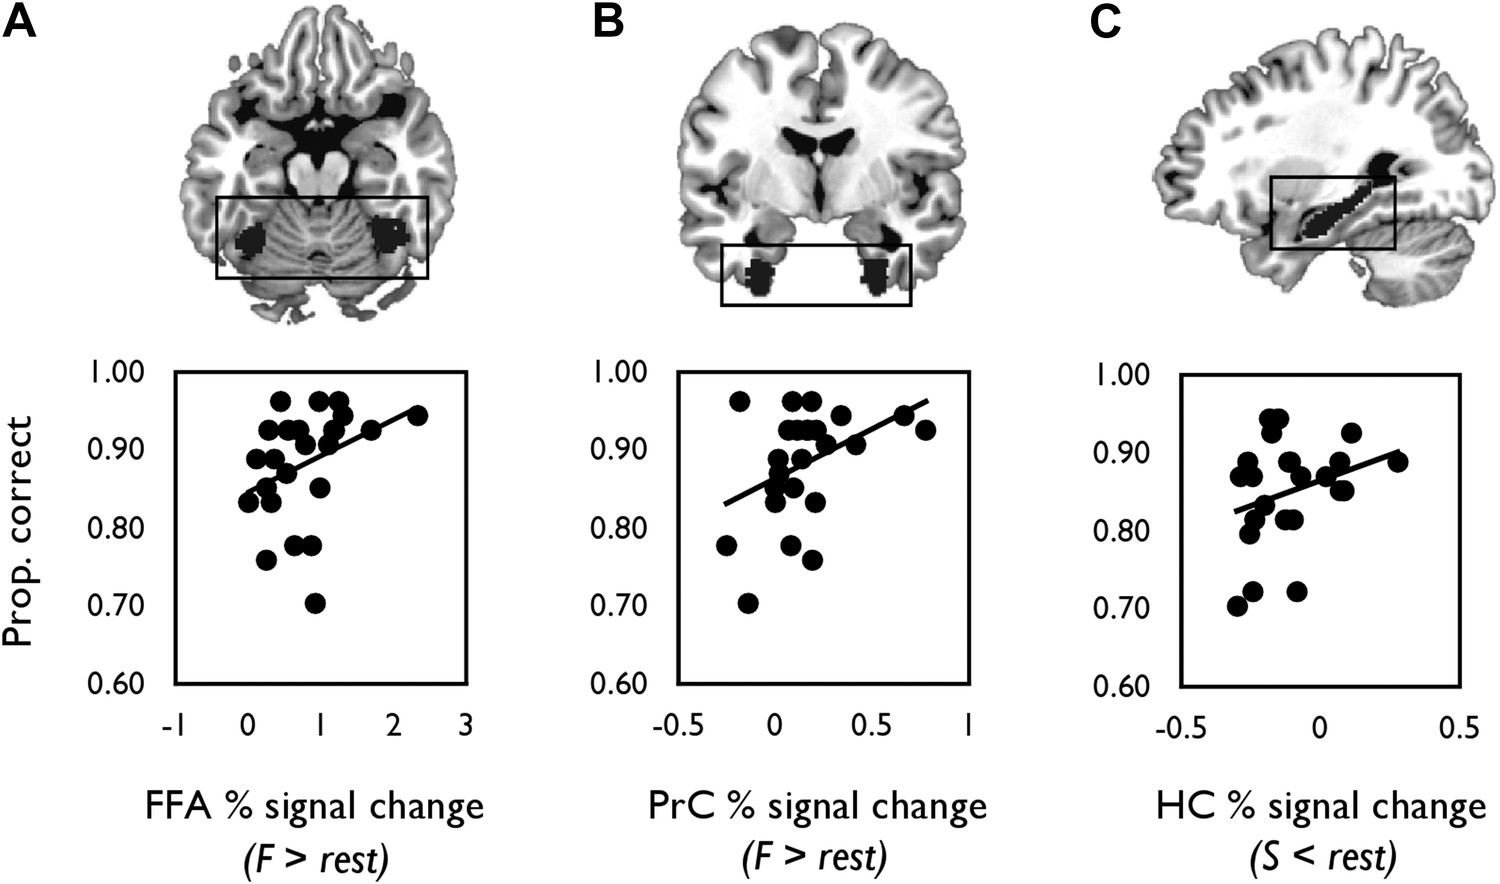
Correlations between mean percentage BOLD signal change from each probabilistic anatomical ROI (shown above each graph) and oddity performance.
(A) Scatter plot displaying the relationship between inter-individual variation in percentage signal change for faces (relative to rest) and face oddity performance (proportion correct) in the pre-defined FFA ROI. (B) The relationship between inter-individual variation in face-related activations (against rest) and face oddity performance in the PrC ROI. (C) The relationship between task-induced scene deactivations (relative to rest) and scene oddity performance in the pre-defined HC ROI. A total of 24 data points are shown on each graph. Individual percentage signal change values for each ROI are contained in Figure 4—source data 1.
-
Figure 4—source data 1
Individual percentage BOLD signal change values for the fMRI contrasts.
- https://doi.org/10.7554/eLife.07902.013
Figure 5
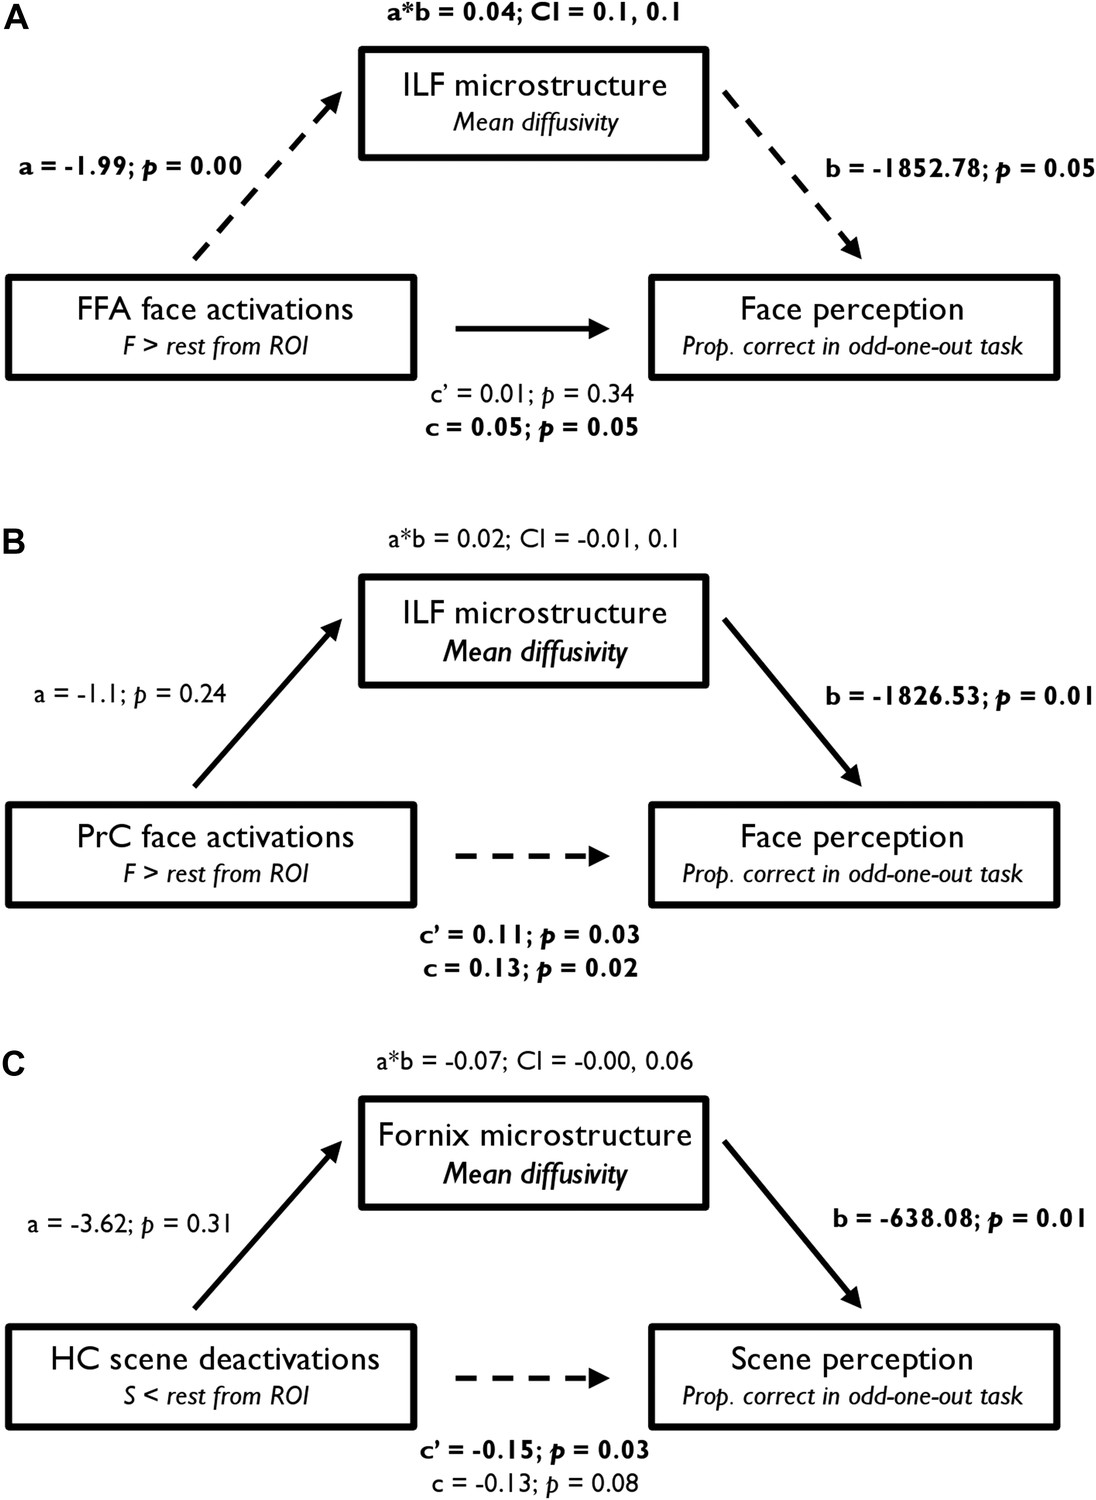
Statistical mediation (path) analysis examining the three-way relationship between regional functional BOLD activity, WM microstructure, and oddity performance.
Mediation models are presented for (A) FFA, (B) PrC, and (C) HC. These models test the extent to which the relationship between BOLD response (in the a priori FFA, PrC, and HC ROIs) and odd-one-out accuracy is mediated by WM microstructure. The left, middle, and right boxes in each model represent the independent variable (IV), mediator (M), and dependent variable (DV), respectively. Unstandardised coefficients and their corresponding one-tailed p values are depicted for each path of interest (a, b, a*b, c′, and c). In a simple mediation model, these paths reflect the following: path c represents the total effect of the IV on the DV; path a quantifies the effect of the IV on the M; path b reflects the causal effect of the M on the DV; and path c′ is the direct effect of the IV on the DV that also partials out the effect of the M. Significant paths are indicated by dashed lines and significant terms are indicated by bold font. The bootstrap 95% CI is displayed for the indirect effects (a*b). See Supplementary file 2 for further details.
Figure 6
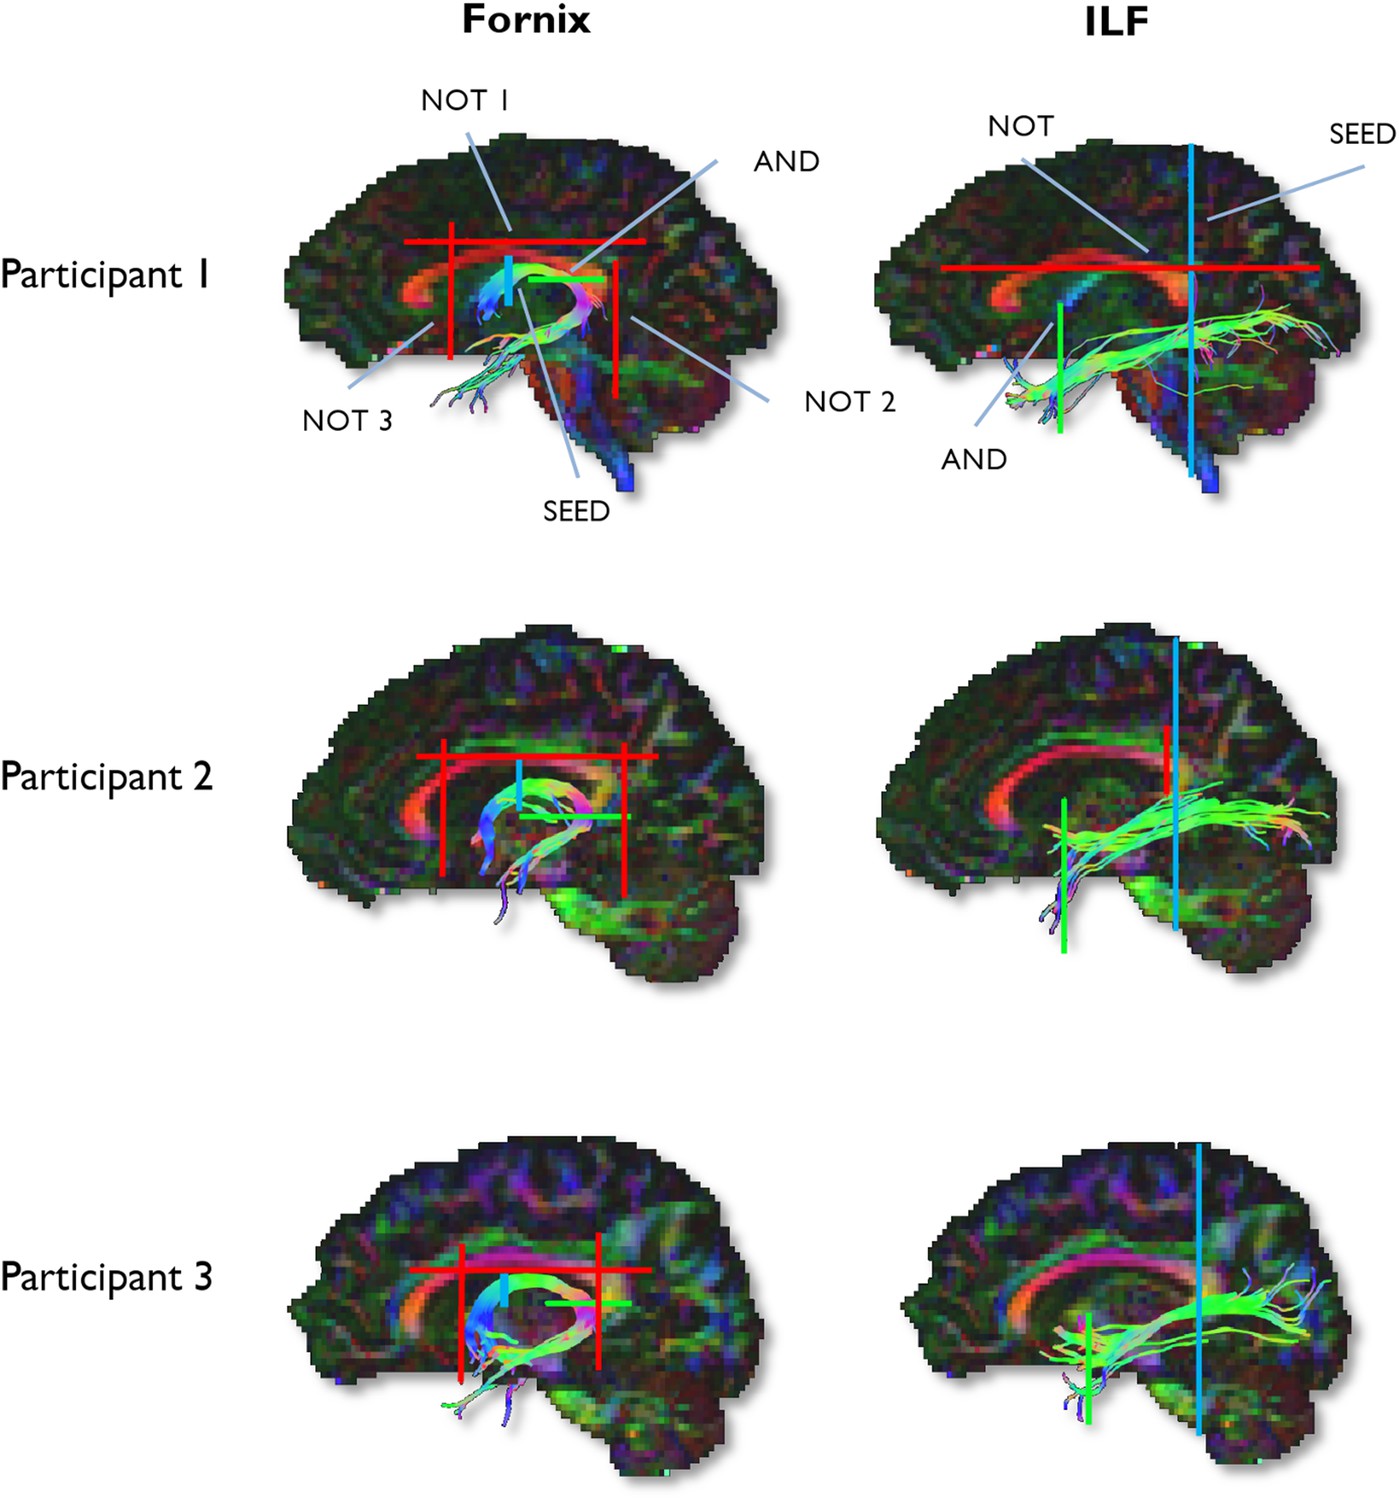
Example reconstructions for the fornix and ILF.
Tractography ROIs are shown for three participants (SEED ROI, blue; AND ROI, green; NOT ROI, red).
Tables
Table 1
Descriptive statistics for the three behavioural conditions
| Accuracy | RT | |||
|---|---|---|---|---|
| Mean | SD | Mean | SD | |
| Face | 0.87 | 0.07 | 2932.40 | 479.68 |
| Scene | 0.85 | 0.06 | 3147.86 | 557.49 |
| Size | 0.84 | 0.12 | 2464.10 | 668.31 |
-
Mean and standard deviation (SD) are reported for both accuracy (proportion correct) and reaction time (RT). Raw behavioural data for the three oddity categories are available in Table 1—source data 1.
-
Table 1—source data 1
Raw behavioural data from the oddity task.
- https://doi.org/10.7554/eLife.07902.006
Table 2
Descriptive statistics for the fornix (left) and inferior longitudinal fasciculus (ILF, right)
| Fornix | ILF | |||
|---|---|---|---|---|
| Mean | SD | Mean | SD | |
| FA | 0.373 | 0.031 | 0.429 | 0.023 |
| MD | 1.058 | 0.054 | 0.758 | 0.017 |
-
Mean and standard deviations are reported for fractional anisotropy (FA) and mean diffusivity (MD × 10−3 mm2 s−1). Individual FA and MD values for each participant (and tract) are available in Table 2—source data 1.
-
Table 2—source data 1
Raw values for the DTI metrics.
- https://doi.org/10.7554/eLife.07902.008
Table 3
Summary table for the DTI-behaviour correlations
| Fornix | ILF | |||||||
|---|---|---|---|---|---|---|---|---|
| MD | FA | MD | FA | |||||
| r | p | r | p | r | p | r | p | |
| Face | −0.14 | 0.23 | 0.15 | 0.22 | −0.57 | 0.00 | 0.30 | 0.06 |
| Scene | −0.46 | 0.01 | 0.36 | 0.03 | 0.12 | 0.27 | 0.04 | 0.43 |
| Size | −0.29 | 0.06 | 0.18 | 0.18 | −0.26 | 0.09 | 0.09 | 0.32 |
-
Correlation coefficients (and one-tailed p values) are reported for each metric (fractional anisotropy [FA], mean diffusivity [MD]) of fornix and inferior longitudinal fasciculus (ILF) microstructure and each task condition (face, scene, size).
-
DTI, diffusion tensor imaging.
Additional files
-
Supplementary file 1
Table of co-ordinates for the whole-brain tract-based spatial statistics (TBSS) analysis.
- https://doi.org/10.7554/eLife.07902.016
-
Supplementary file 2
Results of the mediation analyses across the three ROIs.
- https://doi.org/10.7554/eLife.07902.017
Download links
A two-part list of links to download the article, or parts of the article, in various formats.
Downloads (link to download the article as PDF)
Open citations (links to open the citations from this article in various online reference manager services)
Cite this article (links to download the citations from this article in formats compatible with various reference manager tools)
Dissociable roles of the inferior longitudinal fasciculus and fornix in face and place perception
eLife 4:e07902.
https://doi.org/10.7554/eLife.07902


