Bystander hyperactivation of preimmune CD8+ T cells in chronic HCV patients
- Institut Pasteur, France
- Centre d'Immunologie et des Maladies Infectieuses (CIMI-Paris), France
- Emory, United States
- Albert-Ludwigs-Universität, Germany
- Assistance publique - hôpitaux de Paris, France
- The Netherlands Cancer Institute, The Netherlands
- Lunds University, Sweden
- Université Paris Descartes, France
- Hôpital Cochin, France
Figures
Figure 1 with 4 supplements
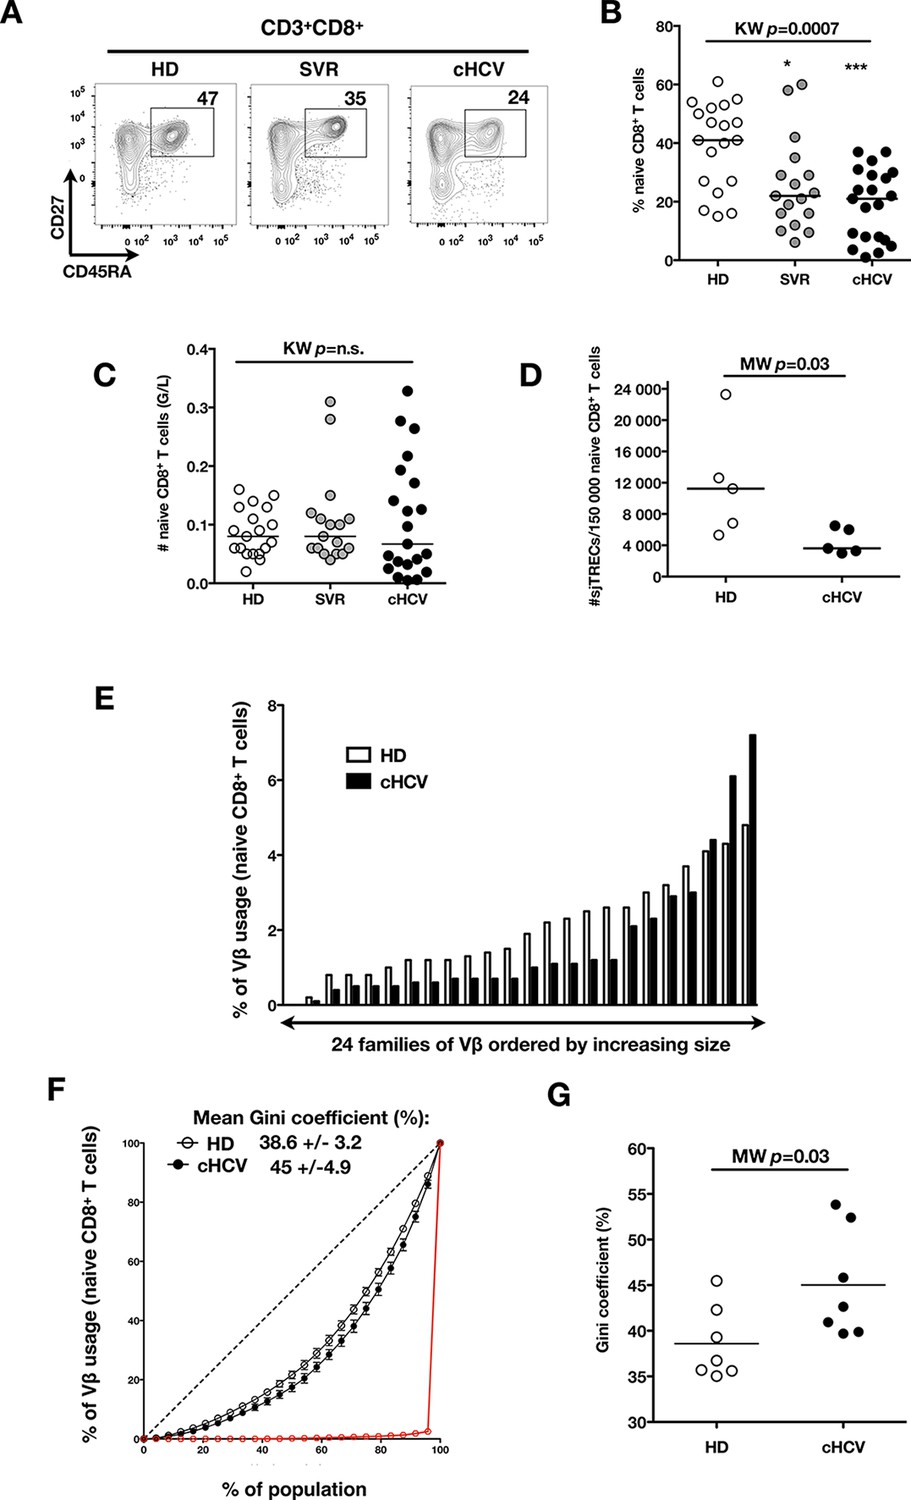
Perturbed naïve CD8+ T cell repertoire during chronic HCV infection.
Percentages and absolute numbers of CD3+ and CD3+CD8+ cells in Healthy Donors (HD), Sustained Virologic Responder (SVR), and chronic HCV (cHCV) patients are provided in Figure 1—figure supplement 1 and 2. (A) Representative examples of CD45RA+CD27+ naïve CD8+ T cell compartment in the three donor subsets. FACS plots are gated on Live CD3+CD8+ cells. Validation of CD45RA/CD27 gating strategy for identifying naïve CD8+ T cells in cHCV patients is provided in Figure 1—figure supplement 3. (B) Percentages of naïve CD8+ T cells in the three donor subsets. (C) Absolute numbers (G/L) of naïve CD8+ T cells in HD, SVR, and cHCV patients. ns (not significant, p>0.05), *(p≤0.05), **(p≤0.01), and ***(p≤0.001) refer to Dunn’s multiple comparison test of each subset toward HD. (D) Normalized numbers of sjTRECs per 150,000 naïve CD8+ in HD and cHCV samples. Normalized numbers of sjTRECs per total CD8+ T cells are provided in Figure 1—figure supplement 4. (E) Representative example of the distribution of 24 FACS-screened Vβ families in naïve CD8+ T cells from one HD and one cHCV sample. Families are ordered by increasing size in both individuals. (F) Lorenz curves representing the cumulative distribution of % of usage of 24 FACS-screened Vβ families from 7 HD and 7 cHCV patients. Mean Gini coefficients and standard deviations are indicated. Red line indicates an extreme example of an unequal distribution, observed in the case of a T-cell lymphoma where >90% of the TCR repertoire is explained by one particular Vβ chain. (G) Individual Gini coefficients of all tested samples are represented for HD and cHCV subgroups.
Figure 1—figure supplement 1
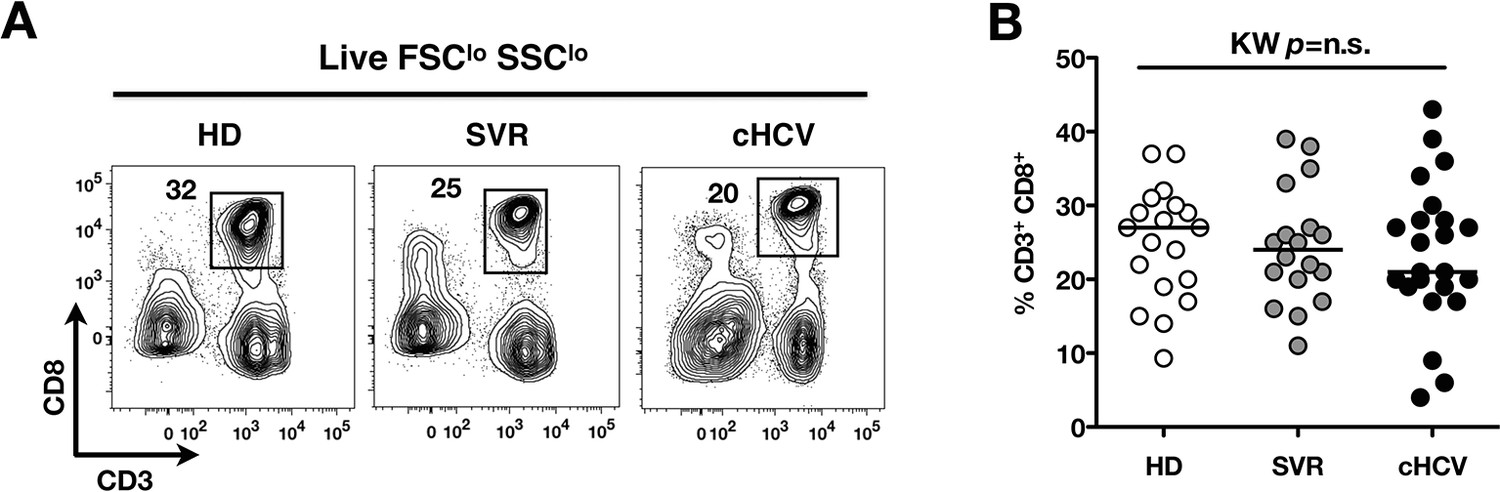
Comparable proportions of CD8+ T cells circulate in cHCV patients and HD.
(A) Representative examples of CD3+CD8+ compartment in HD, SVR, and cHCV patients. FACS plots are gated into LiveFSCloSSClo PBMCs. (B) Percentages of CD3+CD8+ T cells in the three donor subsets. (C) Absolute numbers (G/L) of CD3+ T cells in HD, SVR, and cHCV patients. (D) Absolute numbers (G/L) of CD8+ T cells in HD, SVR, and cHCV patients.
Figure 1—figure supplement 2
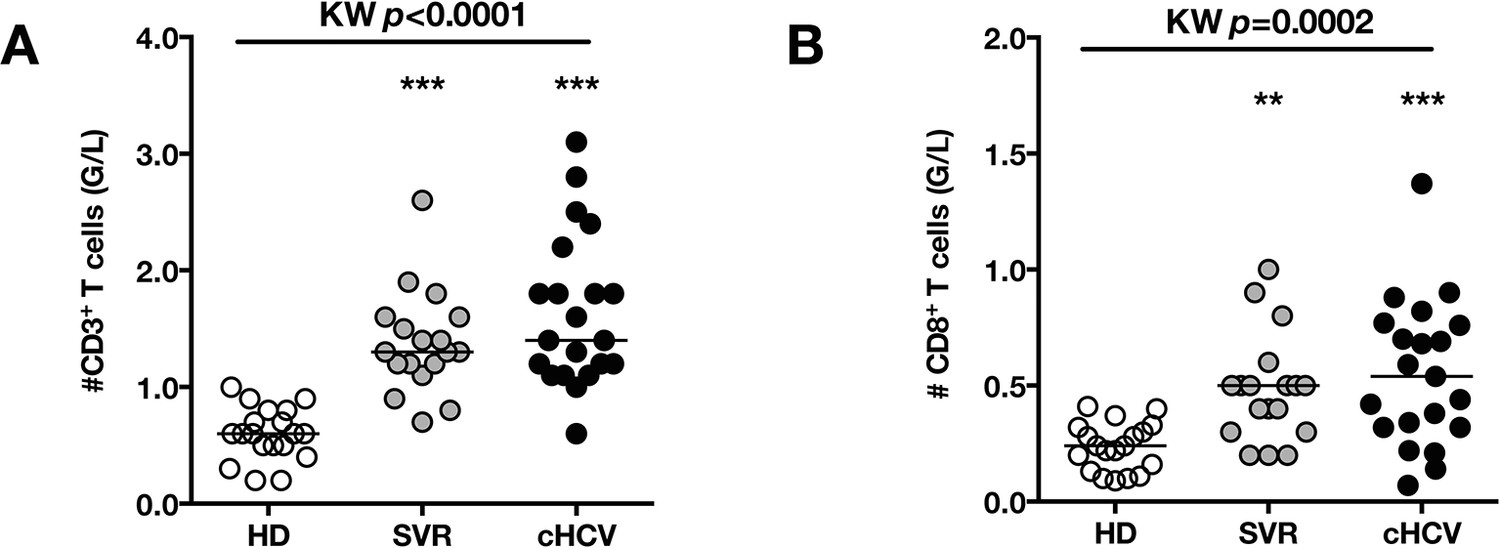
Increased absolute numbers of CD3+ and CD8+ T cells in cHCV and SVR patients.
(A) Absolute numbers (G/L) of CD3+ T cells in HD, SVR, and cHCV patients. (B) Absolute numbers (G/L) of CD3+ T cells in HD, SVR, and cHCV patients.
Figure 1—figure supplement 3
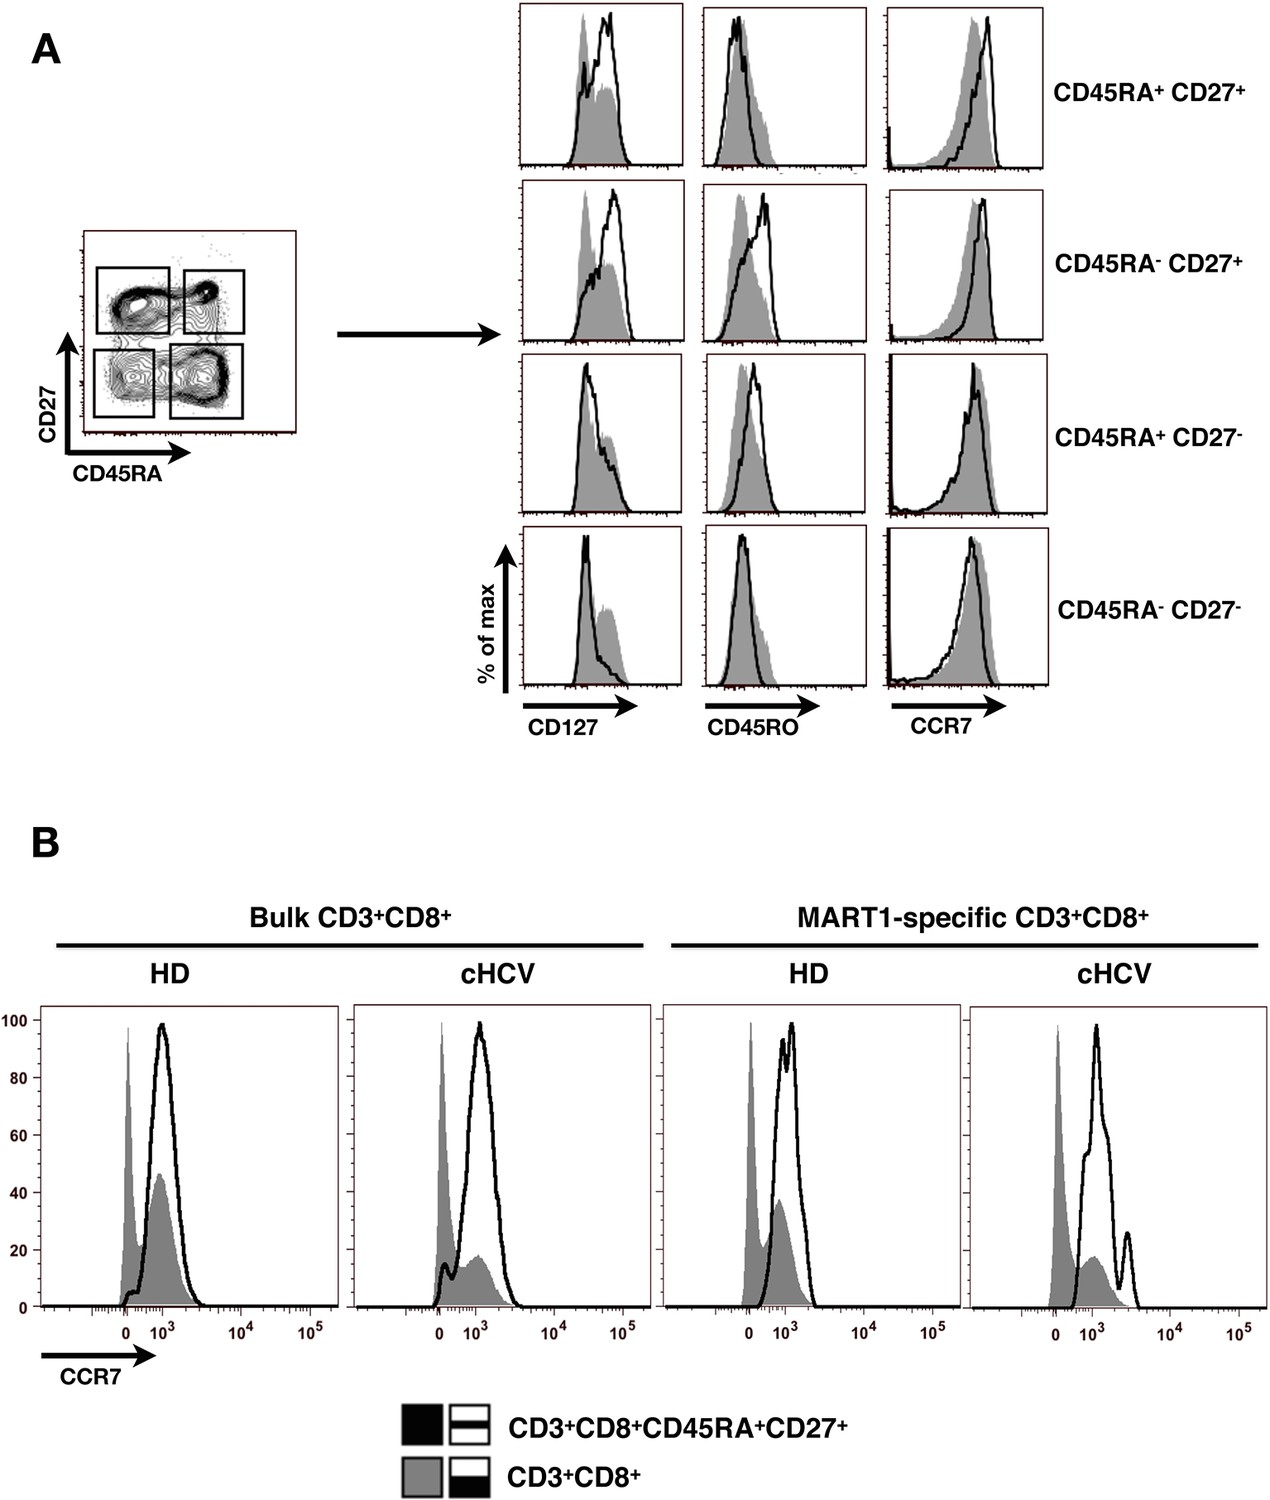
Validation of CD45RA/CD27 gating strategy for identifying naïve CD8+ T cells in cHCV patients.
(A) Example of CD45RA/CD27 gating strategy in one cHCV patient. CD8+naïve T cells are identified as CD45RA+CD27+. Pattern of CD127, CD45RO and CCR7 expression of each identified population is displayed on histogram overlays (black line represents the subpopulation of interest; grey ones the total CD8+ population). Of note, the minor population (9%) of CD127 negative cells in the displayed CD45RA+CD27+ gate are >99% CD45RO negative and CCR7 positive. (B) CCR7 expression on bulk CD3+CD8+ T cells (grey), and bulk (left) or Mart1-specific (right) CD3+CD8+ CD45RA+CD27+ T cells (black) from one HD and one cHCV.
Figure 1—figure supplement 4

Decreased number of sjTRECs in total CD3+CD8+ T cells from cHCV patients.
Normalized numbers of signal-joint T cell receptor excision circle (sjTREC) per 150,000 CD3+CD8+ cells in HD and cHCV samples.
Figure 2 with 2 supplements
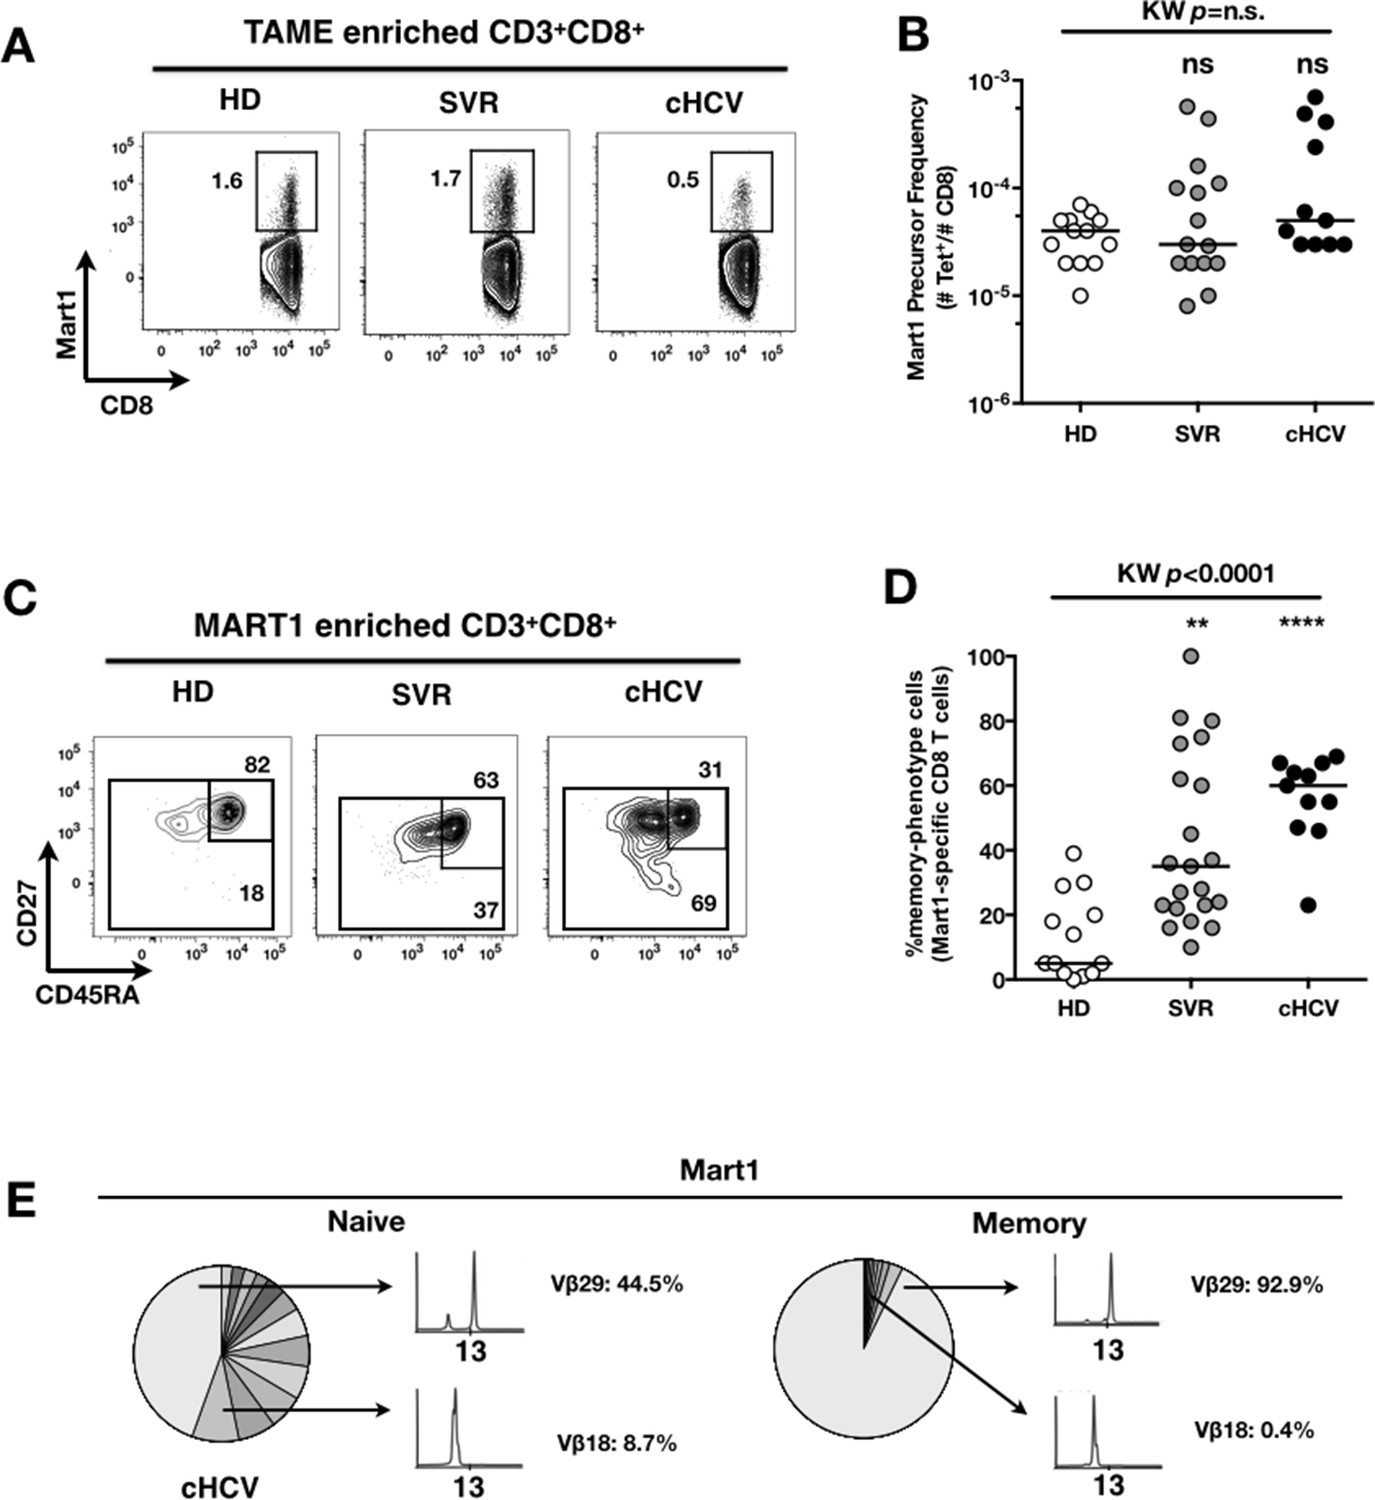
Peripheral differentiation of Mart1-specific CD8+ T cells during cHCV infection.
(A) Representative examples of Mart1-specificCD8+ T cellpopulations in HD, SVR, cHCV patients. FACS plots are gated on TAME-enriched LiveFSCloSSCloCD3+CD8+ PBMCs. (B) Precursor frequency of Mart1-specific cellsin the three donor subsets. Precursor frequency of naïve-phenotype Mart1-specific cellsis provided in Figure 2—figure supplement 1. (C) Representative examples of the CD45RA/CD27 phenotype of TAME-enriched Mart1-specificpopulations in patients subsets as in A. D/ Percentages of memory-phenotype (MP) cells in Mart1-specific populations in the three donor subsets. Further subsetting of MP inexperienced T cells into CD45/CD27-based T cell differentiation phenotype is provided in Figure 2—figure supplement 1. E/ Immunoscope profile of naïve and memory Mart1-specific populations FACS-sorted from one cHCV patient.
Figure 2—figure supplement 1
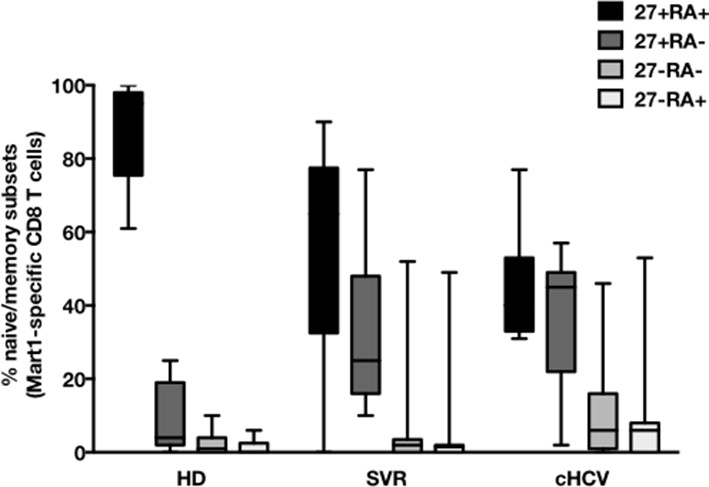
CD45RA/CD27-based subsetting of Mart1-specific T cells enriched from HD, SVR, cHCV.
Percentages of CD45RA+CD27+ (naïve), CD45RA-CD27+ (central memory), CD45RA-CD27- (effector memory), CD45RA+CD27- (late effector memory) cells within Mart1-specific T cell population in HD, cHCV and SVR patients.
Figure 2—figure supplement 2
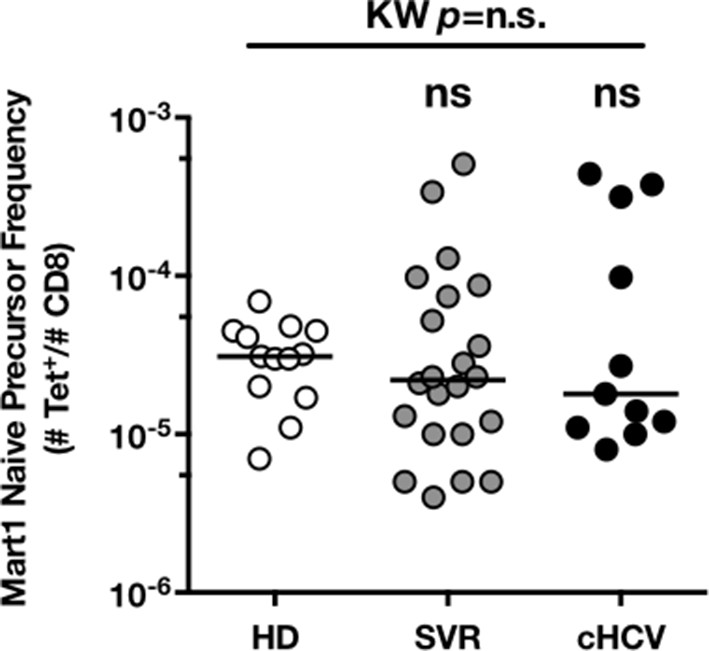
Precursor frequency of Mart1 naïve-phenotype cellsin the three donor subsets.
https://doi.org/10.7554/eLife.07916.011
Figure 3 with 1 supplement
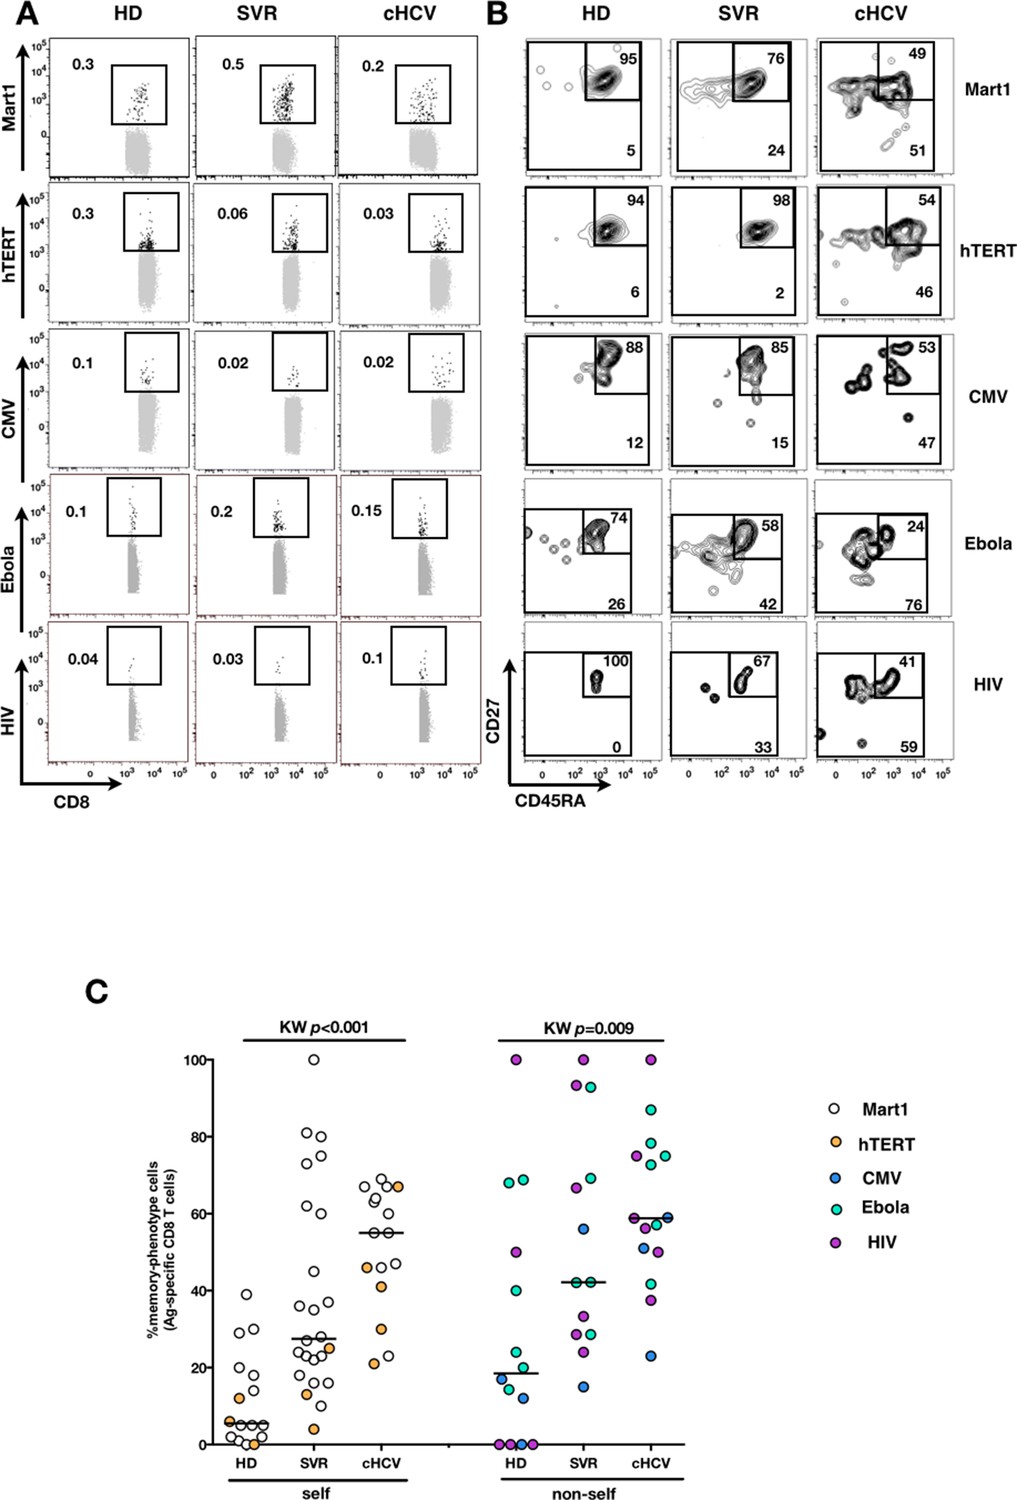
Memory-phenotype cells within self and non-self antigen-inexperienced populations.
(A) Representative examples of Mart1-, hTERT-, CMV-, Ebola- and HIV- specificpopulations from HD, SVR, and cHCV patients. Enriched tetramer-specific populations are overlaid on total CD8+ T cells. (B) CD45RA/CD27 phenotype of tetramer-specific populations gated in A. (C) Percentages of memory-phenotype cells in Mart1- and hTERT- (self); CMV-, Ebola- and HIV- (non-self) specific populations from HD, SVR and cHCV patients. Further subsetting of MP inexperienced T cells into CD45/CD27-based T cell differentiation phenotype is provided in Figure 3—figure supplement 1.
Figure 3—figure supplement 1

CD45RA/CD27-based subsetting of Mart1-, Ebola-, and HIV- specific T cells enriched from cHCV patients.
Percentages of CD45RA+CD27+ (naïve), CD45RA-CD27+ (central memory), CD45RA-CD27- (effector memory), CD45RA+CD27- (late effector memory) cells within Mart1-, Ebola-, and HIV- specific T cell populations in HD, cHCV and SVR patients.
Figure 4
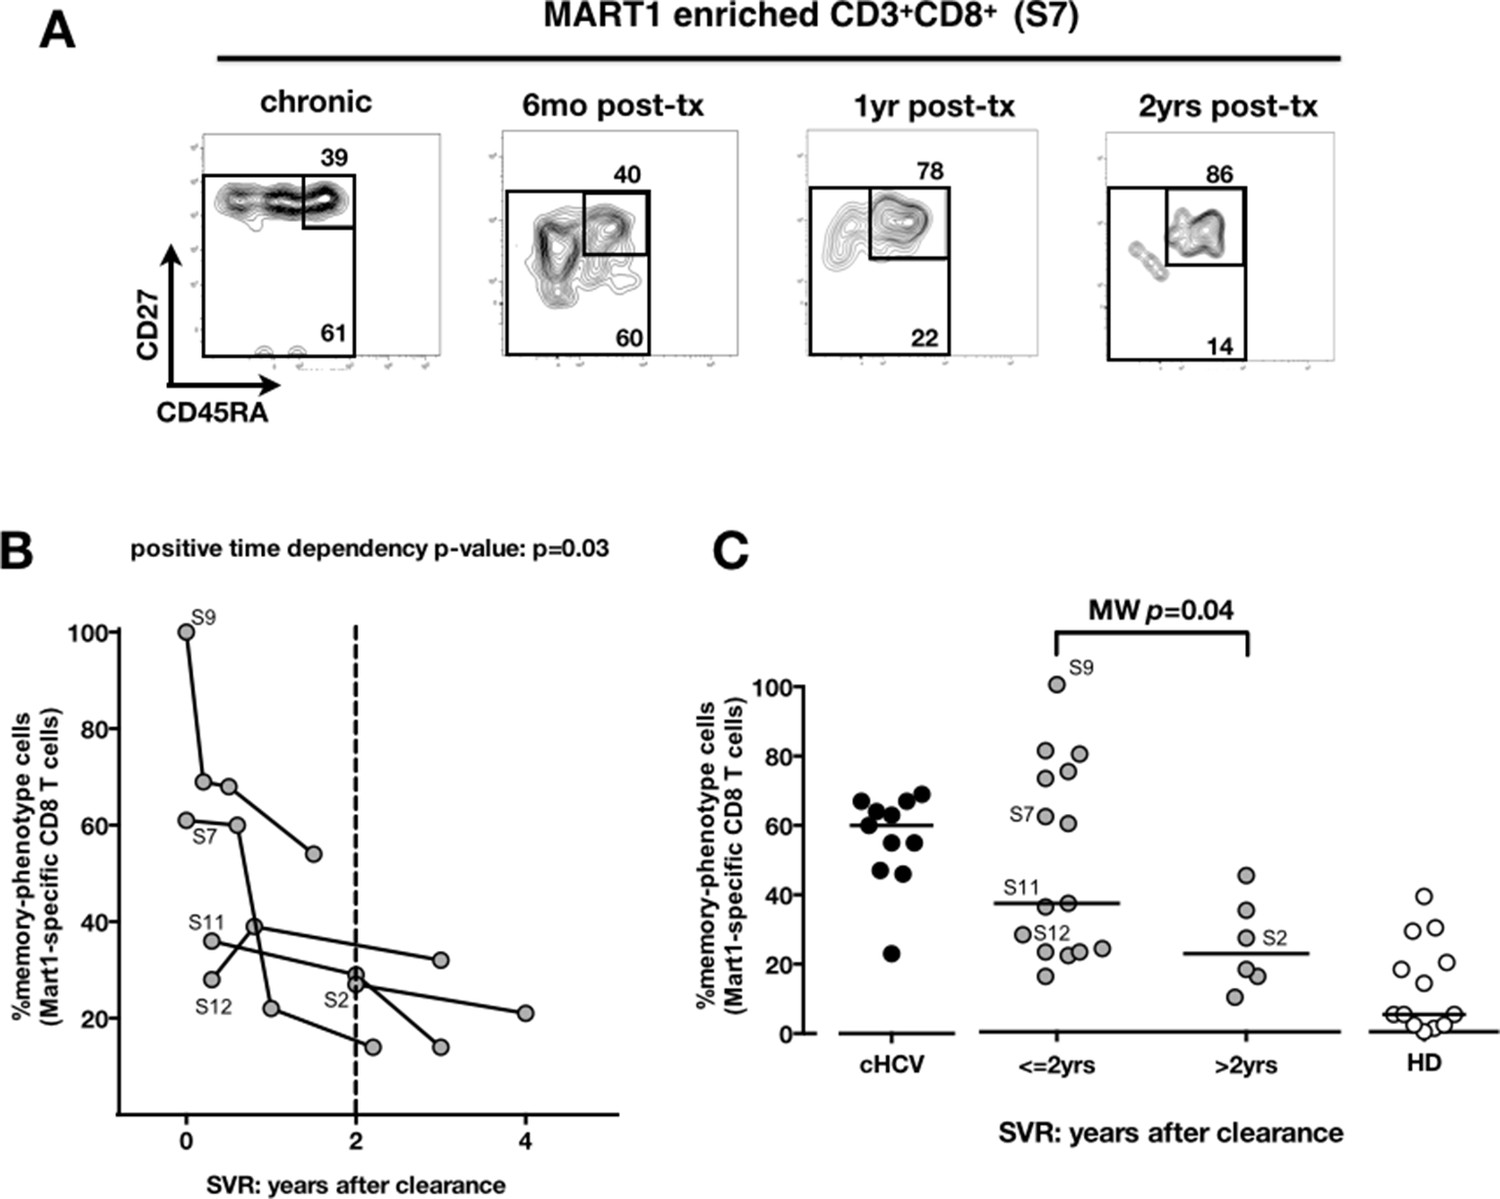
Memory phenotype of Mart1-specific CD8+ T cells during chronic infection may be reversed by viral clearance.
(A) Example of CD45RA/CD27 phenotype of Mart1-specific cells during chronic phase, and over time after viral clearance in one HLA-A0201 SVR patients (patient S7). (B) Percentages of Mart1 memory-phenotype cells over time after viral clearance on 5 SVR patients with longitudinal sampling – including S7 presented in E. (C) Percentages of memory-phenotype cells in Mart1-specific populations vs. time elapsed since clearance of the virus in SVR patients (time-stratified, in years). These data include all HLA A0201 SVR patients; first available data is incorporated for follow-up patients presented in F.
Figure 5 with 5 supplements
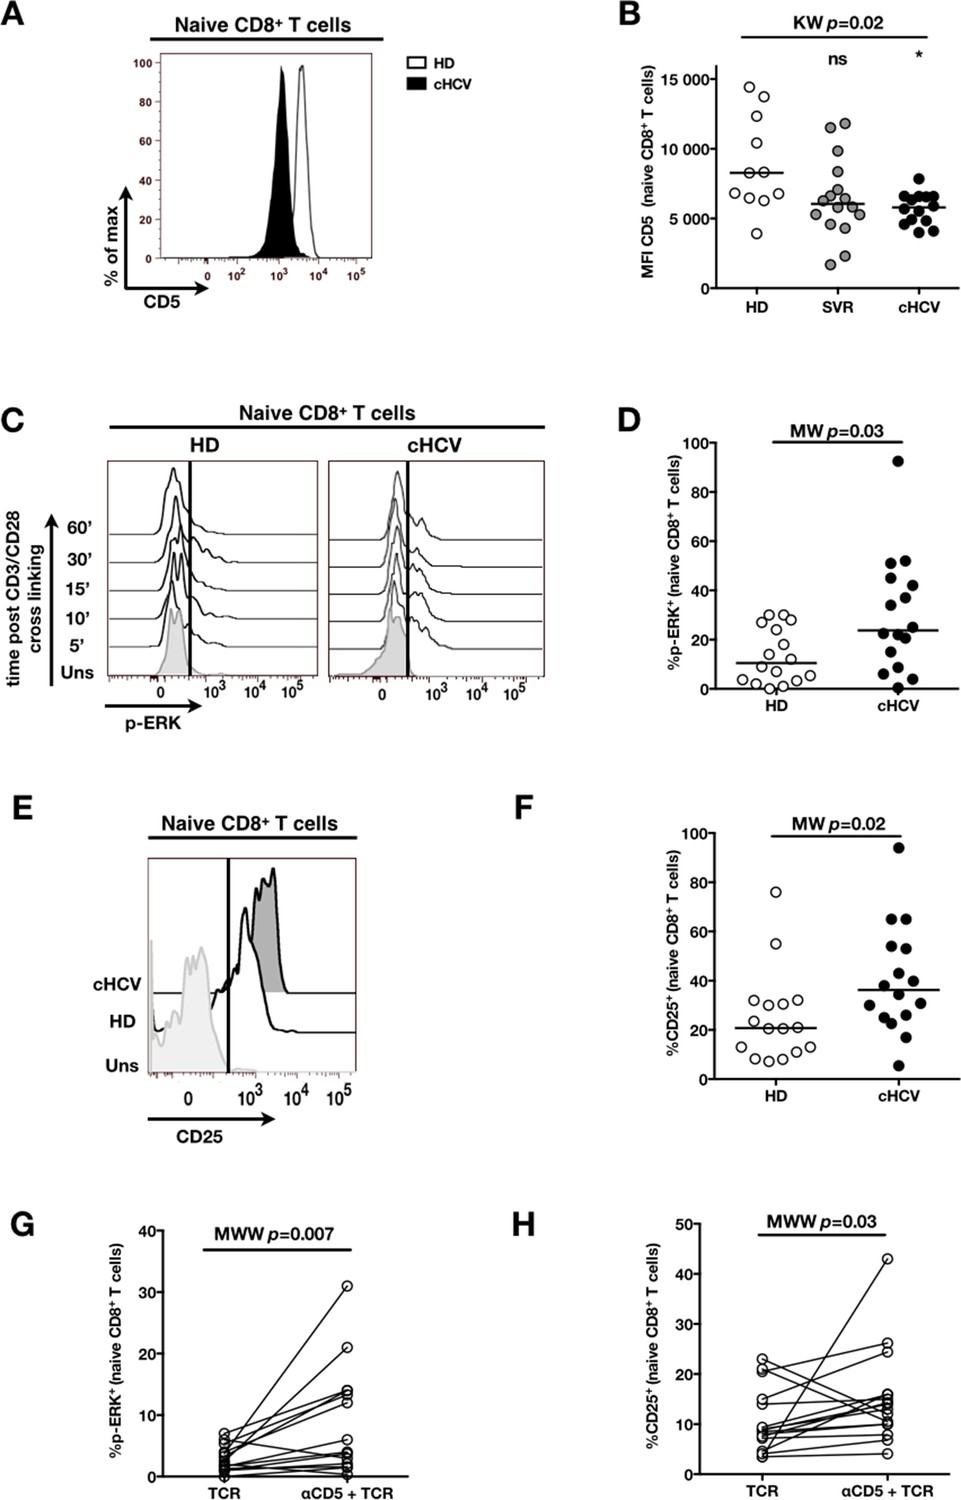
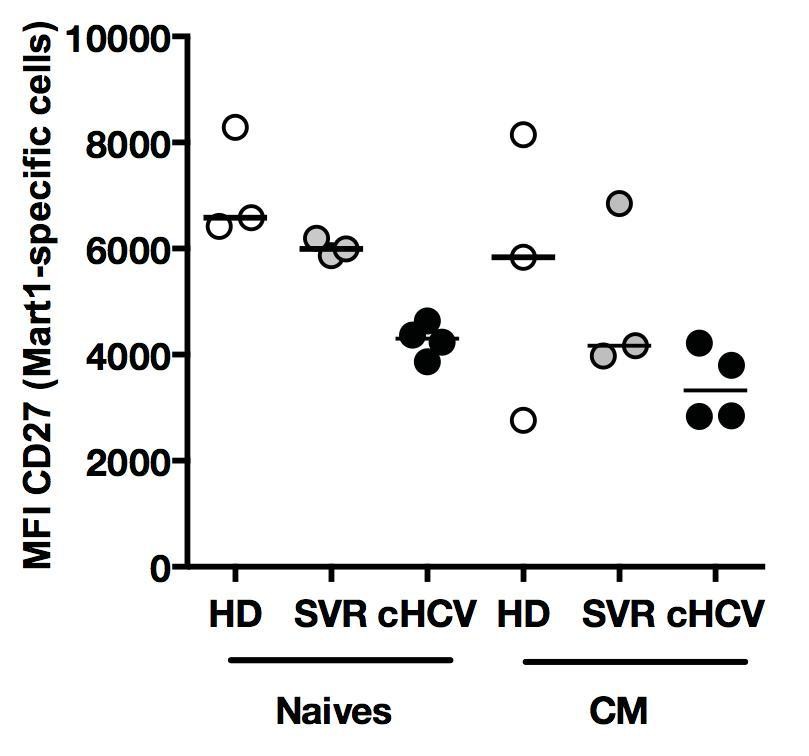
Decreased cell surface expression of CD5 on cHCV naïve CD8+ T cells correlates with hypersensitivity to TCR activation.
(A) Representative histograms of CD5 on naïve CD8+ T cells from one HD and one cHCV patient. (B) MFI of CD5 on the surface of naïve CD8+ T cells from HD, SVR, and cHCV patients. Representative histograms and MFI of CD5 on the other T cell differentiation subsets are provided in Figure 5—figure supplement 1. (C) Representative overlay of histograms of phospho-ERK (p-ERK) signal at different time points following TCR stimulation from one HD and one cHCV patient. Plots are gated on naïve CD8+ T cell populations. (D) Percentages of p-ERK positive cells in naïve CD8+ T cells from HD and cHCV patients 5 min after CD3/CD28 stimulation. (E) Representative overlay of histograms of CD25 expression, detected at 24 hr after TCR stimulation from one HD, and one cHCV patient. Plots are gated on naïve CD8+ T cell populations. (F) Percentages of CD25+ cells in naïve CD8+ T cells from HD and cHCV patients 24 hr after CD3/CD28 stimulation. Representative examples and percentages of active-caspase 3-expressing cells after similar stimulation are provided in Figure 5—figure supplement 2. (G and H) Percentages of p-ERK (5mins), and CD25 (24 hr) after TCR stimulation in naïve CD8+ T cells from HD, with or without prior CD5 blockade with α-CD5 antibodies. Percentages of active-caspase 3-expressing cells under similar conditions are provided in Figure 5—figure supplement 3. Impact of CD5 blockade on TCR activation in cHCV patients is provided in Figure 5—figure supplement 4. Similar evaluation of naïve CD8+ T cell repertoire during chronic HBV infection is provided in Figure 5—figure supplement 5.
Figure 5—figure supplement 1
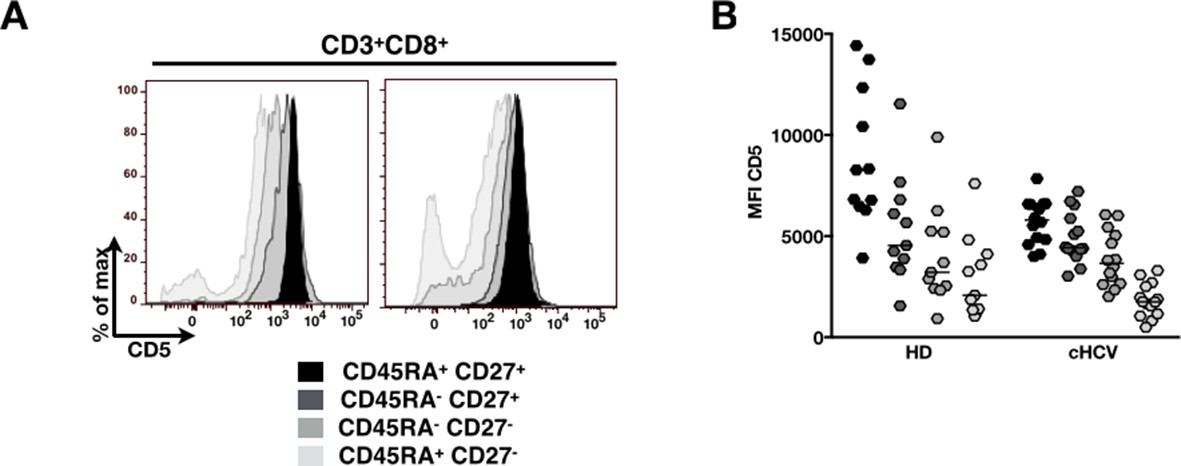
Evolution of MFI of CD5 over T cell differentiation in HD and cHCV patients.
(A) Representative histograms of CD5 in CD8+ T cell differentiation subsets in one HD and one cHCV patient. (B) MFI of CD5 on CD8+ T cell differentiation subsets from HD and cHCV donors.
Figure 5—figure supplement 2
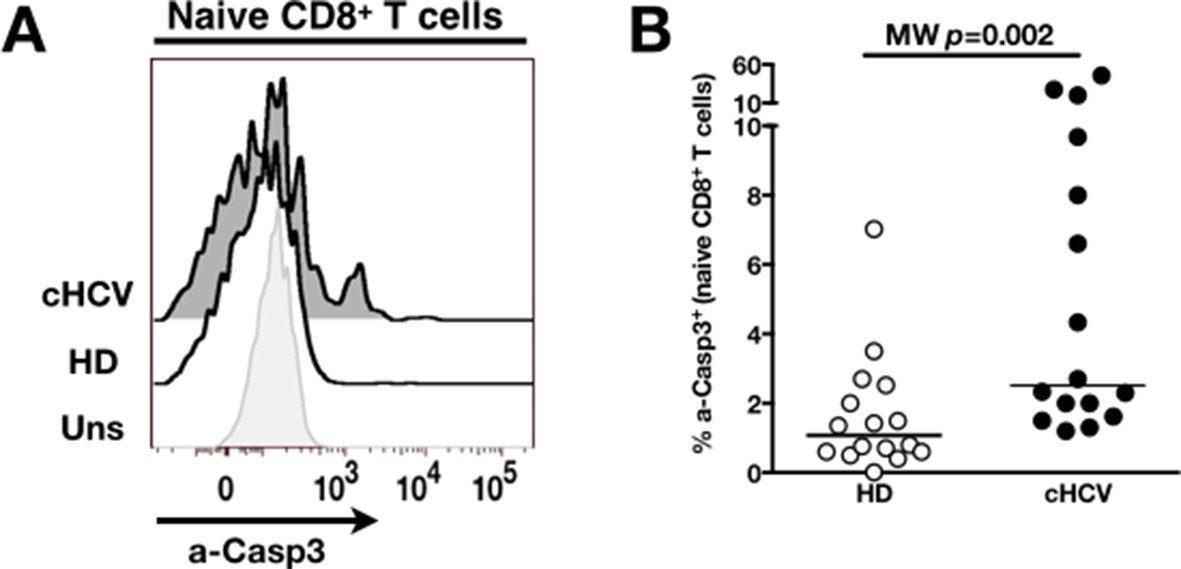
Increased activation-induced cell death after TCR stimulation in cHCV patients.
(A) Representative overlay of histograms of active-caspase 3 (a-Casp3), detected intracellularly at 24 hr after TCR stimulation from one HD, and one cHCV patient. Plots are gated on naïve CD8+ T cell populations. (B) Percentages of a-Casp3+ cells in naïve CD8+ T cells from HD and cHCV patients 24 hr after CD3/CD28 stimulation.
Figure 5—figure supplement 3

CD5 blockade leads to increased activation-induced cell death after TCR stimulation in HD.
Percentages of a-Casp3+ (24 hr) after TCR stimulation in naïve CD8+ T cells from HD, with or without prior CD5 blockade with α-CD5 antibodies.
Figure 5—figure supplement 4
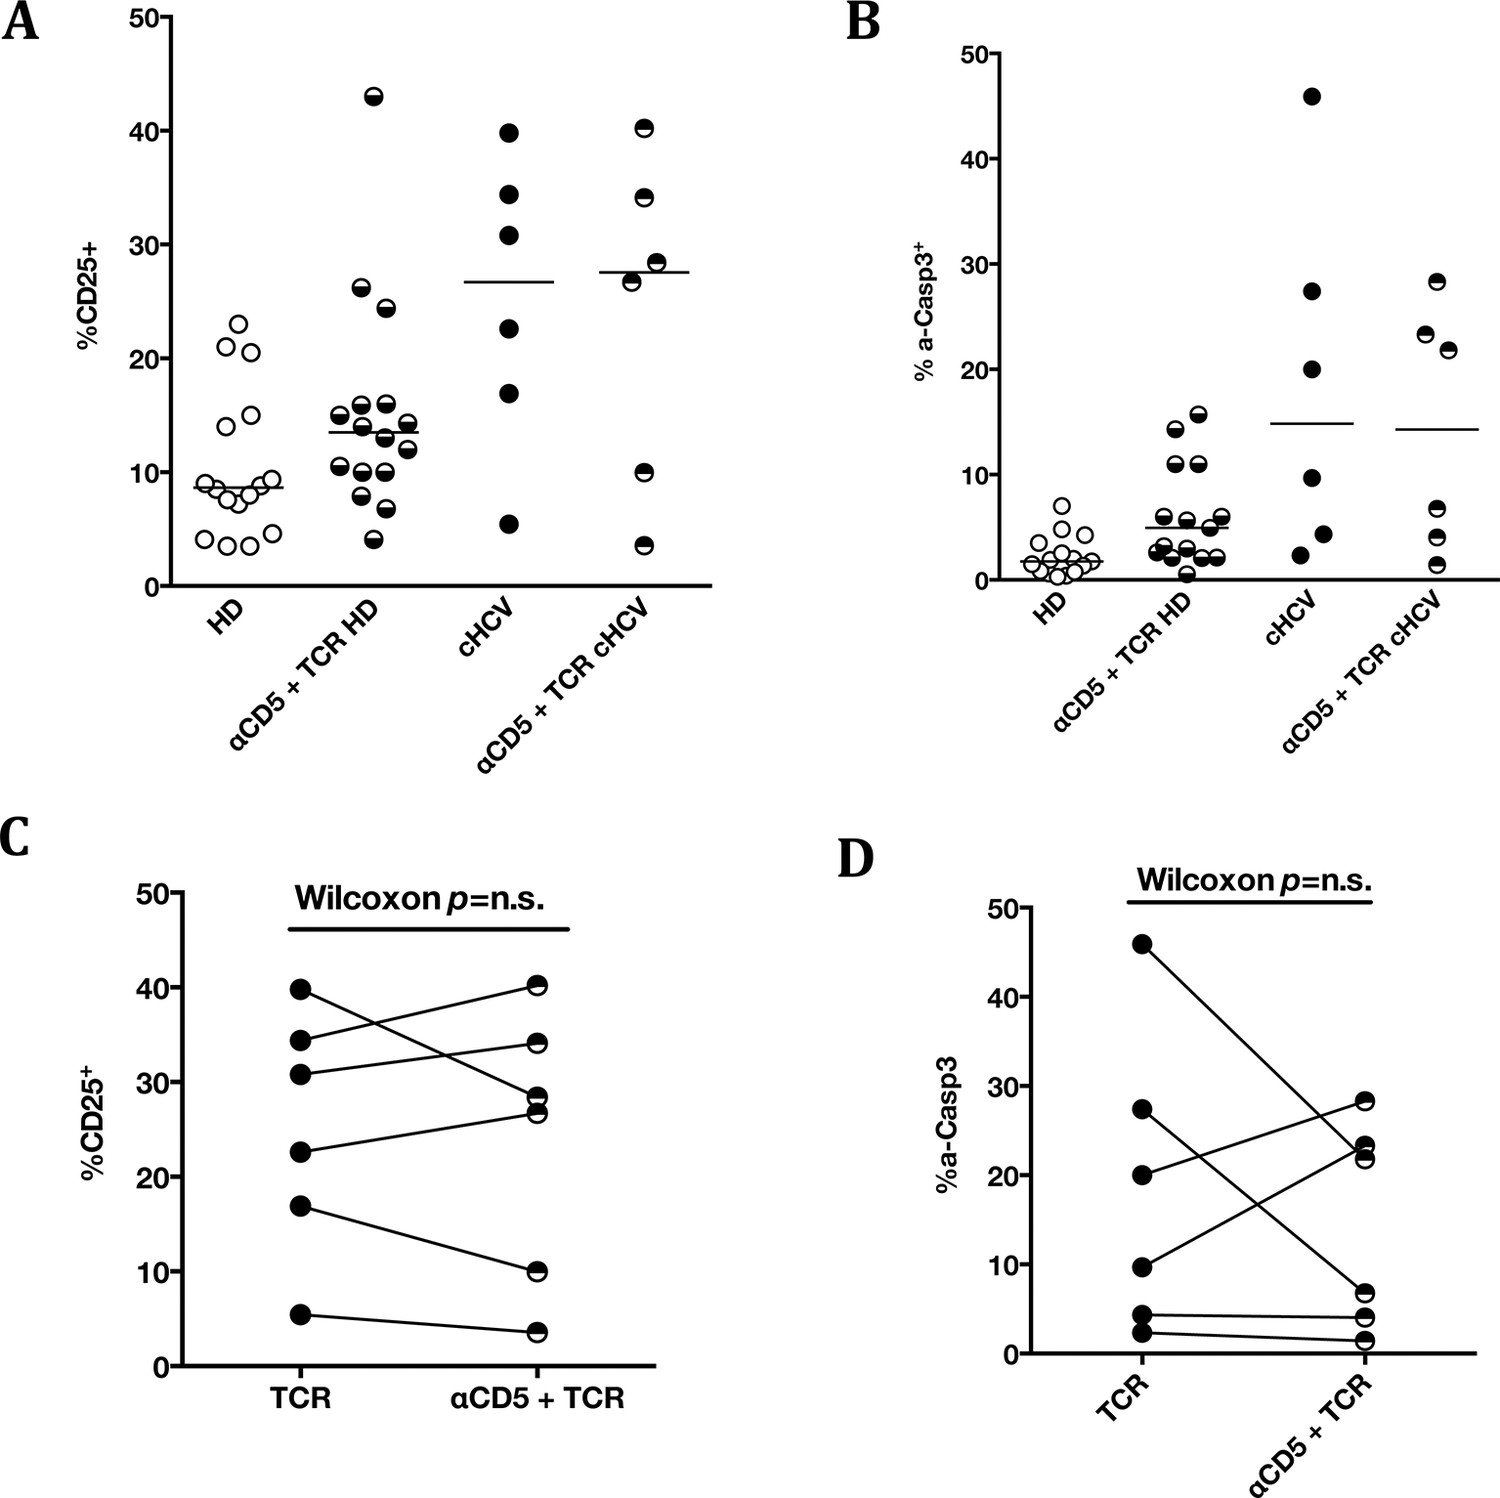
Impact of CD5 blockade on TCR activation in cHCV patients.
Impact of preincubation with anti-CD5 antibodies on% CD25 (A) and% active-caspase 3 (B) after CD3/CD28 stimulation in HD (A and B) and cHCV patients (all patients in A and B, and paired representation for HCV patients in C and D).
Figure 5—figure supplement 5
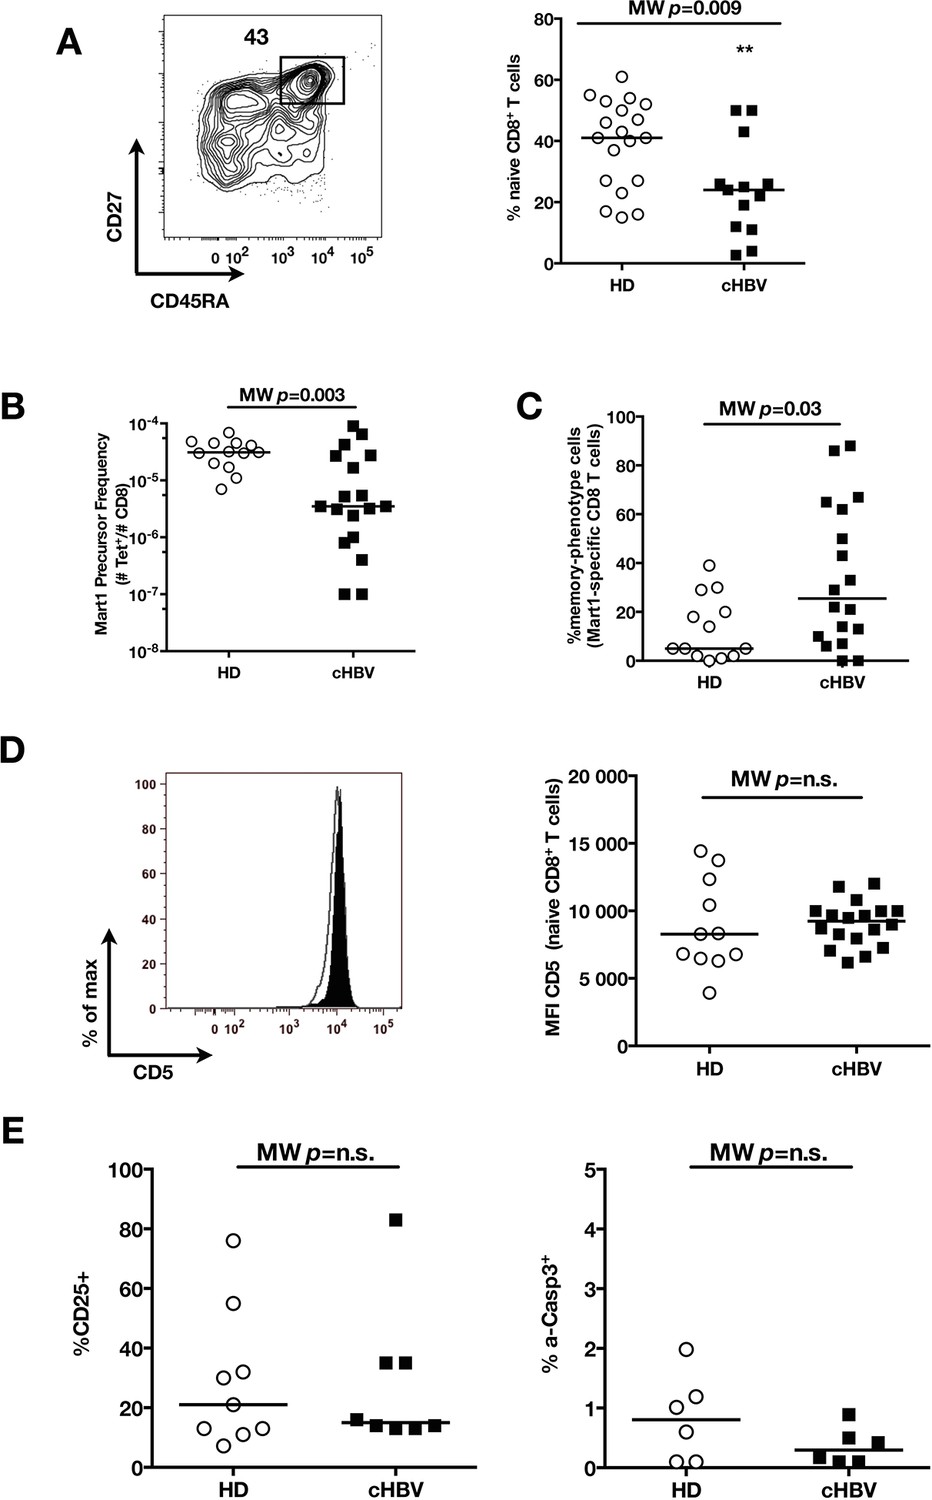
Distinct perturbation of naïve CD8+ T cell repertoire during chronic HBV infection.
(A) Representative example of CD45RA+CD27+ naïve CD8+ compartment in one cHBV patient, and percentages in multiple HD and cHBV donors. Absolute numbers could not be calculated in this cohort where only white blood cells counts were evaluated at the time of their sampling – and not lymphocyte numbers. (B) Mart1 precursor frequency in multiple HD and cHBV donors. (C) Percentages of memory-phenotype Mart1-specific T cells in multiple HD and cHBV donors. (D) Representative histograms of CD5 on naïve CD8+ T cells from one HD (white) and one cHBV patient (black), and MFI of CD5 on naïve CD8+ T cells from HD and cHBV patients. (E) Percentages of p-ERK and CD25-positive cells in naïve CD8+ T cells from HD and cHBV patients 24 hr after CD3/CD28 stimulation.
Figure 6 with 3 supplements
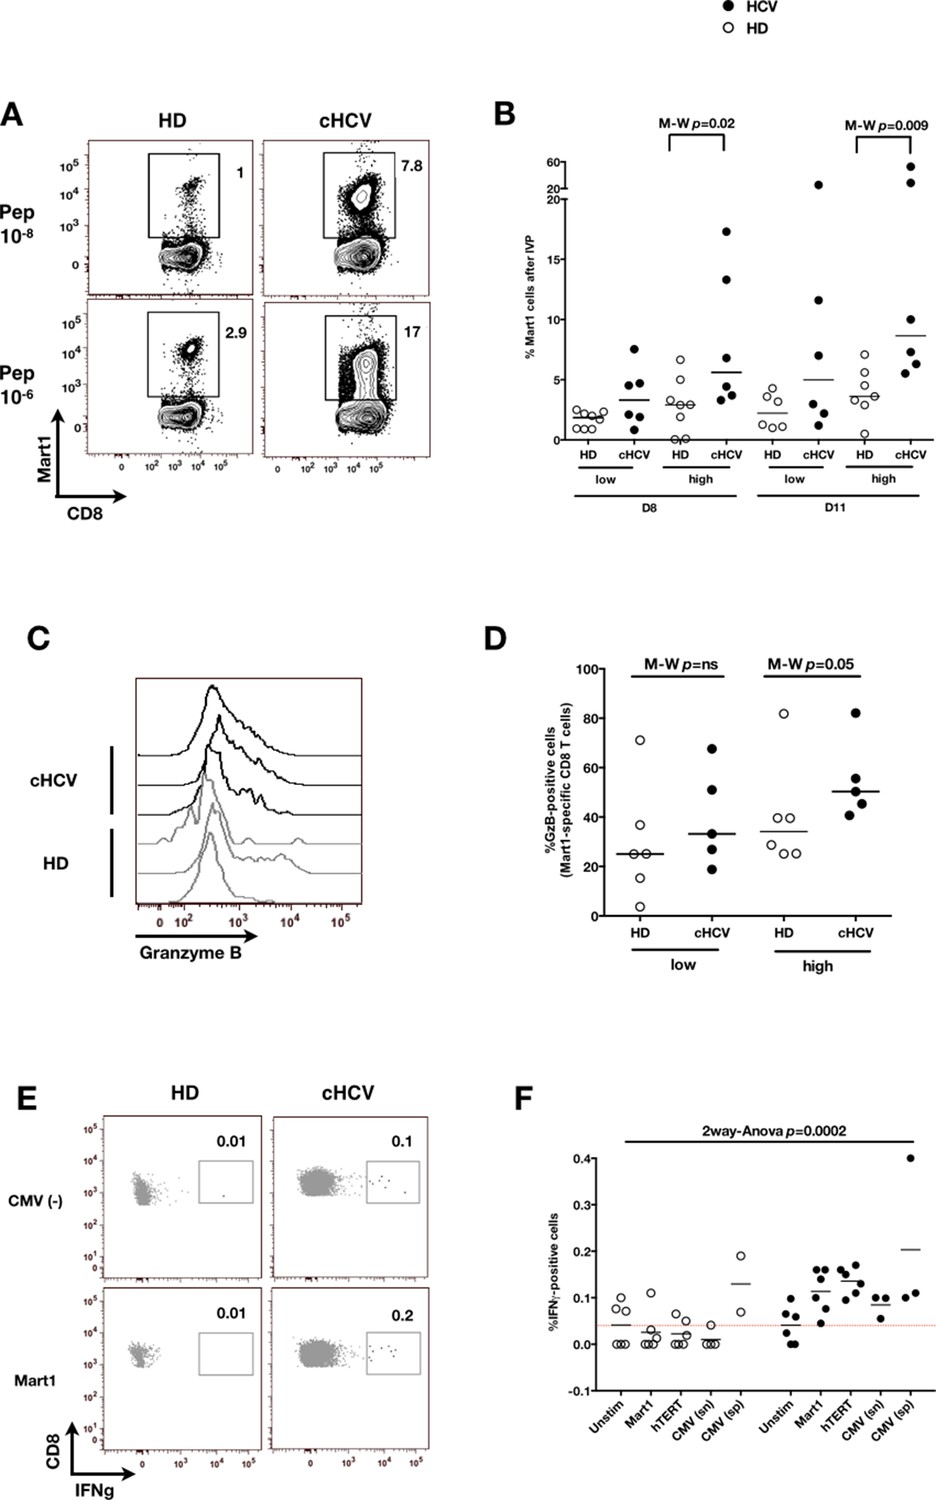
Memory phenotype cells can be expanded to generate robust CD8+ T cell responses.
(A) Examples of Mart1-specific populations expanded from HD and cHCV patients after 8 days of in vitro priming (IVP) with low (10–8, upper line) and high (10–6, bottom line) doses of Mart1 peptide. FACS plots from all donor tested are provided in Figure 6—figure supplement 1. (B) Percentages of Mart1-specific cells expanded after 8 and 11 days of IVP with low and high doses of Mart1 peptide as in A. Proportions of MP cells within those expanded populations are indicated in Figure 6—figure supplement 2. (C) Representative histograms of intracellular granzyme-B expression by Mart1-specific T cells expanded from 3 HD and 3 cHCV after 8 days of IVP with high doses of peptide as in A. (D) Percentages of granzyme-B-expressing Mart1-specific T cells expanded from HD and cHCV patients after 8 days of IVP with low and high doses of Mart1 peptide. Baseline percentages are indicated in Figure 6—figure supplement 3. (E) Representative examples of IFNγ detection intracellularly after in vitro restimulation with CMV or Mart1 peptides in CMV seronegative, tumor-free HD and HCV patients. IFNγ-positive populations are overlaid on total CD8+ T cells. (F) Percentages of cells with IFNγ-positive staining after Mart1-, hTERT-, and CMV- in vitrorestimulation in HD and cHCV patients. sn, seronegative; sp, seropositive.
Figure 6—figure supplement 1
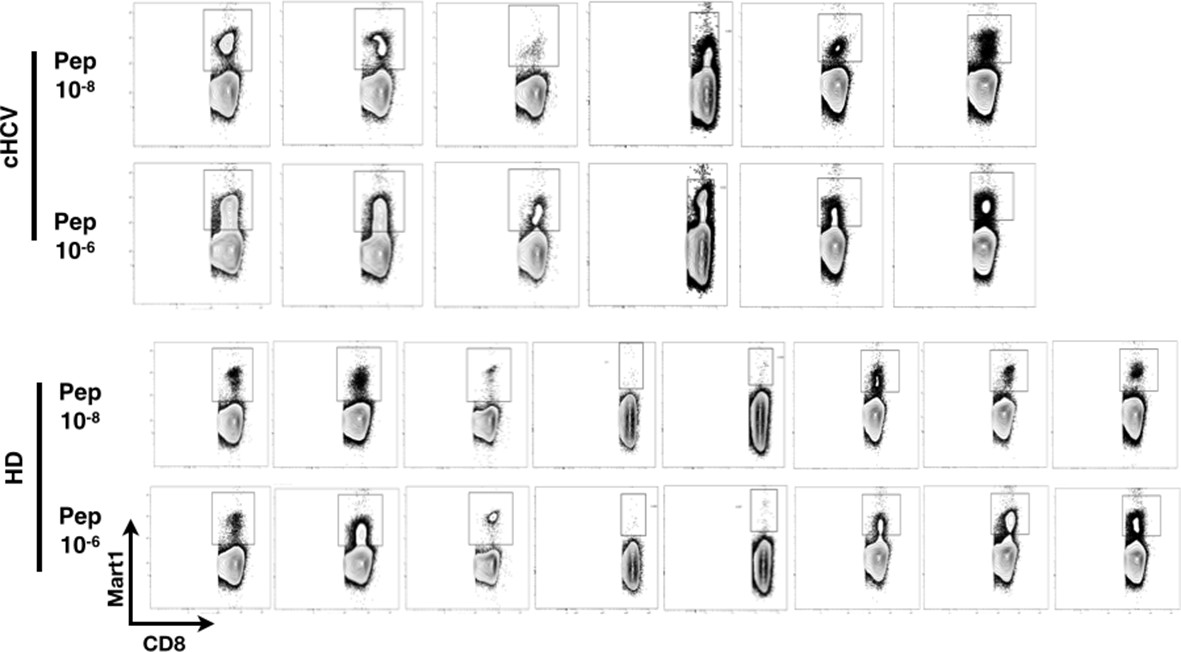
FACS plots of Mart1-specific populations expanded in vitro from cHCV and HD.
FACS plots of Mart1-specific populations (A) and naïve/memory subseting of gated tetramer-positive cells (B) expanded from cHCV and HD patients after 8 days of IVP with low and high doses of Mart1 peptide as in Figure 6A.
Figure 6—figure supplement 2
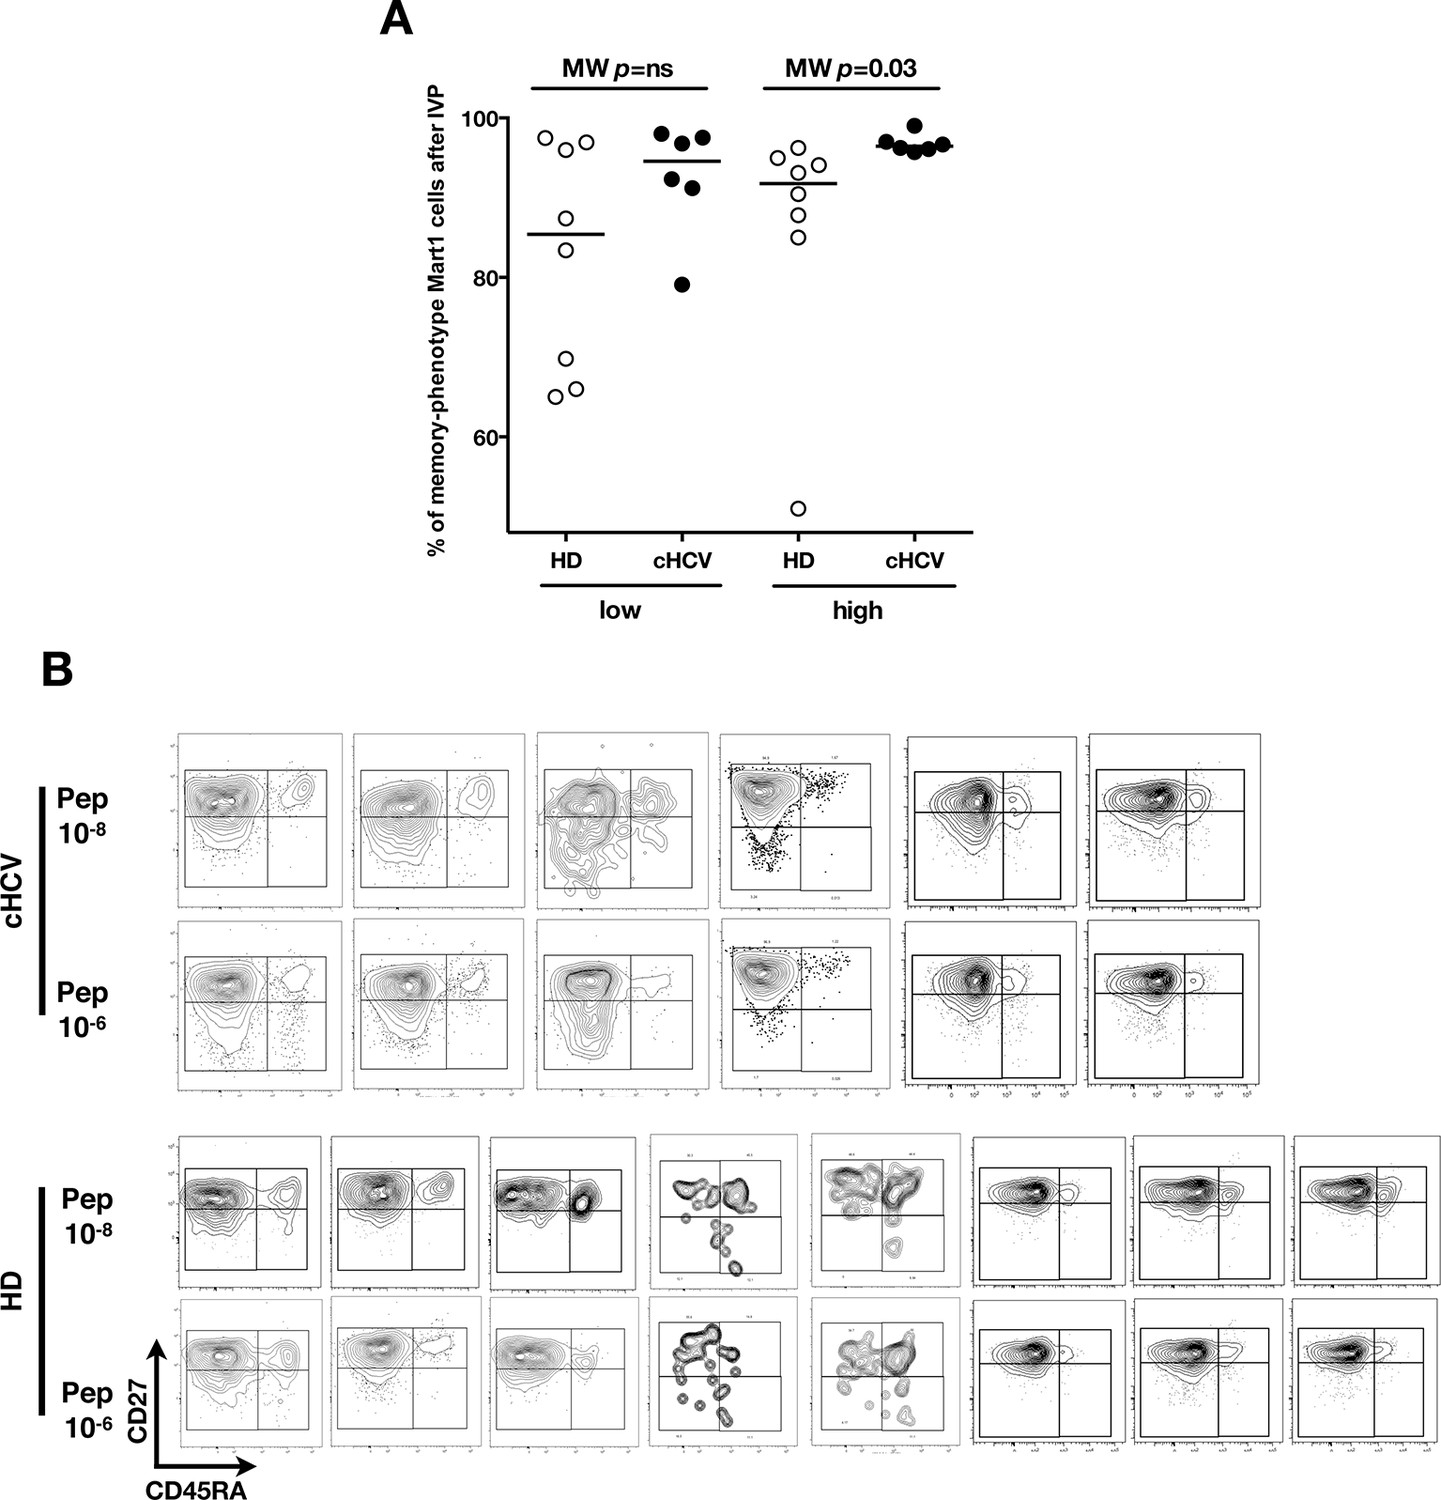
Increased proportions of memory-phenotype cells within Mart1 populations expanded from cHCV patients.
(A) % of memory-phenotype Mart1-specific T cells generated from HD and cHCV after 8 days of IVP as in Figure 6A. (B) FACS plots of naïve/memory subseting of Mart1-specific T cell populations expanded from cHCV and HD patients after 8 days of IVP with low and high doses of Mart1 peptide as in Figure 6A.
Figure 6—figure supplement 3

Baseline proportions of granzyme B-expressing cells in cHCV patients and HD.
Percentages of cells expressing granzyme-B intracellularly at baseline within Mart1-specific CD8+ T cell population (without peptide stimulation) in HD and cHCV patients.
Author response image 1
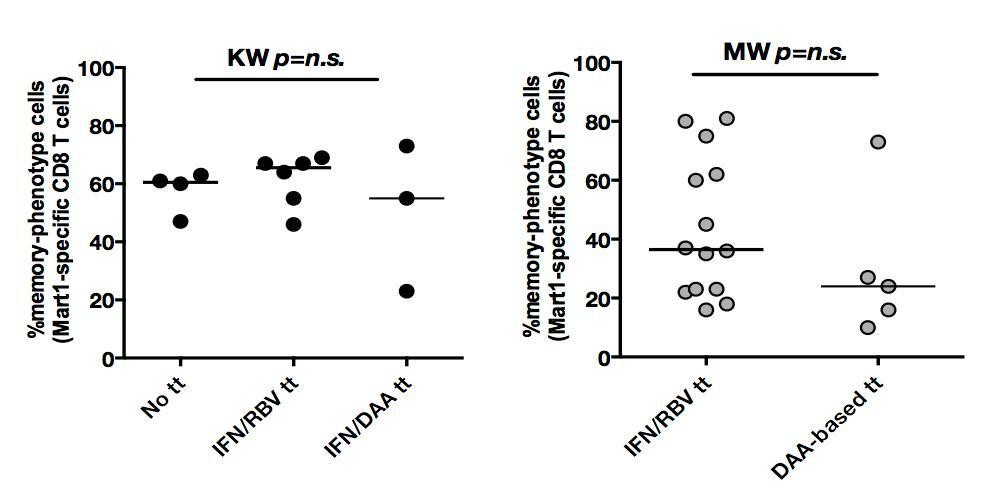
In both cHCV (left) and SVR (right), proportions of memory-phenotype (MP) cells within Mart1-specific populations are not a function of previous drug regimen.
https://doi.org/10.7554/eLife.07916.028
Author response image 2

Evaluation of CD45RA/CD27 gating strategy.
CD45RA+CD27+ naïve CD4+ and CD8+ T cells express the highest levels of CCR7 and lowest level of HLA-DR markers (A). Also, there is a close correlation between CD45RA+CD27+ and CD45RA+CCR7+- gated naïve CD8+ T cells (B).
Author response image 3

Percentages of MP cells within Mart1-specific population is not a function of delay post-treatment in cHCV patients.
https://doi.org/10.7554/eLife.07916.030
Author response image 4

Kinetics of P-ERK and CD25 in naïve T cells from HD and cHCV patients after CD3/CD28 stimulation.
https://doi.org/10.7554/eLife.07916.031
Author response image 5

Impact of CD5 blockade on TCR activation profile in cHCV patients.
(A and B) Impact of preincubation with anti-CD5 antibodies on% CD25 and% active-caspase 3 after CD3/28 stimulation in cHCV patients. (C and D) Summary of impact of anti-CD5 on HD and cHCV patients.
Author response image 6
Phenotype of Ag-specific inexperienced T cells in cHCV patients.
Percentages of naïve, CM, EM, and EMRA – phenotype Ag-specific Mart1-, Ebola-, and HIVspecific T cells enriched from chronic HCV patients.
Author response image 7
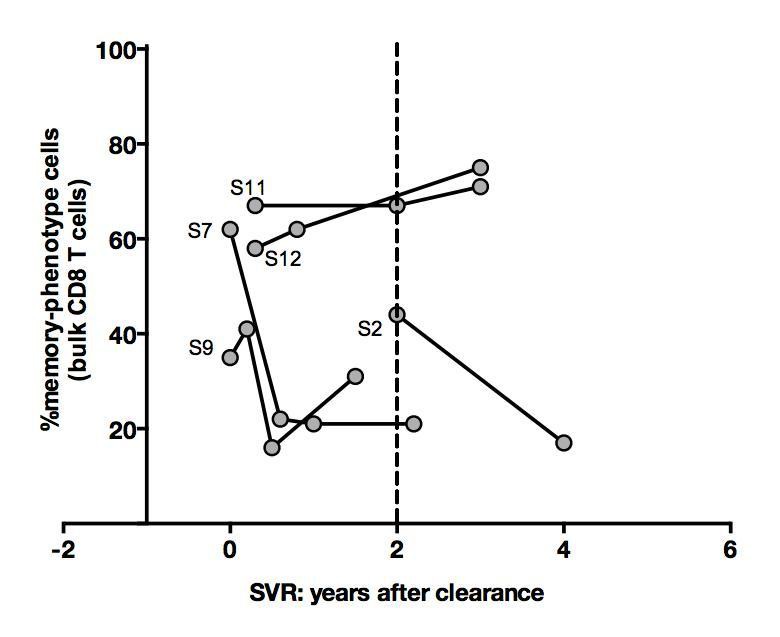
Percentages of memoryphenotype cells within bulk CD8+ T cells over time in SVR patients tested in Figure 4.
https://doi.org/10.7554/eLife.07916.034
Author response image 8

Mart1 precursor frequencies for the HD and cHCV patients included in in vitro priming experiments in Figure 6.
https://doi.org/10.7554/eLife.07916.035Tables
Table 1
Donors included in the study.
| All donors | cHCV | SVR | HD |
|---|---|---|---|
| n=29 | n=37 | n=25 | |
| Male, n (%) | 16 (55) | 21 (57) | 12 (48) |
| Age, years, median (IQR1-3) | 48 (42-55) | 48 (44-58) | 38 (31-46) |
| IgG anti-CMV positive, n (%) | 14 (48) | 24 (51) | 11 (44) |
| Cirrhosis, n (%) | 5 (17) | 8 (22) | na |
| Treatment experienced, n (%) | 18 (62) | 37 (100) | na |
| Treatment (n per type: 0/1/2/3) | 11/12/6/0 | 0/26/10/1 | na |
| Delay post-treatment, years, median (IQR1-3) | 3.8 (3.4-4.2) | 1.7 (0.9-3.2) | na |
Additional files
-
Supplementary file 1
HLA A0201-donors included in the study.
- https://doi.org/10.7554/eLife.07916.025
-
Supplementary file 2
Abs used for flow cytometry experiments.
- https://doi.org/10.7554/eLife.07916.026
-
Supplementary file 3
Oligonucleotides used for Immunoscope assay.
- https://doi.org/10.7554/eLife.07916.027
Download links
A two-part list of links to download the article, or parts of the article, in various formats.
Downloads (link to download the article as PDF)
Open citations (links to open the citations from this article in various online reference manager services)
Cite this article (links to download the citations from this article in formats compatible with various reference manager tools)
Bystander hyperactivation of preimmune CD8+ T cells in chronic HCV patients
eLife 4:e07916.
https://doi.org/10.7554/eLife.07916


