Cancer-associated TERT promoter mutations abrogate telomerase silencing
- University of California, Berkeley, United States
Figures
Figure 1 with 3 supplements
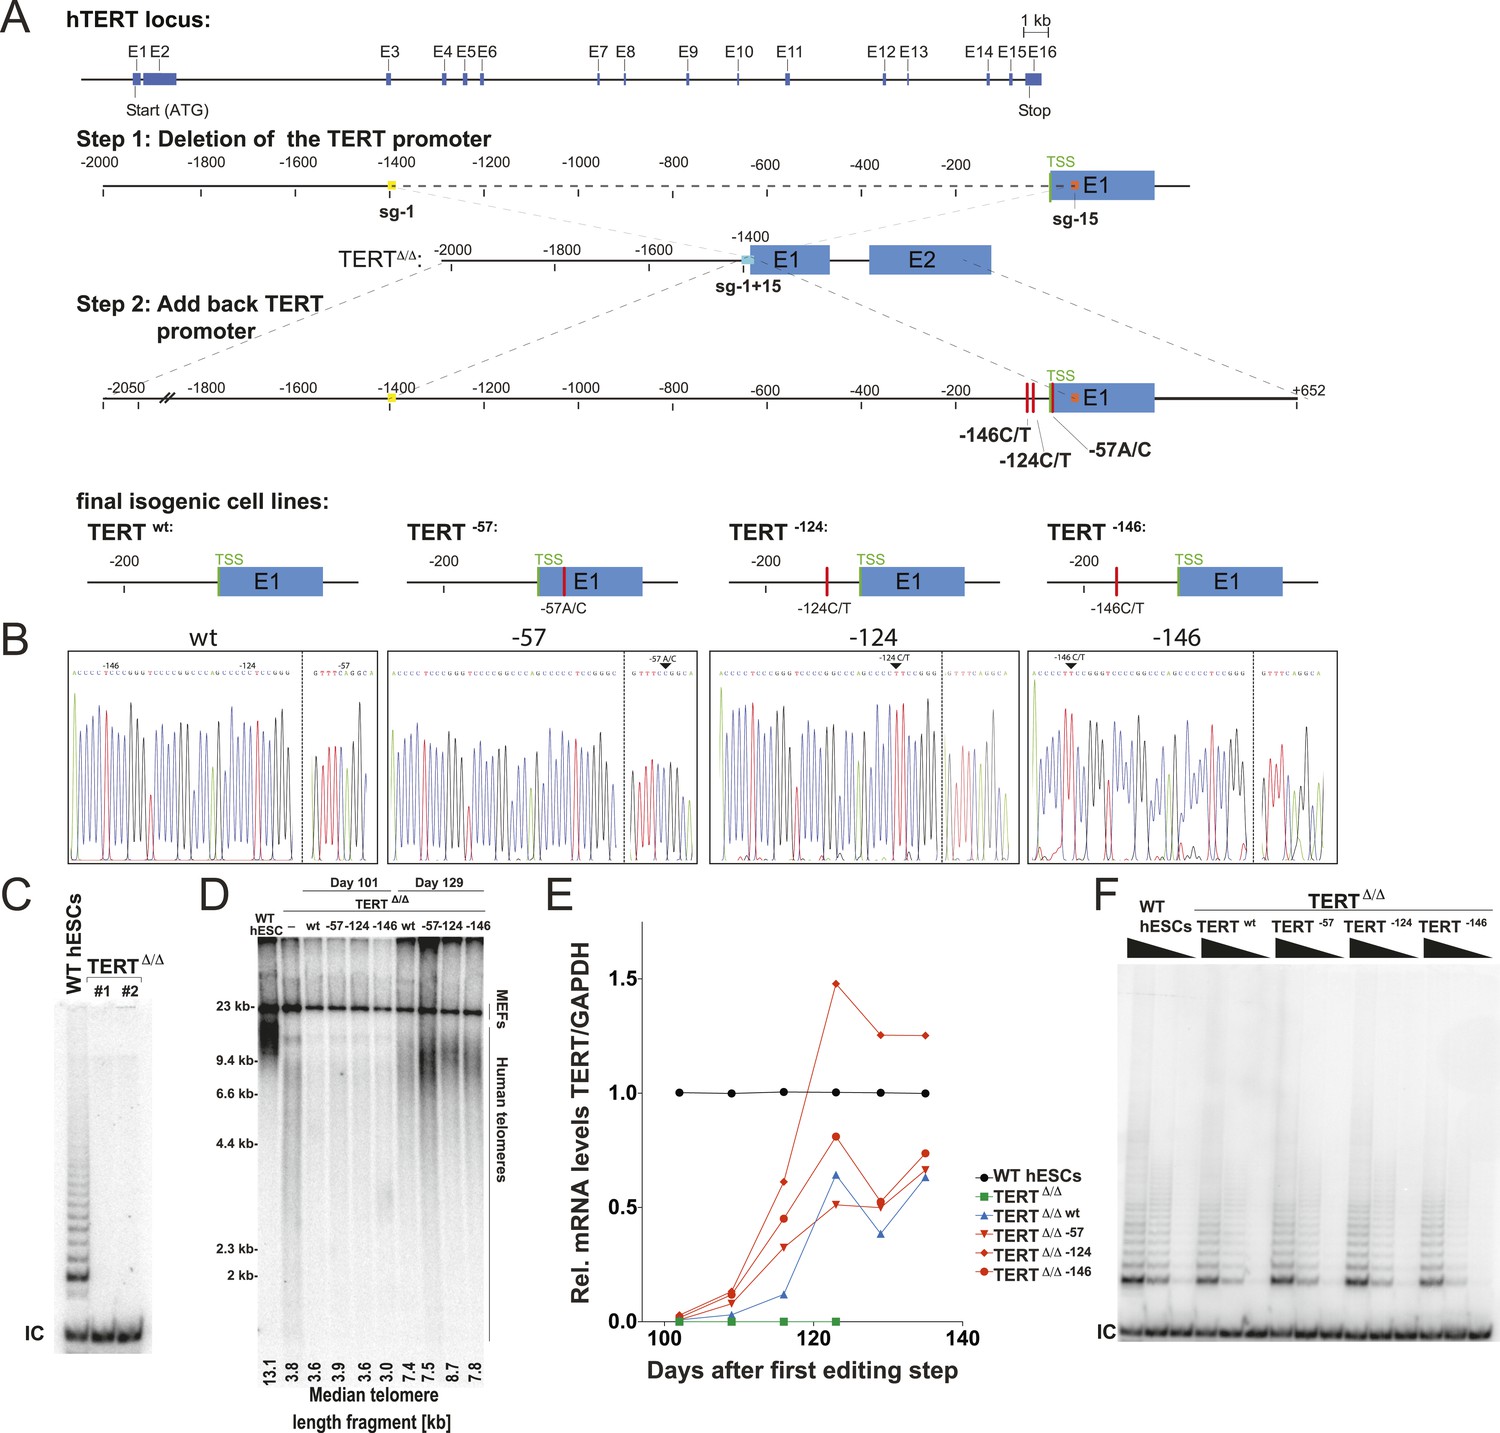
Generation of isogenic TERT promoter mutation-containing hESCs reveals a modest increase of TERT expression only for the −124C/T mutation.
(A) Schematic overview of the two-step approach used to genome-edit TERT promoter mutations in hESCs. First, TERT knock-out cell line (TERTΔ/Δ) that lacks 1.5 kb upstream and 66 bp downstream of the first ATG was established using two CAS9/sgRNAs (sg-1 and sg-15). Second, an sgRNA against the newly synthesized NHEJ-derived junction (−1462 and +67: sg1+15; see Figure 1—figure supplement 1B) were co-electroporated with donor plasmids containing the deleted regions with or without the cancer-associated TERT promoter mutations. (B) Sequence analysis of targeted cells confirmed successful restoration and introduction of the TERT promoter mutations. (C) Telomeric repeat amplification protocol (TRAP) assay of whole cell extracts from TERTΔ/Δ hESC lines (n = 2) using 200 ng protein. TERTΔ/Δ #1 and #2 cells were collected at day 89 and day 146 after the first editing respectively. IC: internal control. (D) Telomere restriction fragment assay of wild-type (WT), TERTΔ/Δ, and the targeted hESCs over a time course after targeting (day 0: first editing step, day 73: second editing). TERTΔ/Δ #1 cells are telomerase-deficient, undergo telomere shortening and die around day 120 unless they regain telomerase activity through the second targeting step. At the first time point (day 101), the majority of the cells are untargeted TERTΔ/Δ cells, therefore telomere length is heterogeneous and short. This short telomere length results in reduced hybridization intensity with the TTAGGG radioactive probe. In contrast at the second time point (day 129), uncomplemented TERTΔ/Δ #1 died due to progressive telomere shortening and the targeted populations are enriched. In this targeted population the restoration of telomerase resulted in substantial telomere elongation and an overall increase in telomere signal intensity. 2 µg of genomic DNA after digestion with MboI and AluI were loaded in each lane. Quantification of the average telomere length signal is indicated at the bottom of the gel. Throughout all figures we refer to non-targeted wild-type WIBR#3 hESCs as WT. We refer to wild-type cells generated by reintroducing the wild-type promoter into TERTΔ/Δ as wt. (E) Relative expression levels of TERT mRNA by mutant and wt promoter-containing hESCs over a time course after targeting measured by quantitative RT-PCR. Expression is relative to WT hESCs (black line). Expression of TERT was normalized to GAPDH. Also shown is TERTΔ/Δ cells (green line) until day 123. This is the last time point in which RNA could be isolated before TERTΔ/Δ cultures died. (F) TRAP assay of whole cell extracts from WT and promoter mutation-containing hESCs (day 147) using decreasing amount of protein (200, 40, 8 ng).
Figure 1—figure supplement 1
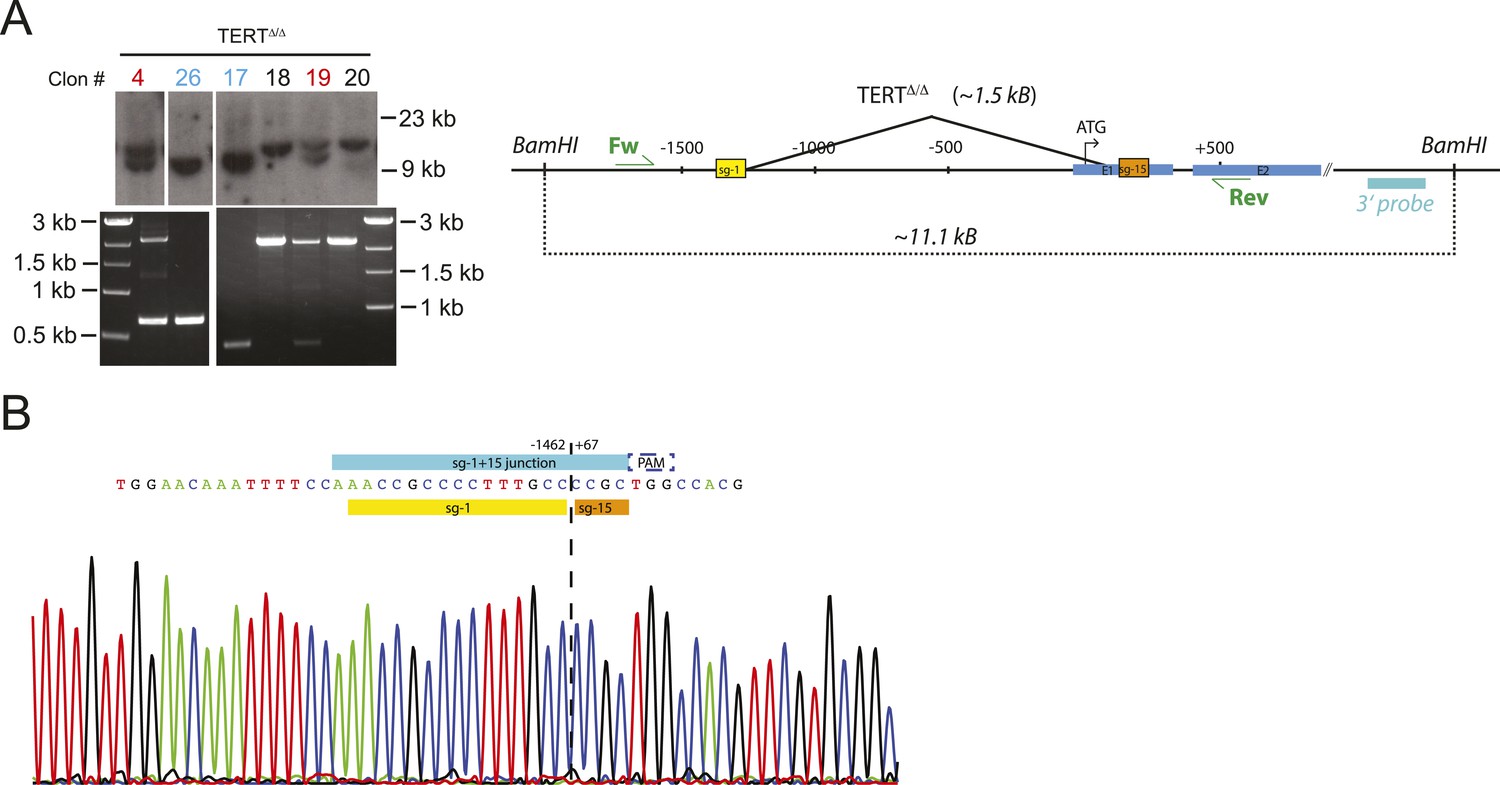
Genotyping of TERTΔ/Δ hESCs prior to the second targeting that introduced the mutated promoter sequences.
(A) Southern blot analysis for TERTΔ/Δ hESCs. Genomic DNA isolated form individual clones was digested with BamHI and hybridized with the 3′ probe (the top panel). The correctly targeted allele appears as a 9.5 kb band and the untargeted wild type allele is 11 kb. Homozygous targeted hESC clones are shown in blue, heterozygous targeted clones are in red, and untargeted clones are in black. The parental cell lines used for the second targeting, TERTΔ/Δ and TERTΔ/Δ#2, are clone #26 and #17 respectively. The correct deletion events were also confirmed by PCR using external primers (bottom panel). (B) The newly formed NHEJ-derived junction of the deleted region in the homozygous targeted lines TERTΔ/Δ and TERTΔ/Δ #2 was determined by sequencing. The sgRNA for the second targeting was designed across the junction (sg-1+15).
Figure 1—figure supplement 2
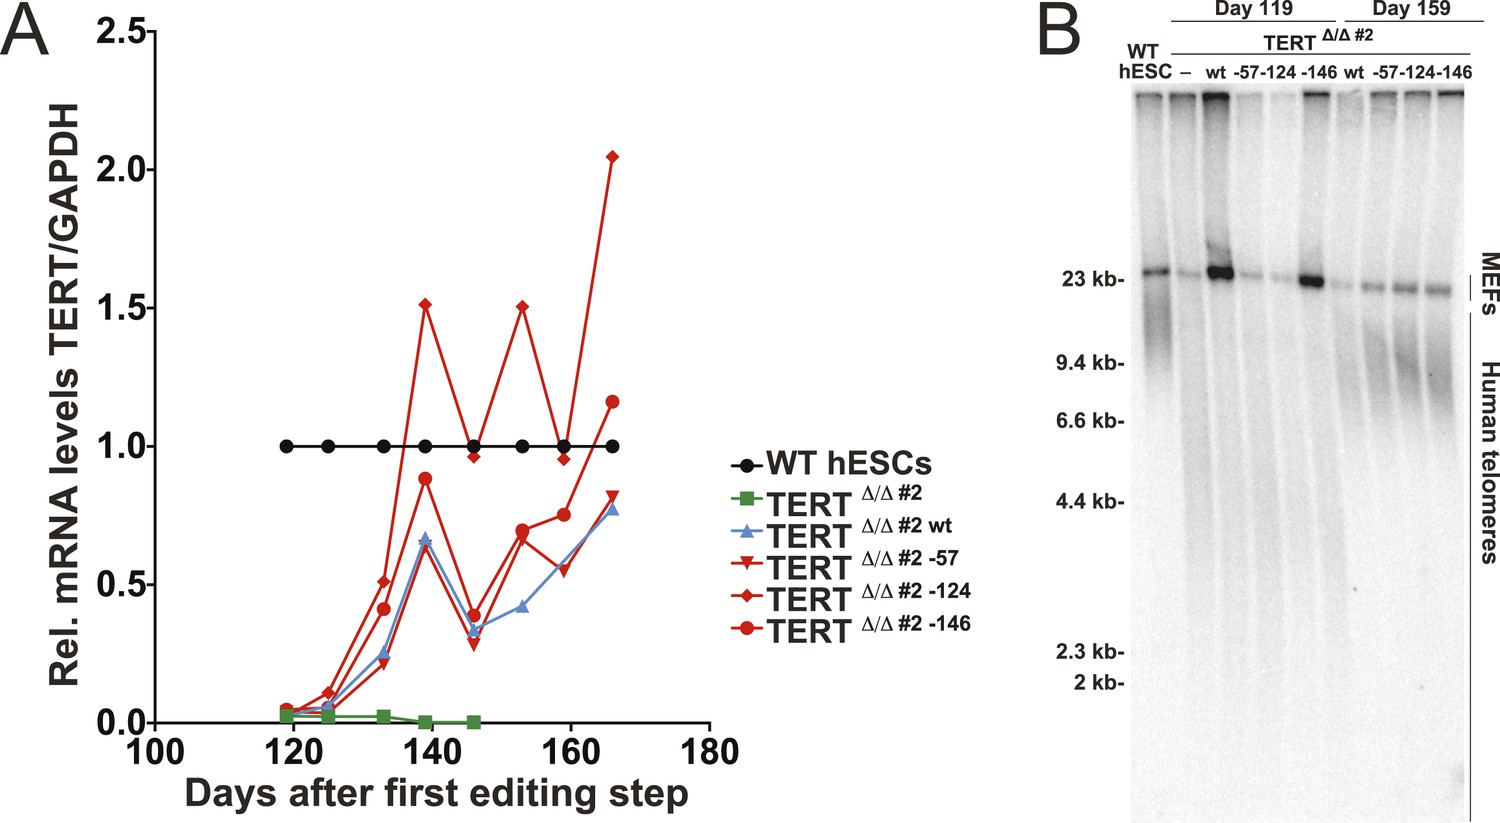
Independent confirmation of promoter mutation experiments (shown in Figure 1C,D) using an independent TERTΔ/Δ#2 cell line.
(A) Relative expression levels of TERT mRNA of mutant and wt promoter-containing hESCs (TERTΔ/Δ #2) over a time course after targeting measured by quantitative RT-PCR. Expression of TERT was normalized to GAPDH. (B) Telomere restriction fragment assay of WT, TERTΔ/Δ#2 and the targeted hESCs over a post-targeting time course (day 0: first editing; day 86: second editing).
Figure 1—figure supplement 3
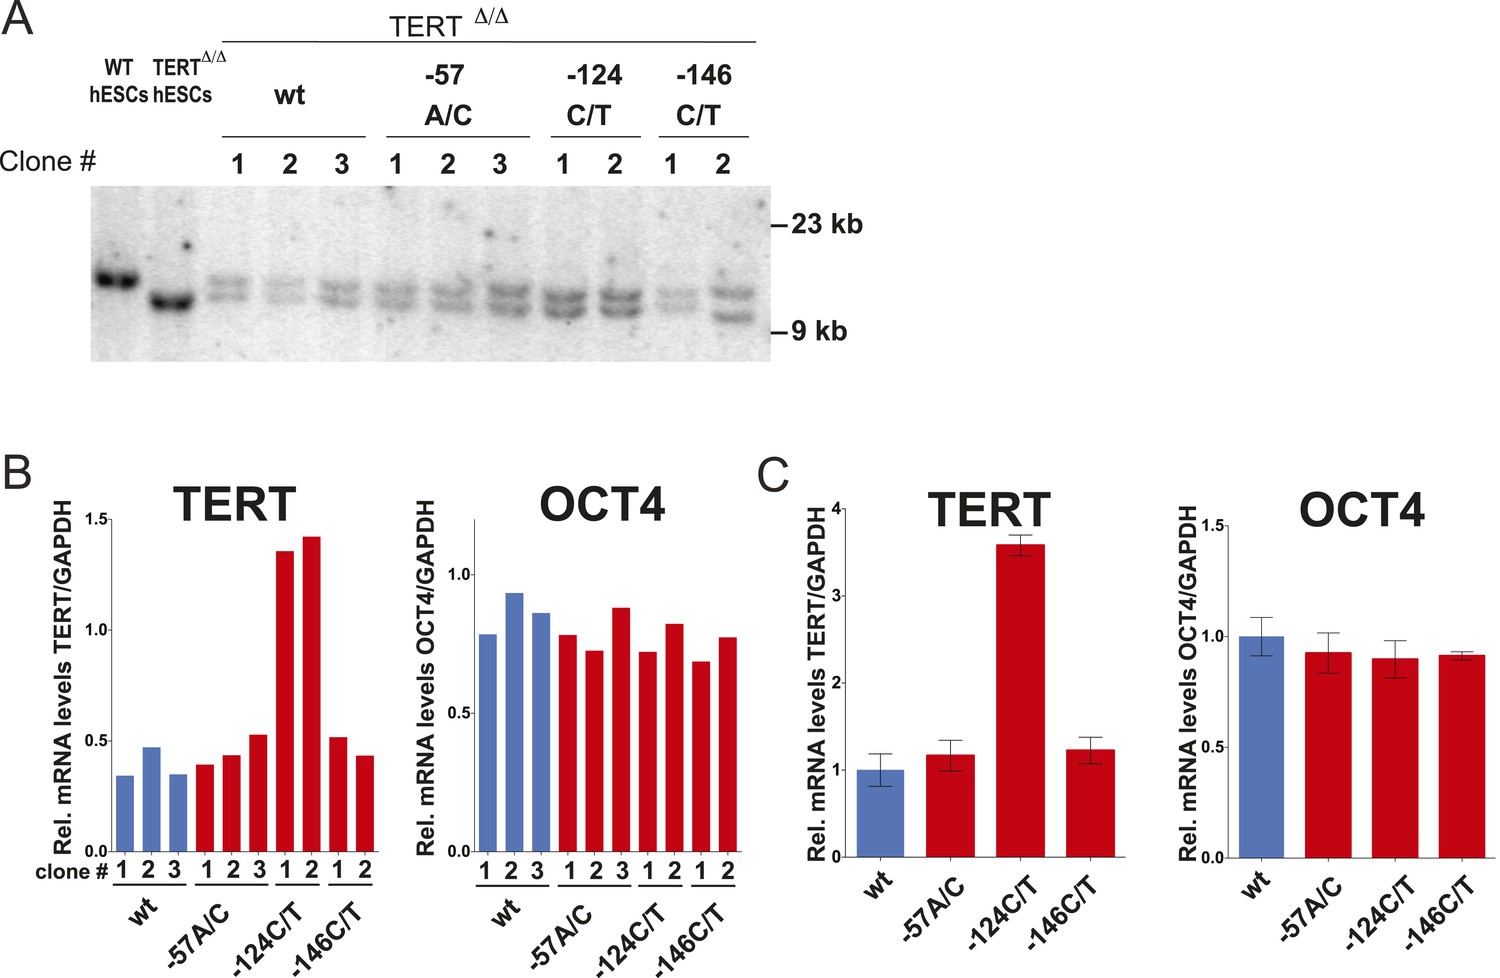
The clonal analysis of TERT promoter mutation containing hESCs confirmed the results of the bulk analysis.
(A) Southern blot analysis for TERTΔ/Δ hESCs clones. The correctly targeted allele appeared as a 11 kb band at the size of WT hESCs and the untargeted allele as 9.5 kb at the size of parental TERTΔ/Δ hESCs. (B) Quantitative RT-PCR of TERT and OCT4 in individual clones of the targeted hESCs. Expression levels are shown relative to WT hESCs and normalized to GAPDH. (C) Average expression of the data shown in (B). Expression levels are compared to TERTΔ/Δ wt hESC clones. Error bars represent the SEM.
Figure 2 with 1 supplement
Telomerase activity is restricted by levels of TERT in differentiated cells while TR is limiting in wild-type hESCs.
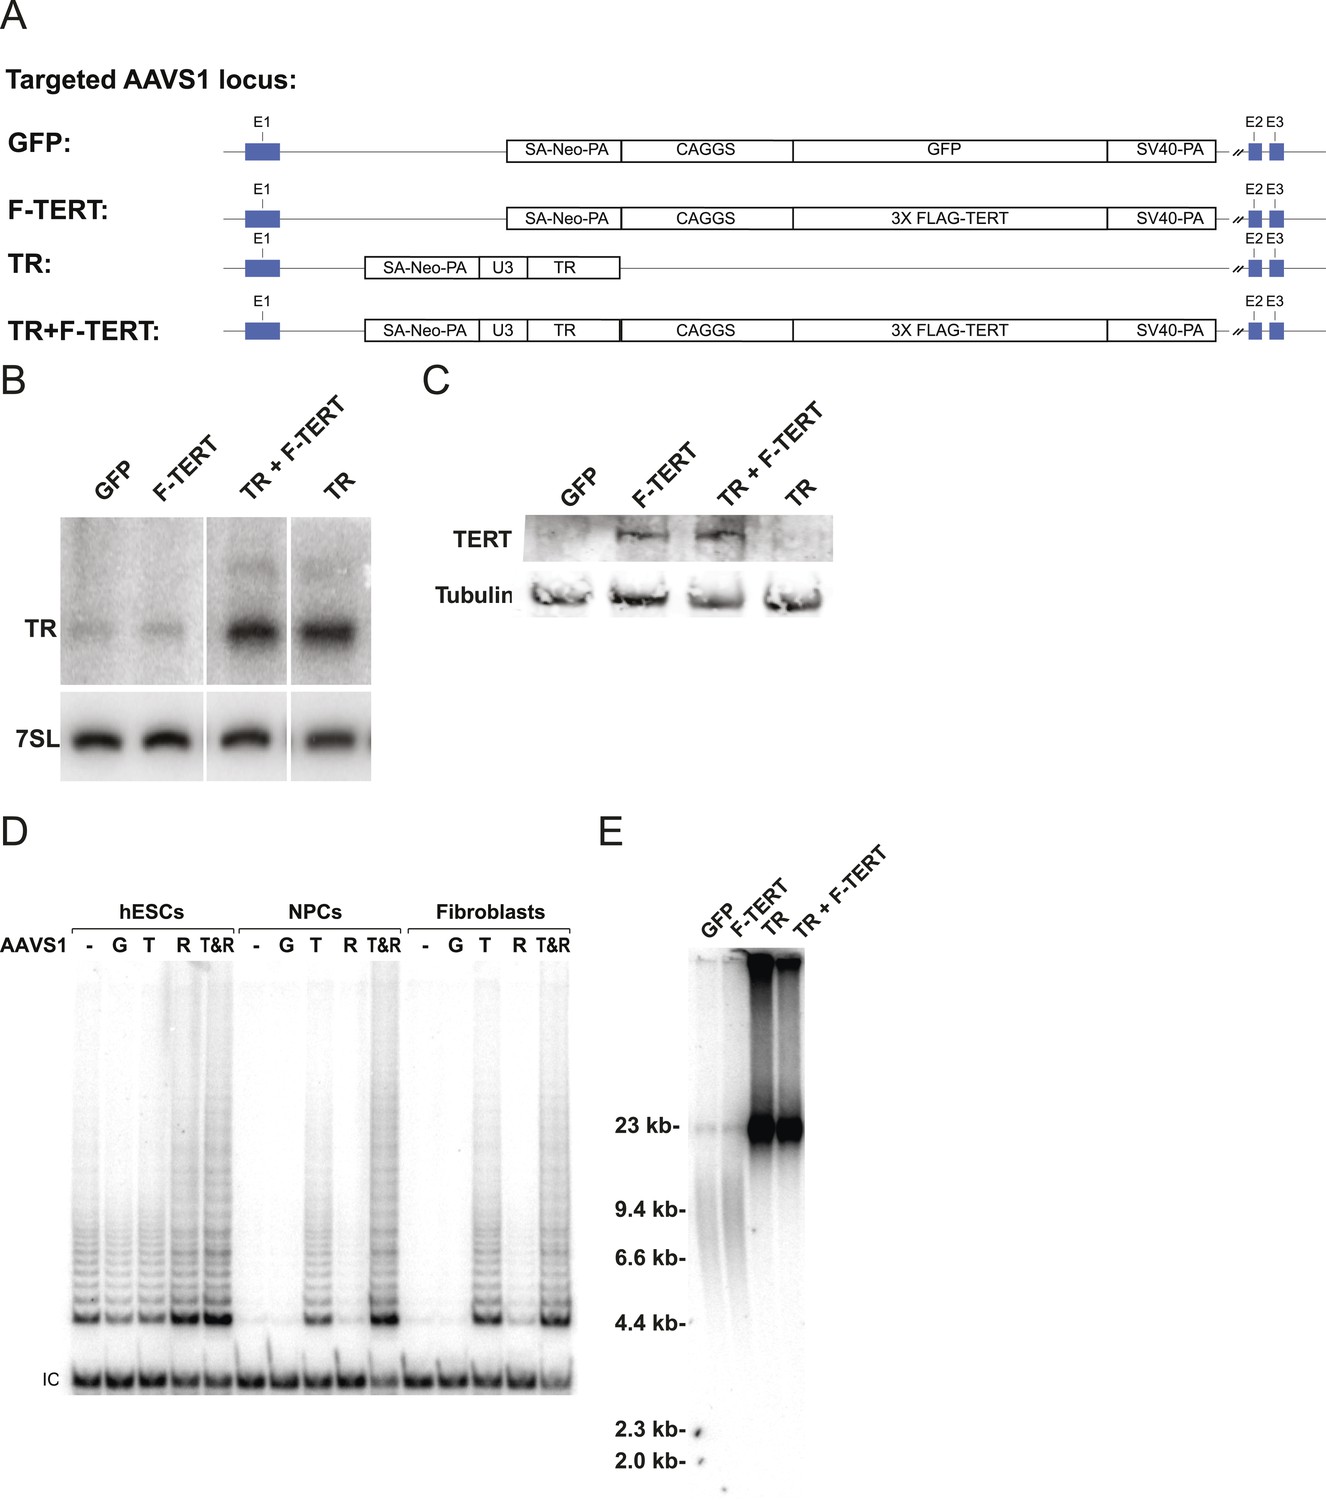
(A) Targeting schematic of GFP, 3XFLAG-TERT (F-TERT), TR, and F-TERT+TR overexpression from the AAVS1 locus in wild-type hESCs. (B) Northern blot detection of total TR and 7SL in targeted hESC lines. TR runs as a doublet in UREA PAGE. (C) SDS-PAGE immunoblot of total TERT and tubulin proteins in editing hESC lines from whole cell extract. (D) TRAP assay of whole cell extracts from NPCs and fibroblast-like cells differentiated from GFP (G), F-TERT (T), TR (R), or F-TERT+TR (T&R) overexpressing hESCs using 200 ng protein. (E) Telomere restriction fragment assay of GFP, F-TERT, TR, and F-TERT+TR overexpressing hESCs.
Figure 2—figure supplement 1
Quantification of TERT and TR expression levels and telomerase activity in the overexpression hESCs.
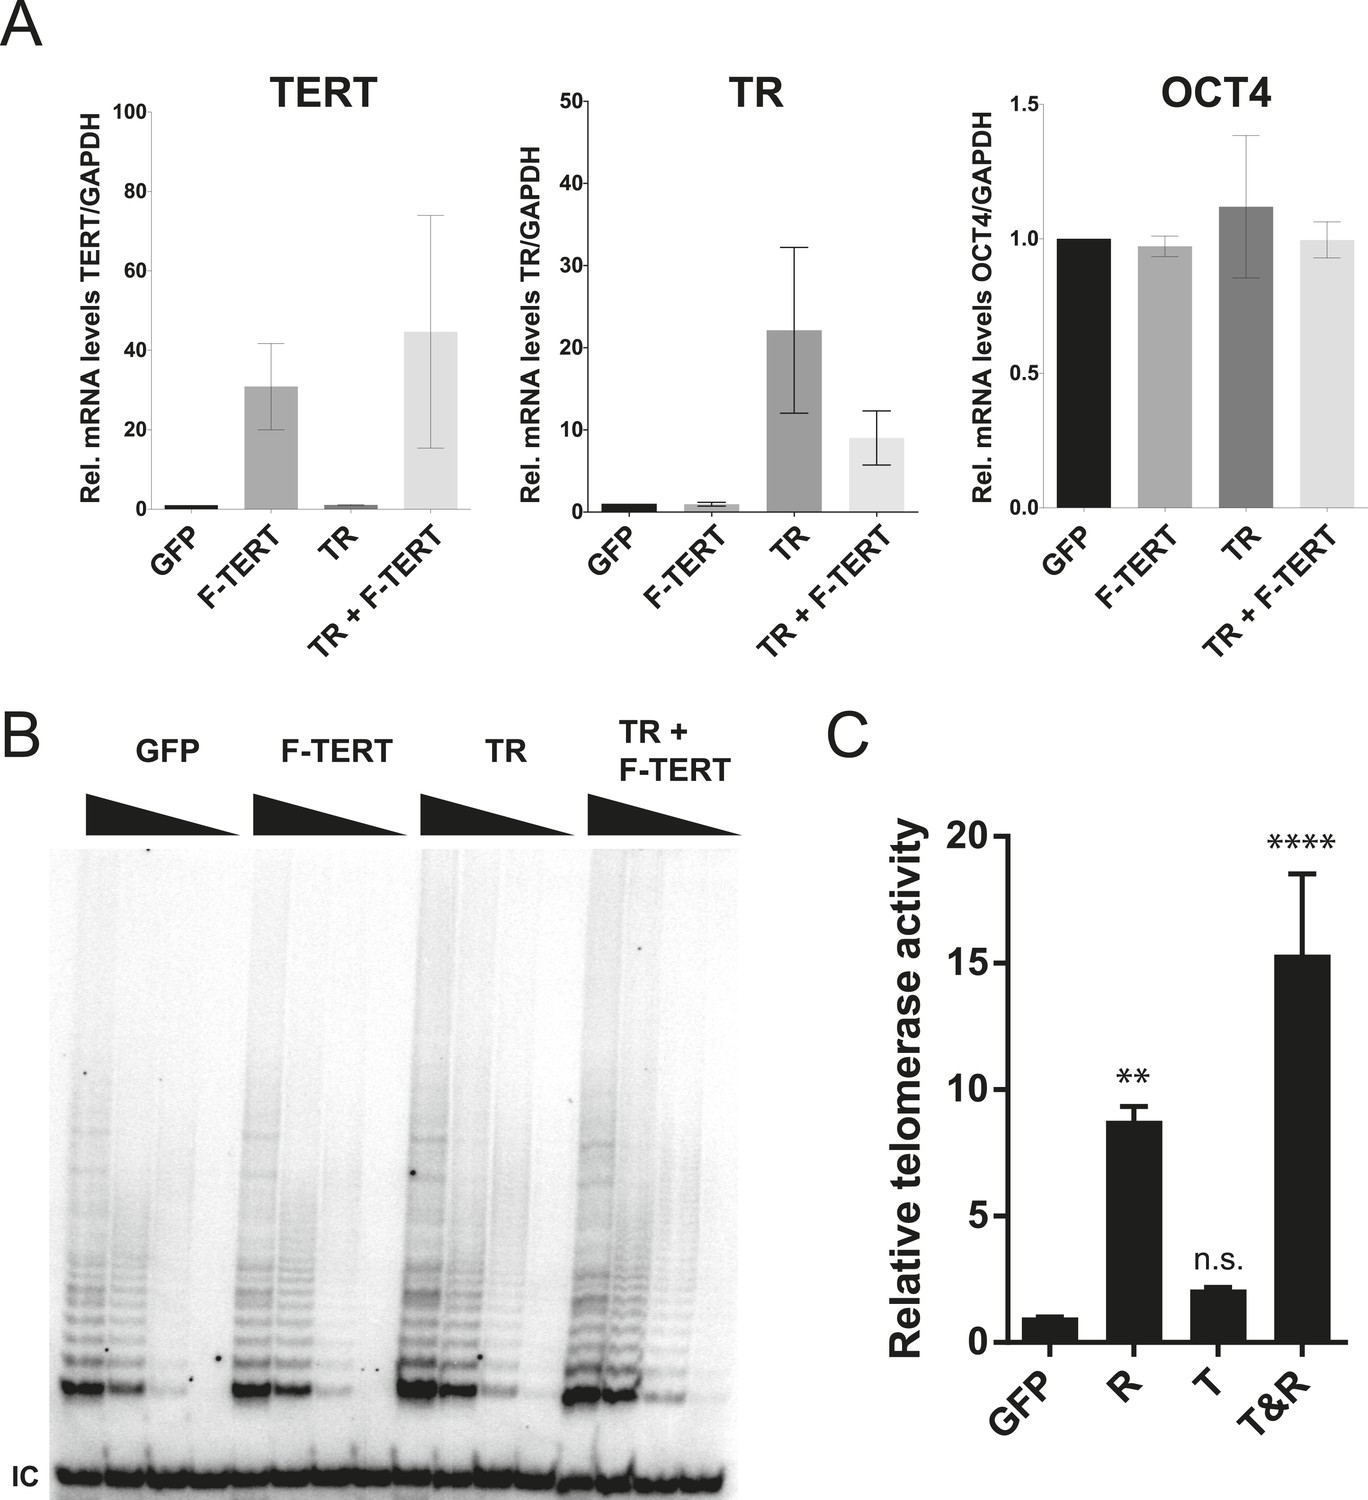
(A) Quantitative RT-PCR of TERT, TR, and OCT4 in GFP, F-TERT, TR, or F-TERT+TR overexpressing hESCs. Expression level is relative to GFP hESCs and normalized to GAPDH. Error bars represent the SEM of three biological replicates taken 1 week apart. (B) TRAP assay of whole cell extracts from GFP, F-TERT, TR, or F-TERT+TR overexpressing hESCs using decreasing amount of protein (250, 50, 10, 2 ng). (C) Relative telomerase activity of the hESC lines was assayed by QTRAP. Values were set as fold activity relative to the GFP control line (n = 3, ANOVA with Tukey's test, SEM bars). R: TR, T: F-TERT and T&R: F-TERT+TR.
Figure 3 with 2 supplements
Fibroblasts carrying cancer-associated TERT promoter point mutations failed to silence TERT expression upon differentiation and have telomerase activity.
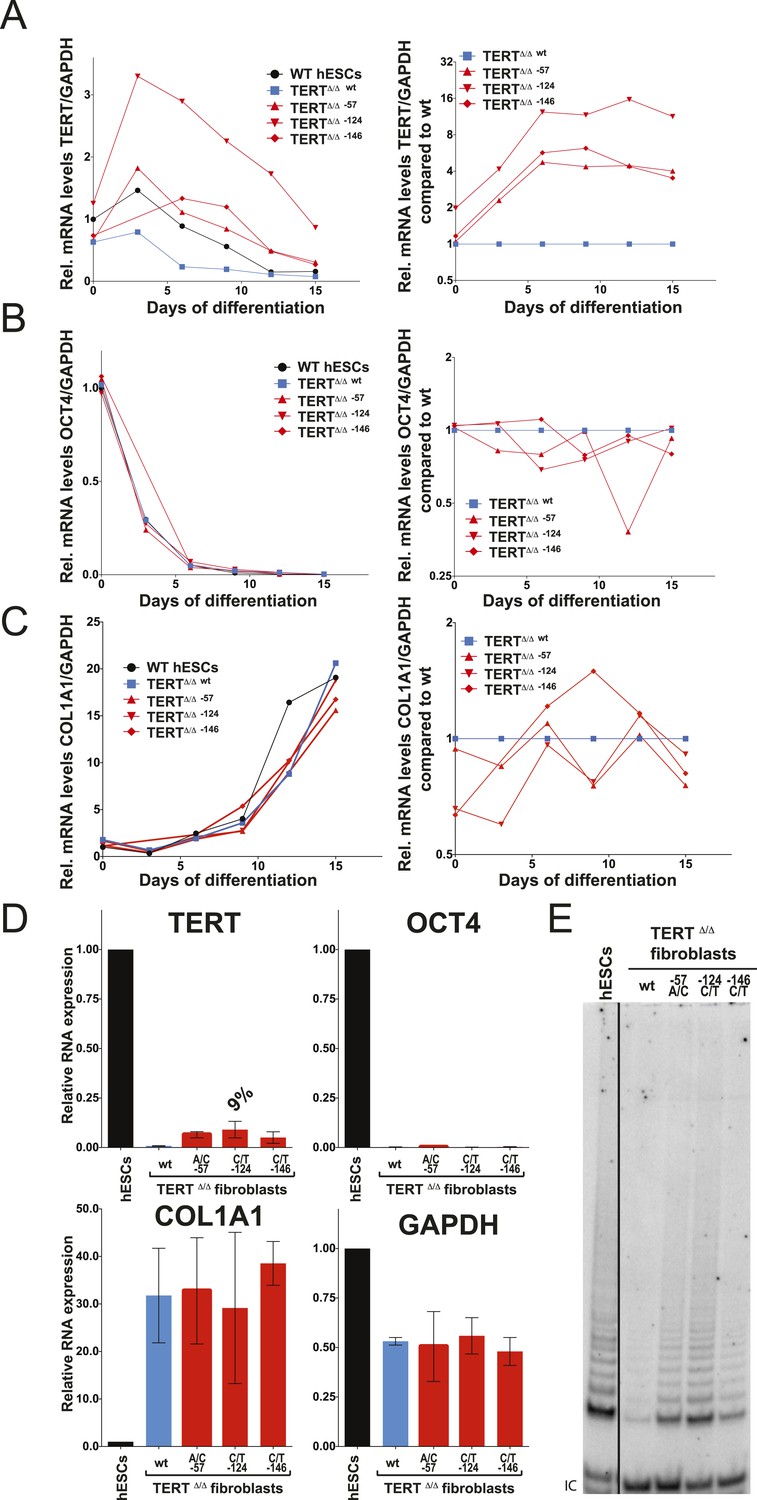
(A), (B) and (C) Relative expression level of TERT, OCT4 or COL1A1 in the promoter-mutated hESC-derived fibroblasts compared to WT hESCs over a time course of differentiation (left panel). Relative expression level of TERT, OCT4 or COL1A1 compared to TERTΔ/Δ and WT fibroblasts over a time course of differentiation. The right panel shows the same data as in the left panels, normalized to TERTΔ/Δ wt fibroblasts. Expression of TERT, OCT4, or COL1A1 was normalized to GAPDH. (D) Quantitative RT-PCR of TERT, OCT4, COL1A1, and GAPDH in the fibroblasts carrying the promoter mutations 24 days after differentiation. Expression level is relative to WT hESCs. (E) TRAP assay of whole-cell extracts from WT hESCs, and the fibroblasts carrying the TERT promoter mutations (24 days after differentiation) using 2 µg of protein.
Figure 3—figure supplement 1
Independent confirmation of the failure of TERT repression and telomerase activity upon fibroblast differentiation shown in Figure 3 using an independent TERTΔ/Δ#2 cell line.
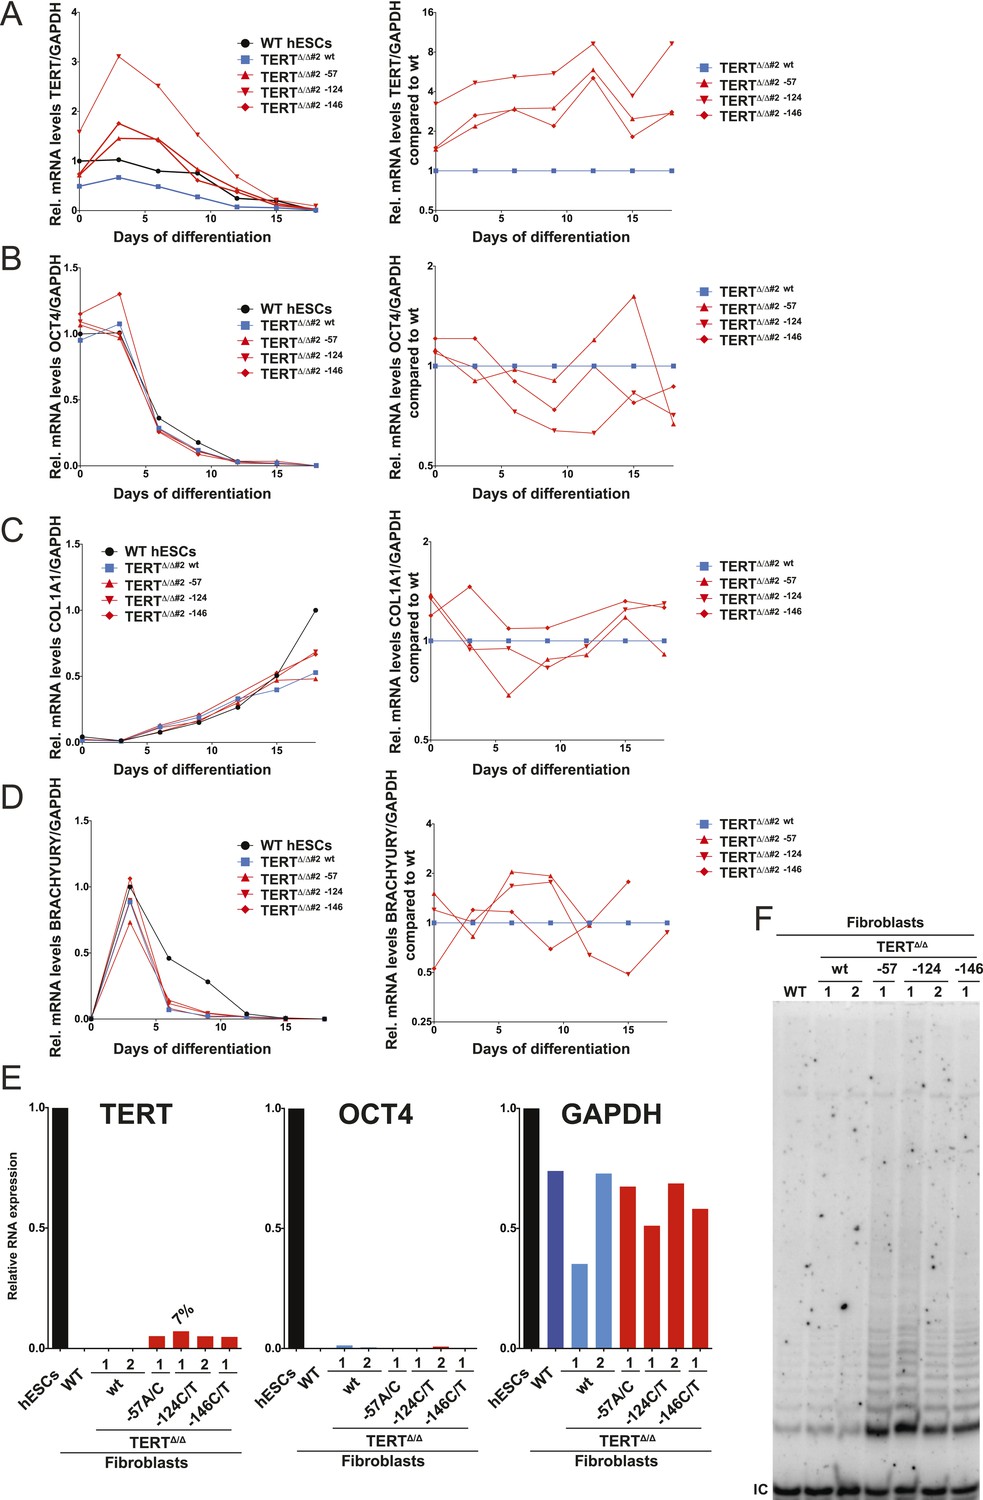
The results obtained by the bulk analysis were also confirmed by clonal analysis of fibroblasts carrying the TERT promoter mutations. (A) and (B) Relative expression levels of TERT and OCT4 in the promoter-mutated hESC-derived fibroblasts compared to WT hESCs over a time course of differentiation (left panels). The right panels show the same data normalized to TERTΔ/Δ #2 wt cells. (C) Relative expression level of COL1A1 in the promoter-mutated hESC-derived fibroblasts compared to WT fibroblasts (day 15) over a time course of differentiation (left panels). The right panels show the same data normalized to TERTΔ/Δ #2 wt cells. (D) Relative expression level of BRACHYURY (T) in the promoter-mutated hESC-derived fibroblasts compared to WT embryonic bodies (day 3) over a time course of differentiation (left panels). The right panels show the same data normalized to TERTΔ/Δ #2 wt cells. (E) Quantitative RT-PCR of TERT, OCT4, and GAPDH in individual clones of fibroblasts carrying the mutations. Expression levels are shown relative to WT hESCs. (F) TRAP assay of whole cell extracts from fibroblasts differentiated from clonal hESCs carrying the TERT promoter mutations using 2 µg of protein.
Figure 3—figure supplement 2
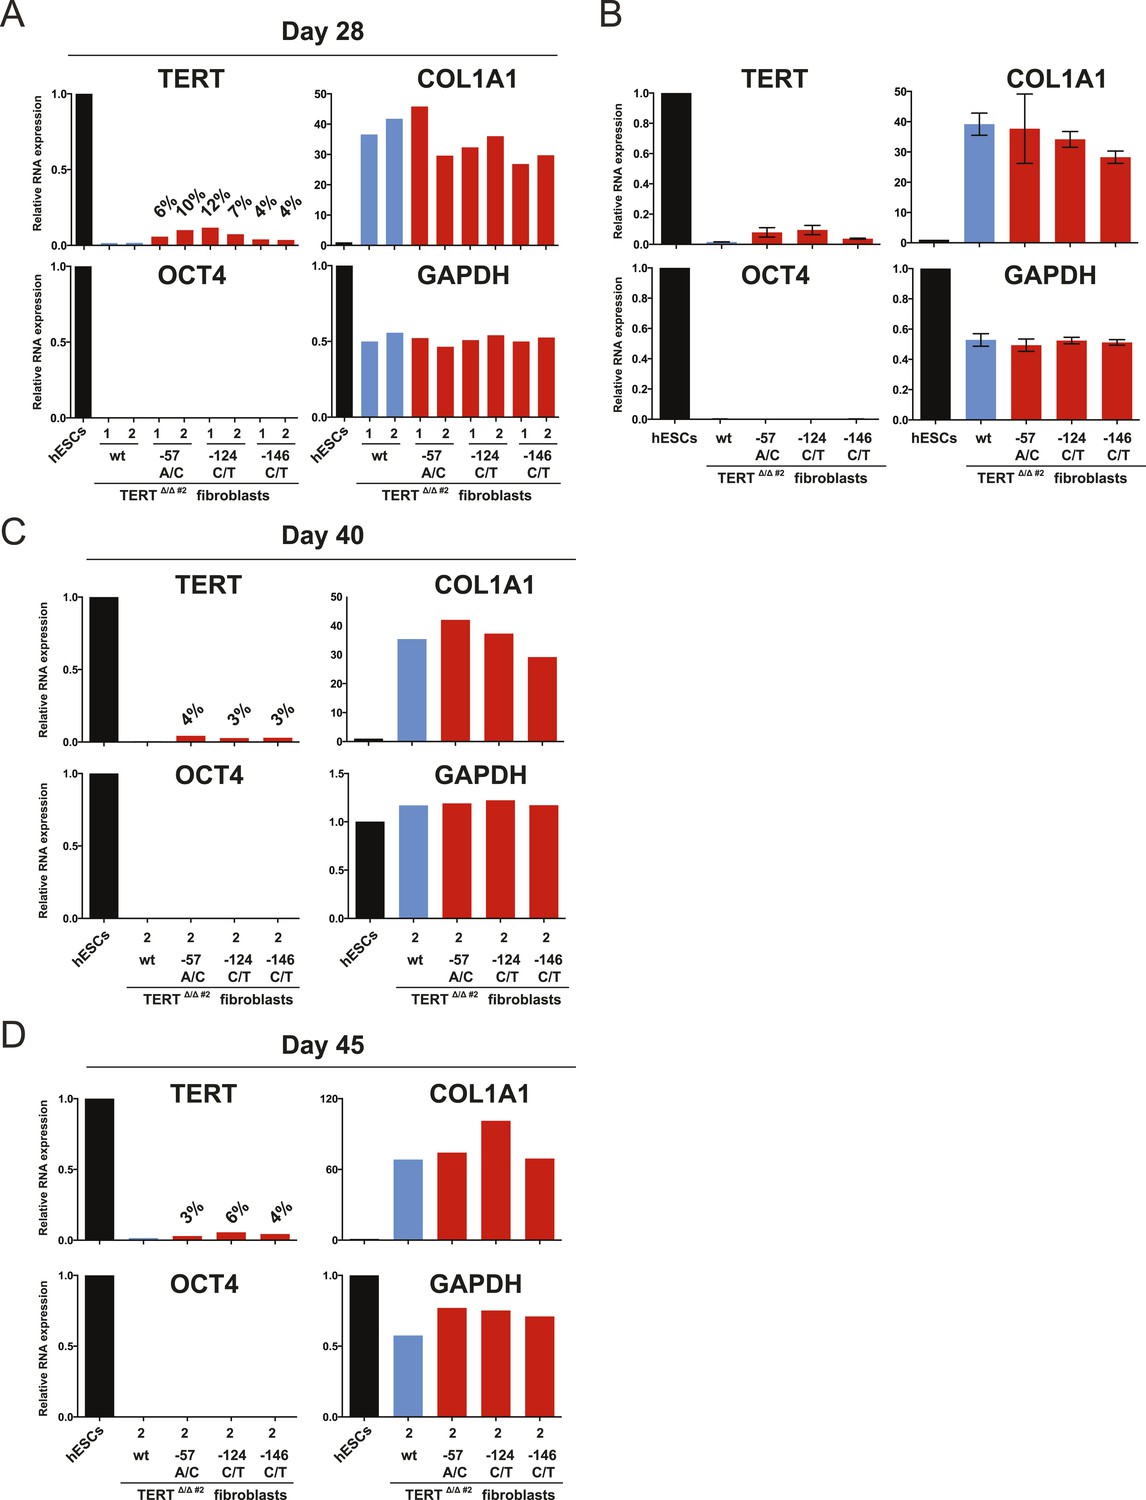
The failure of TERT repression in fibroblasts was retained throughout long-term culture.
(A), (C) and (D) Relative expression level of TERT, OCT4, COL1A1, and GAPDH in individual hESC clones differentiated to fibroblasts carrying the indicated mutations at days 28, 40, and 45 after differentiation. Expression levels are shown relative to WT hESCs. (B) Average expression of data shown in (A). Expression levels are compared to WT hESC clones. Error bars represent the SEM.
Figure 4 with 1 supplement
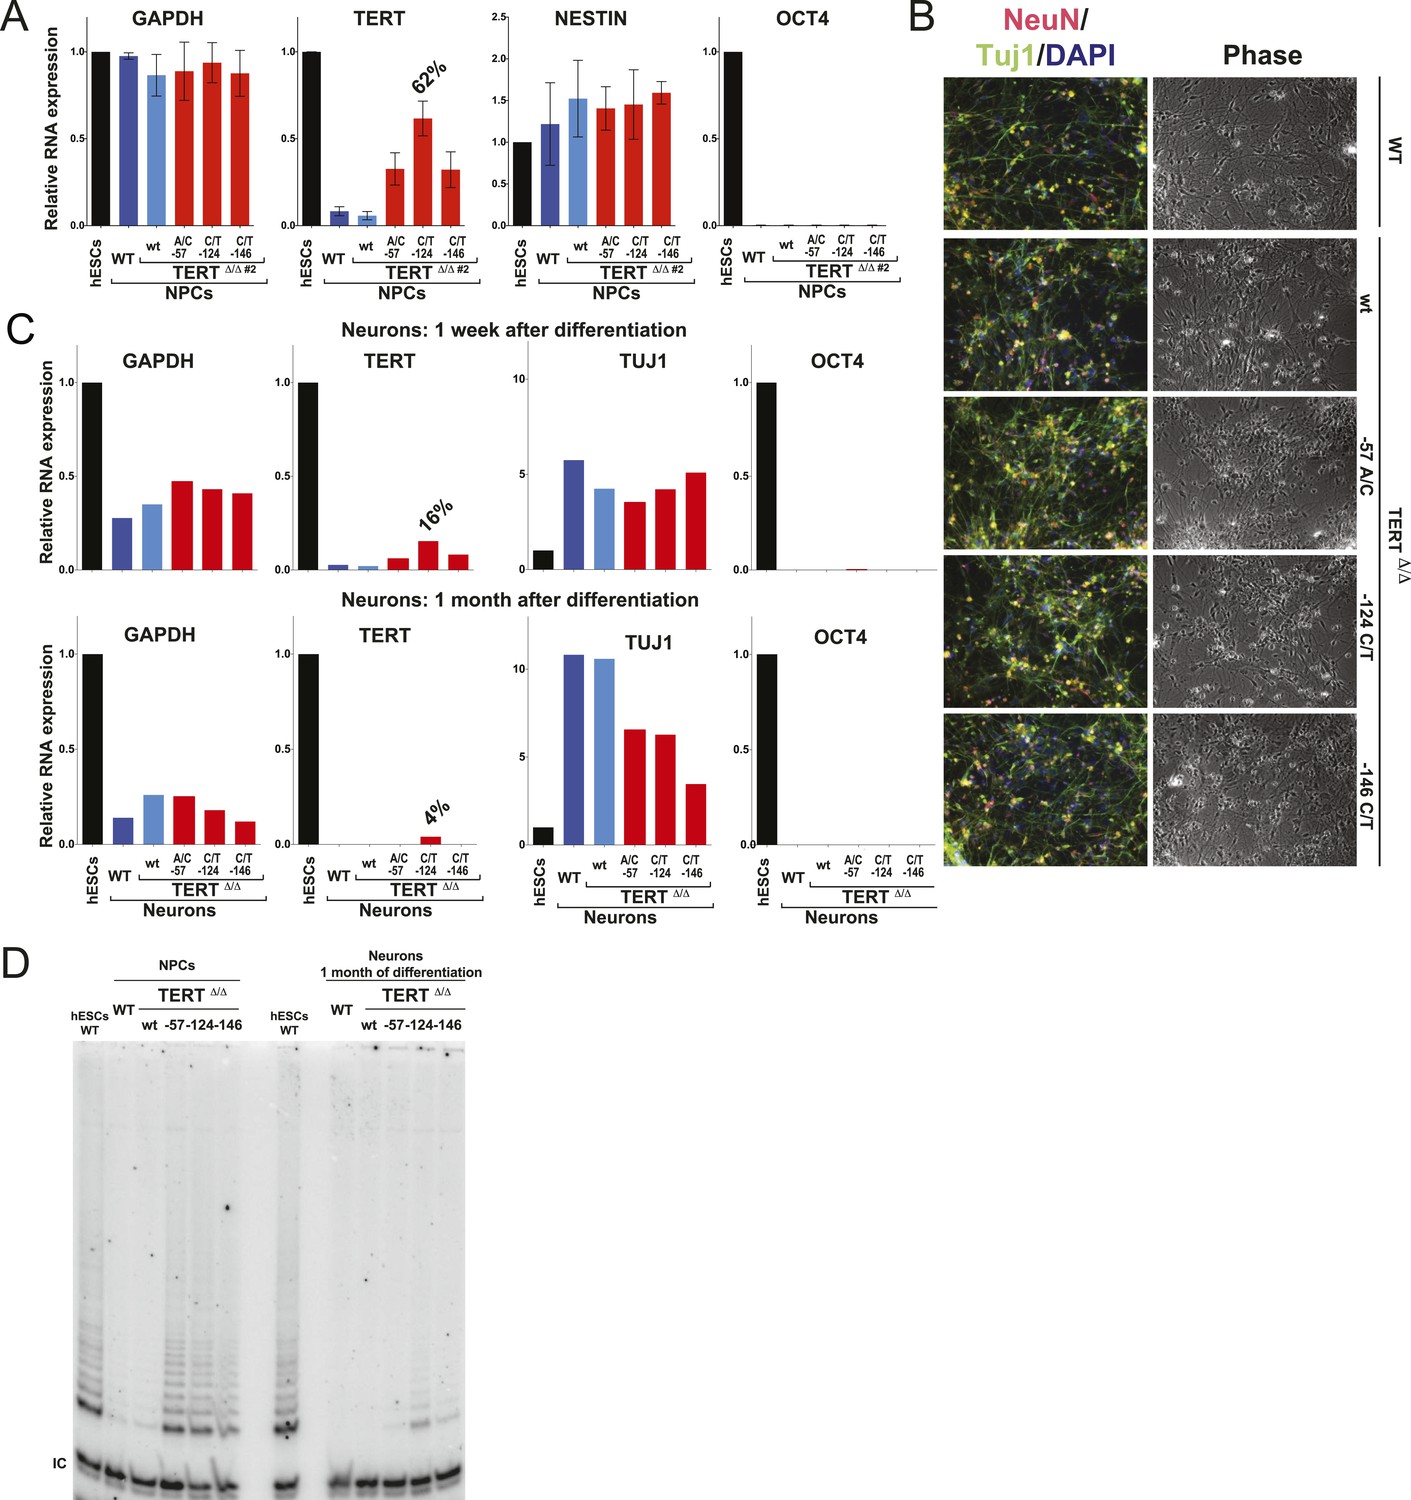
Neural precursors and neurons differentiated from the promoter mutation hESCs failed to repress TERT and telomerase activity.
(A) Quantitative RT-PCR of GAPDH, TERT, NESTIN, and OCT4 in the neural precursors carrying the promoter mutations 20–25 days after differentiation from hESCs. Expression levels are relative to the WT hESCs. (B) Phase-contrast and immunofluorescence images of neurons differentiated from wild-type hESCs or the TERT promoter mutation-containing hESCs. Shown are cells 28 days after neural induction from NPCs and treated with mitotic inhibitor for 16 days. The left panel shows IF staining against NeuN (red), Tuj1 (green), and DAPI staining (blue). (C) Quantitative RT-PCR of GAPDH, TERT, TUJ1, and OCT4 in the neurons carrying the promoter mutations. The top panel shows expression levels of neurons 7 days after neuronal differentiation from NPCs. The bottom panel shows expression levels of neurons 28 days after induction of neuronal differentiation from NPCs and treated with mitotic inhibitor for 16 days. Expression level is relative to the WT hESCs. (D) TRAP assay of whole cell extracts from NPCs (35 days after differentiation from hESCs) and neurons (28 days after neuronal differentiation from NPCs and treated with mitotic inhibitor for 16 days) using 1 µg protein.
Figure 4—figure supplement 1

Clonal analysis of TERT promoter mutation NPCs confirmed results from bulk analysis.
(A) Quantitative RT-PCR of TERT, OCT4, NESTIN, and GAPDH in NPCs differentiated from individual clones of the targeted hESCs (28 days after differentiation from hESCs). Expression levels are shown relative to WT hESCs. (B) Average expression of data shown in (A). Expression levels are compared to WT hESCs. Error bars represent the SEM.
Figure 5 with 1 supplement

Fibroblasts and neural precursors carrying cancer-associated TERT promoter point mutations showed comparable telomerase activity to cancer cell lines, and telomere length was maintained over long-term culture and tumor development.
(A) and (B) TRAP assay of whole-cell extracts from cancer cell lines (HeLaS3, 293T, and HCT116), WT hESCs, and the NPCs or fibroblasts carrying the TERT promoter mutations (24 days after differentiation for fibroblasts and 20 days for NPCs) using decreasing amount of protein (200, 40, 8 ng). For comparison, TRAP samples in (A) and (B) were prepared simultaneously and samples from cancer cell lines are identical in (A) and (B). TRAP signals relative to HeLa S3 were quantified and are shown at the bottom of the gels. (C) Telomere restriction fragment assay of the hESCs and NPCs (65 days after differentiation from hESCs). Median telomere length signals were quantified and shown at the bottom. It is important to note the telomere shortening in NPCs and fibroblasts in wild type cells exceeds the initial telomere length difference found in the hESCs. (D) Telomere restriction fragment assay of the fibroblasts (30 days after differentiation from hESCs). Median telomere length signals were quantified and shown at the bottom. (E) Telomere restriction fragment assay of teratoma tumor tissue generated from wt and promoter-mutation containing hESCs (75 days after injection). Median telomere length signals were quantified and shown at the bottom.
Figure 5—figure supplement 1
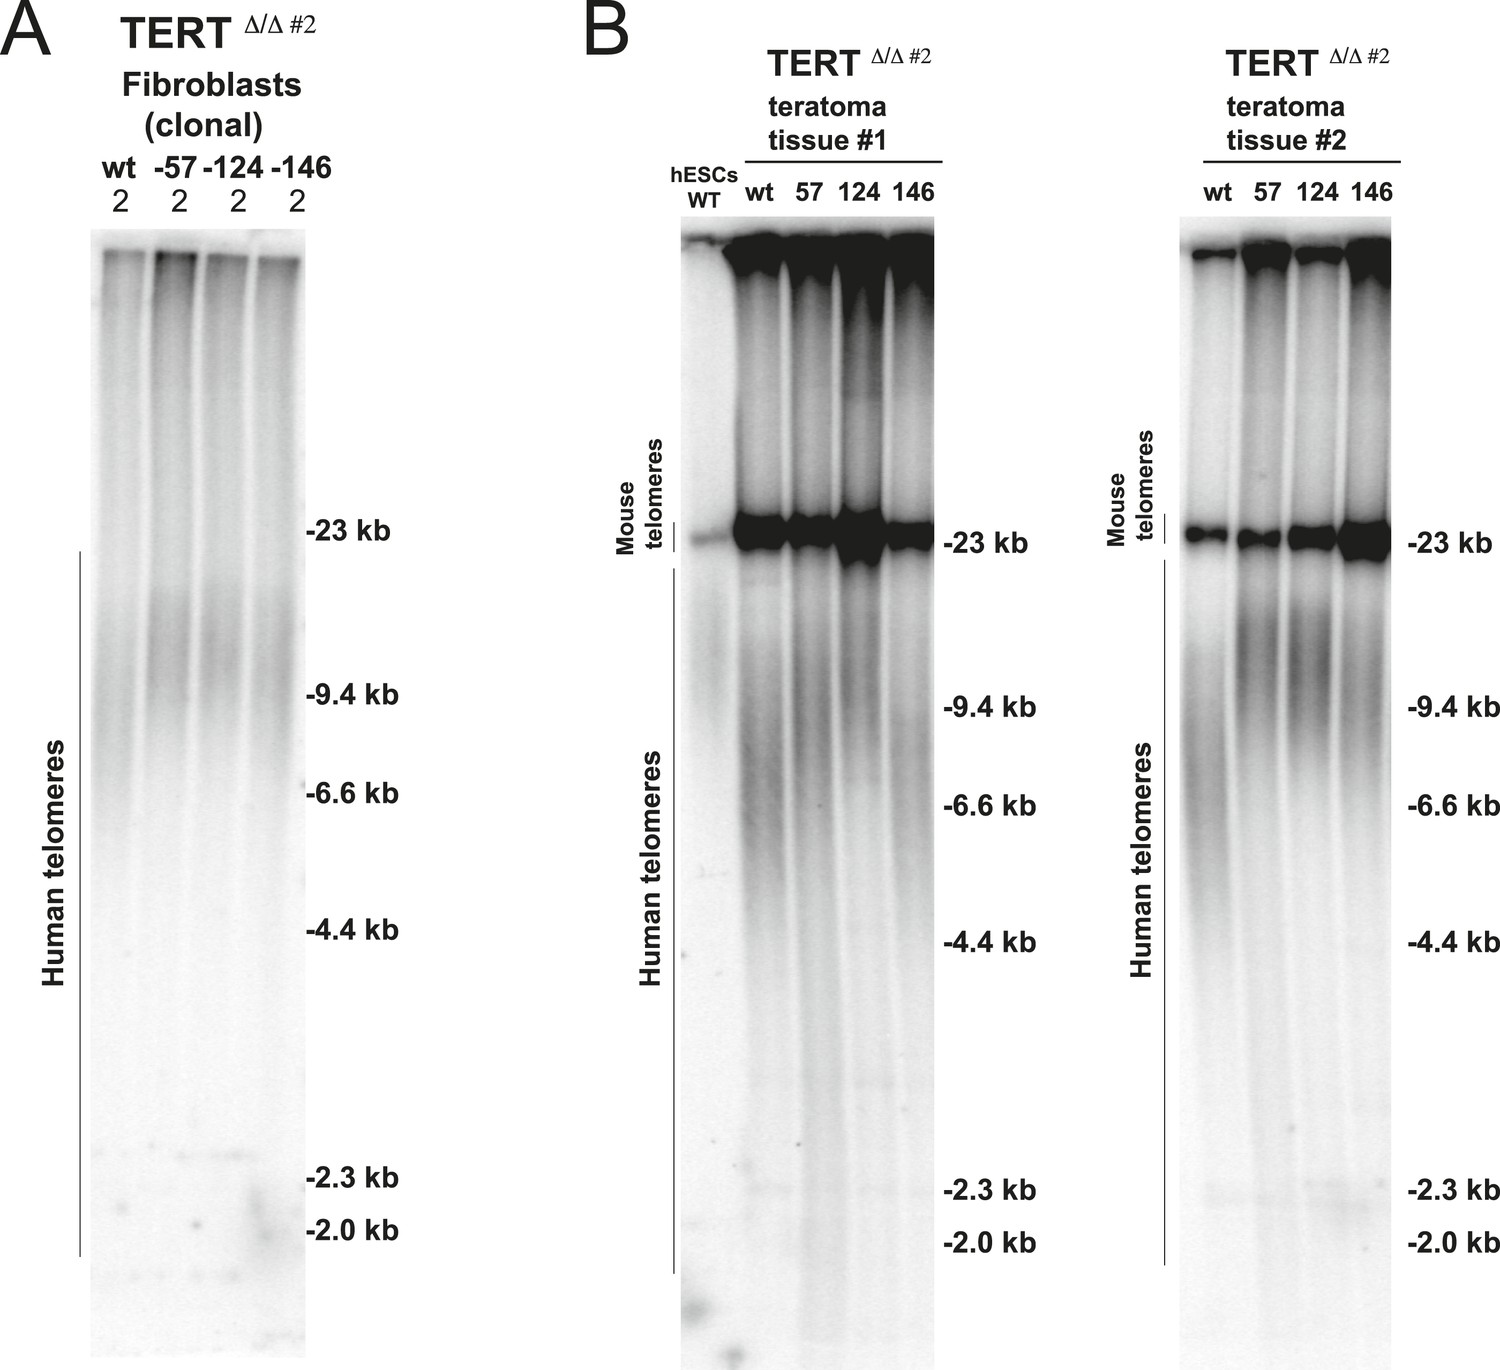
Fibroblasts and teratoma tissue carrying cancer-associated TERT promoter point mutations maintained telomere length over long-term culture and tumor development.
(A) Telomere restriction fragment assay of the fibroblasts (36 days after differentiation from hESCs). (B) Telomere restriction fragment assay of teratoma tumor tissue generated from wt and promoter-mutation containing hESCs. Teratoma tissues in the group #1 were explanted 84 days after injection except −57 mutant samples (64 days after injection). Teratoma tissues in the group #2 were explanted 56 days after injection.
Figure 6
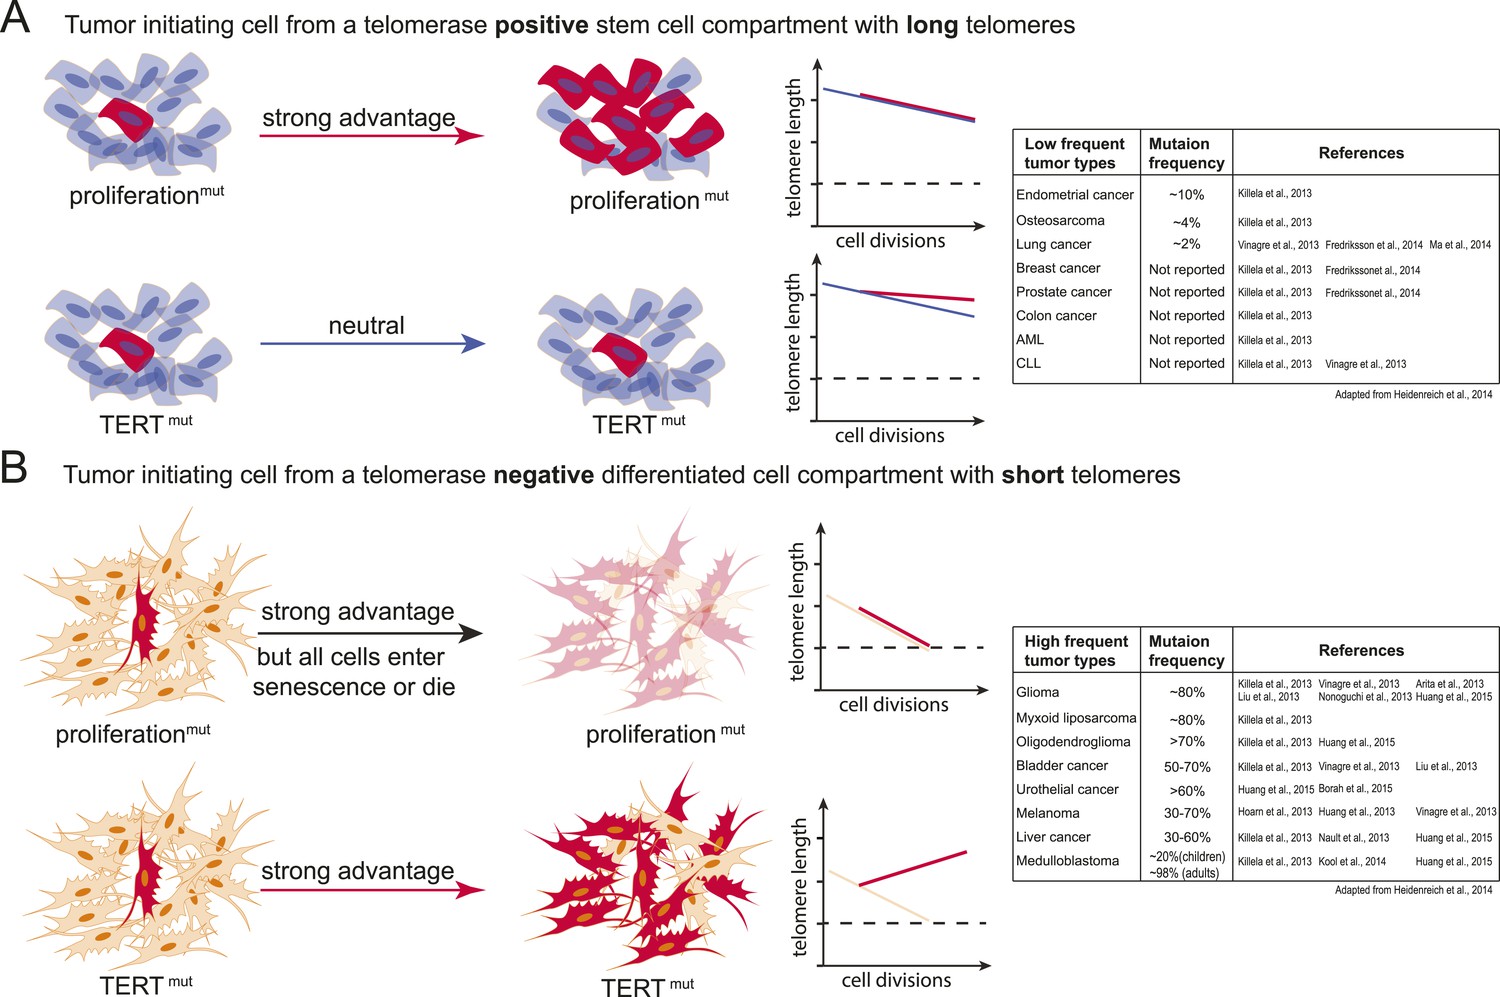
Model explaining the tumor spectrum associated with TERT promoter mutations.
Shown are the differential outcomes of a cell acquiring a cancer-associated TERT promoter mutation or a proliferation-inducing mutation dependent on telomere length of the cell. (A) In a cell with long telomeres and telomerase activity, a proliferation-promoting mutation will result in a strong proliferative advantage and can act as the tumor-initiating event. Cells with long telomeres arise from tissues that have a telomerase positive stem cell compartment such as the hematopoietic or intestinal system. In contrast, mutations in the TERT promoter do not provide a proliferative advantage, they are neutral and do not promote tumor formation. Cell states are depicted on the left; cells that acquire mutations are shown in red. A schematic depicting telomere length changes as a function of the number of cell divisions is shown on the right. The dashed line indicates the critical telomere length at which cells are subjected to the Hayflick limit and stop proliferating or die. The red line indicates the telomere length changes predicted for cells that acquire either a proliferation-promoting mutation (top) or a TERT promoter mutation (bottom). The blue line indicates the telomere length changes predicted for wild-type cells. Indicated is a case where telomere shortening is suppressed by the TERT promoter mutations. However, since these cell already have long telomeres and/or naturally express telomerase, telomeres in neither wild-type cells or cells acquiring a proliferation inducing mutation will shorten to the point that the cells are subjected to the Hayflick limit. (B) Schematic as shown in (A) but for a telomerase negative cells with short telomeres. A proliferation-promoting mutation will also provide a growth advantage in telomerase-negative differentiated cells with short telomeres, however, these cells will enter replicative senescence or die. In contrast, a cell with short telomeres acquiring a TERT promoter mutation can bypass the Hayflick limit (dashed lines), immortalize, and outcompete its neighboring cells. Cell states are depicted on the left; cells that acquire mutations are shown in red. Schematic depicting telomere length changes as a function of the number of cell divisions is shown on the right. The orange line indicates the telomere length changes predicted for wild-type cells. The table to the right shows the frequency of TERT promoter mutations found in different types of tumors (adapted form Heidenreich et al., 2014). The table includes references that report the specific tumor subtypes and frequencies used to generate this table.
Additional files
-
Supplementary file 1
Summary of qRT-PCR primers used in this study.
- https://doi.org/10.7554/eLife.07918.017
Download links
A two-part list of links to download the article, or parts of the article, in various formats.
Downloads (link to download the article as PDF)
Open citations (links to open the citations from this article in various online reference manager services)
Cite this article (links to download the citations from this article in formats compatible with various reference manager tools)
Cancer-associated TERT promoter mutations abrogate telomerase silencing
eLife 4:e07918.
https://doi.org/10.7554/eLife.07918


