Mapping influenza transmission in the ferret model to transmission in humans
- University of California, Los Angeles, United States
- National Institutes of Health, United States
- Centers for Disease Control and Prevention, United States
Figures
Figure 1 with 1 supplement
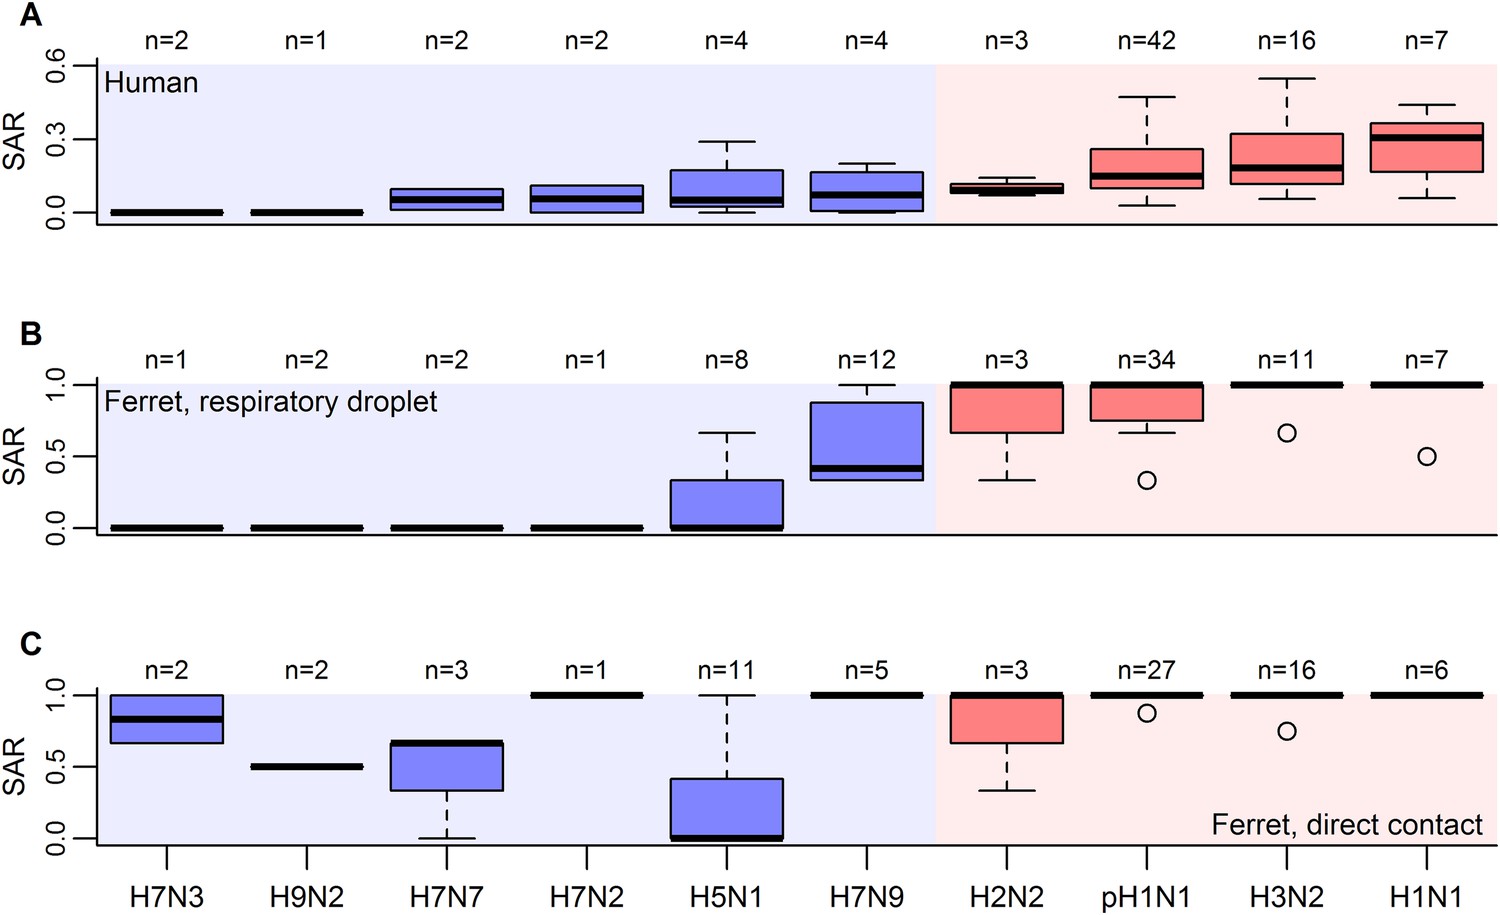
Boxplots of influenza SAR estimates by subtype.
(A) Human SAR, (B) ferret respiratory droplet SAR, and (C) ferret direct contact SAR. Solid, black lines represent the subtype medians. Boxes give the inter-quartile range with whiskers extending out up to 1.5 times this range. Points represent extreme values. The number of estimated SARs for each subtype is given above each box-and-whisker plot (n). Subtypes were ordered according to the mean human SAR value in all panels. Shading depicts the known human transmission pattern of the subtypes (red—supercritical; blue—subcritical).
-
Figure 1—source data 1
Estimates of human household SAR.
- https://doi.org/10.7554/eLife.07969.004
-
Figure 1—source data 2
Ferret influenza transmission studies via respiratory droplets using human isolates.
- https://doi.org/10.7554/eLife.07969.005
-
Figure 1—source data 3
Ferret influenza transmission studies via direct contact using human isolates.
- https://doi.org/10.7554/eLife.07969.006
-
Figure 1—source data 4
Ferret influenza transmission studies via respiratory droplets and direct contact using avian isolates.
- https://doi.org/10.7554/eLife.07969.007
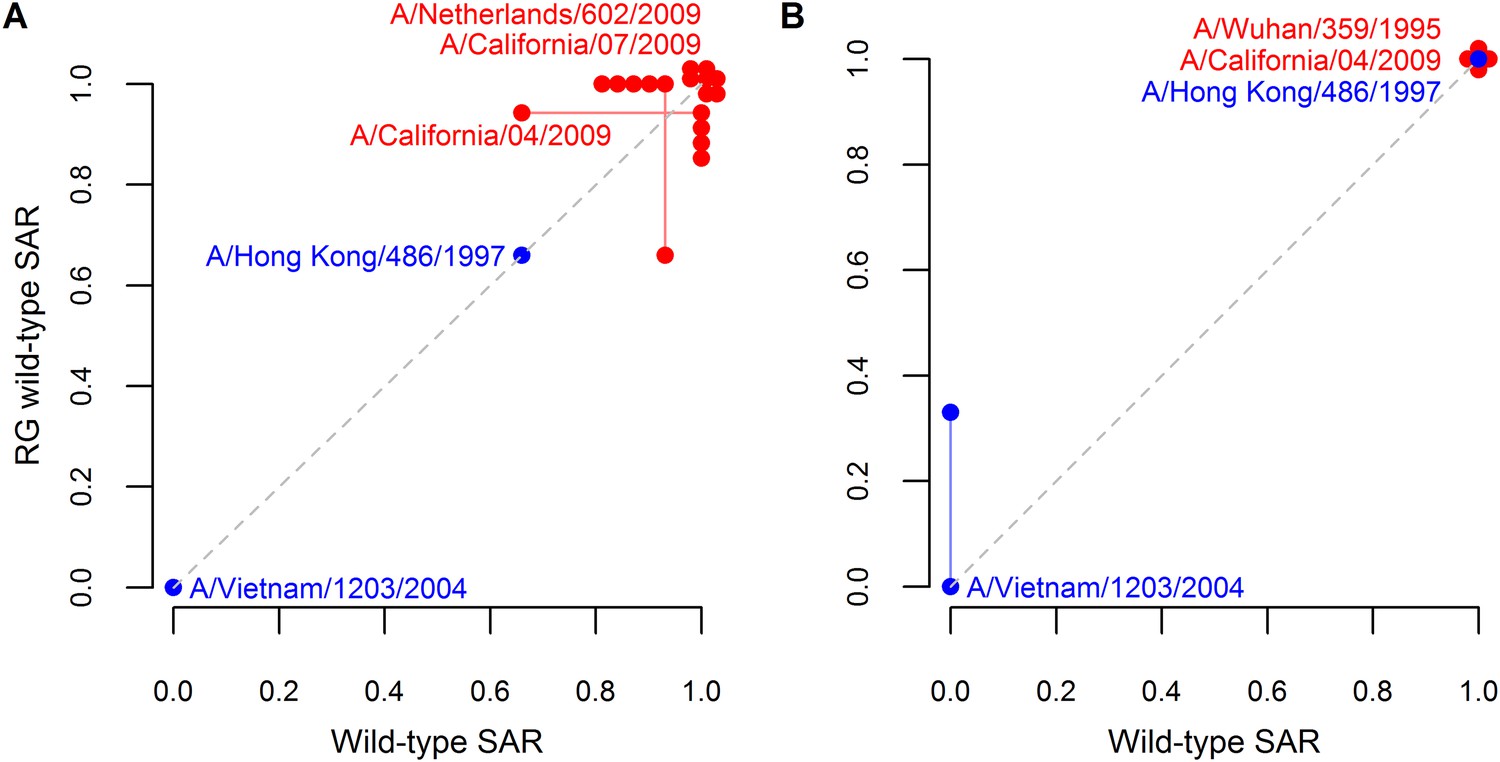
Figure 1—figure supplement 1
Analysis supporting inclusion of SAR estimates from isolates generating using reverse genetics.
Comparison of ferret SAR for wild-type influenza isolates and their counterparts engineered using reverse genetics under (A) respiratory droplet and (B) direct contact transmission. Because experiments were not paired, SAR estimates for a wild-type isolate were plotted against the mean SAR for the reverse genetic derived isolate and vice-versa. Estimates from the same isolate are joined by a line with the isolate name given. Both supercritical (red) and subcritical (blue) isolates are shown. The dashed gray line denotes a one-to-one relationship between the two. Note that some points are jittered for clarity (see Figure 1—source data 2, 3 for full data).
Figure 2 with 1 supplement
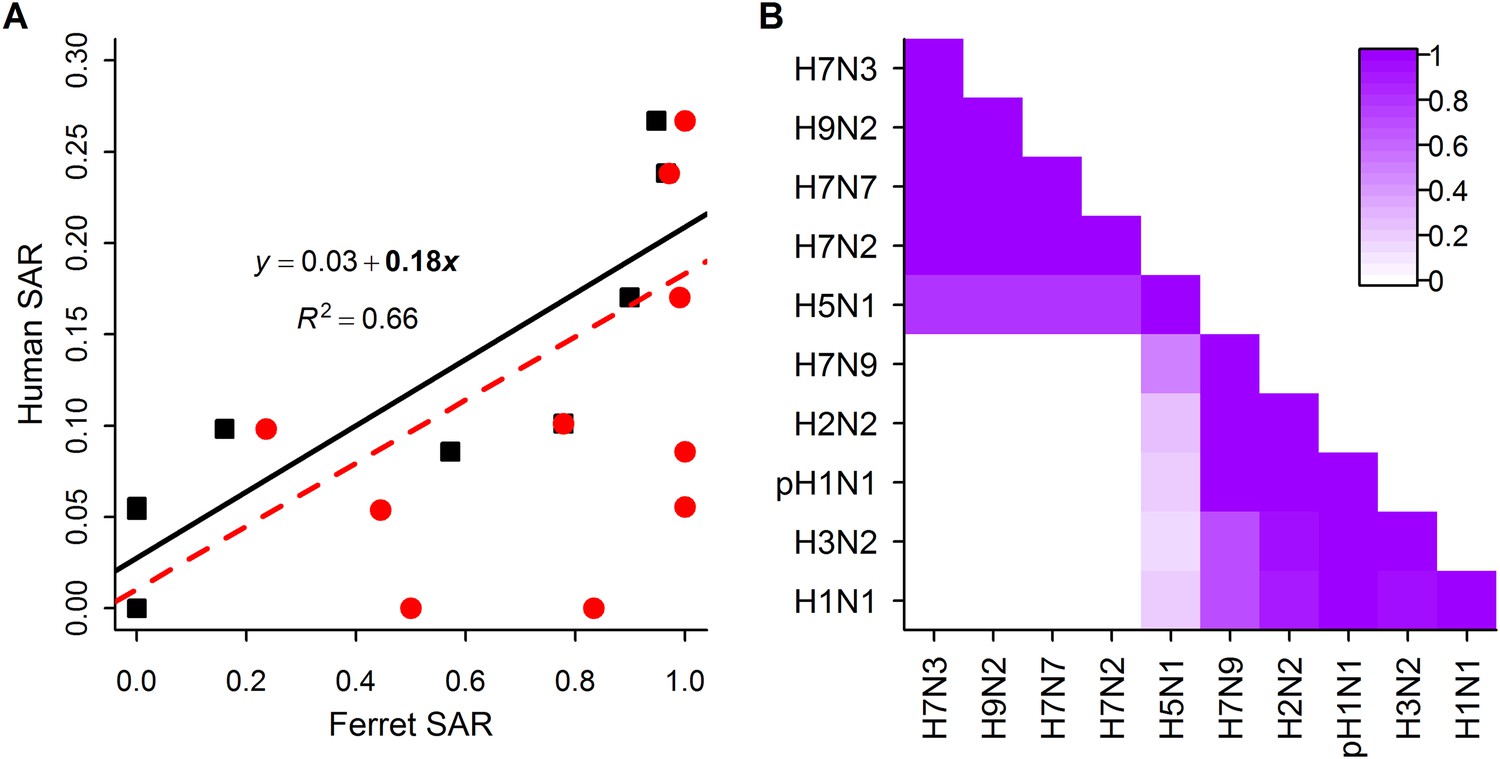
Analysis of subtype-specific SAR.
(A) Comparison of human SAR and ferret SAR for ferret respiratory droplet (black squares) and direct contact (red circles). Data points are the mean human SAR by subtype vs the weighted mean ferret SAR by subtype, where weights are determined by the number of ferrets used in each experiment. Lines give the best fit weighted linear regression models with weights given by the number of human SAR estimates. The solid line indicates a significant relationship between ferret respiratory droplet SAR and human SAR described by the given equation (significant terms are bolded; p = 0.003), while the dashed line indicates a non-significant relationship (p = 0.14) for ferret direct contact transmission. (B) The degree of overlap in the distributions of ferret respiratory droplet SAR estimates for each subtype. Dark purple indicates subtypes with complete overlap, while white indicates no overlap.
Figure 2—figure supplement 1
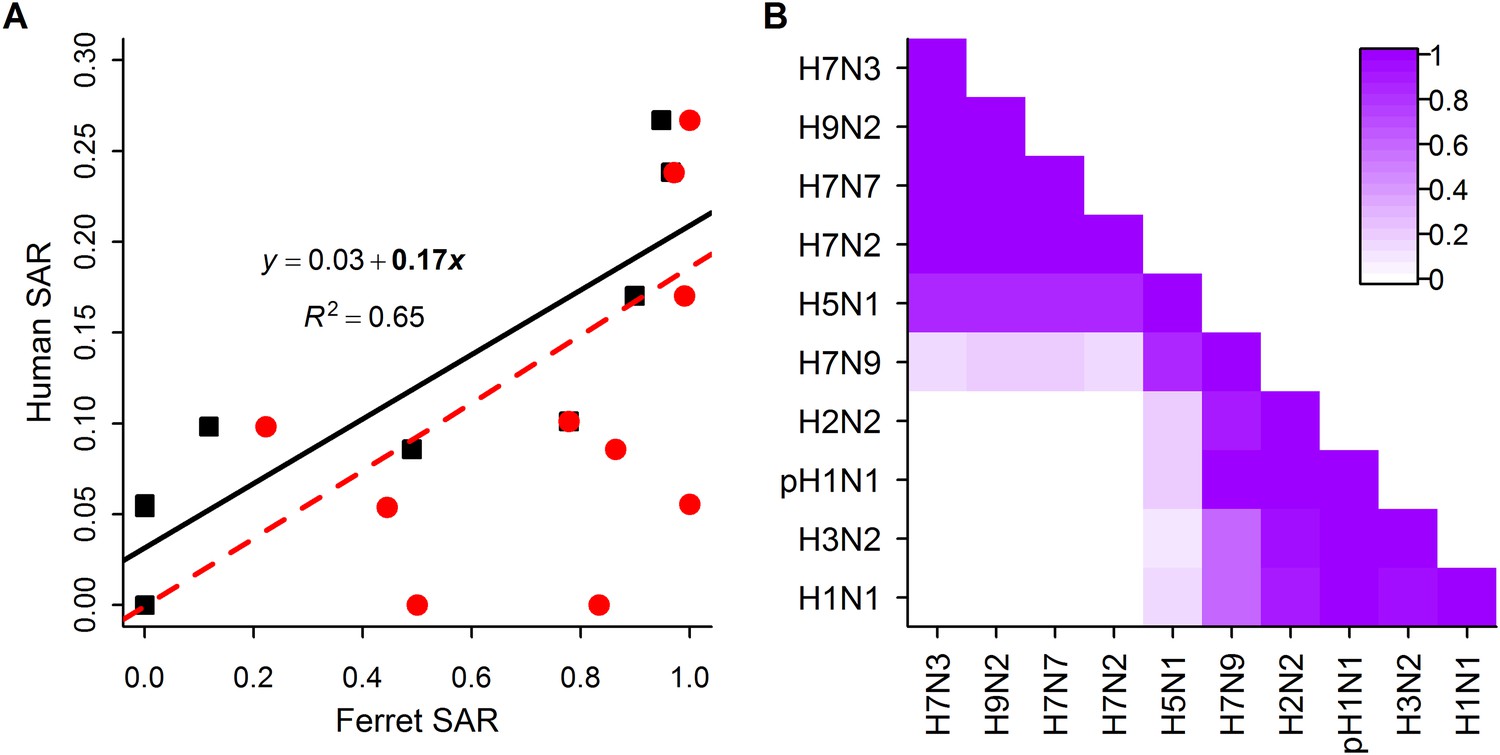
Analysis of subtype-specific SAR including avian isolates for H5N1 and H7N9.
(A) Comparison of human SAR and ferret SAR for ferret respiratory droplet (black squares) and direct contact (red circles). Lines give the best fit weighted linear regression models with weights given by the number of human SAR estimates. The solid line indicates a significant relationship between ferret respiratory droplet SAR and human SAR described by the given equation (significant terms are bolded; p = 0.004), while the dashed line indicates a non-significant relationship (p = 0.18) for ferret direct contact transmission. (B) The degree of overlap in the distributions of ferret respiratory droplet SAR estimates for each subtype. Dark purple indicates subtypes with complete overlap, while white indicates no overlap.
Figure 3 with 3 supplements

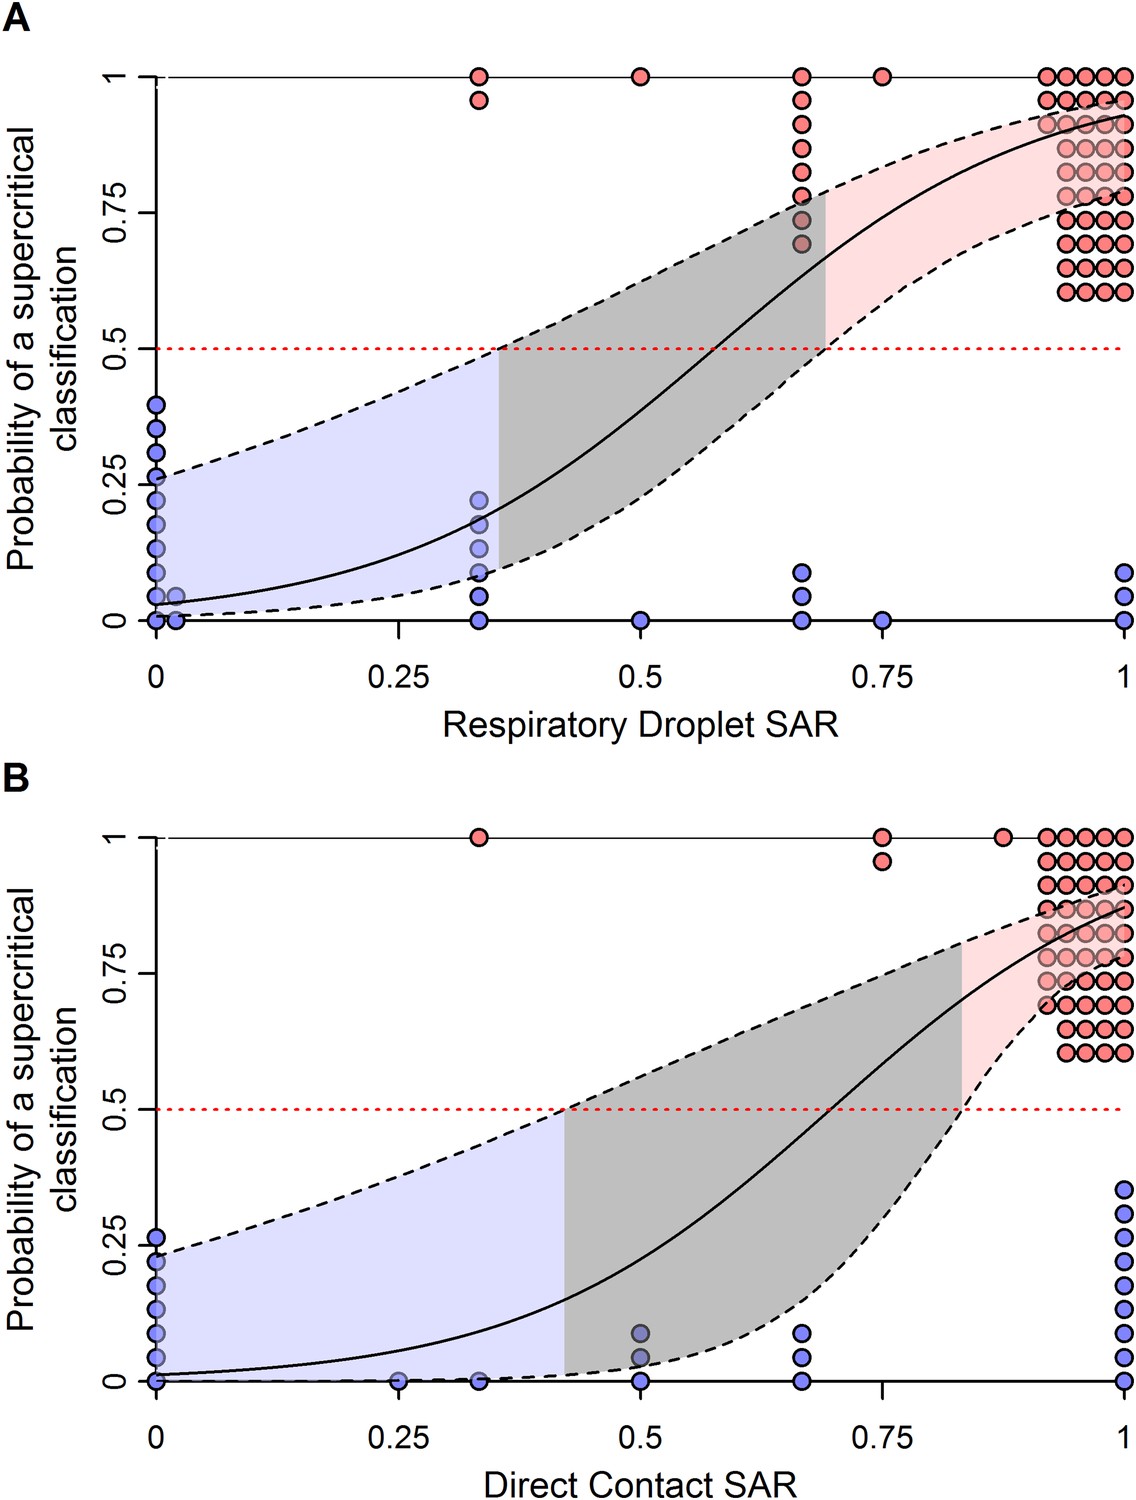
Weighted logistic regression predicting the probability of a supercritical classification based on ferret SAR.
(A) Respiratory droplet SAR and (B) direct contact SAR. Solid black line gives the fit of the weighted logistic regression, where model weights are given by the number of ferrets in each experiment. Dashed black lines give the 95% confidence interval on the model predictions. Shading in the prediction interval represents values of SAR for which the 95% confidence intervals for predicted model fit do not overlap a probability of 0.5 (the dashed red line) indicating a high probability of being supercritical (red shading) or subcritical (blue shading). The gray shading represents SAR values where the 95% CI on the prediction overlaps 0.5, providing equivocal classification. Circles show the individual ferret SAR estimates (See Figure 1—source data 2, 3) for supercritical (top in red) and subcritical viruses (bottom in blue).
Figure 3—figure supplement 1
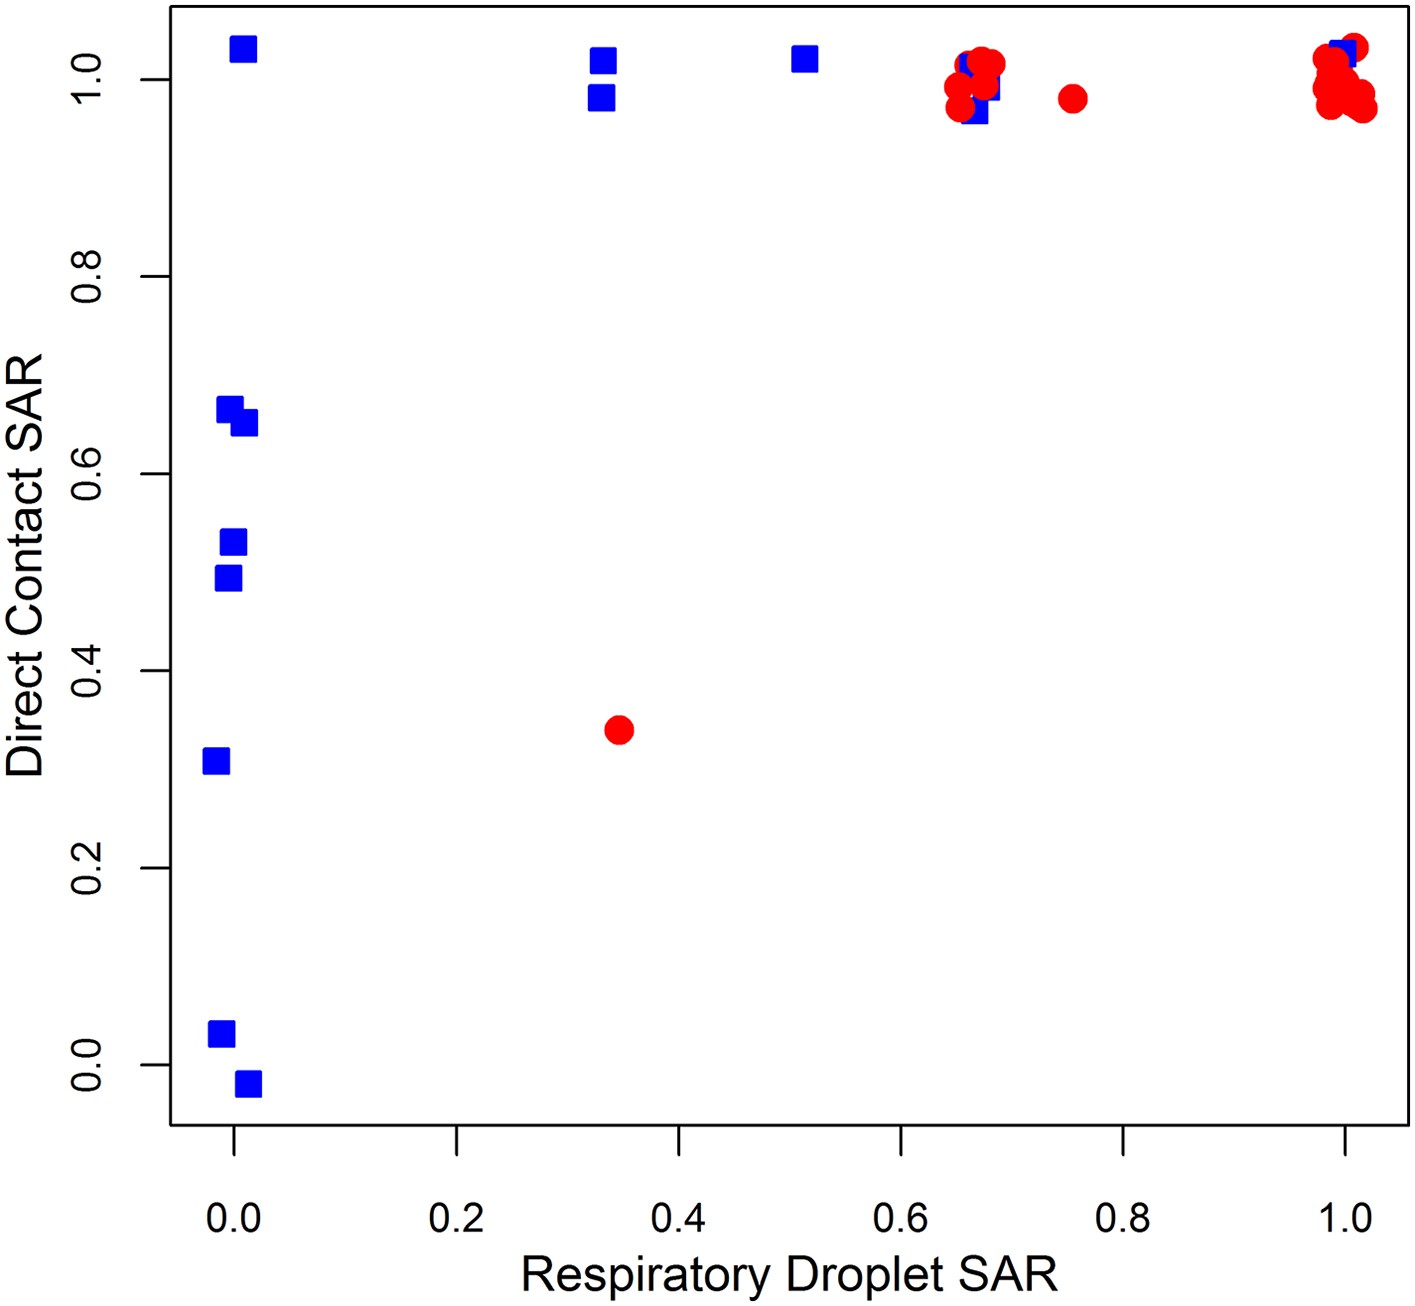
Comparison of ferret SAR via respiratory droplet and direct contact transmission for single influenza isolates.
Each point represents a single set of experiments that tested an isolate for transmission in ferrets under both respiratory droplet and direct contact transmission with other experimental protocols held fixed. Isolates belonging to subcritical subtypes are depicted by blue squares, and supercritical subtypes are depicted by red circles. Note that some points are jittered for clarity (see Figure 1—source data 2, 3 for full data).
Figure 3—figure supplement 2
Effect of uncertainty in ferret SAR on its relationship with the probability of being classified as supercritical.
(A) Respiratory droplet SAR and (B) direct contact SAR. To assess the impact of binomial uncertainty in ferret SAR estimates, we simulated 1000 datasets by taking binomial samples from each data point. Here, the binomial probability for each was given by the observed SAR and the number of trials was the number of ferrets used. To introduce binomial uncertainty into those experiments with an SAR of 0 or 1, we set the binomial probability to 0.1 or 0.9, respectively. The solid line is the average model fit to all of the simulated datasets and is nearly identical to that in Figure 3. Dashed lines give the 97.5 and 0.025 percentiles of the upper and lower bounds, respectively, of the 95% confidence intervals on model predictions from each of the simulated datasets. These indicate much more uncertainty in model predictions across datasets that generates a larger equivocal region of ferret SARs than observed in Figure 3. However, values of ferret SAR indicative of subcritical and supercritical strains still exist, indicating that our qualitative results are robust to binomial uncertainty.
Figure 3—figure supplement 3
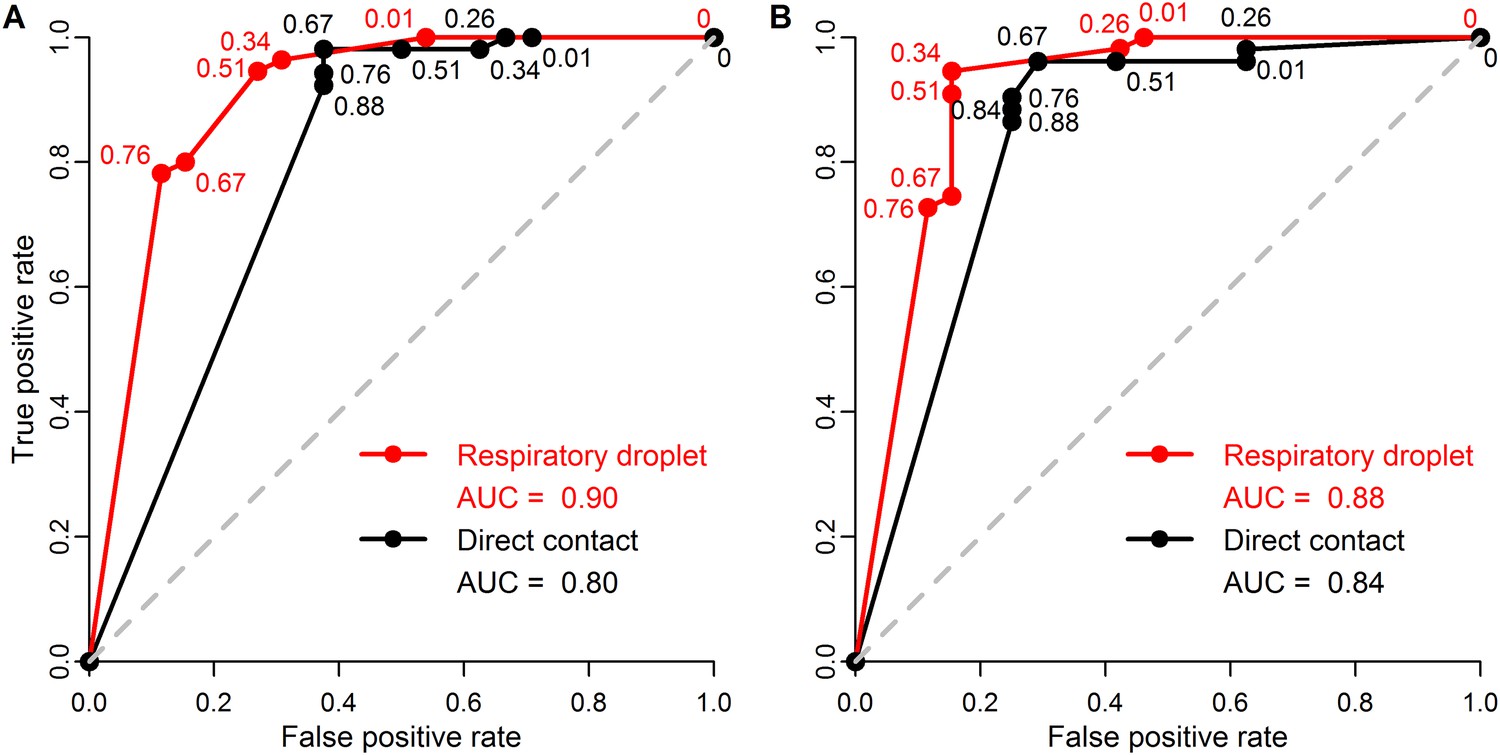
ROC curves for classifying pandemic potential using different definitions of transmission and transmission routes.
Receiver operating characteristic (ROC) curves and area under the curve (AUC) using (A) seroconversion and/or viral isolation or (B) viral isolation alone as evidence for transmission in ferrets when classifying influenza isolates as either supercritical or subcritical in humans. Lines indicate ferret respiratory droplet SAR (red) or ferret direct contact SAR (black). Curves were calculated from raw data shown in Figure 3, using a range of SAR classification thresholds from 0 to 1. Numbers indicate the threshold values for which the true positive rate (i.e. the sensitivity) and false positive rate (i.e. the complement of the specificity) changed. Threshold values intermediate to any of those depicted have true positive and false positive rates identical to that of the next lowest value shown. The dashed gray line is the one-to-one line corresponding to random classification. AUC values are shown in the figure legend with higher values corresponding to higher predictive power.
Figure 4 with 1 supplement
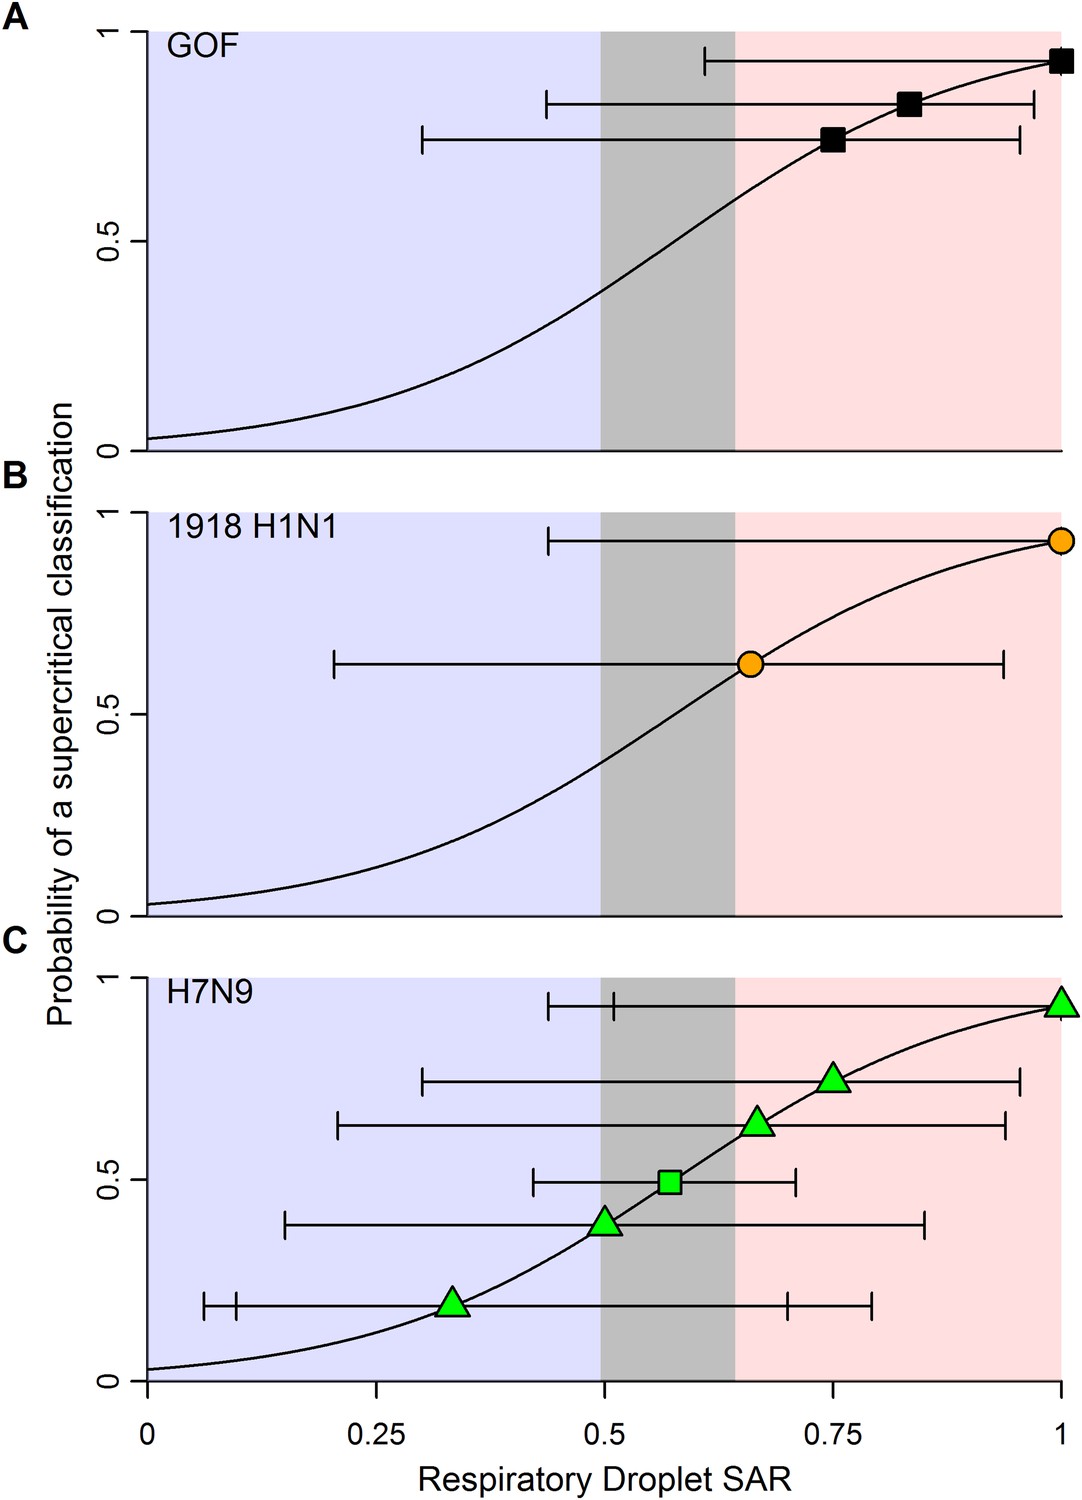
Predictions of the transmission pattern for current and historical isolates of concern.
(A) Gain-of-function experiments with H5N1 avian influenza (Herfst et al., 2012; Imai et al., 2012), (B) the reconstructed 1918 pandemic H1N1 strain (Tumpey et al., 2007; Imai et al., 2012), and (C) H7N9 avian influenza. Solid black curves and shading represent the logistic regression fit and likely transmission pattern, respectively, as depicted in Figure 2. Horizontal lines give the 95% Wilson-score interval for each binomial estimate. In all panels, transmission is defined using seroconversion and viral isolation in nasal washes. In (C), green triangles represent individual experiments, while the green square is the aggregated data across all twelve H7N9 transmission experiments in ferrets. Notice that 6 data points are represented at a SAR of 0.33 and 3 at a SAR of 1. See Figure 1—source data 2 and Figure 4—source data 1 for full data.
-
Figure 4—source data 1
Ferret influenza transmission studies via respiratory droplets using strains from gain-of-function experiments with H5N1 avian influenza and the reconstructed 1918 pandemic H1N1 strain.
- https://doi.org/10.7554/eLife.07969.017
Figure 4—figure supplement 1
Sample size calculations.
Sample size estimates to achieve 80% power at a significance level of 0.05 when testing whether a ferret SAR estimate is greater than the lower limit of the identified supercritical window (0.643, Figure 3A). Sample sizes were calculated using a one-sided binomial exact test.
Tables
Table 1
Parameter estimates for the weighted logistic regression relating human transmission class to ferret SAR
| Data | Model | β0 | βRD | βDC | ΔAIC |
|---|---|---|---|---|---|
| Full data | Direct contact | −4.39 | - | 6.30 | - |
| Respiratory droplet | −3.52 | 6.10 | - | - | |
| Restricted data | Respiratory droplet + direct contact | −1.76 | 8.72 | −3.76 | 0 |
| Respiratory droplet | −3.77 | 6.42 | - | 3.623 | |
| Direct contact | −3.07 | - | 3.74 | 57.348 |
-
Bolded estimates are significant at the α = 0.05 level. Due to differing data between ferret respiratory droplet and direct contact transmission experiments, no model selection was done on the full data. Instead, model selection was done only for studies where authors performed respiratory droplet and direct contact transmission experiments on the same isolate.
Download links
A two-part list of links to download the article, or parts of the article, in various formats.
Downloads (link to download the article as PDF)
Open citations (links to open the citations from this article in various online reference manager services)
Cite this article (links to download the citations from this article in formats compatible with various reference manager tools)
Mapping influenza transmission in the ferret model to transmission in humans
eLife 4:e07969.
https://doi.org/10.7554/eLife.07969


