Structures of the scanning and engaged states of the mammalian SRP-ribosome complex
- MRC Laboratory of Molecular Biology, United Kingdom
Figures
Figure 1

The timing of SRP recruitment to the mammalian ribosome.
(A) Schematic of the constructs used for production and purification of stalled RNCs. Key domains and their positions (in amino acids) are indicated, along with the mutation (3R) used to disrupt the TMD. The diagrams to the right depict RNCs with the TMD inside or outside the tunnel used for biochemical and structural analyses. (B) Anti-FLAG affinity purifications were performed on translation reactions programmed with no RNA (mock), TMD-containing transcripts, or 3R mutant transcripts. Truncation was at position 95 (tunnel) or 128 (exposed). The samples were analyzed by SDS-PAGE and visualized for total protein (top panel) or immunoblotted for SRP54, the large ribosomal protein uL6, or the small subunit protein uS9. (C) The unbound fractions of translation reactions following affinity purification of the TMD and 3R constructs (as in panel B) were analyzed relative to serial dilutions of total lysate. RNCs containing an intact TMD, whether in the tunnel or exposed, selectively deplete more than 75% of SRP from the lysate. (D) RNCs truncated at different positions relative to the TMD were affinity purified and probed for SRP and the ribosome as in panel B. Maximal recruitment is observed at all points after truncation at residue 89, when 14 TMD residues have entered the tunnel. (E) Analysis of SRP recruitment as in panel B using mutant TMDs in which 4 to 10 residues have been deleted. The truncation point was at residue 95. (F) Experiment as in panel D for the indicated truncation points using the TMD or 3R construct.
Figure 2 with 4 supplements
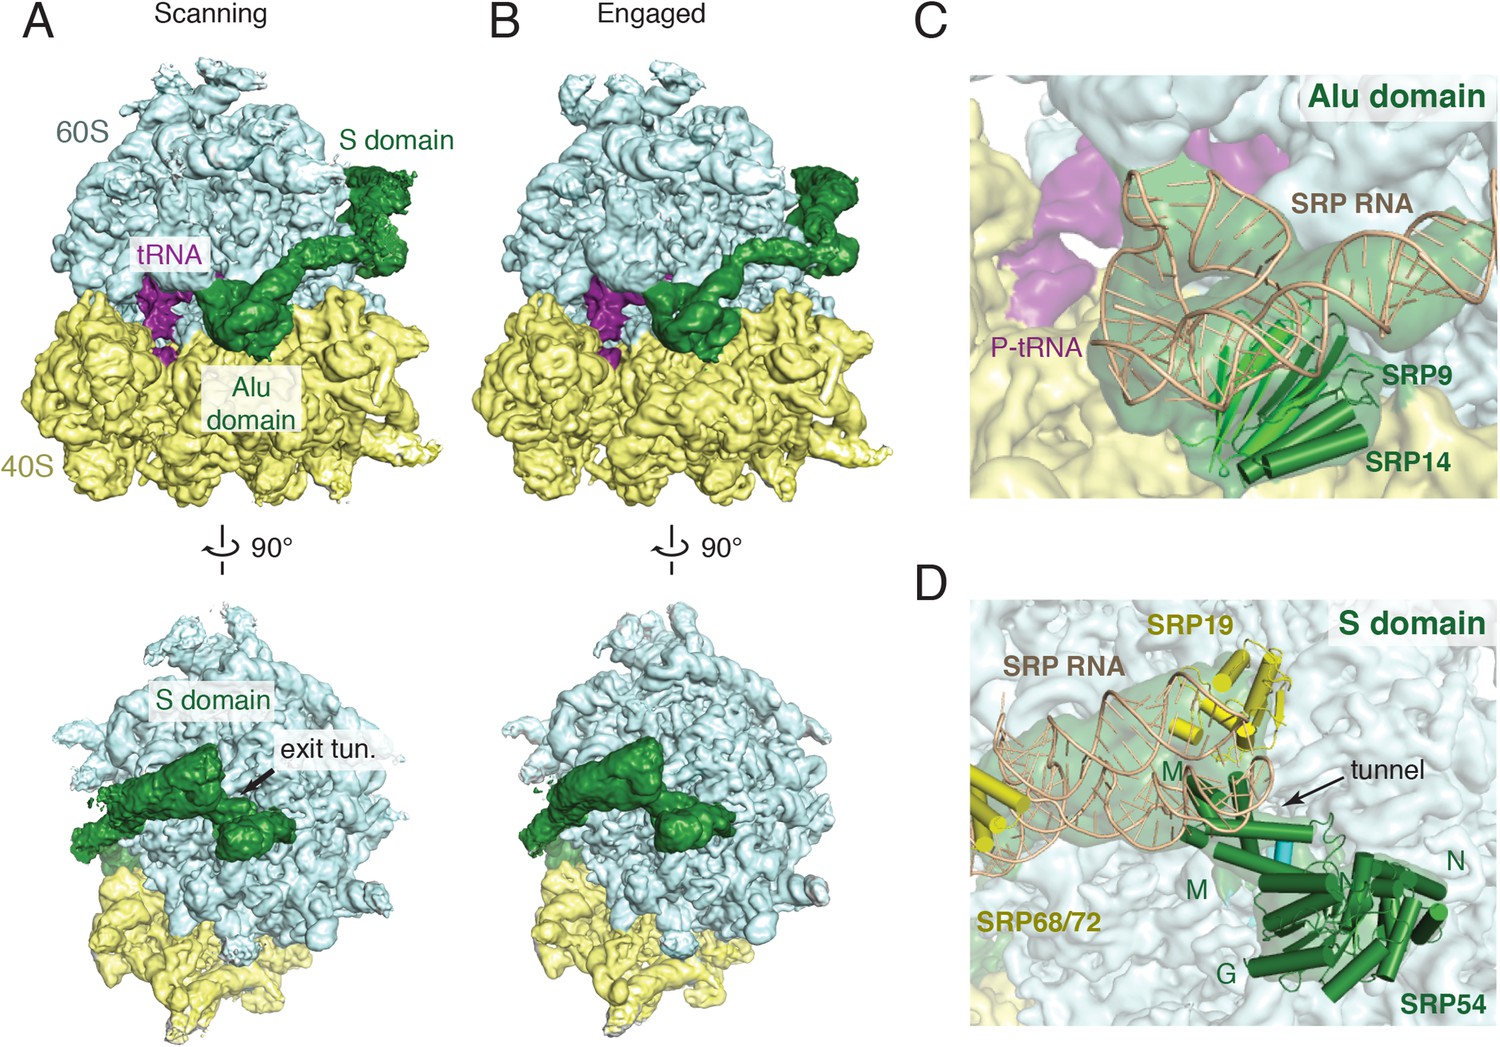
Overview of scanning and engaged SRP-RNC cryo-EM reconstructions.
(A, B) Two views depicting the cryo-EM density of the scanning and engaged complex, in which the density for SRP is green, 40S is yellow, 60S is blue, and P-site tRNA is purple. The top and bottom panels show views of the GTPase center (with bound Alu domain) and the exit tunnel (with bound S domain), respectively. (C, D) Models for the Alu and S domains of SRP are overlayed on the appropriately colored density map for the engaged complex (yellow: 40S, blue: 60S, purple:tRNA, green: SRP). See also Figure 2—figure supplements 1–4.
Figure 2—figure supplement 1
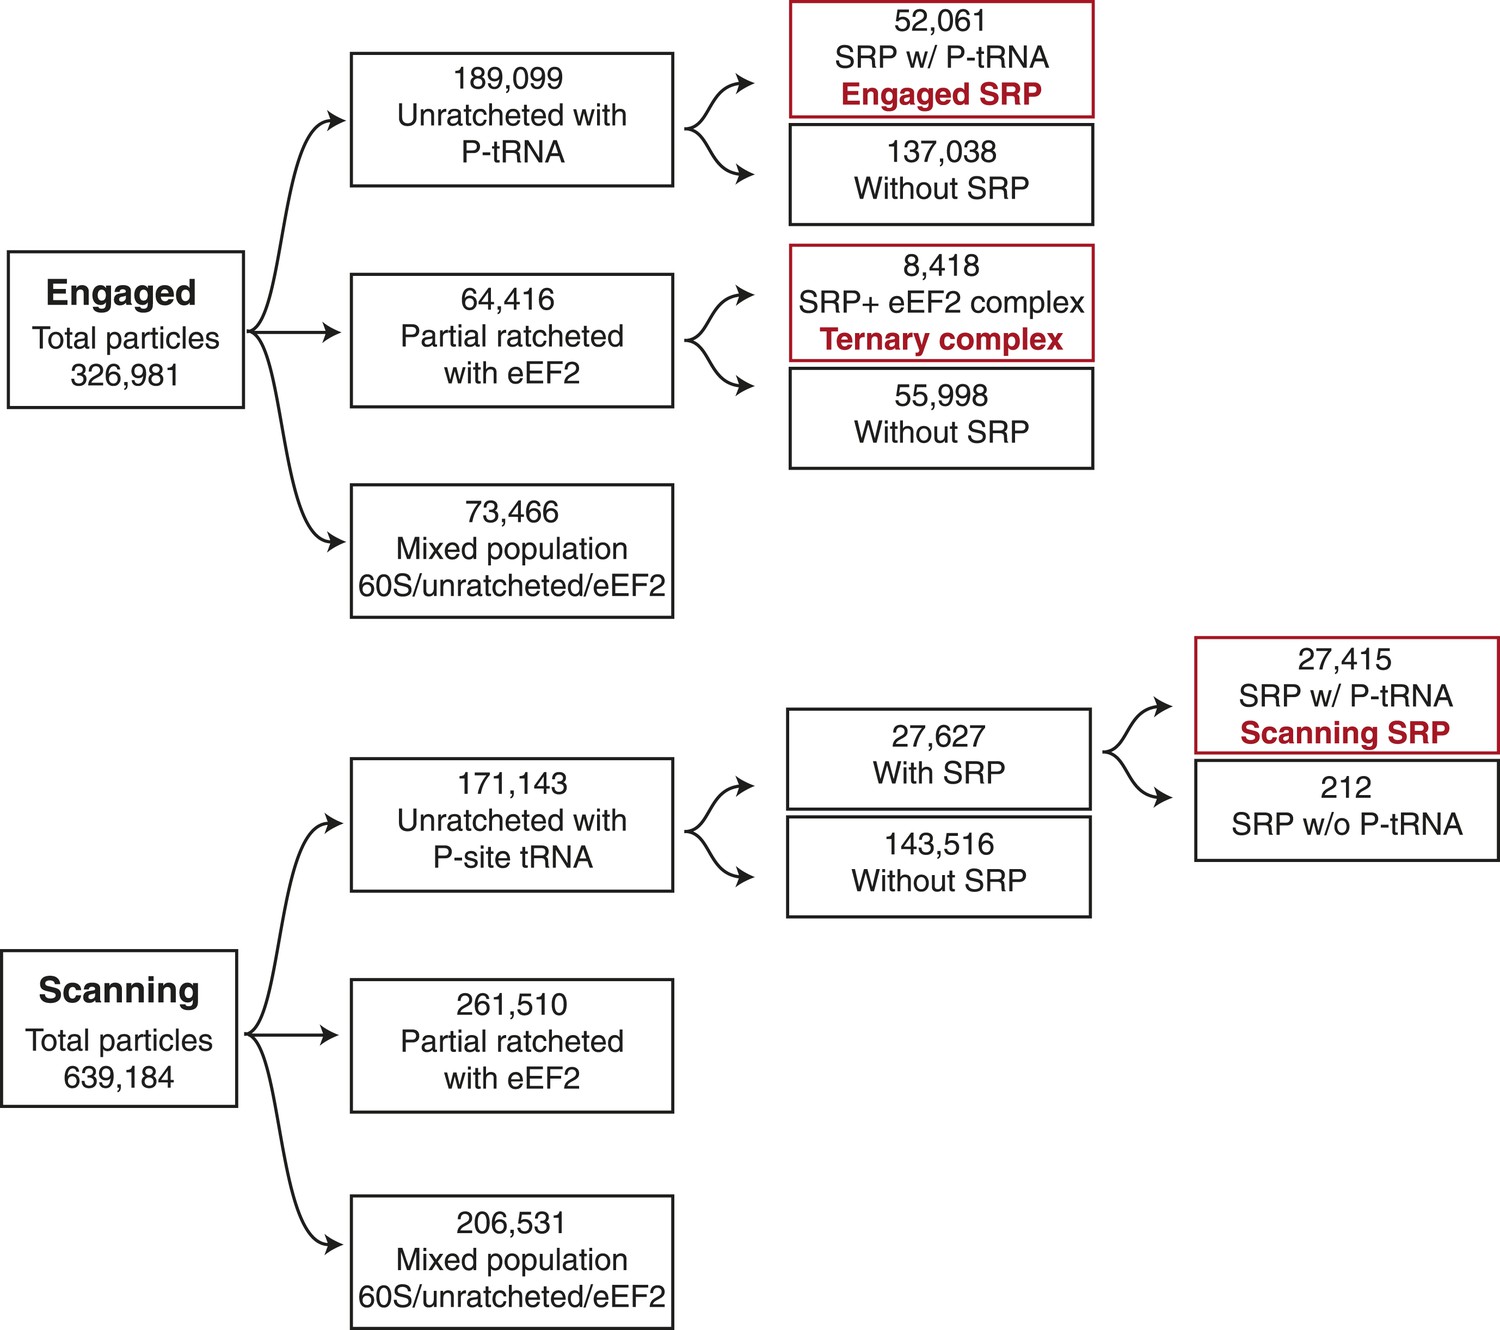
Schematic of computational classification.
Displayed is the classification scheme used for both the engaged and scanning EM datasets in order to isolate the population of particles used to reconstruct the three maps displayed in the manuscript, highlighted in red.
Figure 2—figure supplement 2
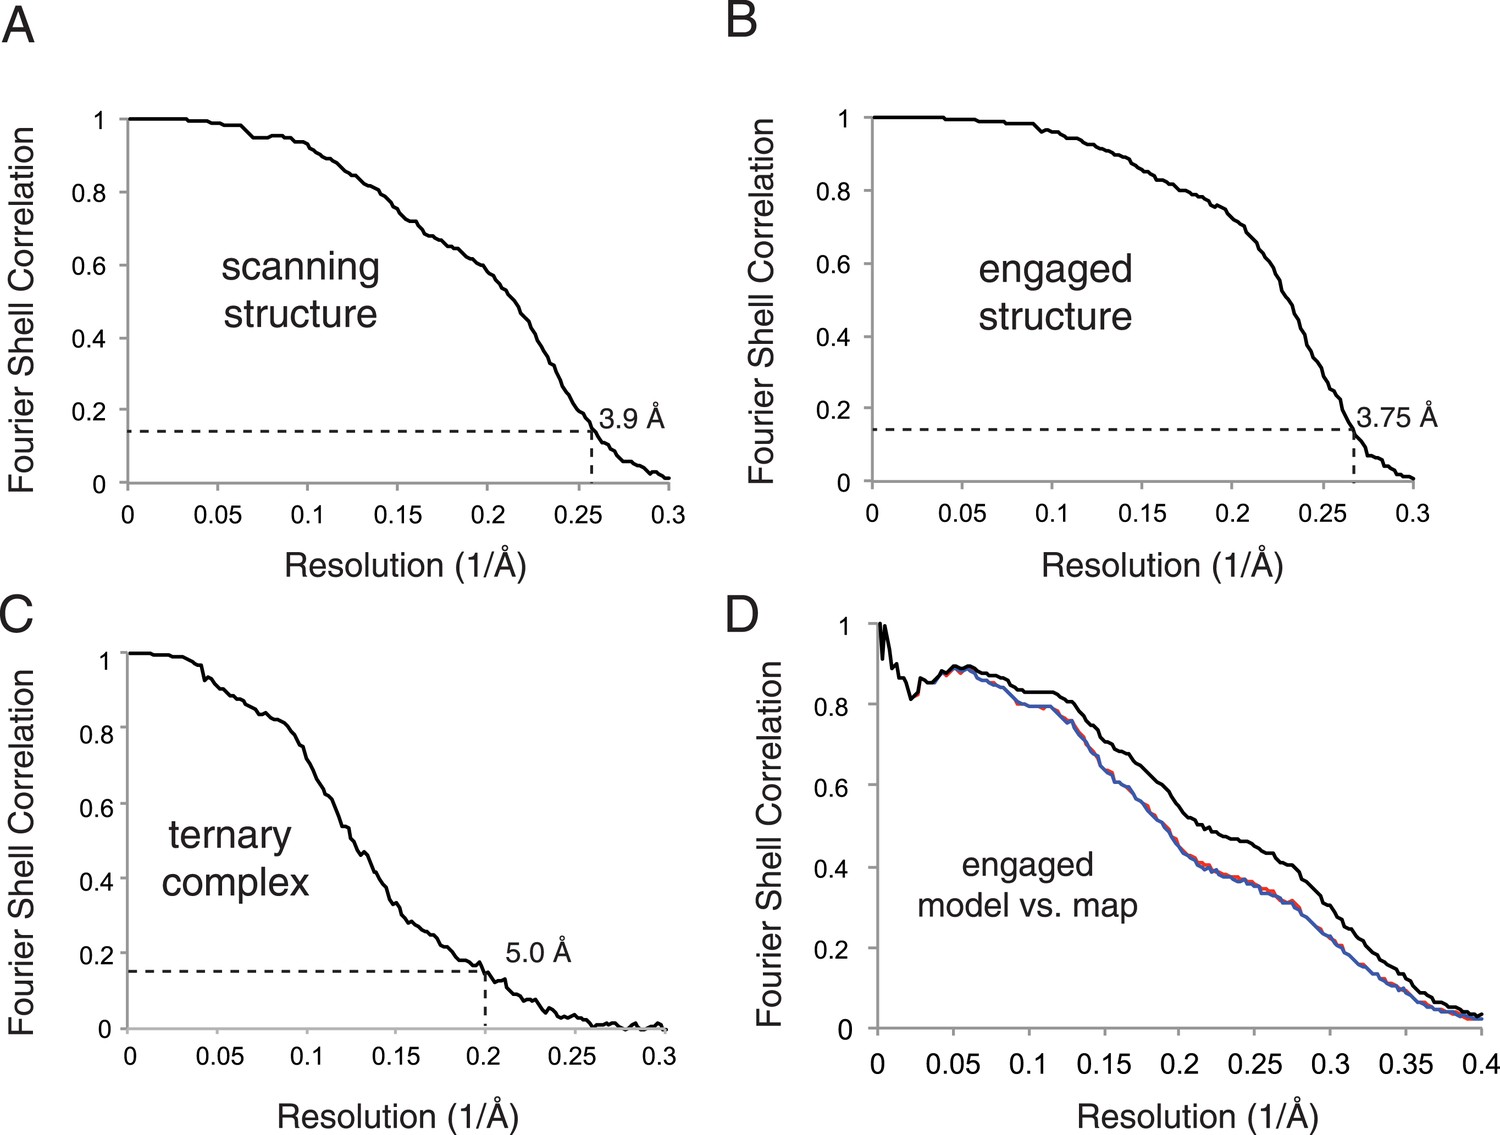
Map and model quality.
(A–C) Gold-standard Fourier Shell Correlation (FSC) curves for the density maps for the scanning, engaged, and ternary complex reconstructions. Resolution is demarcated using the FSC = 0.143 criterion. (D) FSC curves of the final model vs the complete engaged map (black); of a model refined in the first of two independent halves of the map (red); and of that model vs the independent second map (blue).
Figure 2—figure supplement 3

Local resolution of cryo-EM maps.
Density maps for the scanning and engaged samples colored by local resolution in Å as calculated using ResMap. Regions of functional importance are labelled.
Figure 2—figure supplement 4

Nascent polypeptide inside the exit tunnel.
Density for the nascent chain within the ribosomal exit tunnel in the scanning and engaged complexes. The weaker density for the nascent peptide in the scanning complex may be due to increased flexibility of the chain in this sample, as it is not anchored at the N-terminus through interaction with the M-domain. Alternatively it is possible the nascent chain is present at lower occupancy.
Figure 3
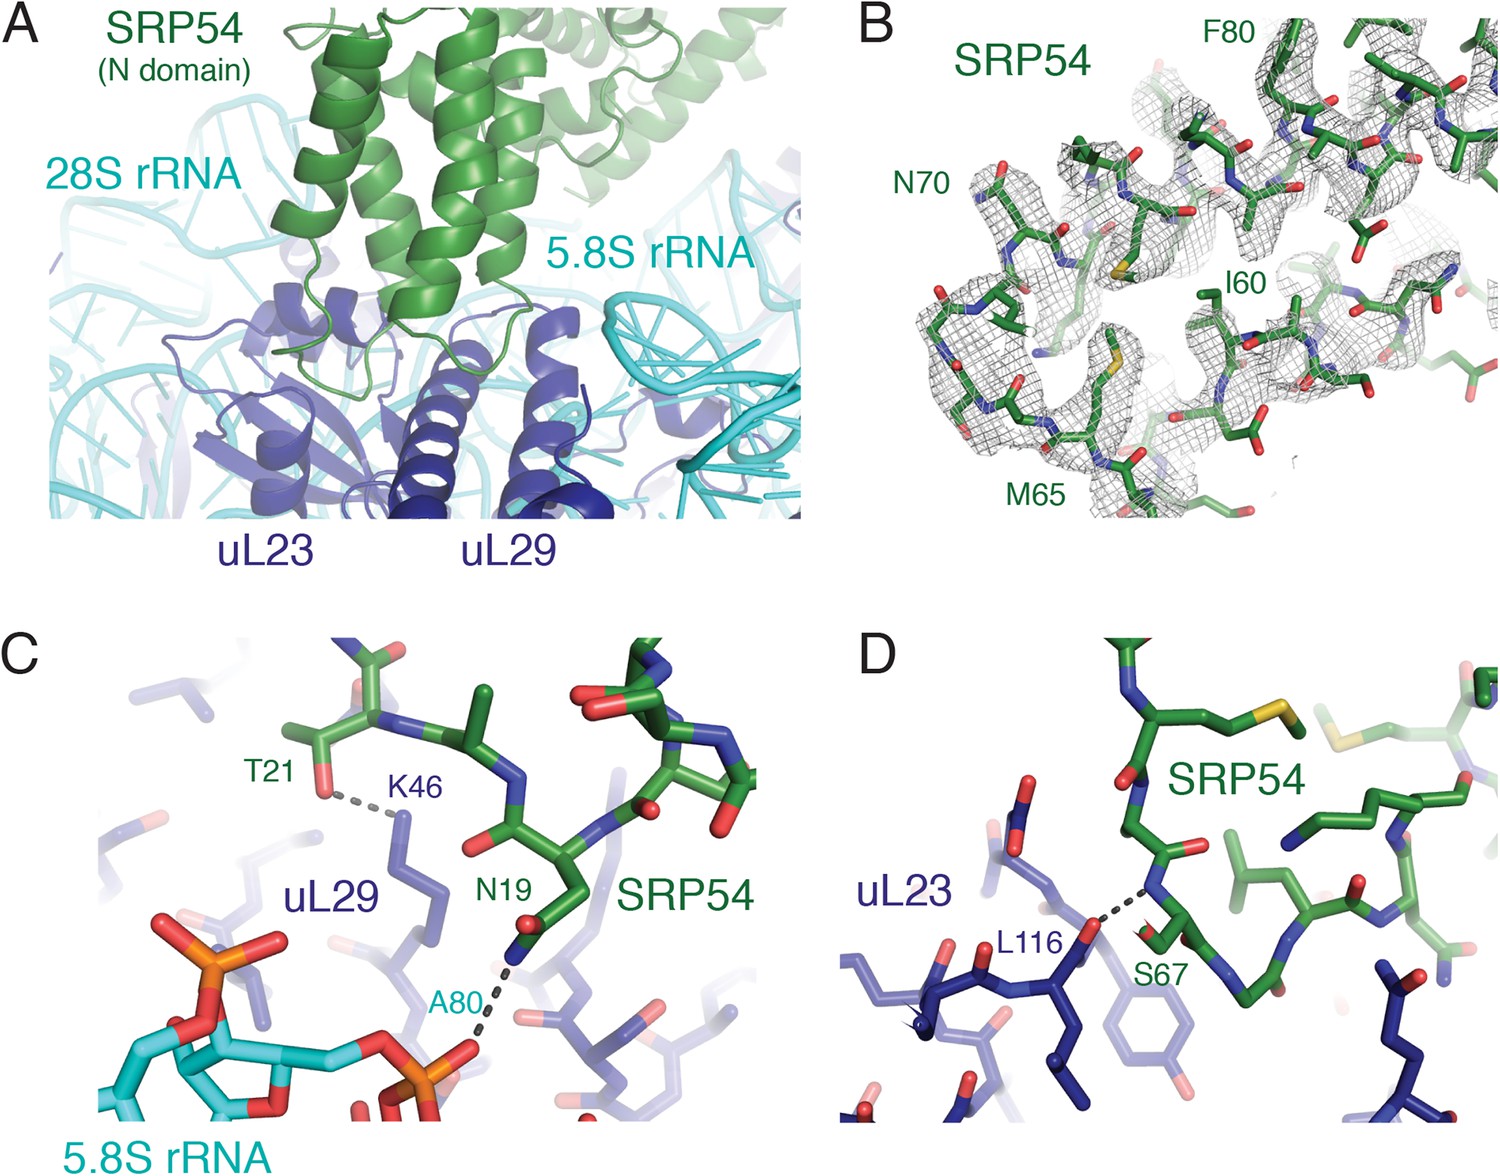
SRP-ribosome interactions near the exit tunnel.
(A) Overview of the N-domain of SRP54 (green), which is positioned near the exit tunnel by its interactions with the 5.8S rRNA and ribosomal proteins uL23 and uL29. (B) Representative density for one of the loops of SRP54, which anchors SRP to the ribosome, and its adjoining helices. (C, D) Specific hydrogen bonding interactions of SRP54 with the 5.8S rRNA (cyan) and ribosomal proteins uL29 and uL23 (dark blue).
Figure 4
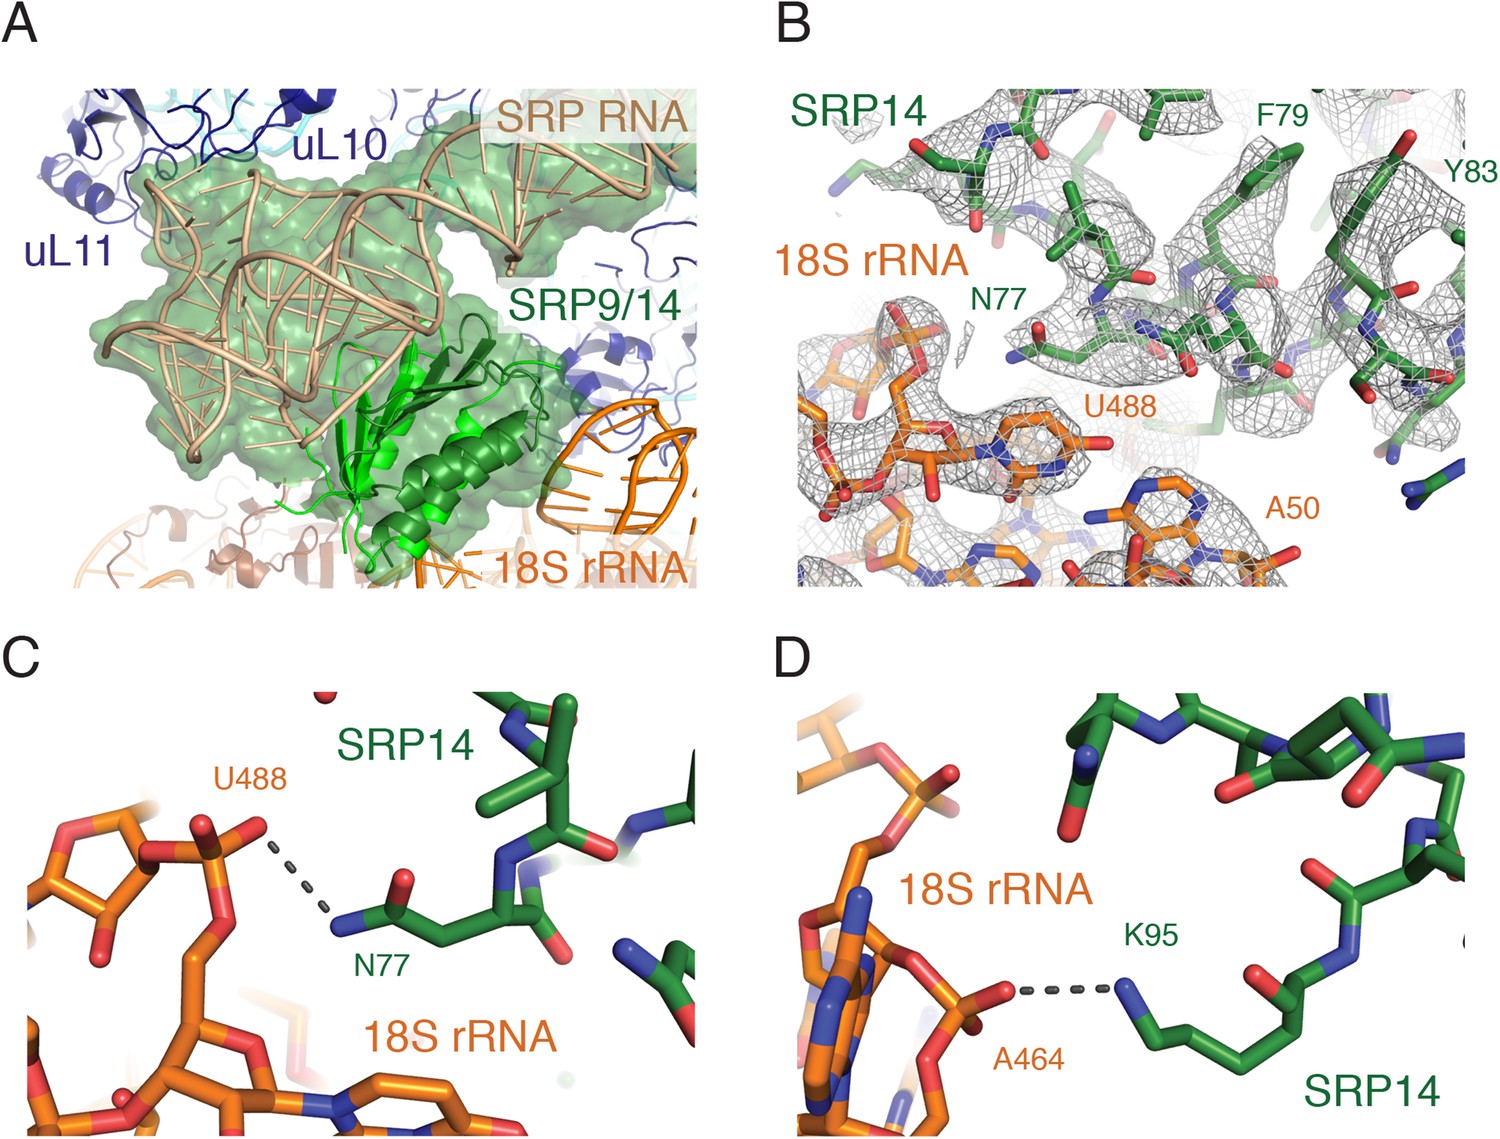
Interactions of the SRP Alu domain at the GTPase center.
(A) Overview of the Alu domain (green) contacting the 60S subunit via the ribosomal stalk (dark blue) and the 40S subunit through the 18S rRNA (orange). The engaged structure is shown; the scanning structure was essentially indistinguishable. (B) Representative density for the region of SRP14 that interacts with the 40S subunit. (C, D) Specific hydrogen bonding interactions of SRP14 with the backbone of the 18S rRNA.
Figure 5 with 1 supplement
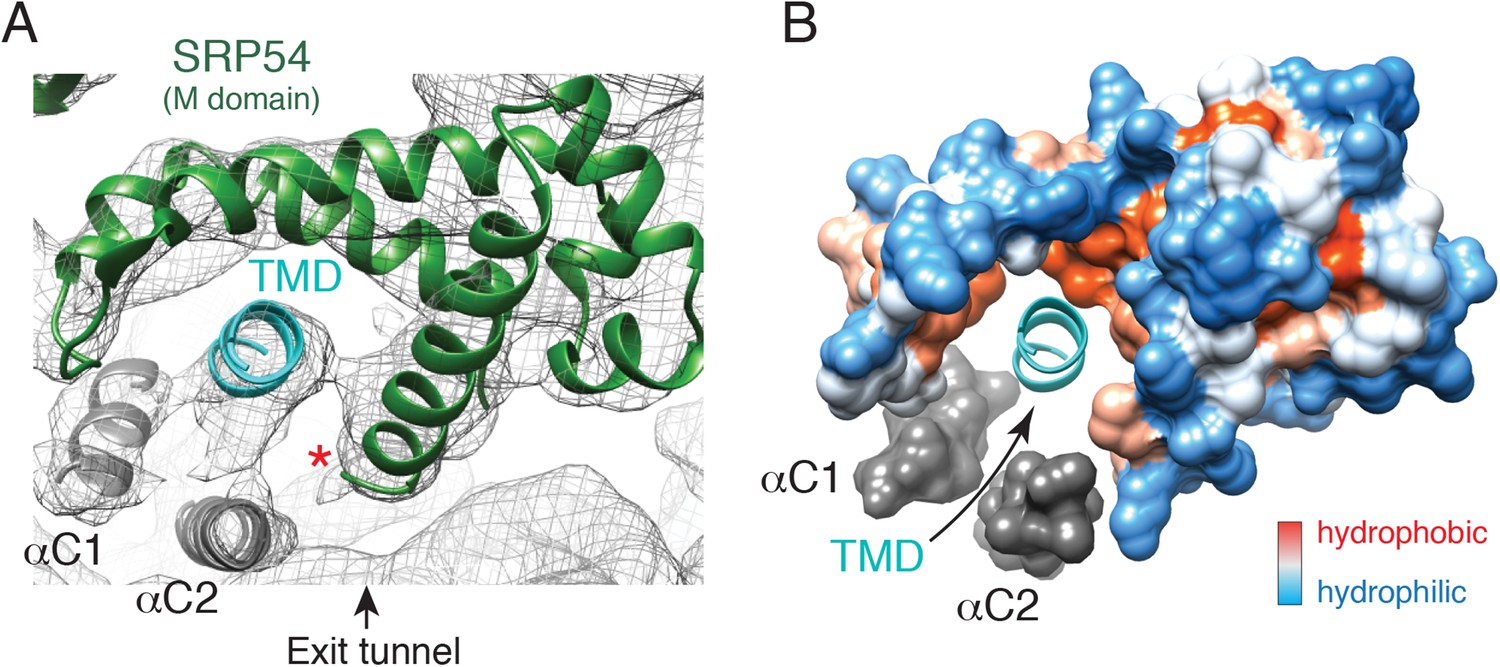
The engaged SRP54 M domain.
(A) The final model of the SRP54 M-domain (green) and bound TMD (cyan) is displayed in the density for the engaged complex. The C-terminus of this domain is indicated with a red asterisk. Density for two additional helices (termed αC1 and αC2), which were not part of the earlier crystal structures, represent the C-terminus of SRP54 and would be connected via flexible linkers (not modelled) to the remainder of the M-domain. These helices enclose the TMD substrate, minimizing the exposed hydrophobic surface area. (B) Displayed is a surface representation of the M-domain, colored by hydrophobicity, indicating the hydrophobic binding pocket for the TMD enclosed by the C-terminal helices of SRP54. See also Figure 5—figure supplement 1.
Figure 5—figure supplement 1
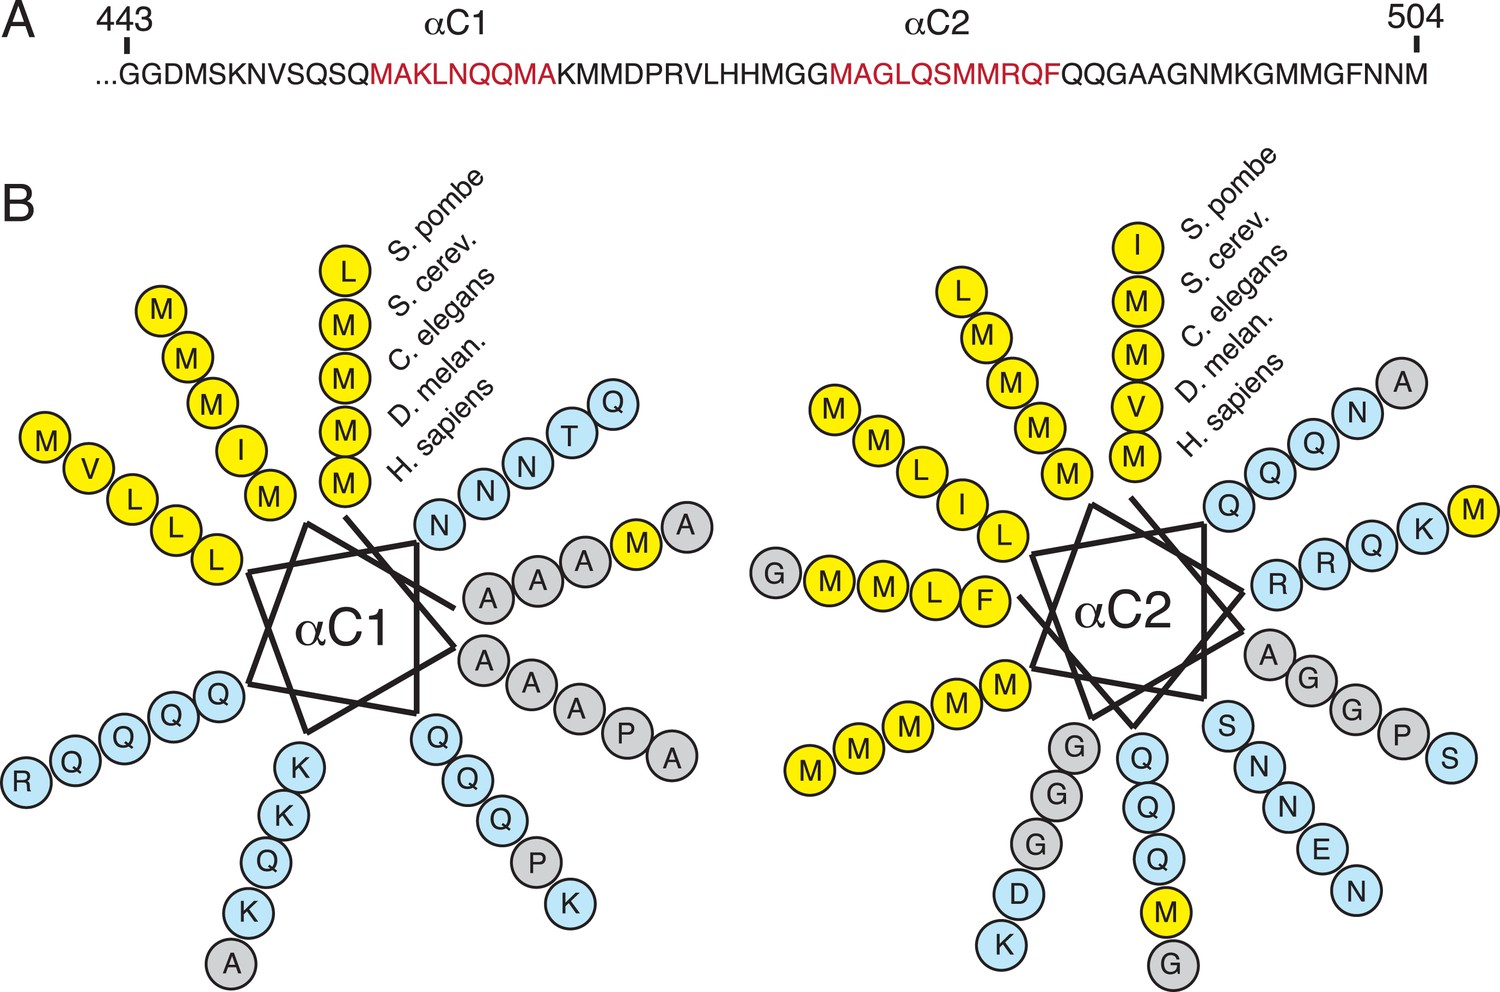
Sequence conservation of the amphipathic helices at the C-terminus of SRP54.
(A) Sequence of the ∼70 C-terminal amino acids of human SRP54, which were truncated in previous crystal structures. Regions predicted to be helical are indicated in red. (B) Helical wheel depictions of the two predicted C-terminal helices from diverse eukaryotic species (each represented in concentric rings). Note that the amphipathic nature of both helices is highly conserved, with the hydrophobic face strongly enriched in methionines. This is consistent with their observed positioning surrounding the TMD substrate in the M-domain within the engaged structure.
Figure 6
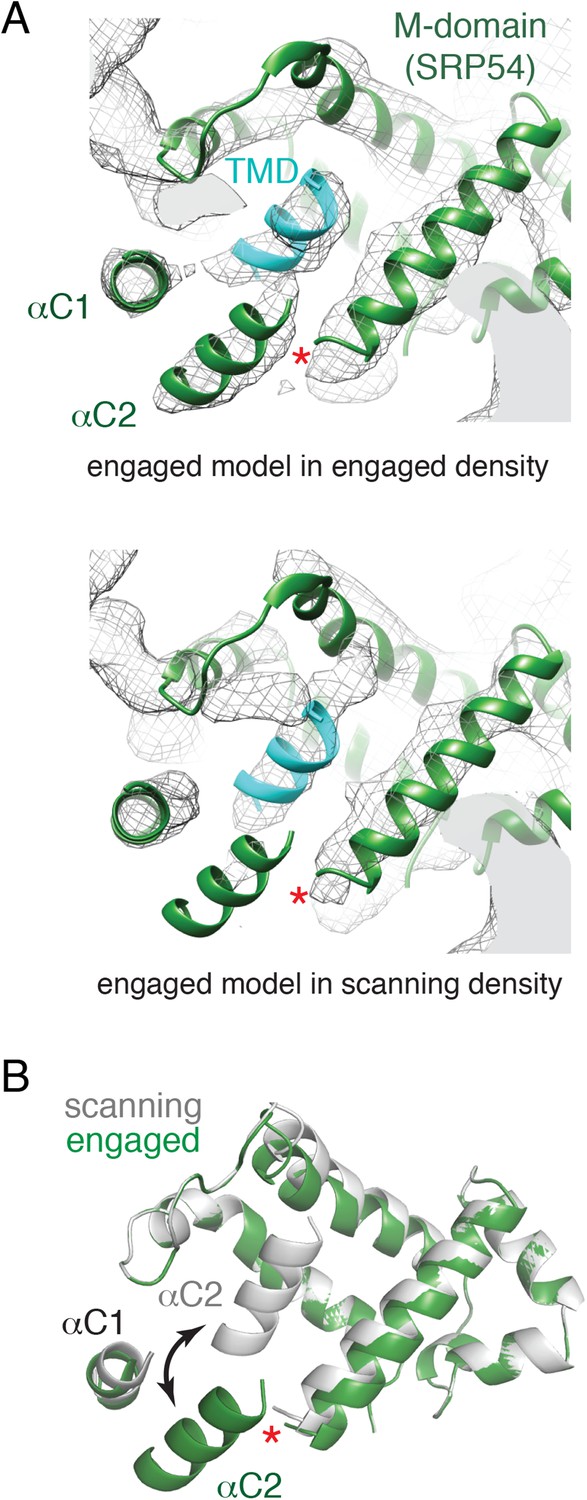
Comparison of the engaged and scanning M-domain.
(A) Density and associated model of the engaged M-domain (top panel) and rigid-body fitting of the engaged model into the density for the scanning structure (bottom panel). Note that density in the engaged position of αC2 is nearly absent in the scanning structure. The C-terminus of the M-domain preceding αC1 and αC2 is indicated by a red asterisk. (B) Superposition of the scanning and engaged M-domain models suggests that αC2 is repositioned (arrow) upon binding to a TMD (not depicted for clarity).
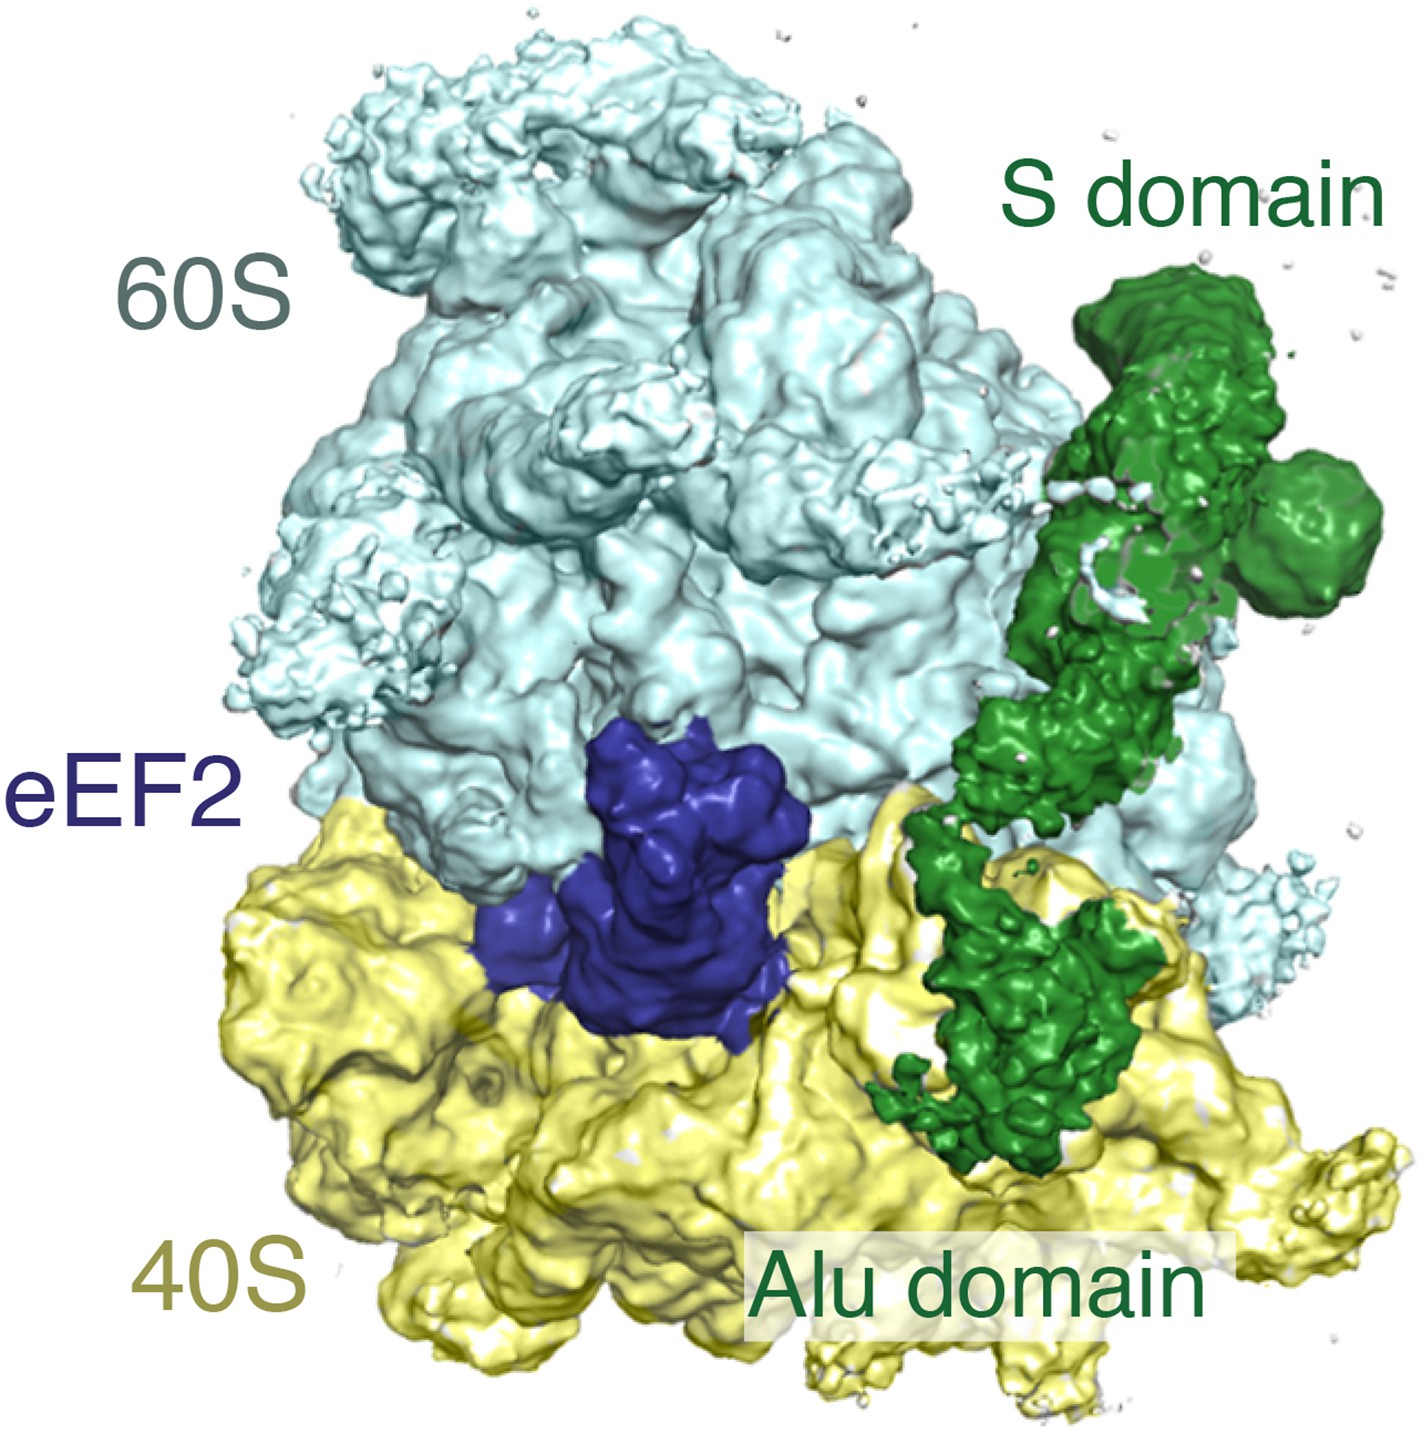
Figure 7 with 1 supplement

Integration of SRP recruitment with the translational elongation cycle.
(A) Stalled RNCs were produced and affinity purified via the nascent chain from translation reactions supplemented with increasing amounts of a GTPase deficient Hbs1 (Hbs1-DN). SRP recovery is reduced by Hbs1-DN for scanning mode RNCs, but unaffected for engaged RNCs. (B) Following translation in the presence of 3X-FLAG tagged Hbs1-DN, HA-tagged RNCs were purified via the FLAG tag and analyzed for the indicated components. Recovery of SRP in a ternary complex with Hbs1 and the ribosome is observed for both the scanning and engaged mode RNCs, but SRP recovery is substantially reduced in the scanning mode. (C) Two views depicting the cryo-EM density for a ternary complex of the ribosome bound to eEF2 (blue) in the GTPase center and the S domain of SRP (green) at the exit tunnel. (D) Left panel: diagram illustrating that translation of a construct containing a stop codon 35 amino acids from the beginning of the TMD will only expose the TMD after termination. Right panel: the construct from the diagram (or a 3R control) was translated for a short 3 min ‘pulse’ followed by either immediate cooling, or addition of an initiation inhibitor and a 30 min ‘chase’ translation. Affinity purification of the nascent chain from the pulse and chase samples reveals that actively translating RNCs can recruit SRP in a TMD-dependent manner. See also Figure 7—figure supplement 1.
Figure 7—figure supplement 1
Simultaneous binding of eEF2 and SRP.
View of the GTPase center of the cryo-EM map of the ternary complex containing the ribosome, eEF2, and SRP. Note that at the lower threshold that is depicted in this figure, density for the Alu domain and linker regions of SRP are observed. The comparatively poor density of these areas of SRP relative to the S-domain suggests that they are probably dynamic.
Figure 8 with 1 supplement
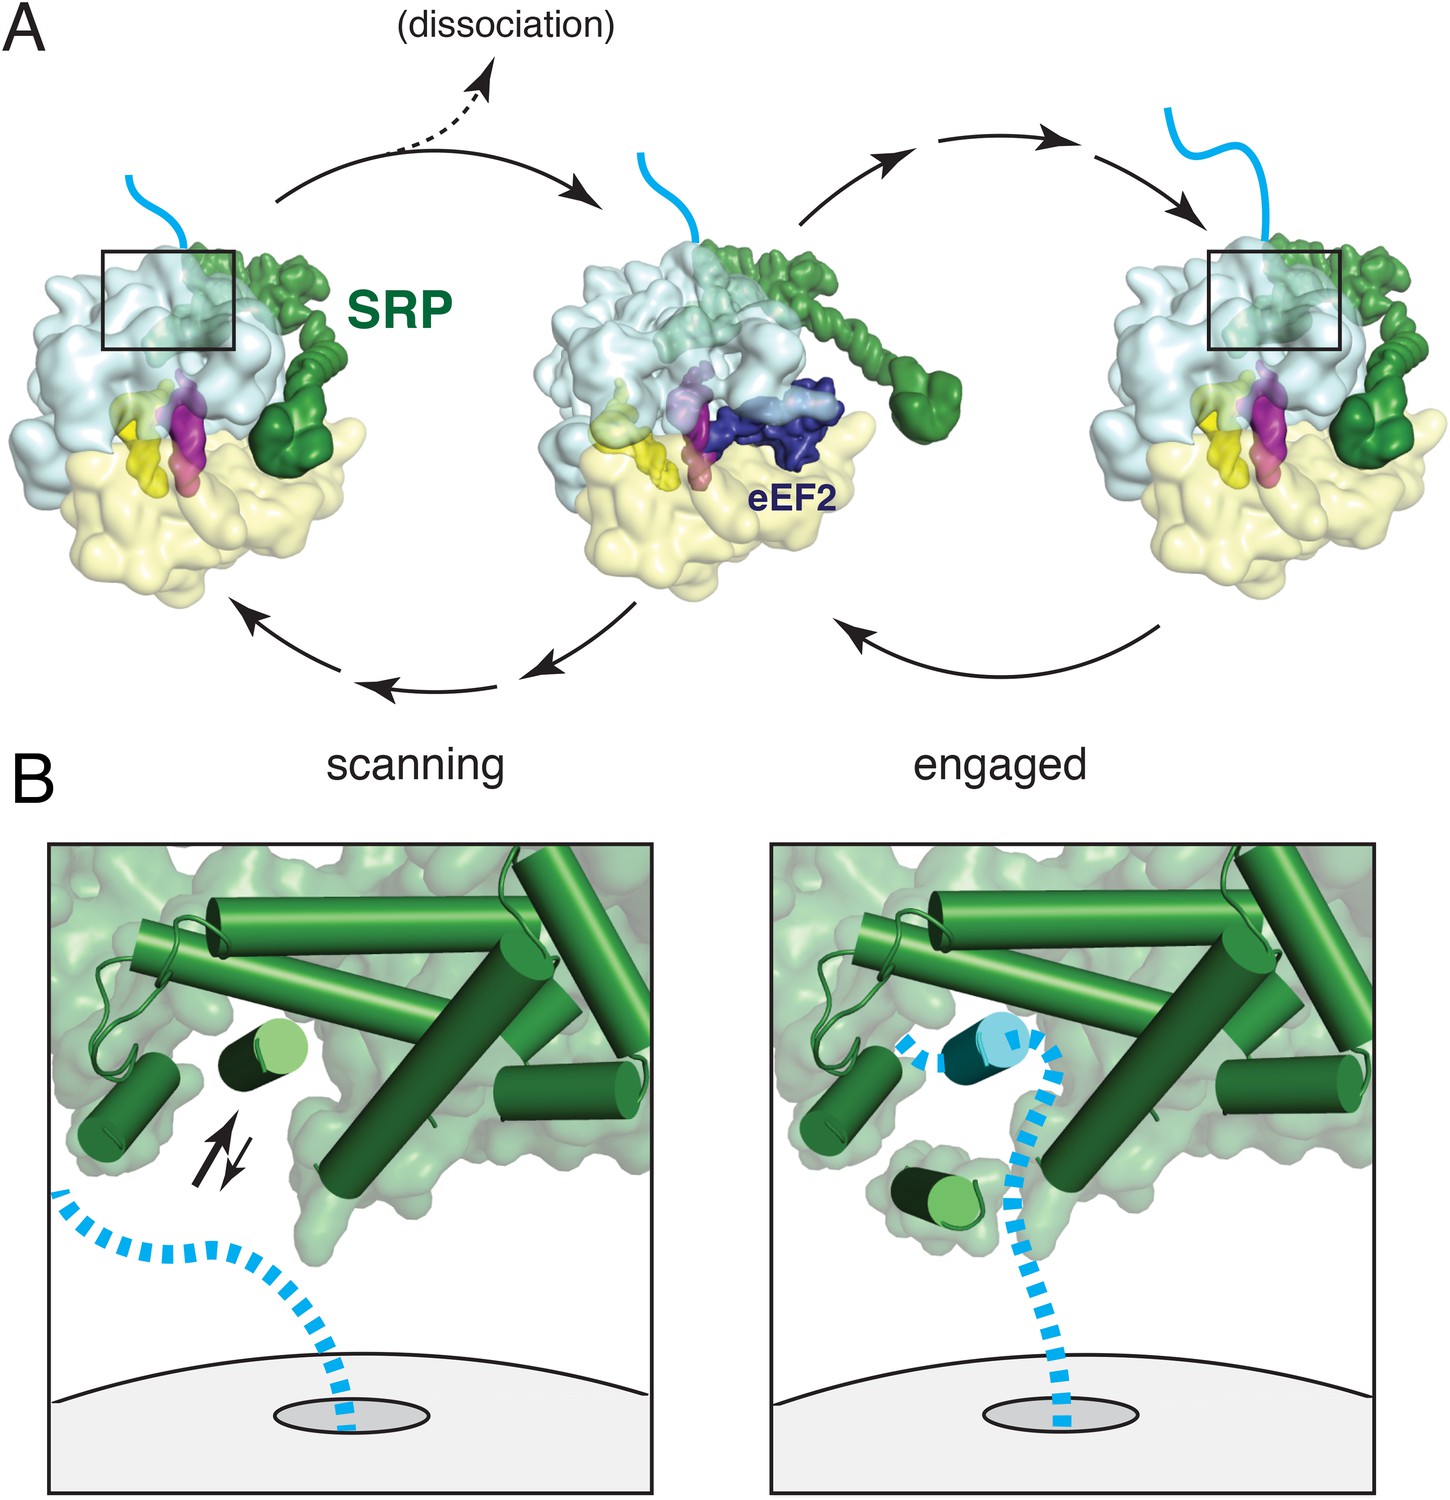
Working model for SRP scanning and engagement of a nascent membrane protein.
(A) Model for SRP dynamics and conformation during translational elongation in its scanning and engaged states. The Alu domain swings away from the ribosome to accommodate translation factor binding (eEF2 is shown). Scanning SRP is more prone to displacement by translation factors, while engaged SRP remains stably bound. (B) Close-up views of the relative positions and conformations of the SRP54 M-domain (green) and hypothetical nascent chain (blue) during scanning (left) and engagement (right). The arrows in the scanning diagram depict hypothesized dynamics of the αC2 helix to permit nascent chain sampling. A hydrophobic domain (blue cylinder) displaces the αC2 helix to its lid position. See also Figure 8—figure supplement 1.
Figure 8—figure supplement 1
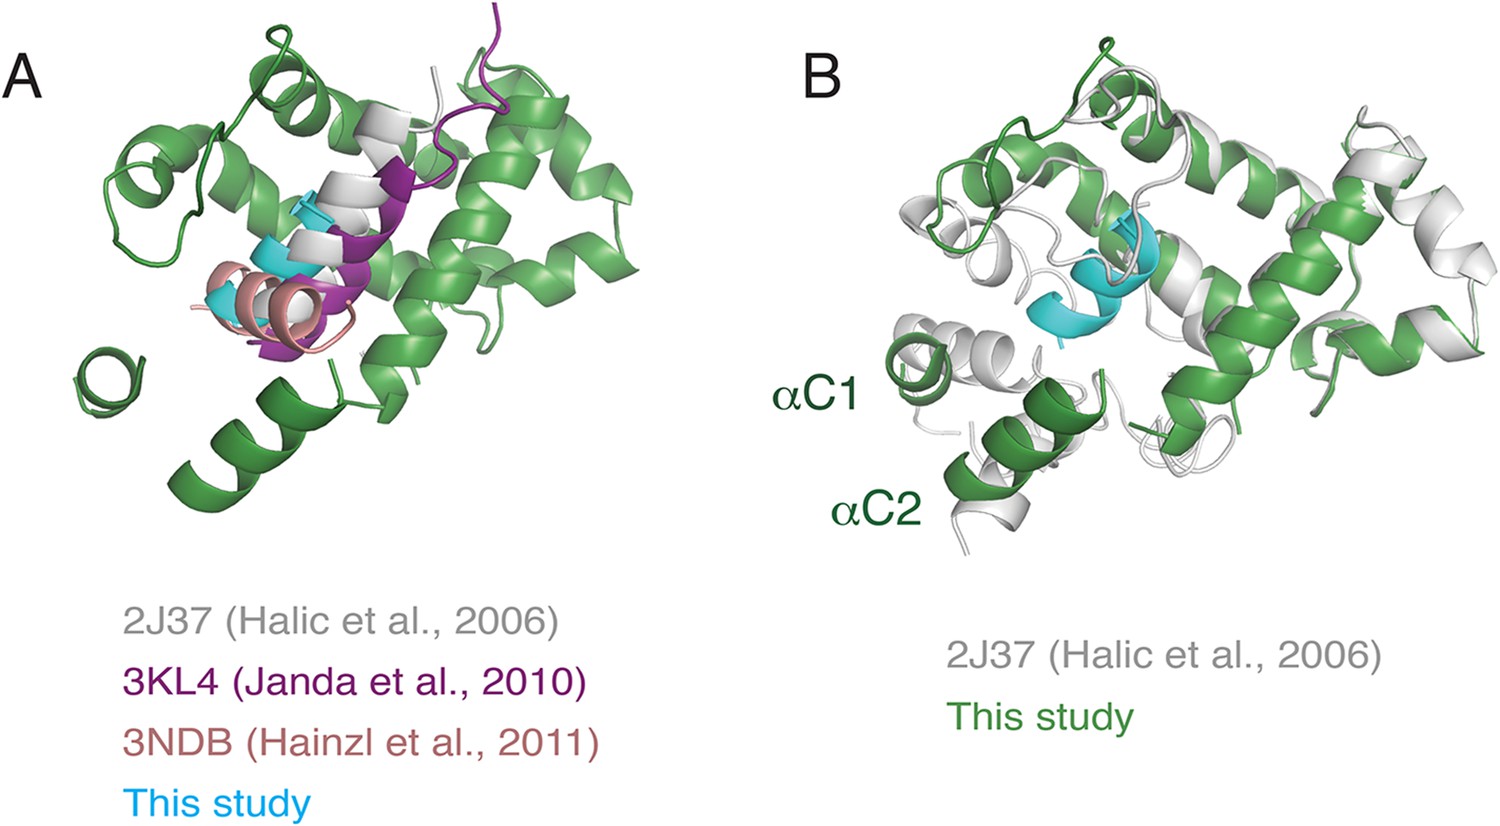
Superposition of various M-domain structures.
(A) Comparison of the positioning of the hydrophobic substrate bound to the SRP M-domain from crystal structures of SRP54 and an earlier cryo-EM reconstruction of SRP bound to the plant ribosome. (B) Comparison of localization of the C-terminus of SRP54 between this study and the earlier reconstruction of SRP bound to the plant ribosome.
Tables
Table 1
Refinement and model statistics
| Data collection | Scanning | Engaged |
|---|---|---|
| Particles | 27,415 | 52,061 |
| Pixel size (Å) | 1.34 | 1.34 |
| Defocus range (μm) | 2.0–3.5 | 2.0–3.5 |
| Voltage (kV) | 300 | 300 |
| Electron dose (e/Å2) | 27 | 27 |
| Map sharpening B-factor (Å2) | −77.0 | −82.8 |
| 60S-S domain | 40S-Alu domain | |
|---|---|---|
| Model composition | ||
| Non-hydrogen atoms | 149,733 | 78,464 |
| Protein residues | 7571 | 5021 |
| RNA residues | 4257 | 1824 |
| Ions | 133 | 36 |
| Refinement | ||
| Resolution used (Å) | 3.8 | 3.8 |
| Average B factor ( Å2) | 89.1 | 109.6 |
| R factor* | 0.30 | 0.32 |
| Fourier Shell Correlation (FSC)† | 0.85 | 0.79 |
| Rms deviations | ||
| Bonds (Å) | 0.011 | 0.011 |
| Angles (°) | 1.9 | 1.9 |
| Ramachandran plot | ||
| Favored (%) | 93 | 91 |
| Outliers (%) | 7 | 9 |
-
*
R factor = Σ||Fobs| − ||Fcalc|/Σ|Fobs|.
-
†
FSC = Σ(FobsF*calc)/√(Σ|Fobs|2 Σ|Fcalc|2).
Download links
A two-part list of links to download the article, or parts of the article, in various formats.
Downloads (link to download the article as PDF)
Open citations (links to open the citations from this article in various online reference manager services)
Cite this article (links to download the citations from this article in formats compatible with various reference manager tools)
Structures of the scanning and engaged states of the mammalian SRP-ribosome complex
eLife 4:e07975.
https://doi.org/10.7554/eLife.07975


