Flux analysis of cholesterol biosynthesis in vivo reveals multiple tissue and cell-type specific pathways
- University of Texas Southwestern Medical Center, United States
- Howard Hughes Medical Institute, University of Texas Southwestern Medical Center, United States
Figures
Figure 1
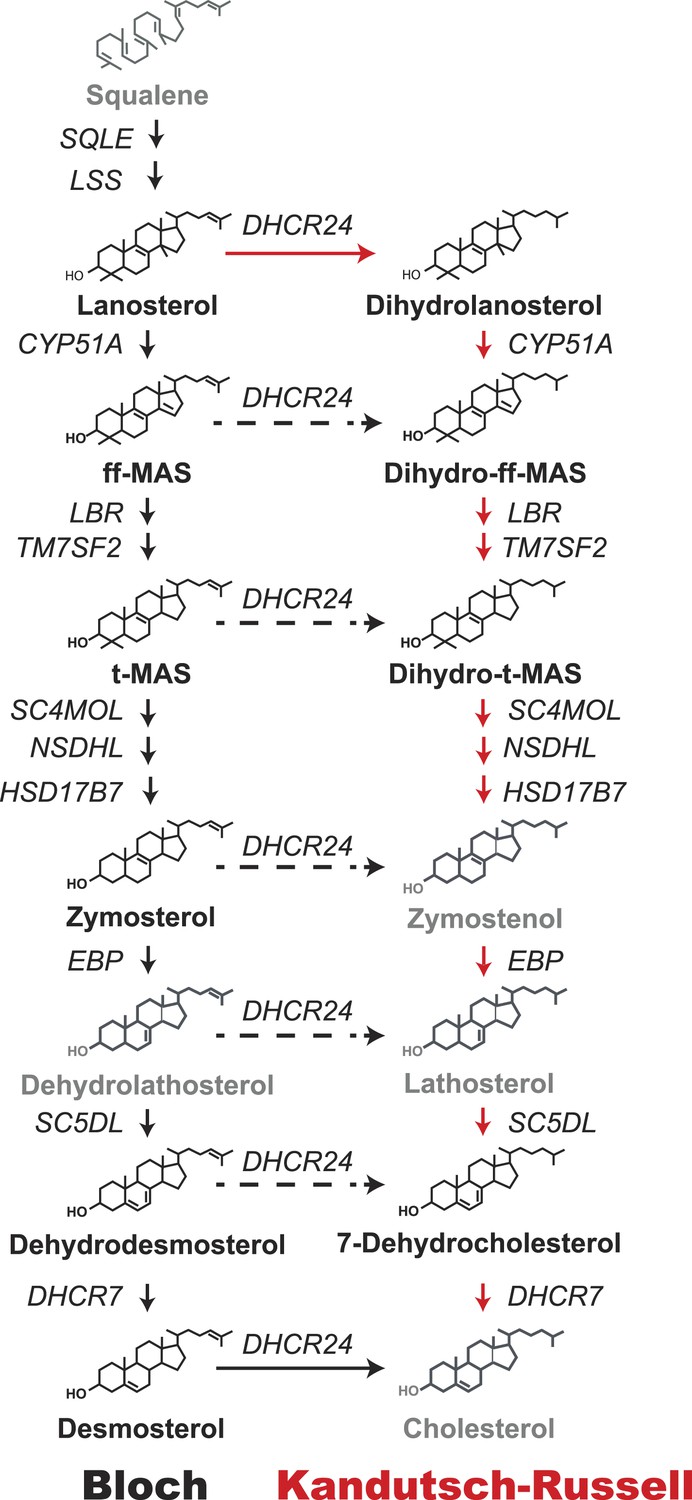
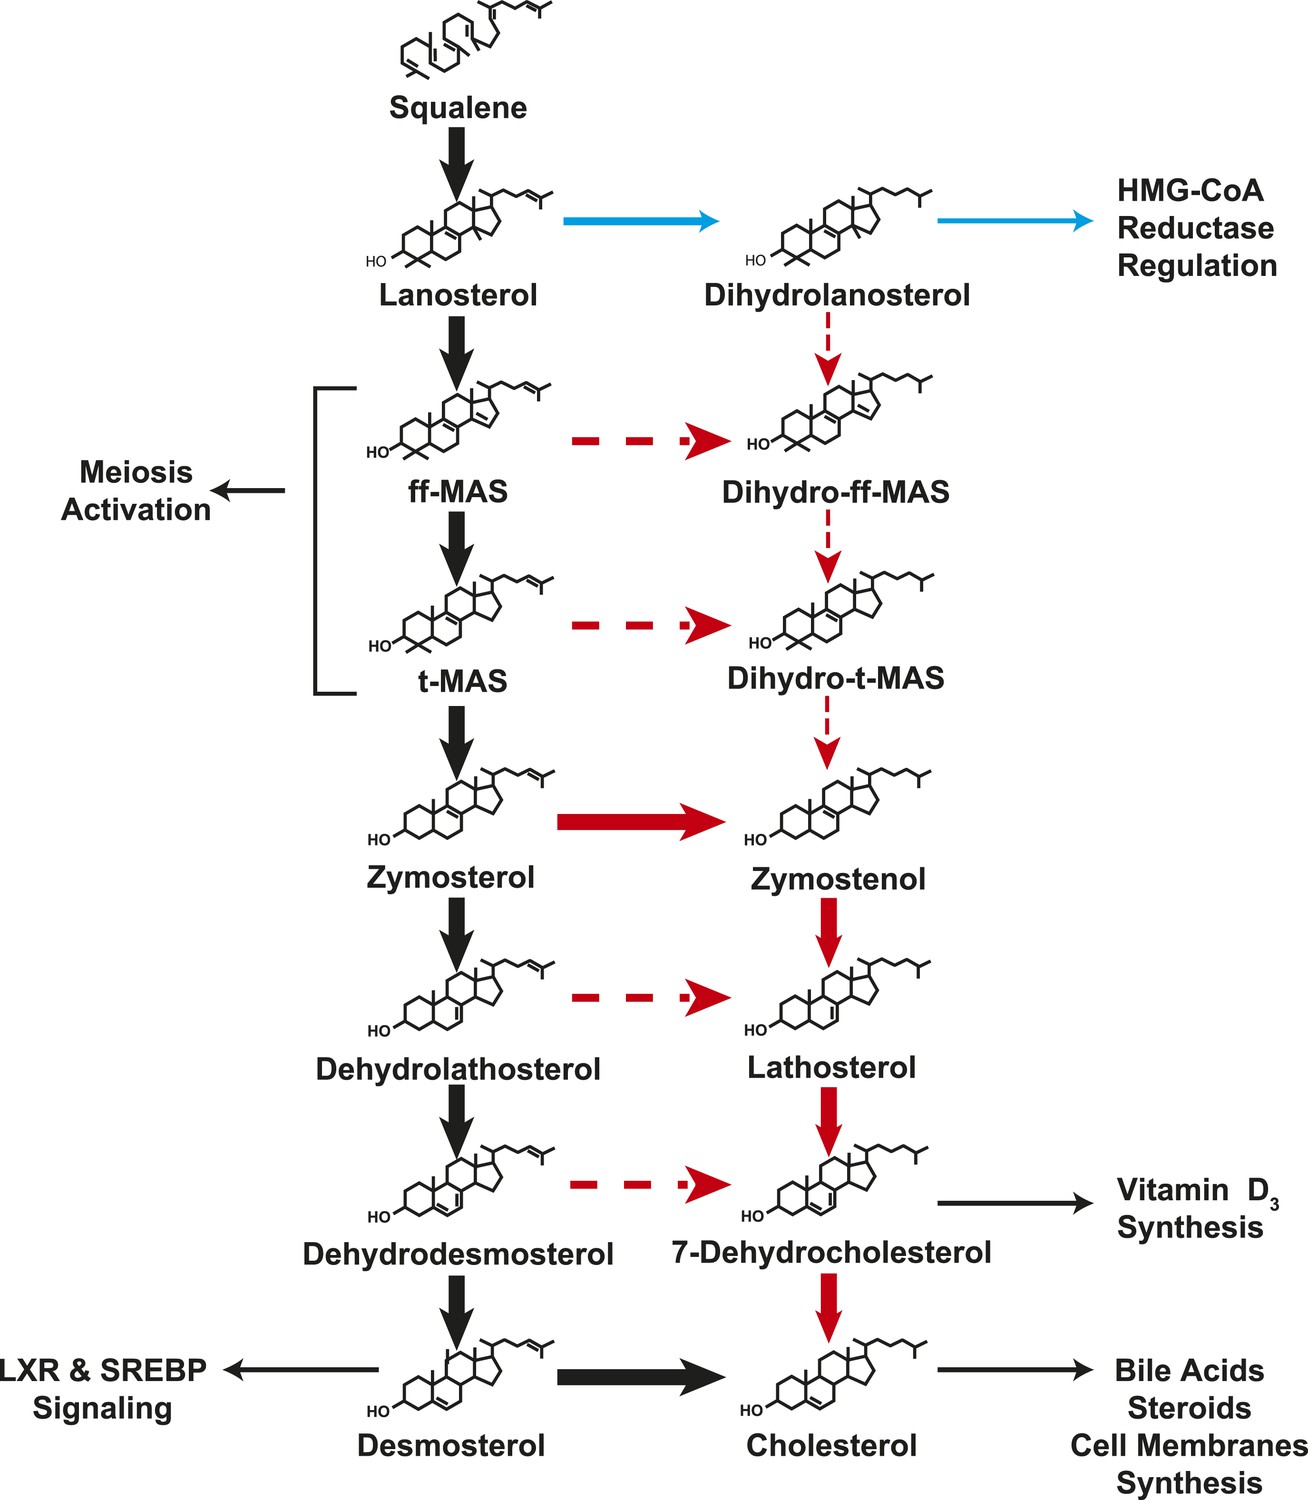
Schematic representation of the Bloch and Kandutsch–Russell (K–R) pathways for the enzymatic conversion of squalene to cholesterol.
The Bloch pathway, indicated by solid black arrows, is shown on the left. The Kandutsch–Russell pathway, indicated by red arrows, is shown on the right. Additional potential sites of crossover from the Bloch to K–R pathway are indicated by broken arrows. Sterol intermediates that were not measured using deuterium water labeling are shown in gray.
Figure 2 with 1 supplement

Sterol biosynthesis in cultured cells.
(A) Deuterated water (D2O) labeling of lanosterol in cultured cells. (Top) Isotopomer spectrum of lanosterol in SV-589 cells grown for 24 hr in the absence (left) or presence (right) of 5% D2O added to the medium. (Bottom) Turnover of lanosterol in SV-589 cells. Cells were grown in NCLPPS (open circles) or in NCLPPS plus 25-hydroxycholesterol (1 μg/ml) (closed circles) to ∼60% confluence. After 16 hr , the medium was supplemented with 5% D2O and cells were harvested at 0, 0.5, 1, 2, 4, 6, 8, 12, and 24 hr (last two points not shown, but used for modeling). Sterols were analyzed by LC-MS/MS and the fraction of lanosterol that was newly synthesized was determined using isotopomer analysis (IA) (see Figure 2—figure supplement 1) and the results were fit to a first-order kinetic model (solid lines) as described in the ‘Materials and methods’. The rates of synthesis of lanosterol in the presence or absence of sterols were calculated by multiplying the first-order rate constant by the concentration of lanosterol. Standard deviations are reported based on four independent replicates. (B) Biosynthetic rates of intermediary sterols in cultured cells. The rate of synthesis of intermediary sterols in the Bloch (left) and K–R (right) pathways was measured using D2O labeling. Cells were plated at a density of 500,000/60 mm dish and grown to ∼60% confluence. D2O was then added to the medium to a final concentration of 5% (vol/vol). Cells were harvested at 0, 0.5, 1, 2, 4, 6, 8, 12, and 24 hr, and lipids were extracted using methanol-dichloromethane. Sterols were analyzed by LC-MS/MS and the fraction of each sterol that was newly synthesized was determined using IA and the results were fit to a first-order kinetic model as described in the ‘Materials and methods’. Y1-BS1 cells, a mouse adrenal cell line (Top) were grown in 15%horseserum. SV-589 cells, an immortalized human skin fibroblast line (bottom), were grown in either 10% FCS. Means and standard deviations are reported based on four independent replicate experiments in each cell line. ***p < 0.001.
Figure 2—figure supplement 1
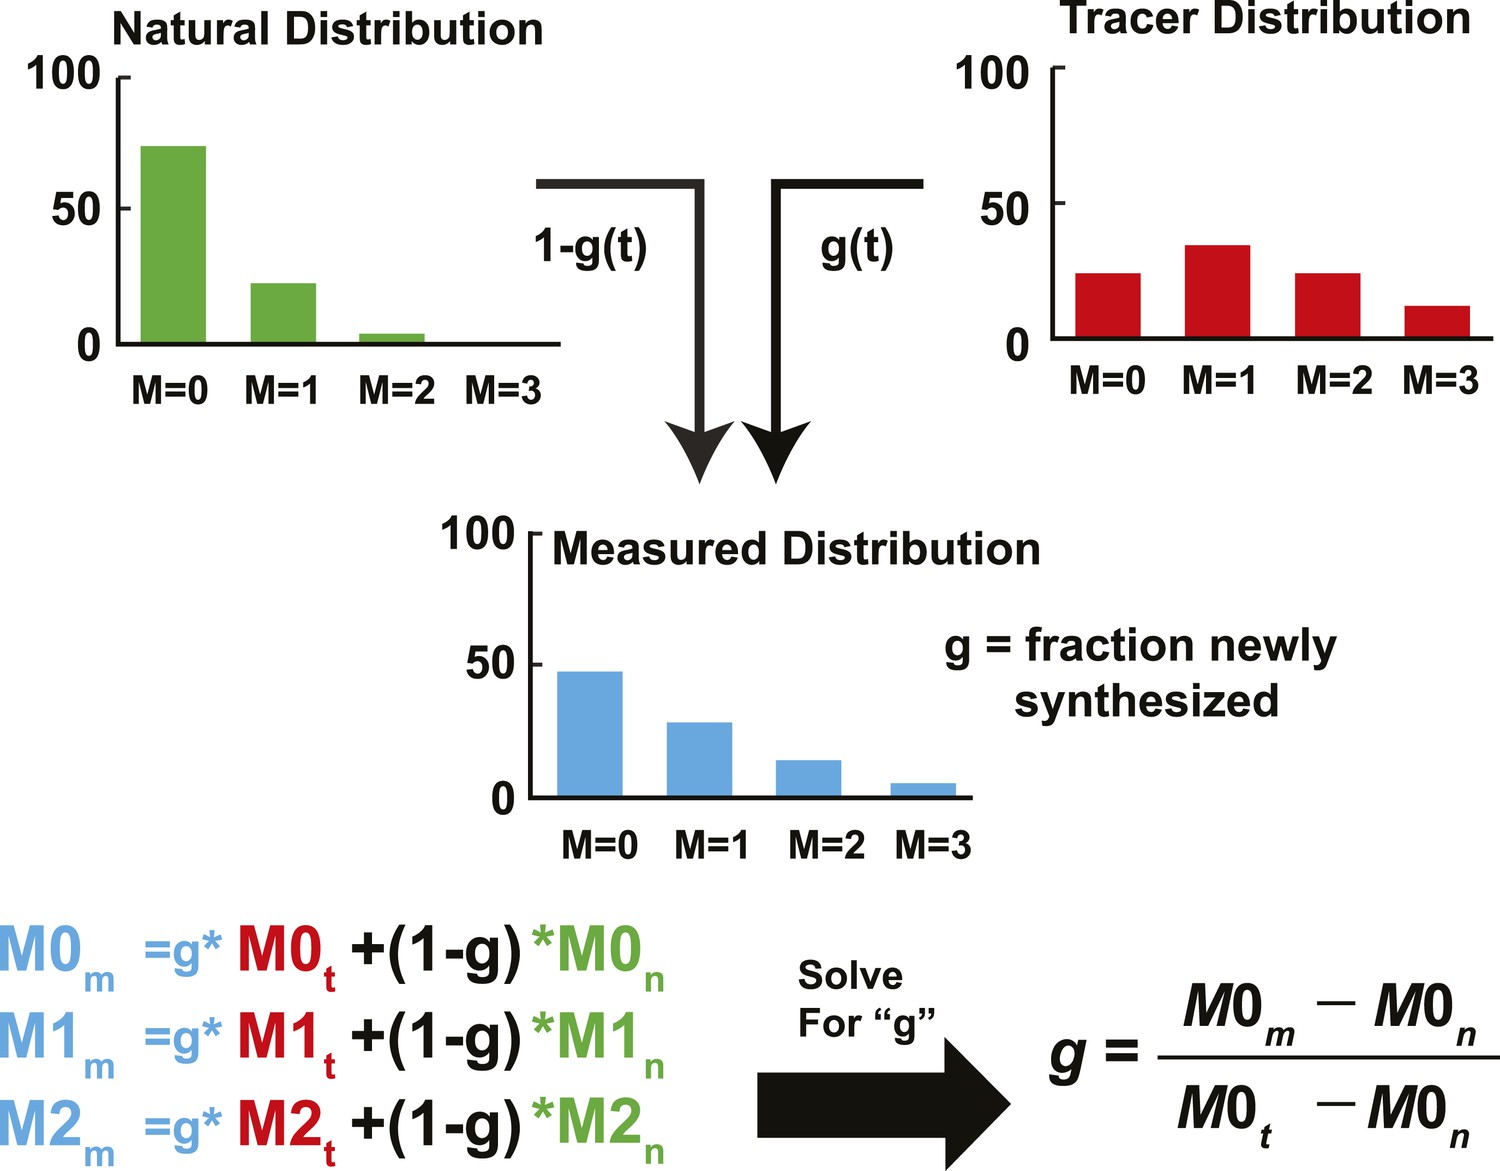
Schematic representation of IA adapted from Kelleher and Masterson (1992).
The fractional abundance of each sterol peak in an unlabeled and labeled sample can be used to calculate the rate of newly synthesized sterols. In the unlabeled sample, the fraction abundance of M = 0 is 0.74 (we will call this M0n); for the labeled sample, it is 0.23 (M0t). If we sample a sterol as the pool is turning over, the fractional abundance of M = 0 (M0m) will decrease from 0.74 to 0.23. The corresponding values of M2m will increase from 0.04 to 0.29. Using this data, the fraction of molecules that are newly synthesized (g) can be estimated using isotopic spectral analysis (IA). Using IA, the value of M0m has two components: (1) M0n times the fraction of molecules not labeled (1 − g). (2) M0t times the fraction of molecules newly synthesized (g). These two values can be summed to get the value of M0m. This same analysis can be done for any of the peaks. Then, by solving for g, the fraction of molecules newly synthesized can be determined based on M0m, M0n, and M0t. M0m is the measured value that is obtained from MS. M0n is determined from an unlabeled sample or from a natural abundance calculator. M0t can be determined from samples exposed to label long enough to ensure turnover of the entire pool, or using mass isotopomer distribution analysis (MIDA) (Hellerstein and Neese, 1999). The biosynthetic rate was calculated by fitting the relationship between g and time to a first-order kinetic model. The rate constant was multiplied by the concentration, yielding the biosynthetic rate, as demonstrated in Figure 2B.
Figure 3
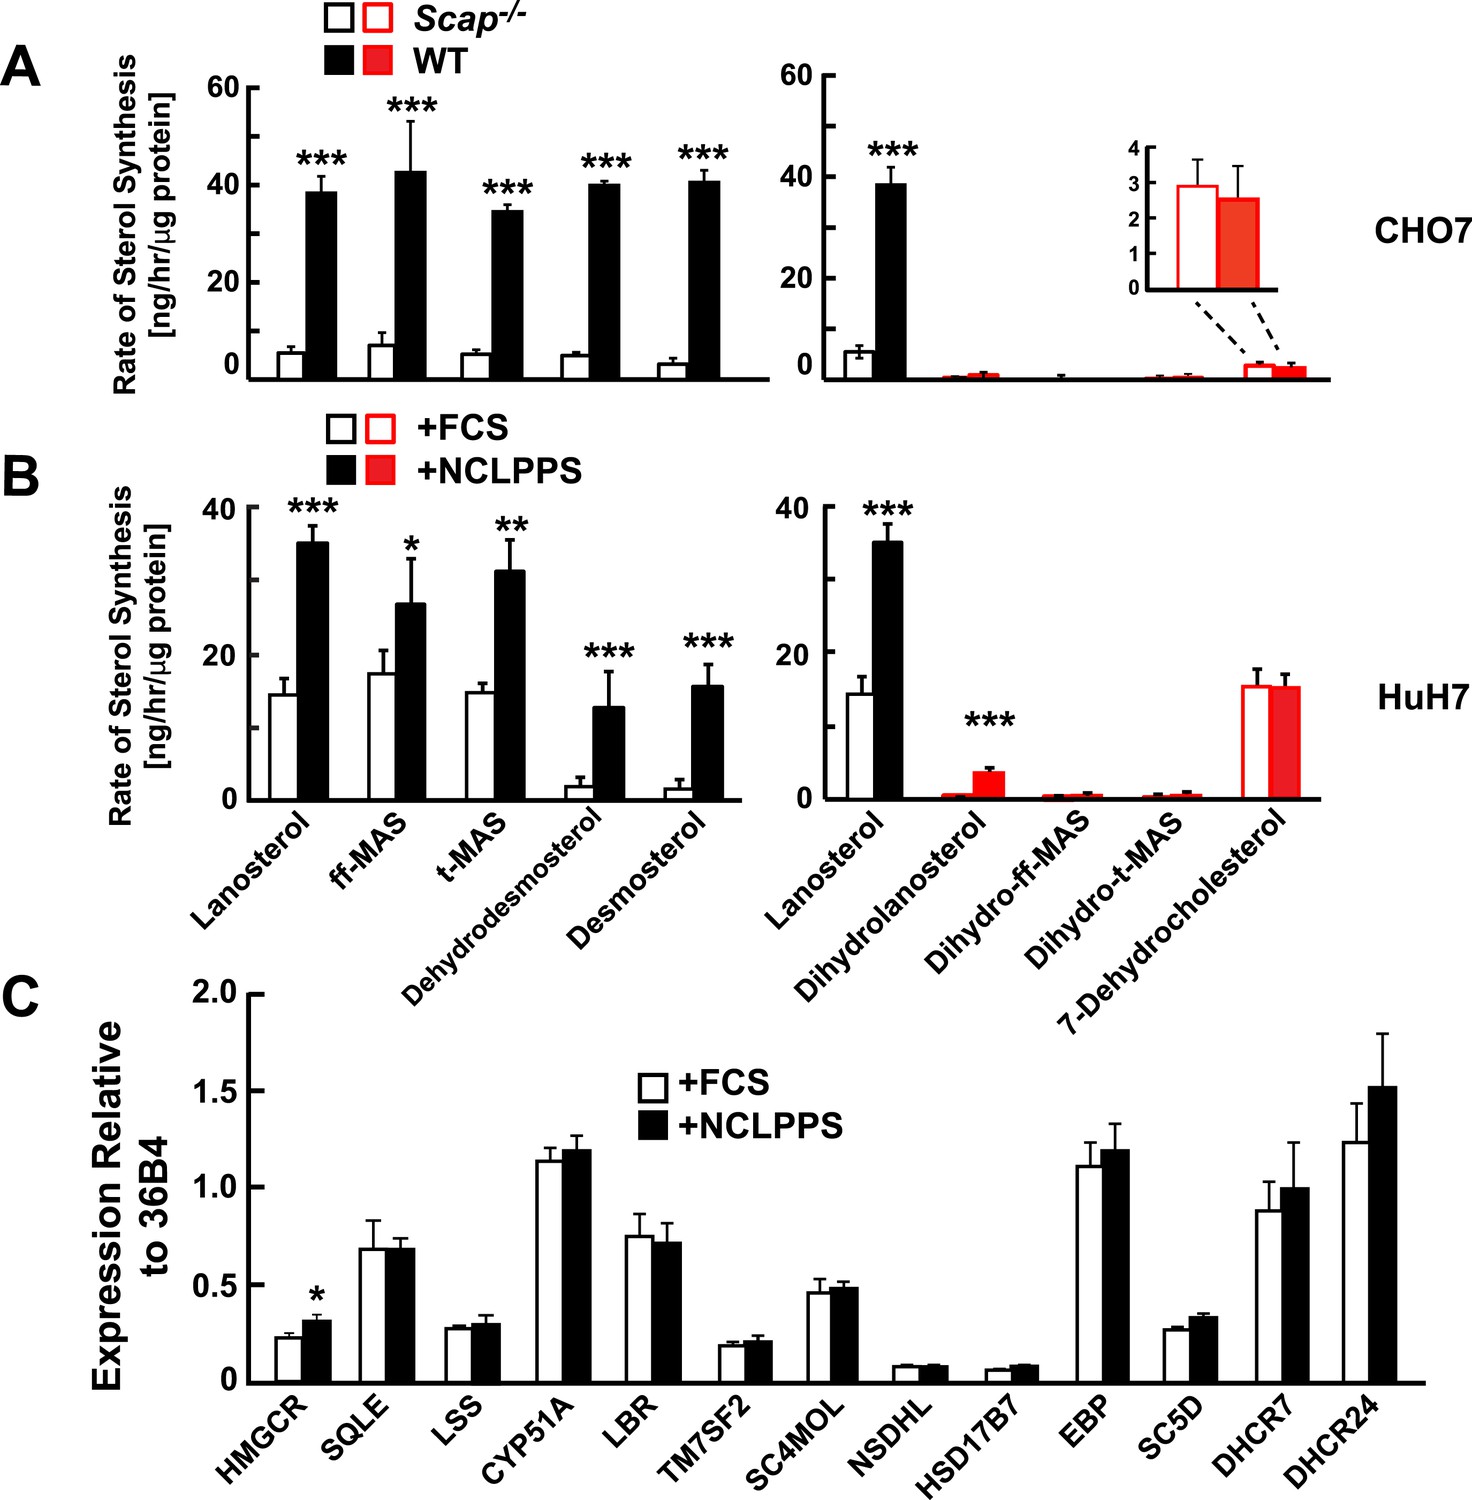
Modification of cholesterol biosynthesis rate.
(A) Biosynthetic rate of intermediary sterols of the Bloch (left; black) and K–R (right; red) pathways of CHO-7 (wt, closed bars) and SRD13A cells (SCAP−/−, open bars). Cells were grown to ∼60% confluence in 10% NCLPPS before measuring sterol biosynthesis rates using D2O. The inset of the right panel rescales the dehydrocholesterol values shown below. (B) Sterol biosynthesis rate in HuH7 cells grown in FCS (open bars) or the cholesterol depleted medium NCLPPS (solid bars). Cells were grown in their respective medium to ∼60% confluence before D2O labeled to measure biosynthetic rates. In panels A and B, means and standard deviations are reported based on four independent replicates of each cell line or condition. (C) Expression of genes encoding enzymes catalyzing the conversion of squalene to cholesterol (shown in the Bloch sequence from left to right) in HuH7 cells grown in either FCS or NCLPPS. Expression is normalized to 36B4. Means and standard deviations are based on six replicates from two independent experiments. *p < 0.05, **p < 0.01, ***p < 0.001.
Figure 4

DHCR24 expression and sterol biosynthesis.
(A) Sterol turnover in cells over-expressing DHCR24. HEK-293 cells were cultured in DMEM +10% FCS for 2 days. On day 3 the cells were transfected with empty vector (open bars) or a plasmid encoding DHCR24 (closed bars). After 40 hr, the medium was supplemented with 5% D2O and the incorporation of label into sterols was measured using LC-MS/MS. The rates of synthesis for intermediates in the Bloch (left) and K–R (right) pathways were determined using IA and fitted to a first order kinetic model. DHCR24 was measured by immunoblot analysis at the 0 hr time point (blot in right panel). Means and standard deviations shown are based on three independent experiments. (B) HEK-293 cells were transfected with DHCR24 (open) or an empty vector (closed). After 40 hr, 5 µg/ml of d6-lanosterol (top) or d5-zymosterol (bottom) conjugated to MCD was added to the medium. After 5 hr, cells were harvested and labeled sterols were measured by LC-MS/MS. Levels of labeled cholesterol are shown on the far right (blue). The inset of the bottom right panel highlights level of d5-labeled zymostenol, lathosterol and 7-dehydrocholesterol. The signal intensities of the labeled sterols were normalized to total protein and to an internal standard. Means and standard deviations are based on 3 replicates. Similar results were observed in an independent experiment. *p < 0.05, **p < 0.01, ***p < 0.001.
Figure 5

Sterol biosynthesis in mice.
(A) Sterol biosynthesis in selected mouse tissues. Mice were enriched to ∼5% D2O by intraperitoneal injection of 500 μl and supplementing the drinking water to 6% D2O. Tissues were collected at 0, 1, 2, 3, 4, 6, 8, 12, 18, 24, 48, 72, 120, and 168 hr after injection (3 animals per time point), and analyzed by LC-MS/MS as described in the ‘Materials and methods’. Rates of synthesis of the Bloch (left) and K–R (right) intermediates were calculated using IA and first-order kinetics. The experiment was repeated in an independent set of animals with similar results. (B) Percent utilization of the Bloch (black) and K–R (red) pathways for post-squalene cholesterol biosynthesis. The percentage of cholesterol derived from the Bloch pathway was determined by dividing the desmosterol synthesis rate by the sum of the desmosterol and 7-dehydrocholesterol synthesis rates. Similar results were obtained when the desmosterol synthesis rate was divided by the lanosterol synthesis rate, except in the testes (not shown). (C) The fractional utilization of the Bloch pathway using the data shown in Panel B compared to the natural log of lanosterol synthesis rate measured in each tissue.
Figure 6
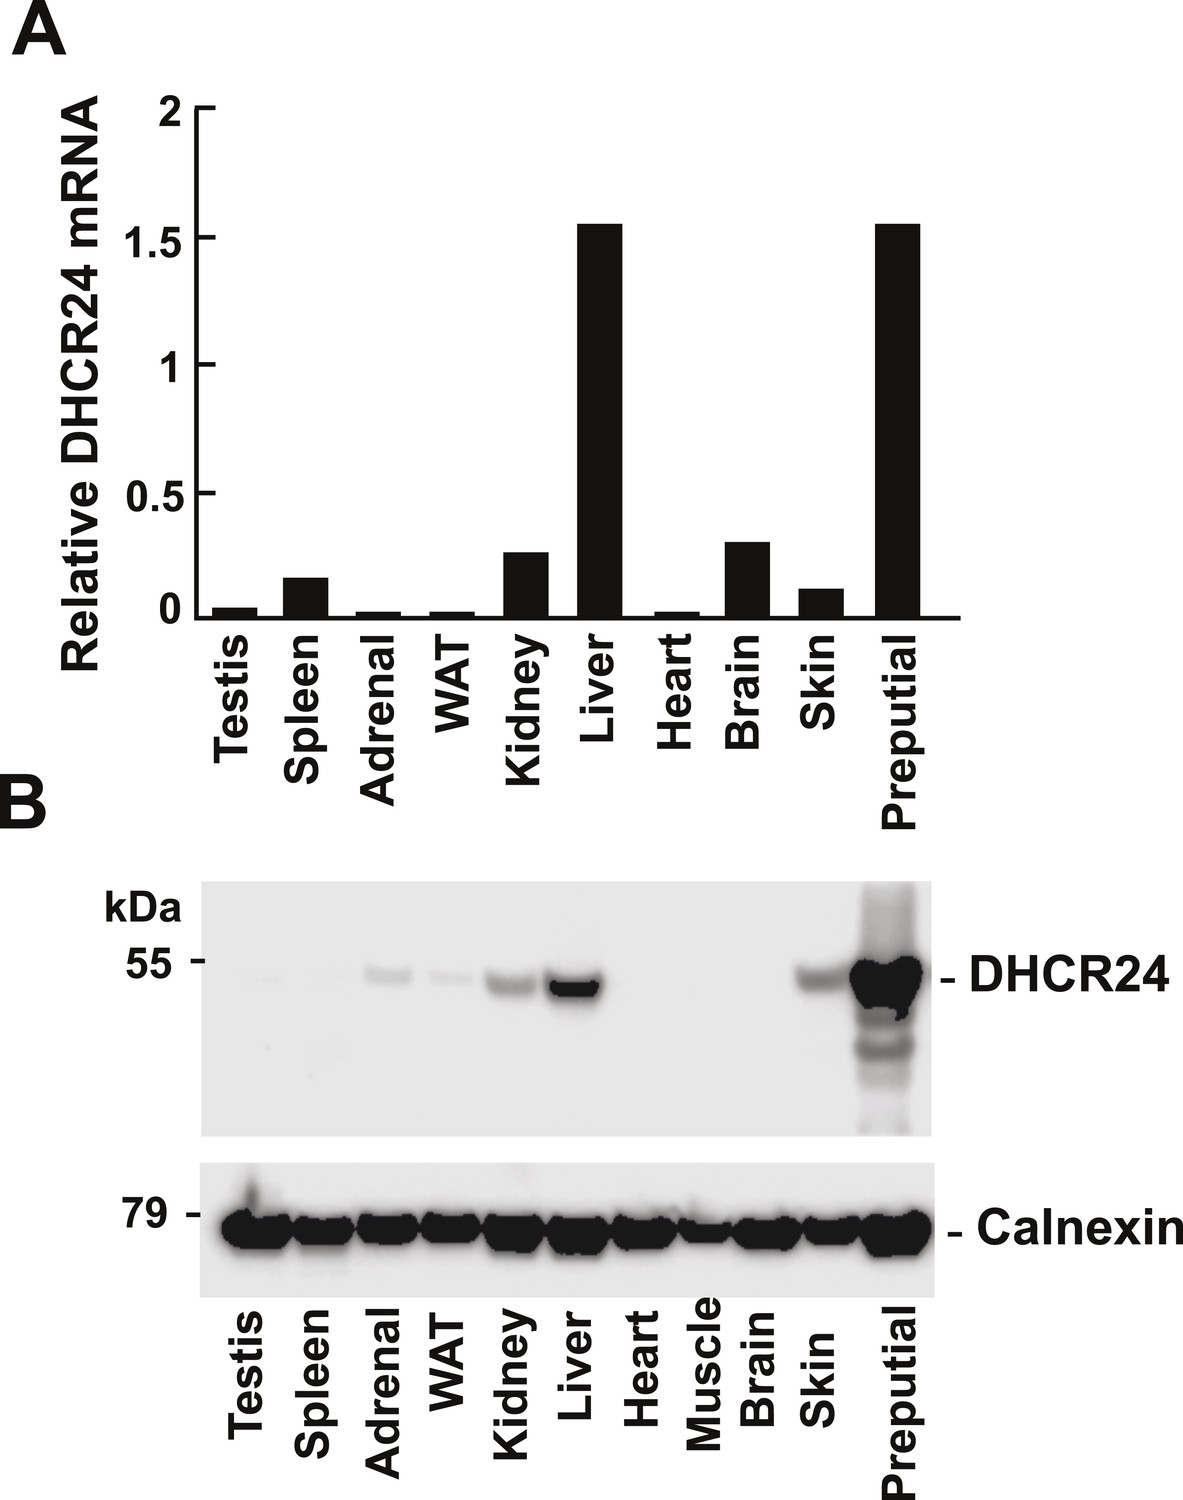
Levels of DHCR24 mRNA and protein in mouse tissues.
(A) The levels of DHCR24 mRNA relative to 36B4 in mouse tissues are arranged from highest to lowest fractional utilization of the Bloch pathway (left to right). (B) Immunoblot analysis of DHCR24. Tissues were collected from a single male mouse and a total of 5 μg of protein from each tissue was analyzed by immunoblotting using a polyclonal rabbit anti-mouse antibody as described in the ‘Material and methods’. The experiment was performed 3 times with similar results.
Figure 7
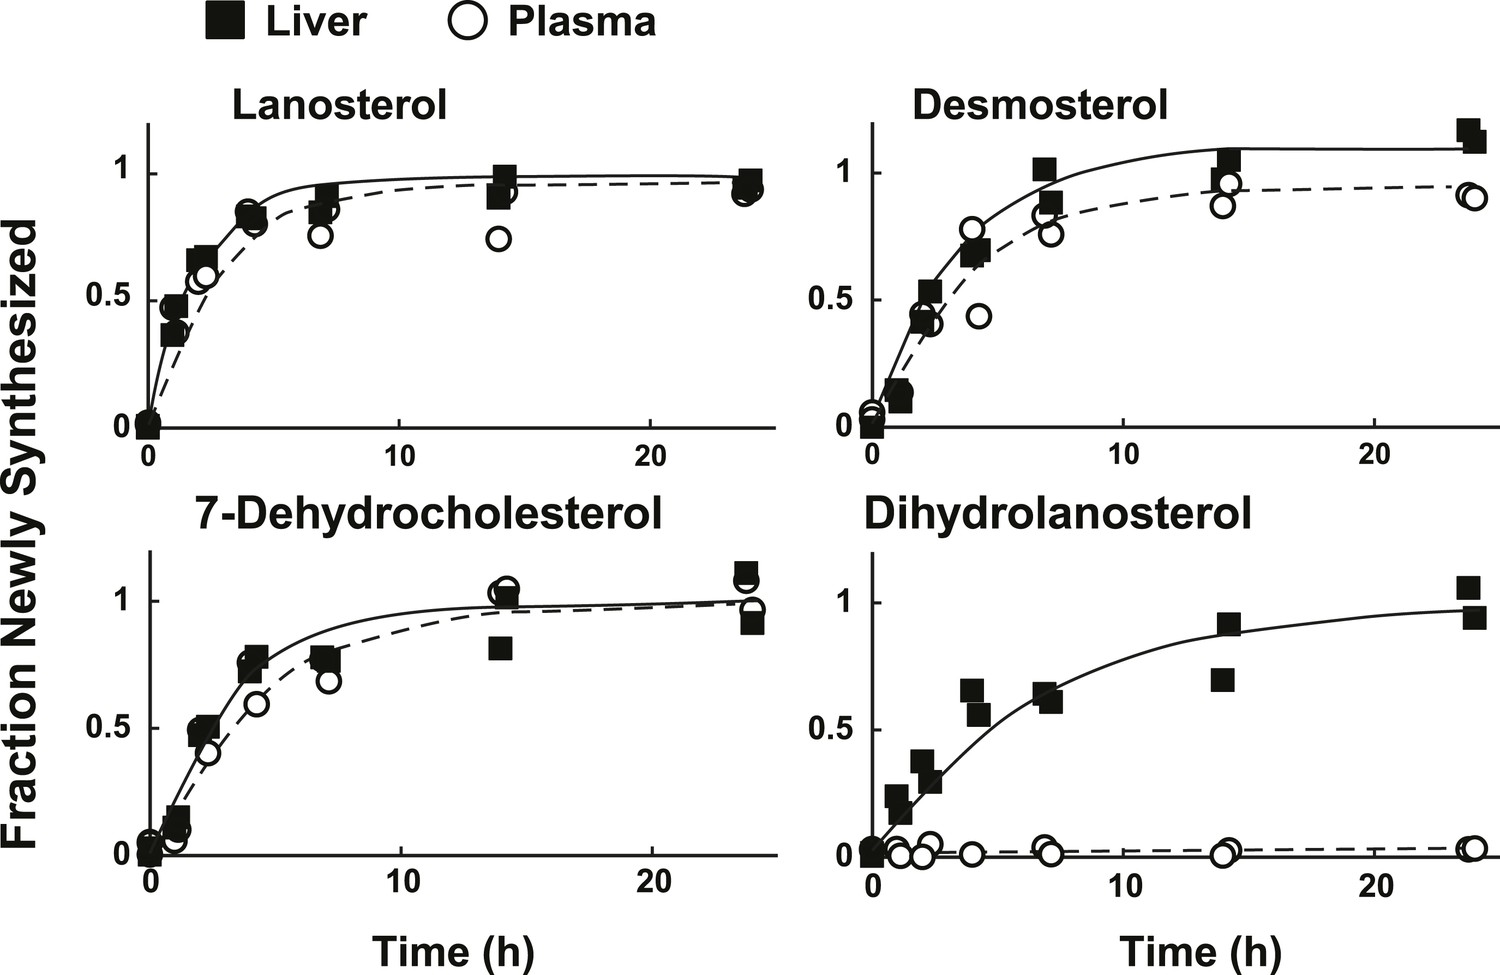
Sterol turnover in liver and plasma of mice.
The fractional turnover of lanosterol, desmosterol, 7-dehydrocholesterol, and dihydrolanosterol was determined based on the incorporation of deuterium into sterols measured in liver (closed boxes) and plasma (open circles) from the same mice.
Figure 8
A modified Kandutsch–Russell (MK–R) model of post squalene cholesterol biosynthesis.
In this model, cholesterol biosynthesis proceeds from lanosterol to t-MAS. Black arrows denote the Bloch pathway. Red arrows denote the MK–R pathway. 24,25-double bond desaturation can occur at any step between lanosterol and desmosterol in this pathway, but in most tissues desaturation does not occur until after demethylation is complete (after T-MAS). The pathway shown with blue arrows was only detected in the liver and did not contribute to cholesterol biosynthesis. Additional pathways involving sterol intermediates that do not result in the biosynthesis of cholesterol are also shown.
Additional files
-
Supplementary file 1
Rate constants (k) and concentrations of cholesterol biosynthetic intermediates in mouse tissues.
- https://doi.org/10.7554/eLife.07999.012
-
Supplementary file 2
LC-MS/MS characteristics of sterols.
- https://doi.org/10.7554/eLife.07999.013
-
Supplementary file 3
Primer sequences for real-time PCR of genes in the cholesterol biosynthetic pathway.
- https://doi.org/10.7554/eLife.07999.014
Download links
A two-part list of links to download the article, or parts of the article, in various formats.
Downloads (link to download the article as PDF)
Open citations (links to open the citations from this article in various online reference manager services)
Cite this article (links to download the citations from this article in formats compatible with various reference manager tools)
Flux analysis of cholesterol biosynthesis in vivo reveals multiple tissue and cell-type specific pathways
eLife 4:e07999.
https://doi.org/10.7554/eLife.07999


