Genome-wide DNA hypomethylation and RNA:DNA hybrid accumulation in Aicardi–Goutières syndrome
- University of California, Davis, United States
Figures
Figure 1 with 1 supplement

AGS fibroblasts exhibit activated immune antiviral response.
(A) RNA-seq heatmap showing log2 expression level of genes up-regulated in at least two Aicardi–Goutières syndrome (AGS) samples. Two biological replicates are shown for each sample. Immune-related genes are marked with green dots. (B) Gene expression changes between AGS samples and control were measured for five immune-related genes by real time reverse-transcription PCR (RT-qPCR). Y-axis represents fold change in gene expression, normalized to GAPDH gene, relative to the control sample. SDHA is another housekeeping gene used as control. Each value is the average of at least two technical replicates. Error bars represent SEM.
Figure 1—figure supplement 1
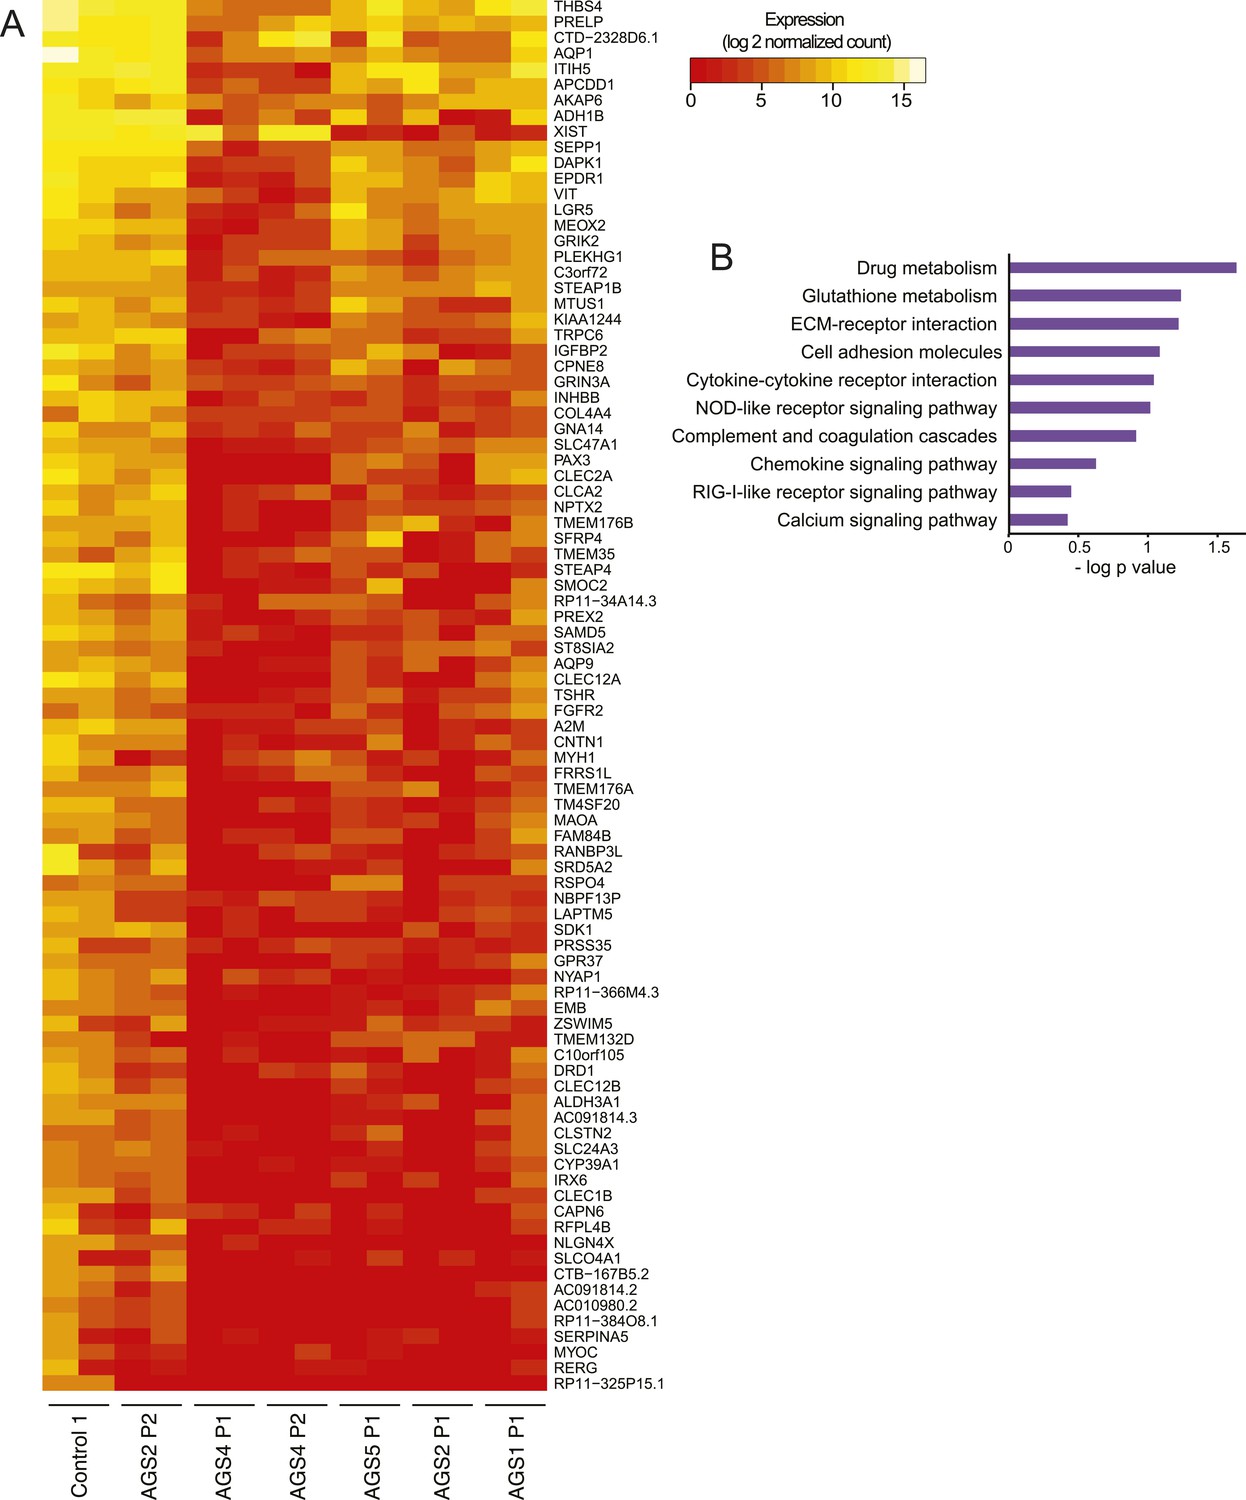
RNA-seq of AGS and control fibroblasts.
(A) Heatmap showing log2 expression level of genes down-regulated in at least two AGS samples. (B) Pathways analysis of differentially regulated genes.
Figure 2
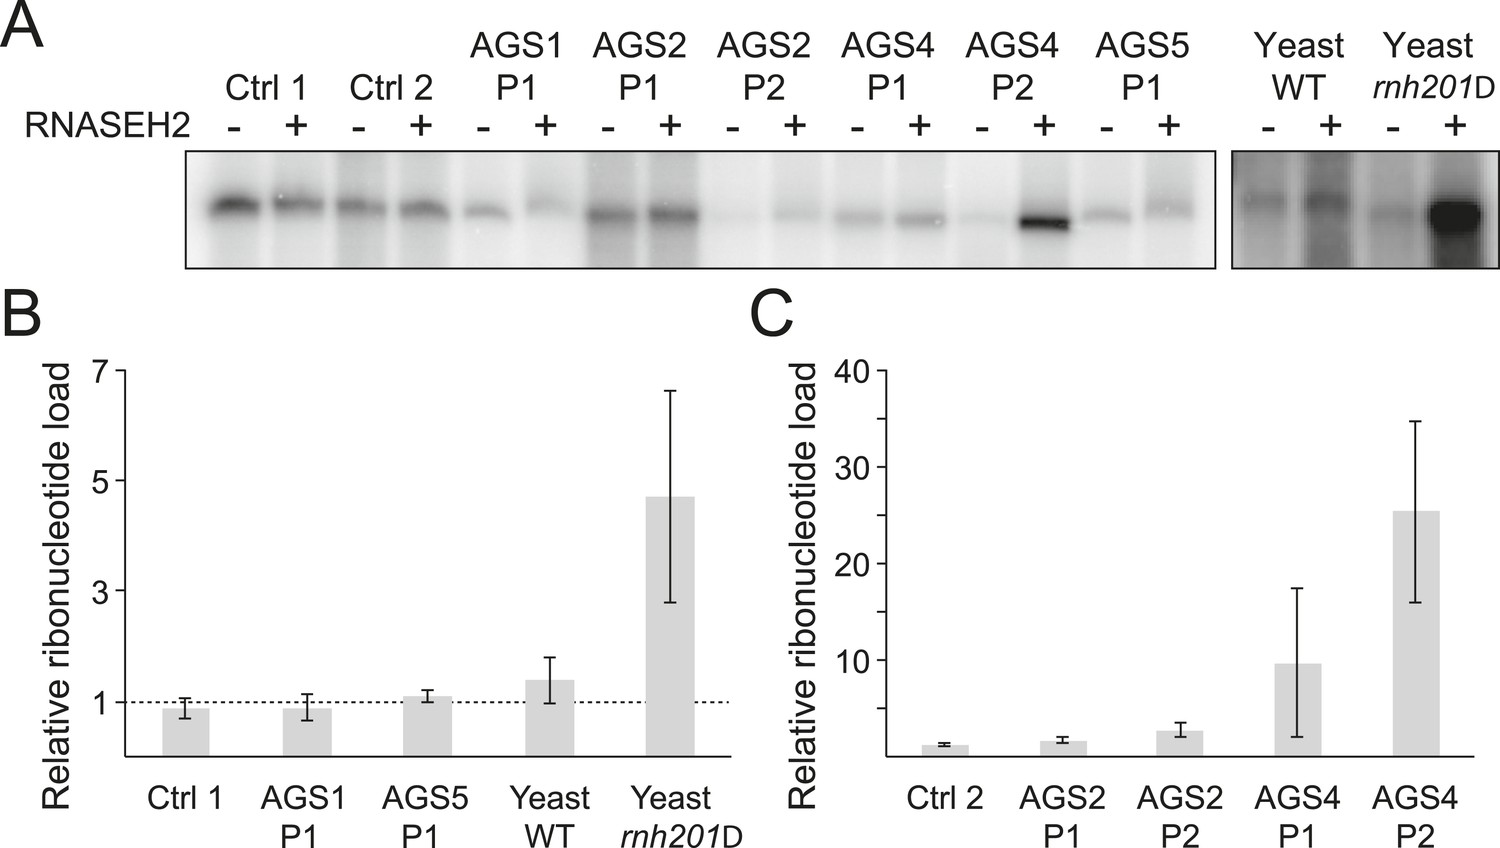
Incorporation of ribonucleotides in genomic DNA is only observed in RNase H2-deficient AGS fibroblasts.
(A) Genomic DNA was treated with RNase H2 to reveal the presence of ribonucleotides as single-strand nicks. An untreated control was used to reveal background single-stranded breaks in genomic DNA preparations. The intensity of labeling after gel electrophoresis was measured. (B, C) Relative ribonucleotide loads are reported as fold-increase of radiolabel incorporation of RNase H2-treated over untreated sample. At least three independent replicates were performed and the error bars indicate SEM.
Figure 3 with 1 supplement
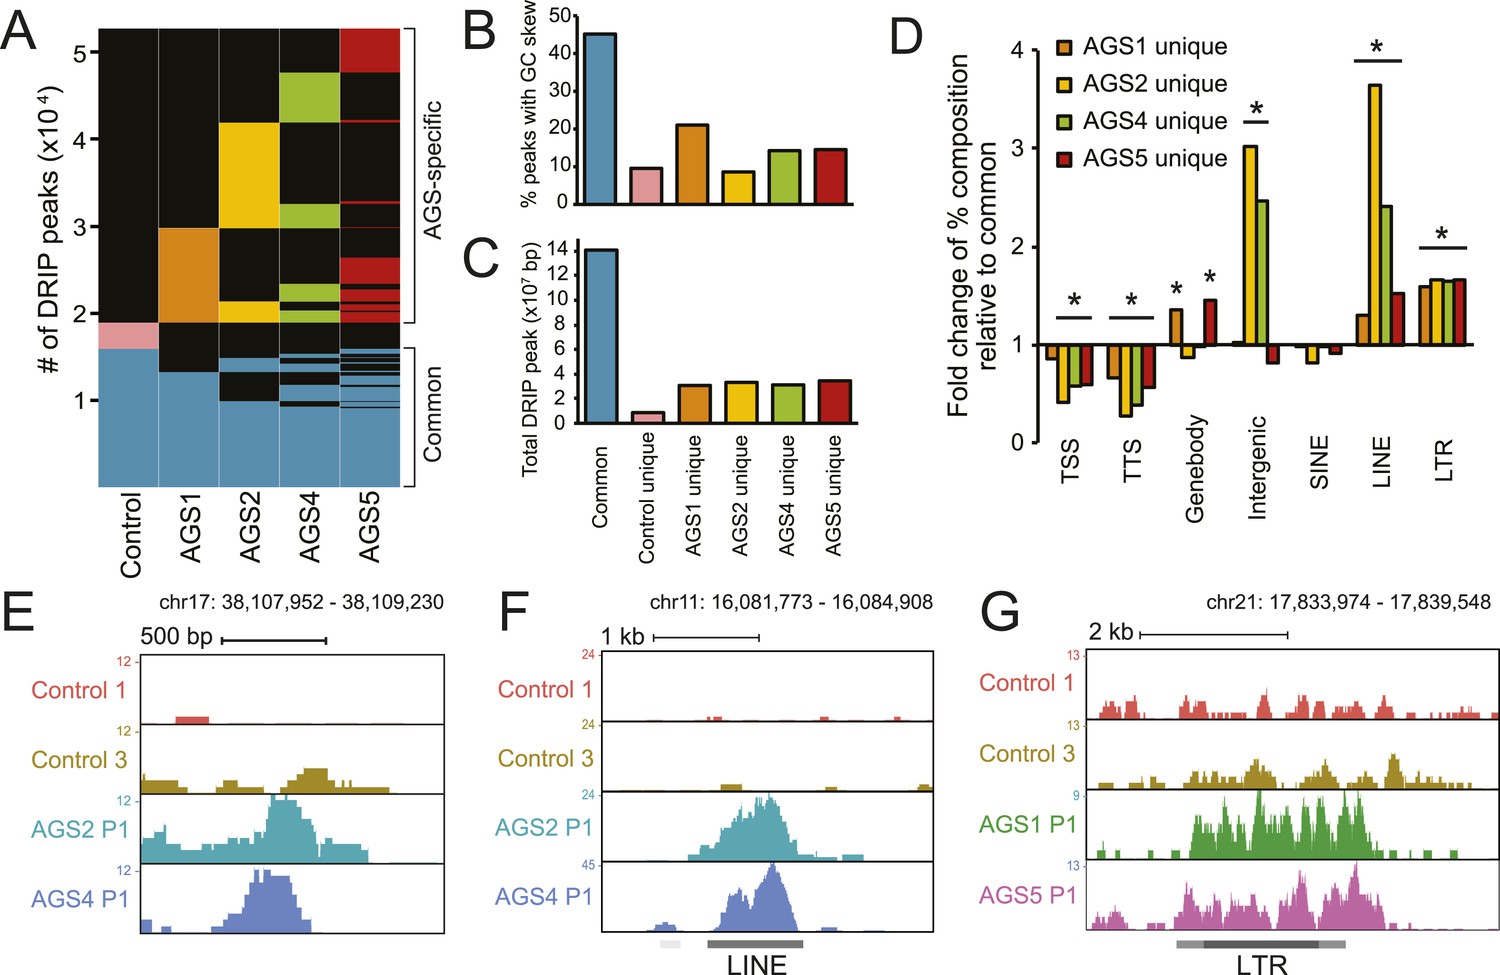
AGS fibroblasts accumulate RNA:DNA hybrids.
(A) All genomic loci overlapping with a DRIP peak in at least one sample are stacked vertically; the position of each peak in a stack is constant horizontally across samples. Each patient subtype or control occupies a vertical bar, as labeled. Each bar corresponds to merged data sets from two independent samples. Common peaks (i.e., form in control and at least one AGS sample) are represented in blue. Control-unique DRIP peaks are shown in pink; lack of DRIP signal over a given peak in any sample is shown as black. AGS-unique peaks are colored orange, yellow, green, and red in AGS1, 2, 4, and 5, respectively. Brackets on the right side demarcate common and AGS-specific peaks, respectively. (B, C) Graphs showing the % overlap between DRIP peaks and blocks of GC skew (B); and the total size of DRIP peaks in each category (C). Color codes are as described for (A). (D) Enrichment or depletion of AGS-unique DRIP peaks over different genomic features is shown relative to common DRIP peaks. * indicates p < 0.002 and fold change >20% relative to common peaks. (E–G) Representative examples of AGS-specific DRIP peaks over an intergenic region (E), a truncated long interspersed nuclear elements (LINE) element (F) and a truncated long terminal repeats (LTR) element (G).
Figure 3—figure supplement 1

Canonical R-loop genomic patterns are not affected in AGS fibroblasts.
(A) Representative screenshot of the broad genomic landscape of R-loop formation over a 2-Mb region. DRIP-seq signal is represented by the accumulation of sequence reads along the genomic sequence. Each sample is color-coded as indicated. CpG islands are indicated together with the positions of genes along the region. (B) A representative screenshot of R-loops formed at the 5′- and 3′-end of the DACT1 gene. (C) Pie chart depicting the distribution of common DRIP peaks at different genomic regions. (D) Percent length overlap of common and AGS-unique peaks over different genomic features. *p < 0.002 and fold change >20% relative to common peaks.
Figure 4 with 1 supplement
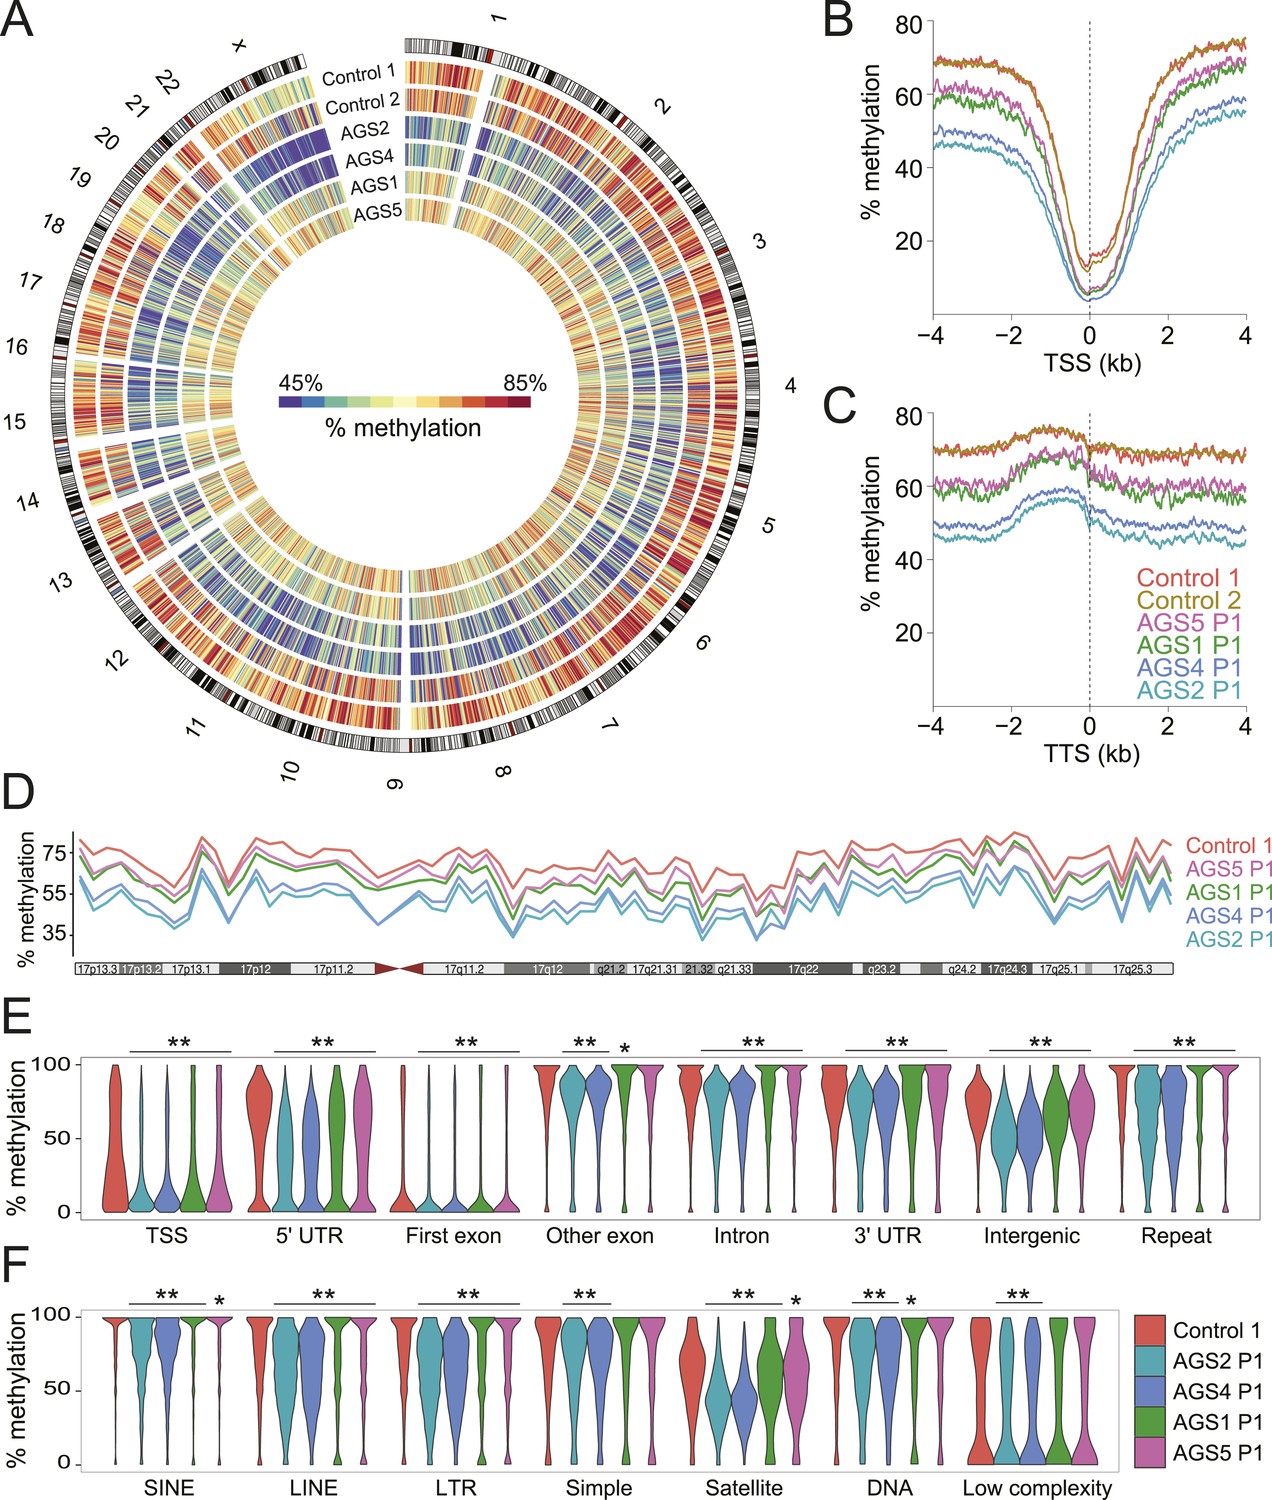
Genome-wide DNA hypomethylation in AGS fibroblasts.
(A) Circos plot depicting DNA methylation along human chromosomes. Each tick mark is colored according to the average percent methylation across a 2 Mb genomic region (see color legend). (B, C) Metaplots of DNA methylation around transcription start site (TSS) (B) and transcription termination site (TTS) (C). (D) Percent methylation along chromosome 17. (E, F) Violin plots depicting methylation levels at different genomic (E) and repeat (F) regions. p-values are relative to control. **p < 1e-9, *p < 0.01.
Figure 4—figure supplement 1
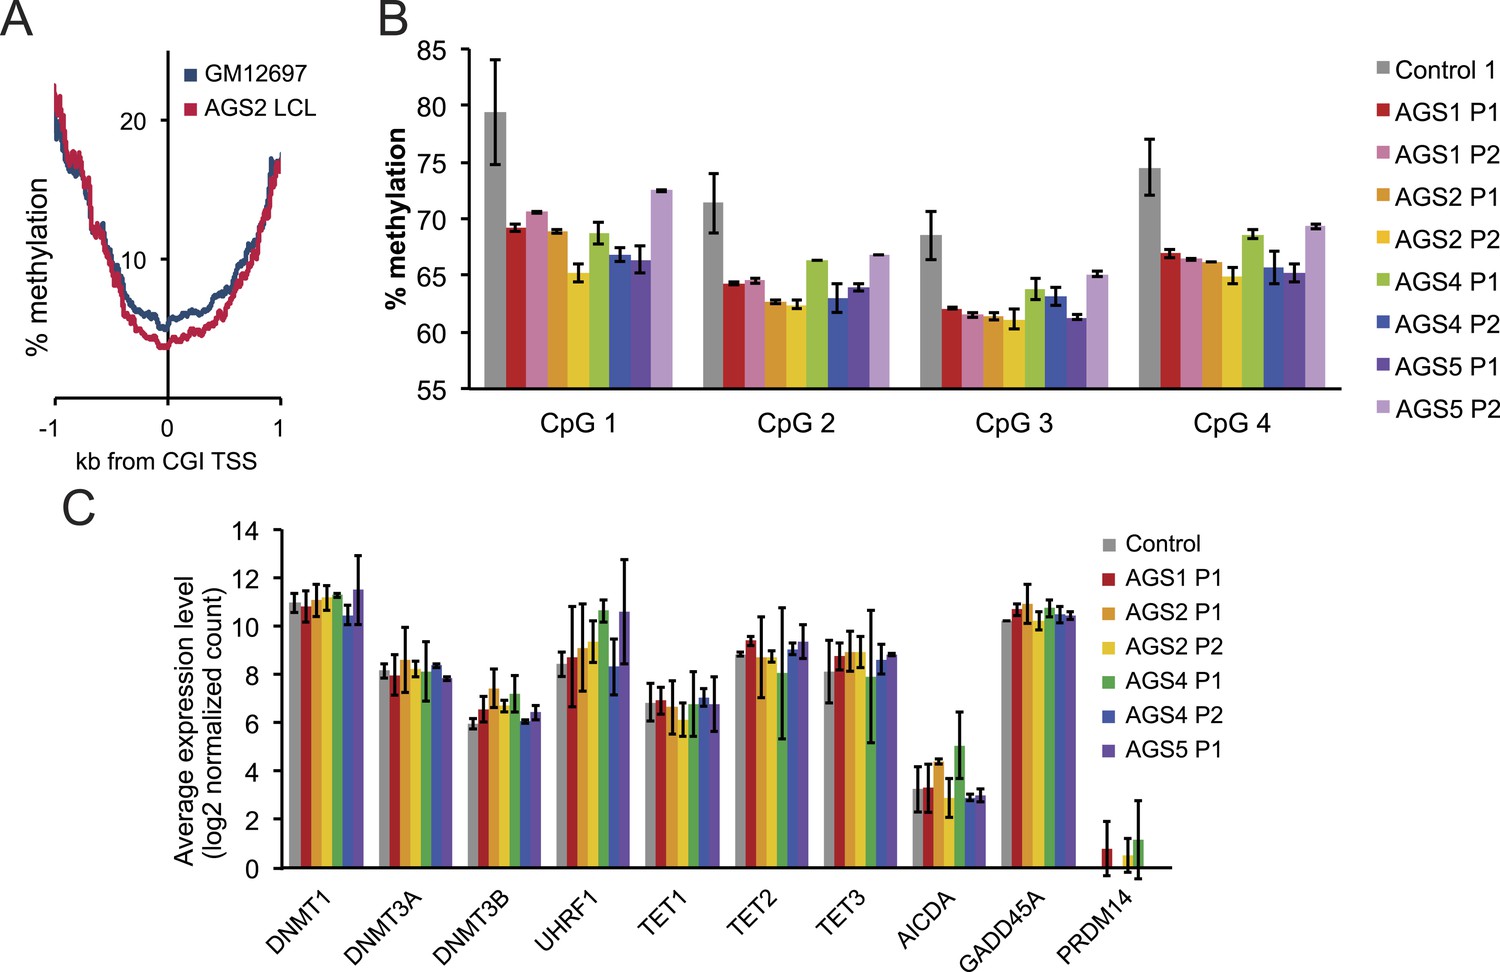
Methylation profiles of AGS and control cells.
(A) Percent methylation of lymphoblastoid cells around TSS, as determined by reduced representation bisulfite sequencing (RRBS). AGS2 LCLs are significantly hypomethylated (p < 2.2 × 10⁻¹⁶). (B) Percent methylation of control and AGS fibroblasts at four CpG sites, as surveyed by LINE-1 pyrosequencing. (C) Gene expression levels (measured by RNA-seq) for a range of genes involved in the control of DNA methylation are shown for control and a variety of AGS fibroblasts.
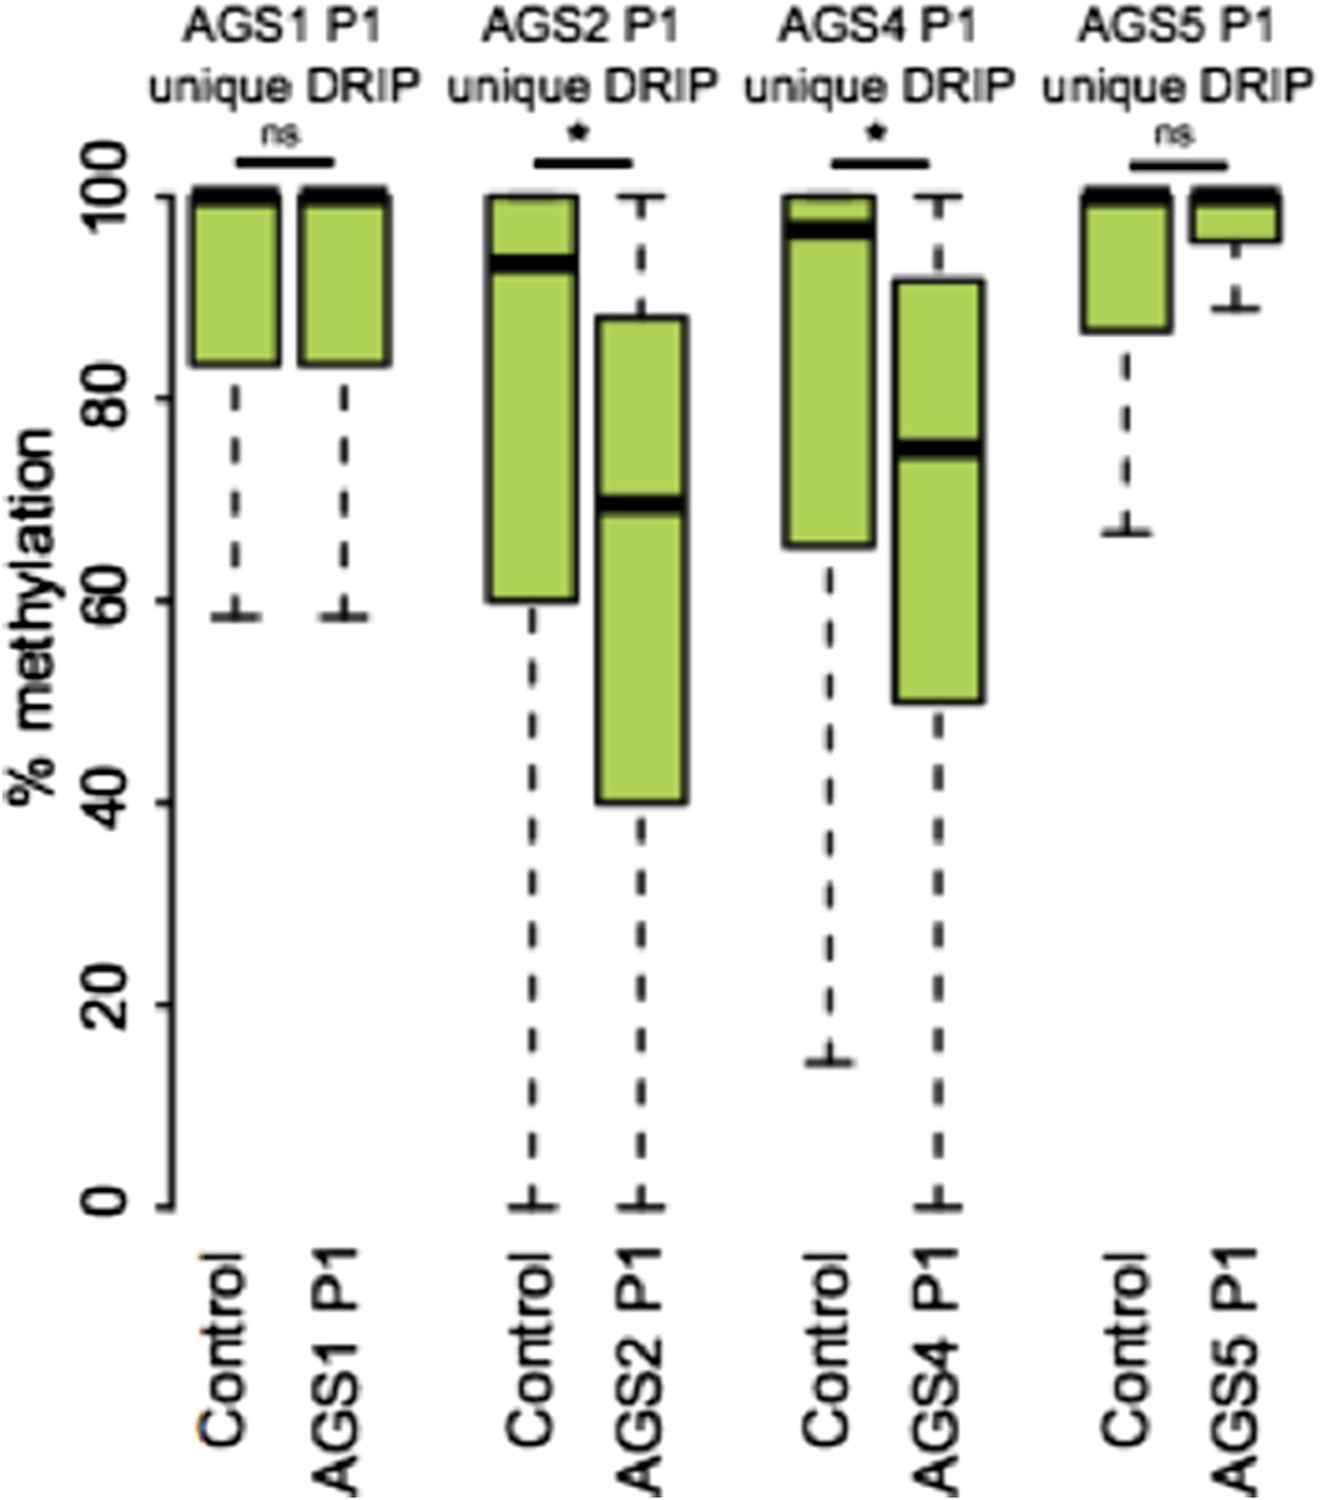
Figure 5 with 1 supplement
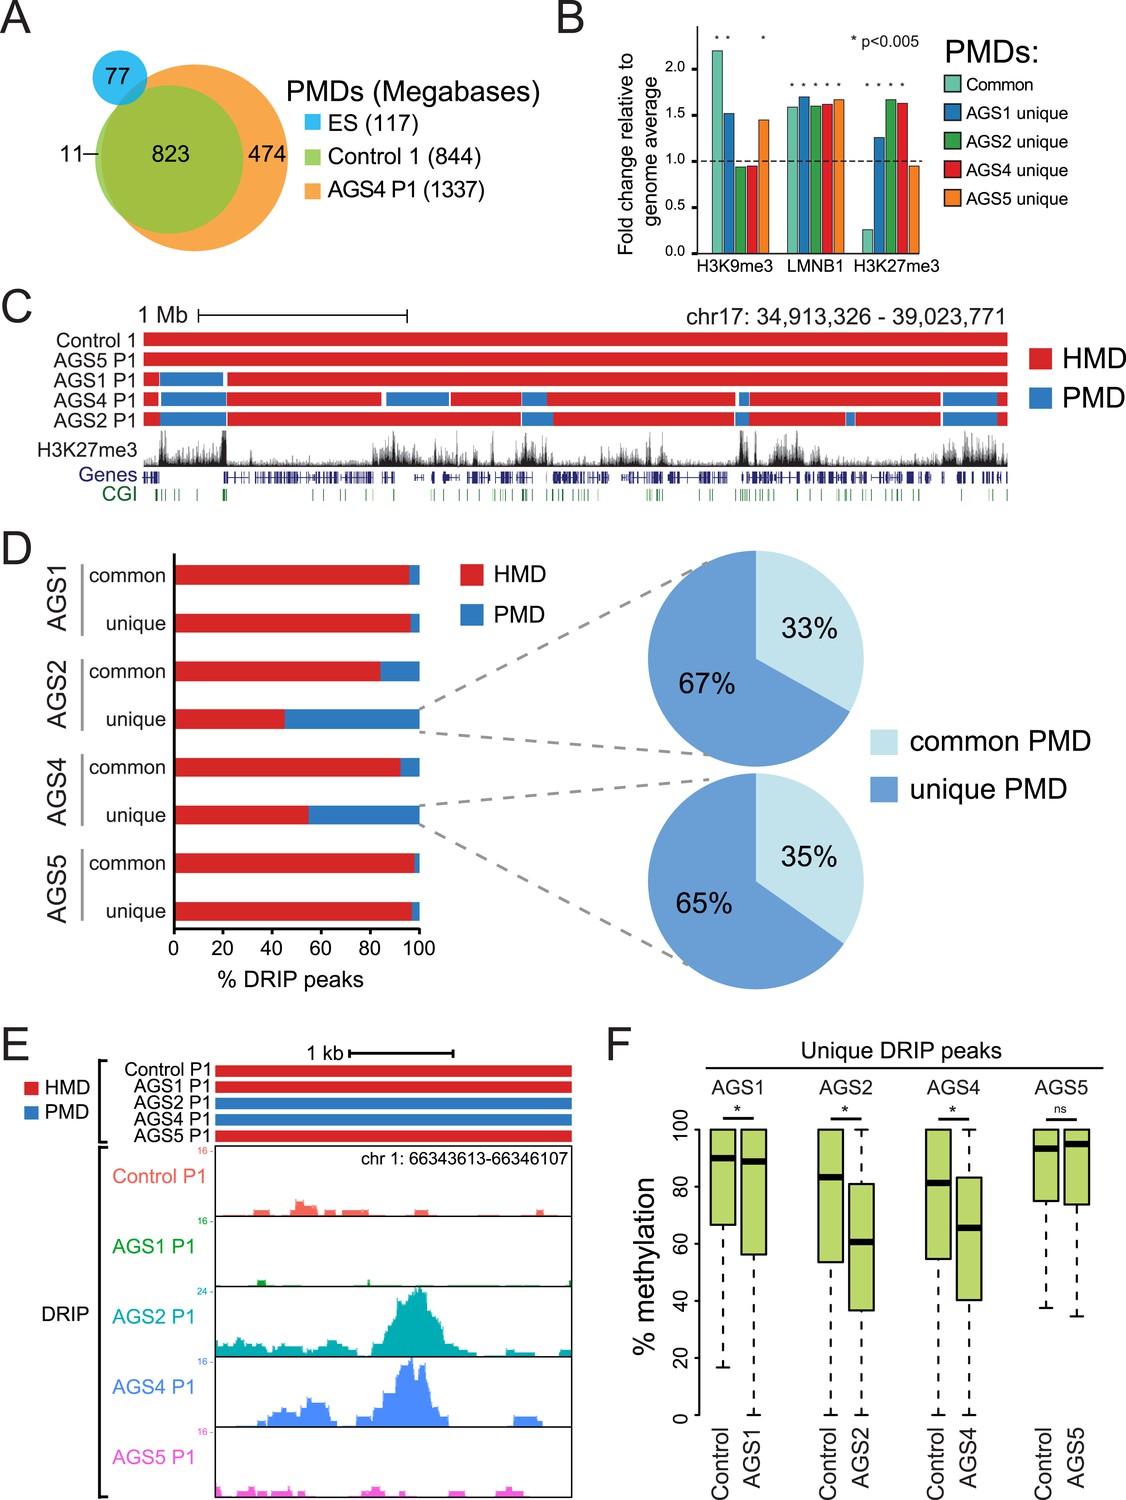
AGS-specific PMDs are enriched over H3K27me3-marked genomic regions.
(A) Venn diagram displaying partially methylated domains (PMDs) in AGS4 and control fibroblasts compared to embryonic stem (ES) cells. (B) Location analysis of PMDs over regions marked by H3K9me3, Lamin-B1, and H3K27me3, shown as fold change relative to genome average (represented by the dotted horizontal line). Stars indicate the p-value of the deviation from the genome average. (C) Genome browser screenshot showing overlap of AGS-specific PMDs with H3K27me3. (D) Percent DRIP peaks (common or AGS-unique) in highly methylated domains (HMDs) and PMDs. The pie charts break down AGS2/4 PMDs to common and unique PMDs. (E) Genome browser screenshot showing overlap between AGS2/4 PMDs with AGS2/4 DRIP-seq peaks. (F) Percent DNA methylation of AGS-unique DRIP peaks measured in control and AGS fibroblasts (as indicated at the bottom of the graph). *p < 7.18e-11, ns = not significant.
Figure 5—figure supplement 1
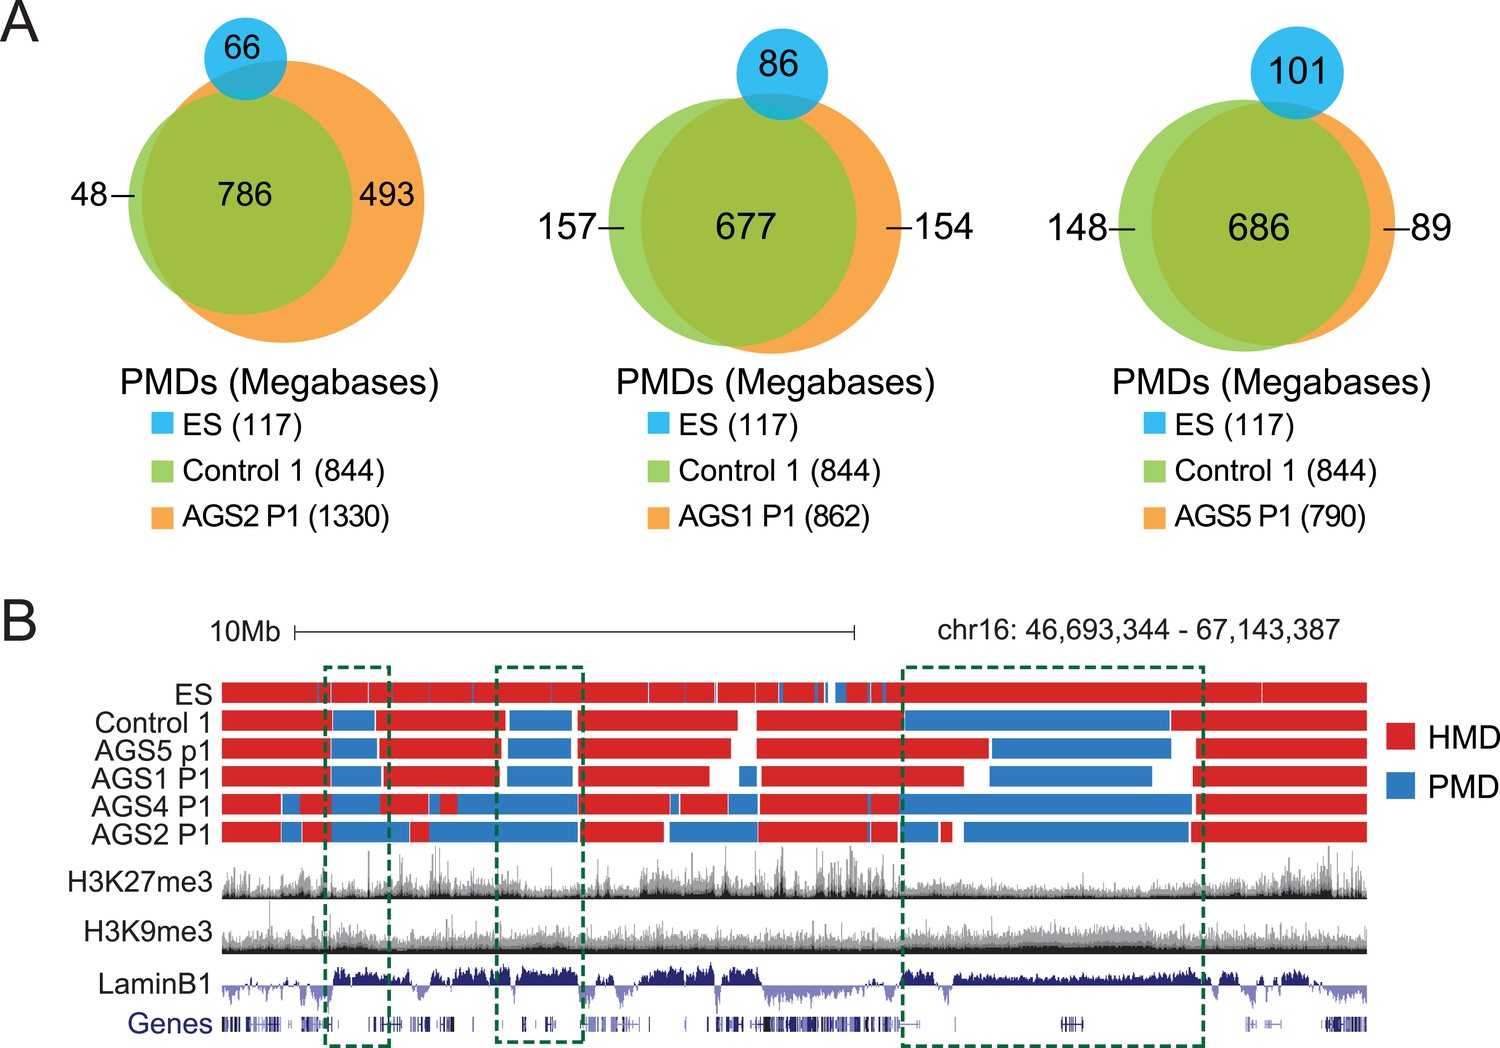
HMDs and PMDs in AGS fibroblasts.
(A) Venn diagrams representing the overlap between PMDs identified in ES cells (blue), control cells (green), and AGS samples (orange). The respective sizes of PMDs in each cell type are shown below. (B) A representative genome browser screenshot showing that common fibroblast PMDs are depleted for H3K27me3 and enriched for Lamin-B1.
Figure 6
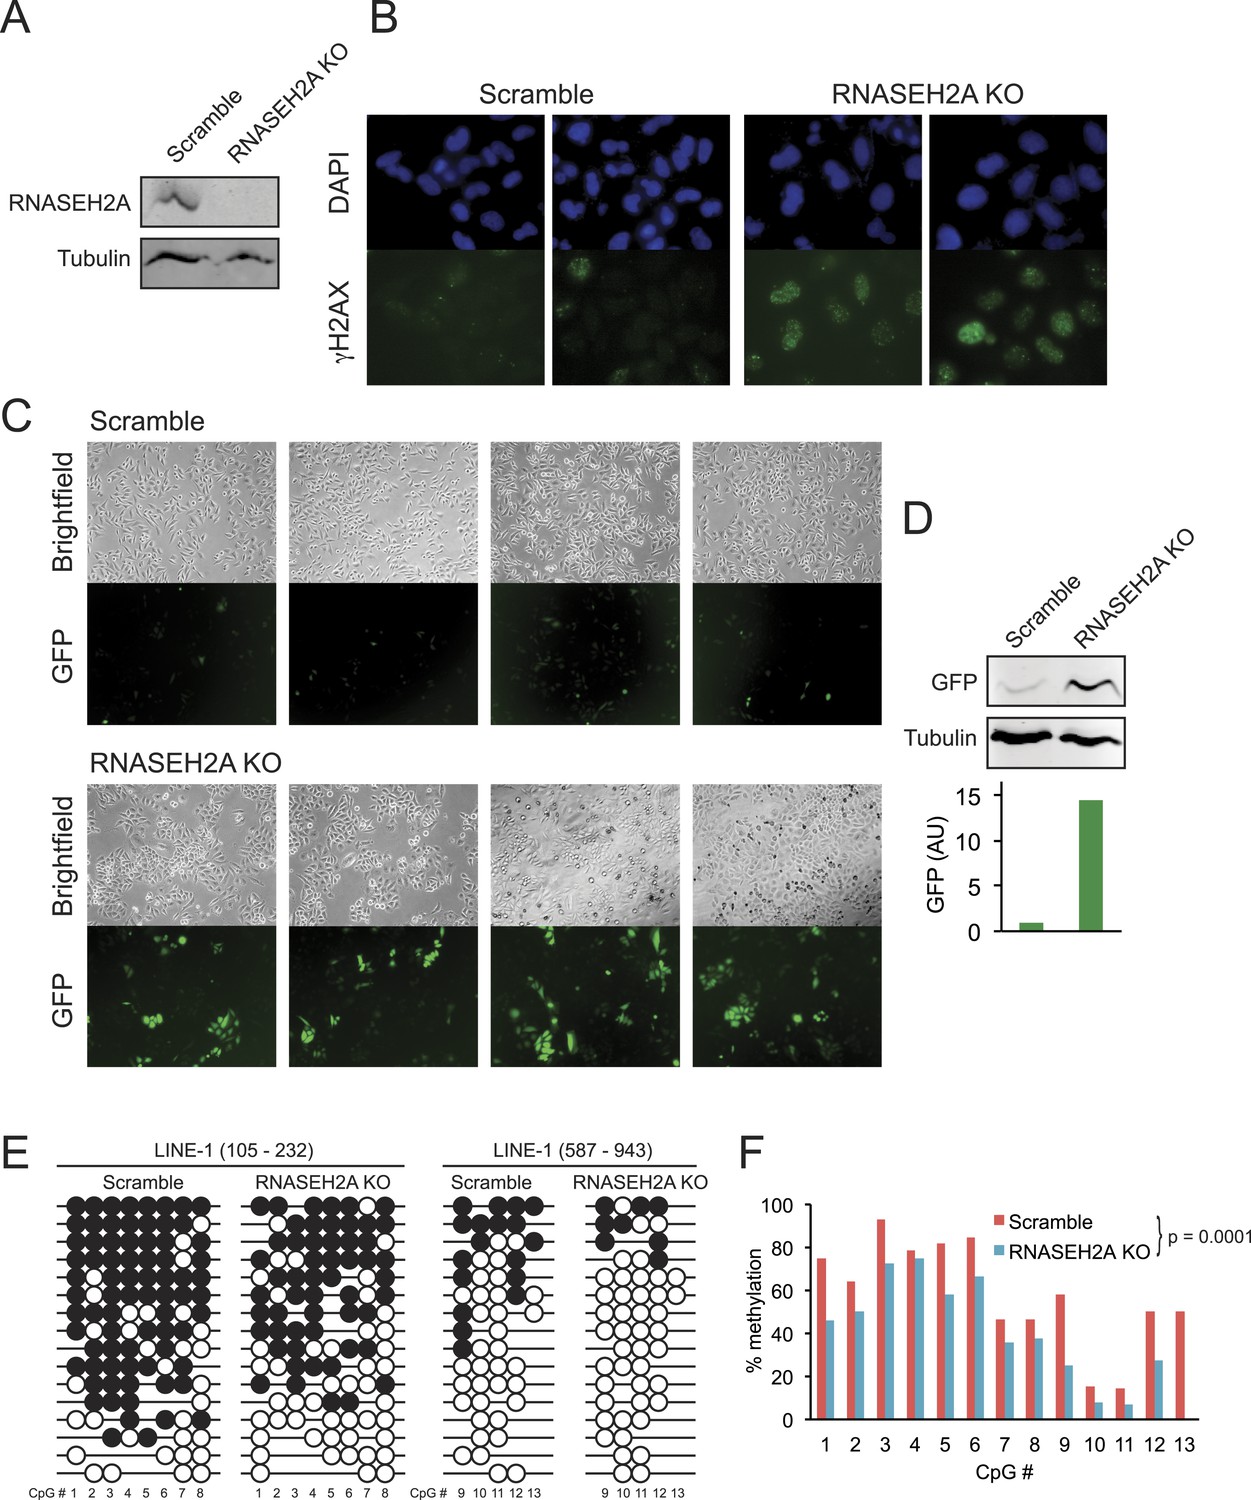
CRISPR/Cas-mediated RNASEH2A knockout induces DNA hypomethylation.
(A) Western blot using an anti-RNase H2A antibody shows successful gene knockout in HeLa-GFP cells. Scramble cells were generated with a CRISPR vector carrying a scrambled guide RNA sequence. Tubulin was used as a loading control. (B) Immunocytochemistry confirms elevated DNA damage response in RNASEH2A KO cells; DAPI (blue), gamma H2AX antibody (green). (C) Bright field and green fluorescent protein (GFP) microscopy images of RNASEH2A KO and scramble control cells. Knockout of the RNASEH2A gene triggers the reactivation of the silent GFP reporter in HeLa-GFP cells. (D) (Top) Western blot showing GFP expression in HeLa-GFP cells (RNASEH2A KO and scramble); (bottom) bar graph quantification of Western blot. (E) Bisulfite methylation sequencing for two different LINE-1 loci in RNASEH2A KO and scramble control cells. Black and white circles represent methylated and unmethylated CpG sites, respectively. Missing bubbles indicate that a CpG site is absent from the sequence of that particular molecule. The coordinates for each fragment analyzed are indicated at top. (F) Quantification of percent methylation at each CpG sites surveyed in panel E. p-value was calculated using a paired Wilcoxon test with the alternative hypothesis that RNASEH2A KO is less methylated than scramble.
Figure 7
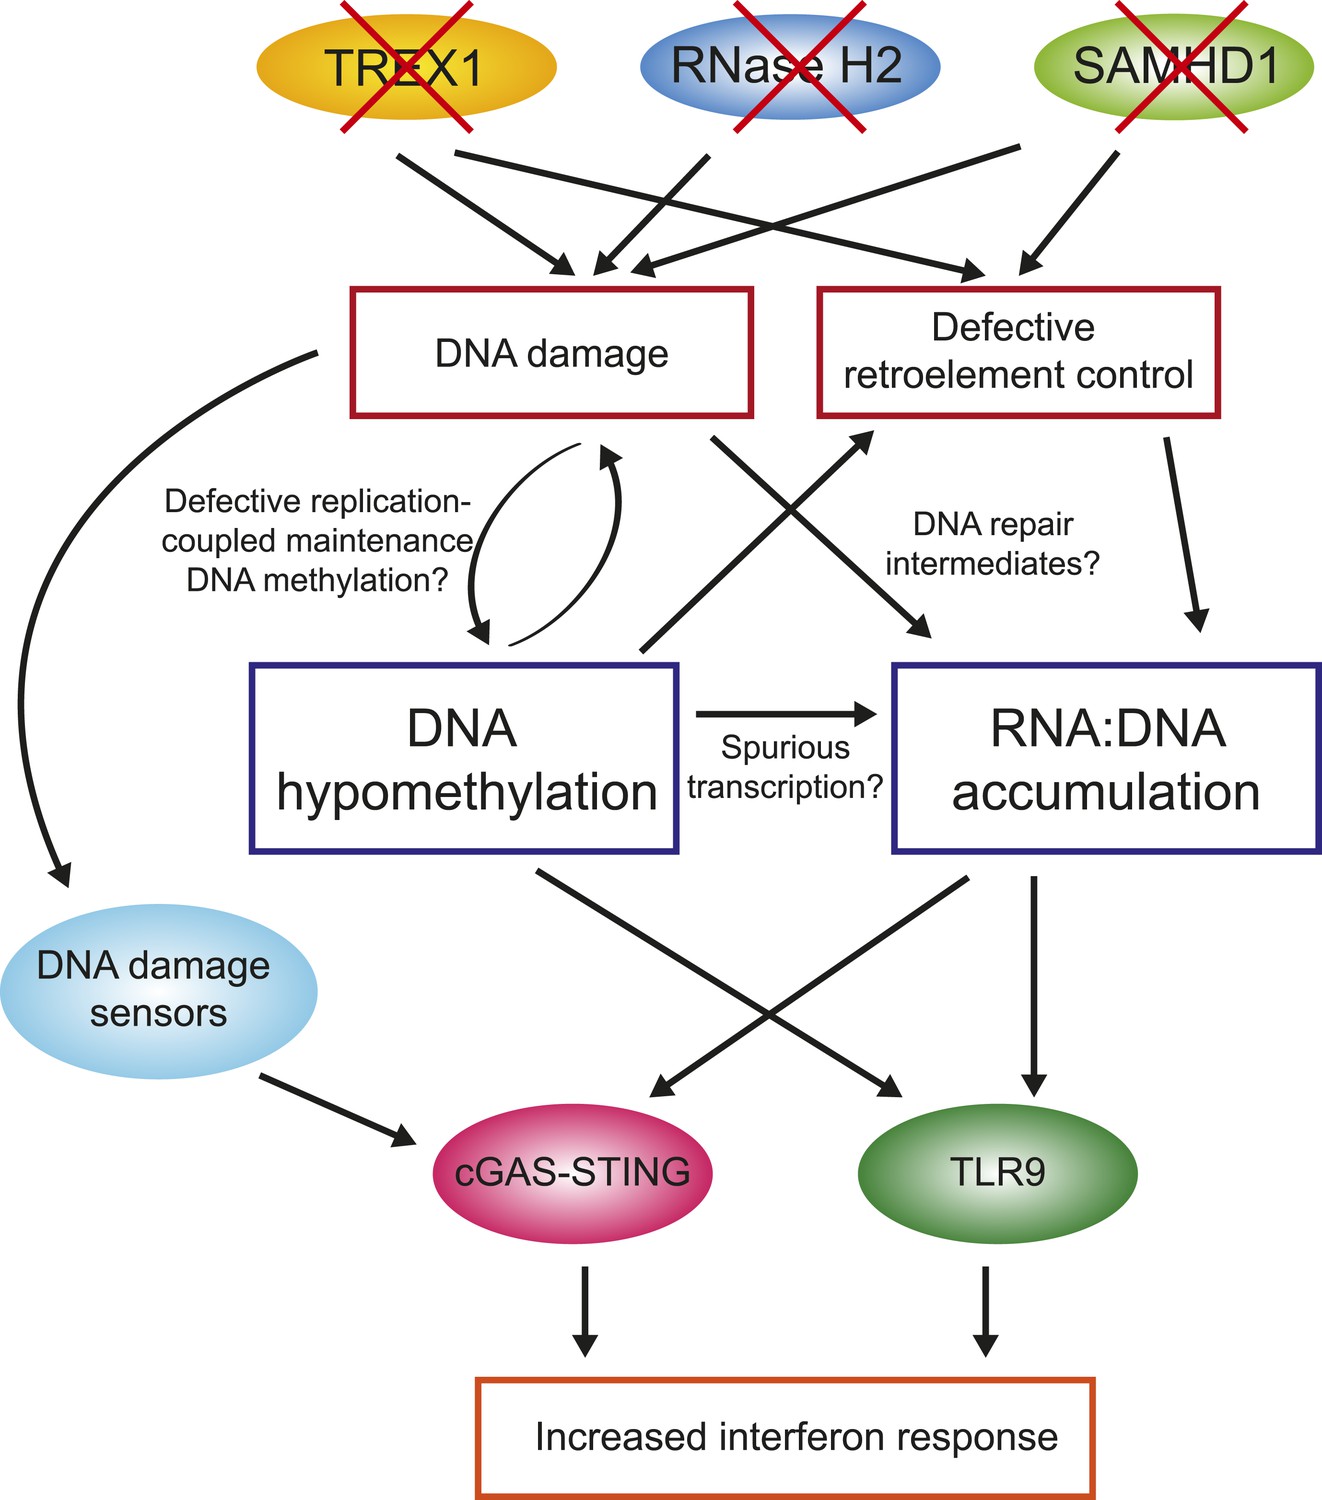
Overall model by which AGS1-5 mutations may lead to DNA hypomethylation, RNA:DNA hybrid accumulation, and IFN-stimulated immune response.
See ‘Discussion’ for details.
Author response image 1
Additional files
-
Supplementary file 1
Genotype and high-throughput sequencing information for DRIP-seq, MethylC-seq, and RNA-seq.
- https://doi.org/10.7554/eLife.08007.014
-
Supplementary file 2
Significantly up- and down-regulated genes in Aicardi–Goutières syndrome fibroblasts and their gene ontology analysis.
- https://doi.org/10.7554/eLife.08007.015
-
Supplementary file 3
Primer sequences for real-time reverse-transcription PCR and bisulfite sequencing.
- https://doi.org/10.7554/eLife.08007.016
-
Supplementary file 4
Pearson's correlation between each pair of RNA-seq biological replicates.
- https://doi.org/10.7554/eLife.08007.017
Download links
A two-part list of links to download the article, or parts of the article, in various formats.
Downloads (link to download the article as PDF)
Open citations (links to open the citations from this article in various online reference manager services)
Cite this article (links to download the citations from this article in formats compatible with various reference manager tools)
Genome-wide DNA hypomethylation and RNA:DNA hybrid accumulation in Aicardi–Goutières syndrome
eLife 4:e08007.
https://doi.org/10.7554/eLife.08007


