An excitatory amacrine cell detects object motion and provides feature-selective input to ganglion cells in the mouse retina
- Washington University School of Medicine, United States
Figures
Figure 1 with 3 supplements
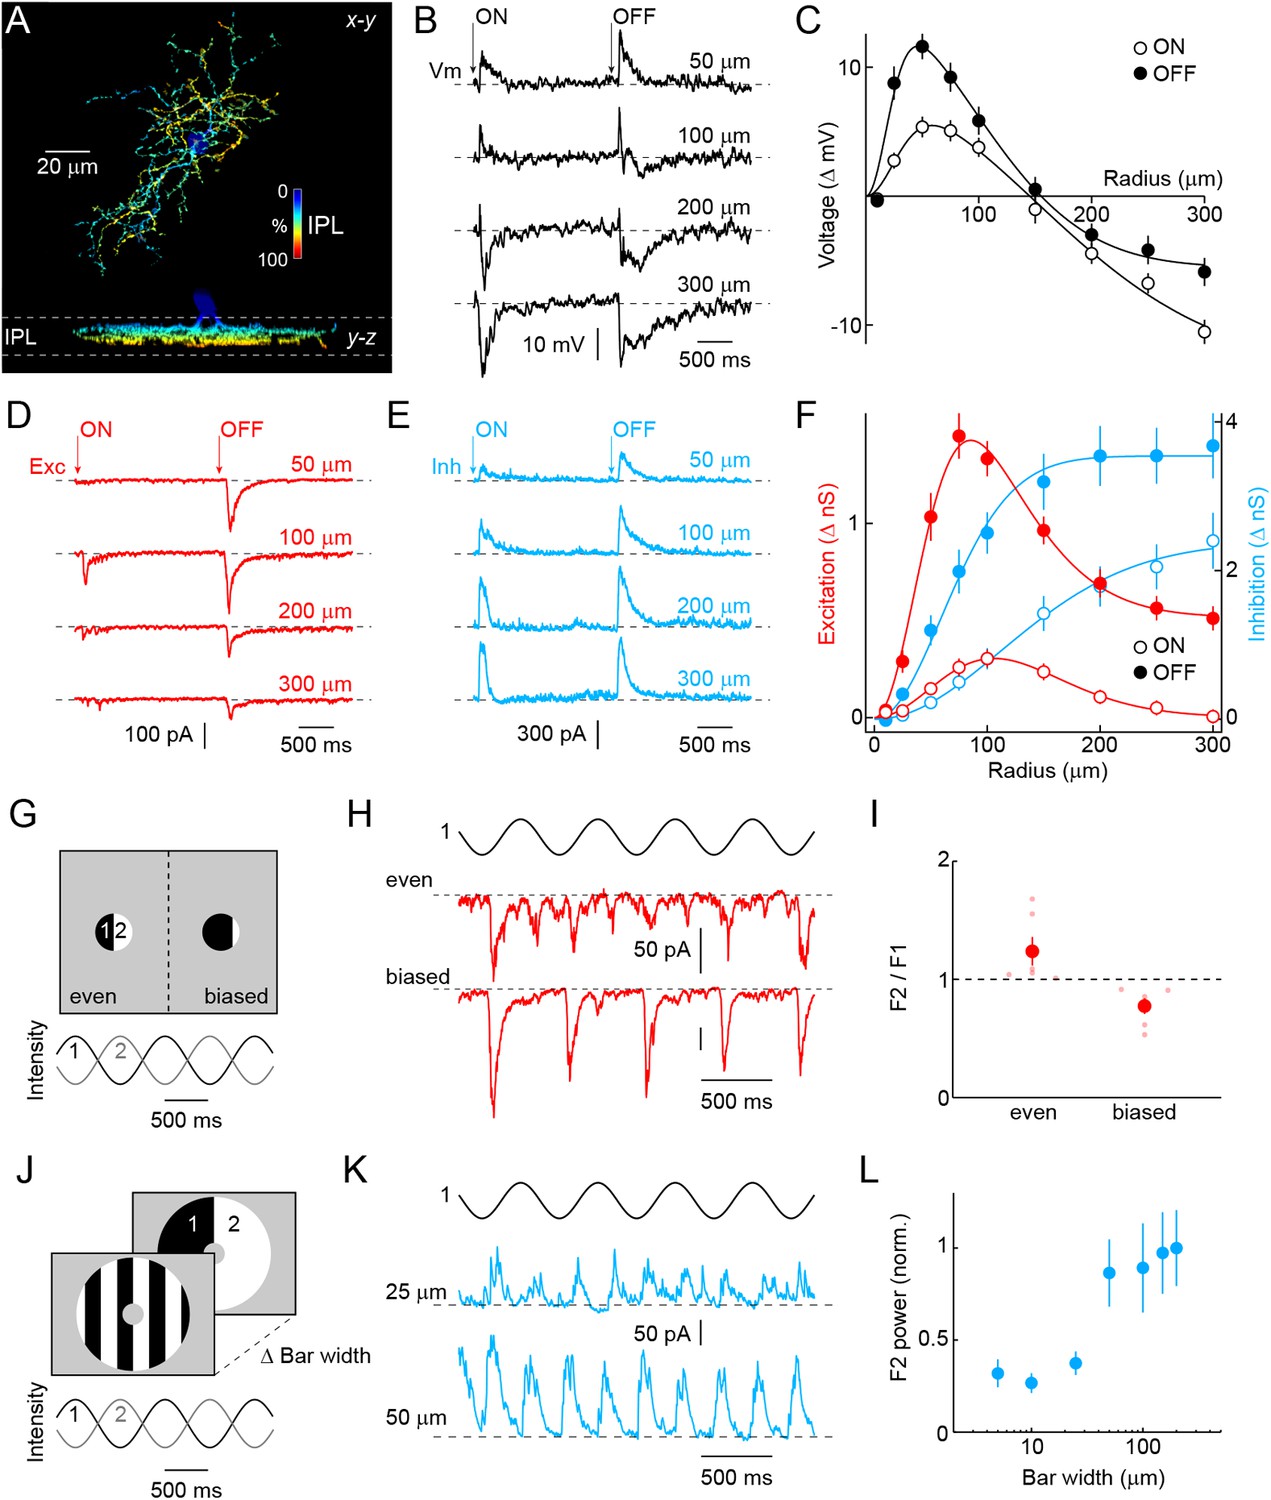
Morphology and receptive field properties of VG3-ACs.
(A) Orthogonal maximum intensity projections of a confocal image stack through a representative VG3-amacrine cells (ACs) labeled in VG3-CreERT2 Ai9 mice. The fluorescent signal is colored to reflect depth in the inner plexiform layer (IPL). Inset bar graph shows the mean ± SEM territory size of VG3-ACs (n = 39) measured as the area of the smallest convex polygon to encompass their arbors in a z-projection. (B, D, E) Representative voltage (B, black), excitatory postsynaptic current (EPSC) (D, red), and inhibitory postsynaptic current (IPSC) (E, blue) responses to a stimulus in which luminance in a circular area of varying size is square-wave modulated (2 s ON, 2 s OFF, transitions indicated by ‘arrows’). Stimuli were presented in pseudorandom order centered on the soma of the recorded cell. Each response trace is annotated with the radius of the stimulus eliciting it. The resting membrane potential of VG3-ACs in our recordings was −38 ± 1.2 mV (n = 26). (C, F) Summary data of the spatial ON (open circles) and OFF (filled circles) sensitivity profiles of VG3-ACs for voltage responses (C, black, n = 26) and excitatory (F, red, n = 38) and inhibitory (F, blue, n = 38) conductances. Solid lines show fits of Difference-of-Gaussian (for voltage and excitation) and single Gaussian (for inhibition) models to the data. Receptive field diameters determined from fits to voltage responses were: ON-center 73.4 ± 8.5 μm, OFF-center 40.9 ± 4.2 μm, p < 0.002, ON-surround 290.2 ± 25.5 μm, OFF-surround 213.3 ± 11.3 μm, p < 10−3. Receptive field diameters for excitatory inputs were: ON-center 137 ± 15.8 μm, OFF-center 83.1 ± 10.2 μm, p < 0.005, ON-surround 206.4 ± 14.3 μm, OFF-surround 189.8 ± 23.2 μm, p > 0.4. Diameters of inhibitory center-only receptive fields were: ON 258 ± 24.7 μm, OFF 148.2 ± 12.3 μm, p < 10−4. Response amplitudes to OFF stimuli exceeded those to ON stimuli for voltage (at 100 μm, p < 10−9), excitation (at 100 μm, p < 10−11), and inhibition (at 100 μm, p < 10−5). (G) Schematic illustration of split-field stimuli. The receptive field center is divided evenly (left) or in a biased manner (right) into two regions in which intensity is modulated by phase-shifted sine waves. (H, I) Representative EPSC traces and summary data (n = 6, p < 0.05) for even (top) and biased (bottom) split-field stimulation. (J) Schematic illustration of counter phase stimulation of surround regions. The receptive field surround is divided in bars of different size and their intensity is modulated by phase-shifted sine waves. (K) Representative IPSC traces to counter phase stimulation of bars of 25 μm (middle) and 50 μm (bottom) widths. (L) Summary data illustrating change in F2 power of inhibition as a function of bar widths. See also Figure 1—figure supplement 1 and Figure 1—figure supplement 2.
Figure 1—figure supplement 1
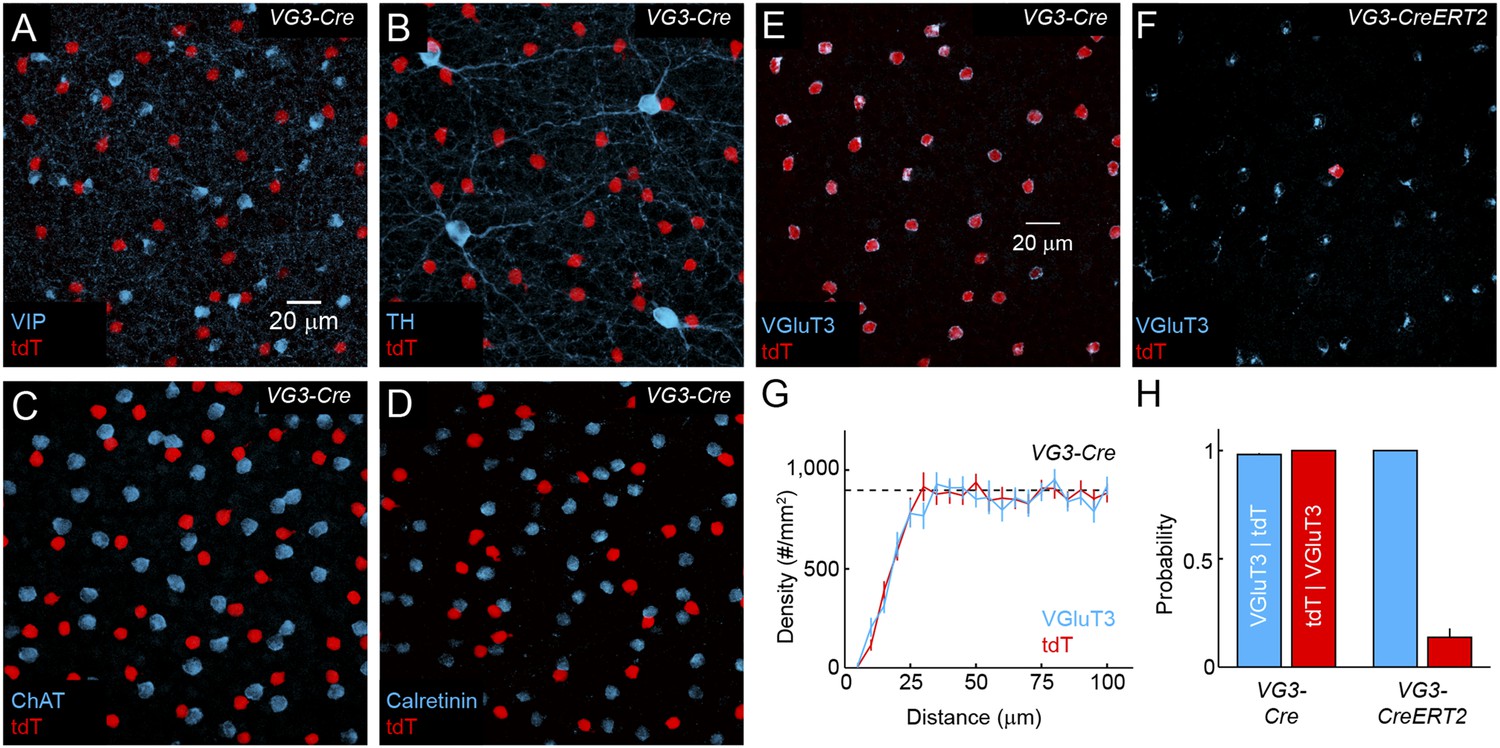
Distribution and specificity of VG3-Cre and VG3-CreERT2 labeling.
(A–F) Maximum intensity projections of confocal image stacks from the INL of VG3-Cre mice crossed to a reporter strain expressing the red fluorescent protein tdTomato (Ai9, tdT, A–E) stained for vasoactive intestinal peptide (VIP, A), tyrosine hydroxylase (TH, B), choline acetyltransferase (ChAT, C), Calretinin (D) and VGluT3 (E), and of VG3-CreERT2 Ai9 mice stained for VGluT3 (F). (G) Density recovery profiles for tdTomato (n = 17 retinas) and VGluT3 (n = 10 retinas) signals in images like that shown in (A) from VG3-Cre Ai9 mice showed that VG3-ACs are arranged in regular mosaics with characteristic exclusion zones in their density recovery profiles (average densities VGluT3: 898 ± 34 cells/mm2, n = 10 retinas, tdTomato: 948 ± 37 cells/mm2, n = 17 retinas, effective radii of exclusion zones VGluT3: 18.1 ± 1.8 μm, tdTomato: 16.9 ± 0.4 μm) (Rodieck, 1991). The density of VG3-ACs was not significantly different between dorsal, ventral, nasal, and temporal quadrants of the retina (data not shown). (H) Conditional probabilities illustrating the specificity (blue bars) and completeness (red bars) of genetic labeling in VG3-Cre and VG3-CreERT2 mice. While Cre expression is highly specific in the INL, ectopic expression was observed in a small subset of cells in the ganglion cell layer (GCL) in VG3-Cre (Figure 4) but not VG3-CreERT2 mice.
Figure 1—figure supplement 2
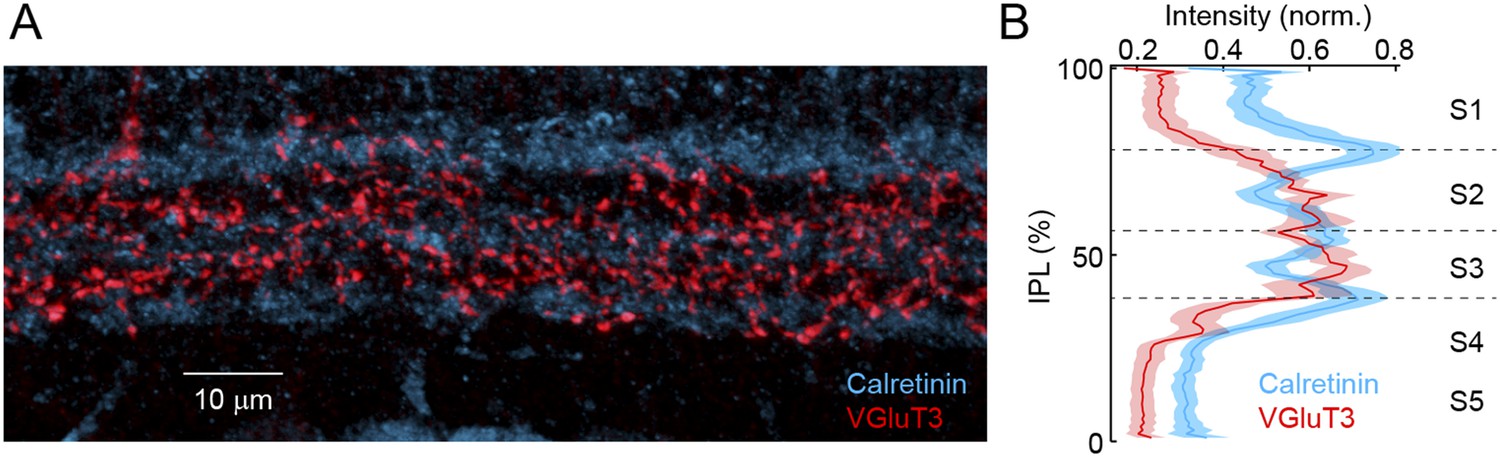
VG3-ACs stratify in sublaminae 2 and 3 of the IPL.
(A) Representative maximum intensity projection of a confocal image stack of the IPL acquired in a retinal vibratome slice stained for Calretinin (blue) and VGluT3 (red). Inner nuclear and GCLs are bordering the top and bottom, respectively, of this image. (B) Intensity profiles (mean ± SEM, n = 10 retinas) of these labels show that VG3-ACs stratify in sublamina 2 and 3 (Figure 1—figure supplement 2 and Figure 1—figure supplement 3) of the IPLs, the boundaries of which are marked by Calretinin (Wassle, 2004). Note the potential strategic importance of this laminar position. We find that OMS responses of VG3-ACs depend on convergent input from transient rectified ON and OFF bipolar cells. Figure 1—figure supplement 2 and Figure 1—figure supplement 3 contain terminals of OFF and ON bipolar cells, respectively (Wassle et al., 2009; Helmstaedter et al., 2013). Furthermore, bipolar cells with transient responses stratify near the center of the IPL (i.e., Figure 1—figure supplement 2 and Figure 1—figure supplement 3), whereas axons of bipolar cells with sustained responses stratify closer to its borders (Roska and Werblin, 2001; Baden et al., 2013; Borghuis et al., 2013). Finally, a recent study identified gradients in the linearity of glutamate release across the IPL with more rectified bipolar cells stratifying towards the middle (Borghuis et al., 2013). Stratification in Figure 1—figure supplement 2 and Figure 1—figure supplement 3, thus, positions VG3-ACs ideally to recruit input from transient rectified ON and OFF bipolar cells, as well as to form synapses with dendrites of W3-RGCs. The strategic importance of this laminar position is further corroborated by the observation that in all species examined, VG3-ACs and LED RGCs stratify near the center of the IPL (Berson et al., 1998; Roska and Werblin, 2001; Famiglietti, 2005; van Wyk et al., 2006; Zhang et al., 2012).
Figure 1—figure supplement 3

Temporal receptive fields of VG3-ACs.
To characterize temporal receptive fields of VG3-ACs, we presented white noise stimuli (refresh rate: 30 Hz, RMS contrast: 40%) to receptive field centers (voltage and excitation) or surrounds (inhibition) and adapted a principal-component-based approach to recover linear filters describing temporal sensitivity to ON and OFF stimuli, respectively (‘Materials and methods’) (Greschner et al., 2006; Gollisch and Meister, 2008). (A, E, I) Linear ON and OFF filters constructed from voltage (A, black), excitation (E, red), and inhibition (I, blue) traces of representative VG3-ACs. (B, C, F, G, J, K) Peak times (B, F, J) and biphasic indices (C, G, K, ON: |trough|/peak, OFF: peak/|trough|) of ON and OFF filters. Dots show data from individual cells and circles (error bars) indicate mean (± SEM) of the population. Peak times of ON and OFF filters were not significantly different for voltage (B, black, n = 9, p > 0.2), excitation (F, red, n = 9, p > 0.4), and inhibition (J, blue, n = 9, p > 0.08). However, ON filters were more biphasic than OFF filters for excitation (G, red, p < 0.002) and inhibition (K, blue, p < 0.002), but not voltage responses (B, black, p > 0.1). (D, H, L) Temporal frequency tuning functions calculated from Fourier amplitudes of ON (left panels) and OFF (right panels) filters for voltage (D, black), excitation (H, red), and inhibition (L, blue) responses show response suppression at high- and low-stimulus frequencies and illustrate the higher sensitivity of VG3-ACs and their synaptic inputs to OFF compared to ON stimuli. Circles (error bars) show mean (± SEM) of the population.
Figure 2 with 1 supplement
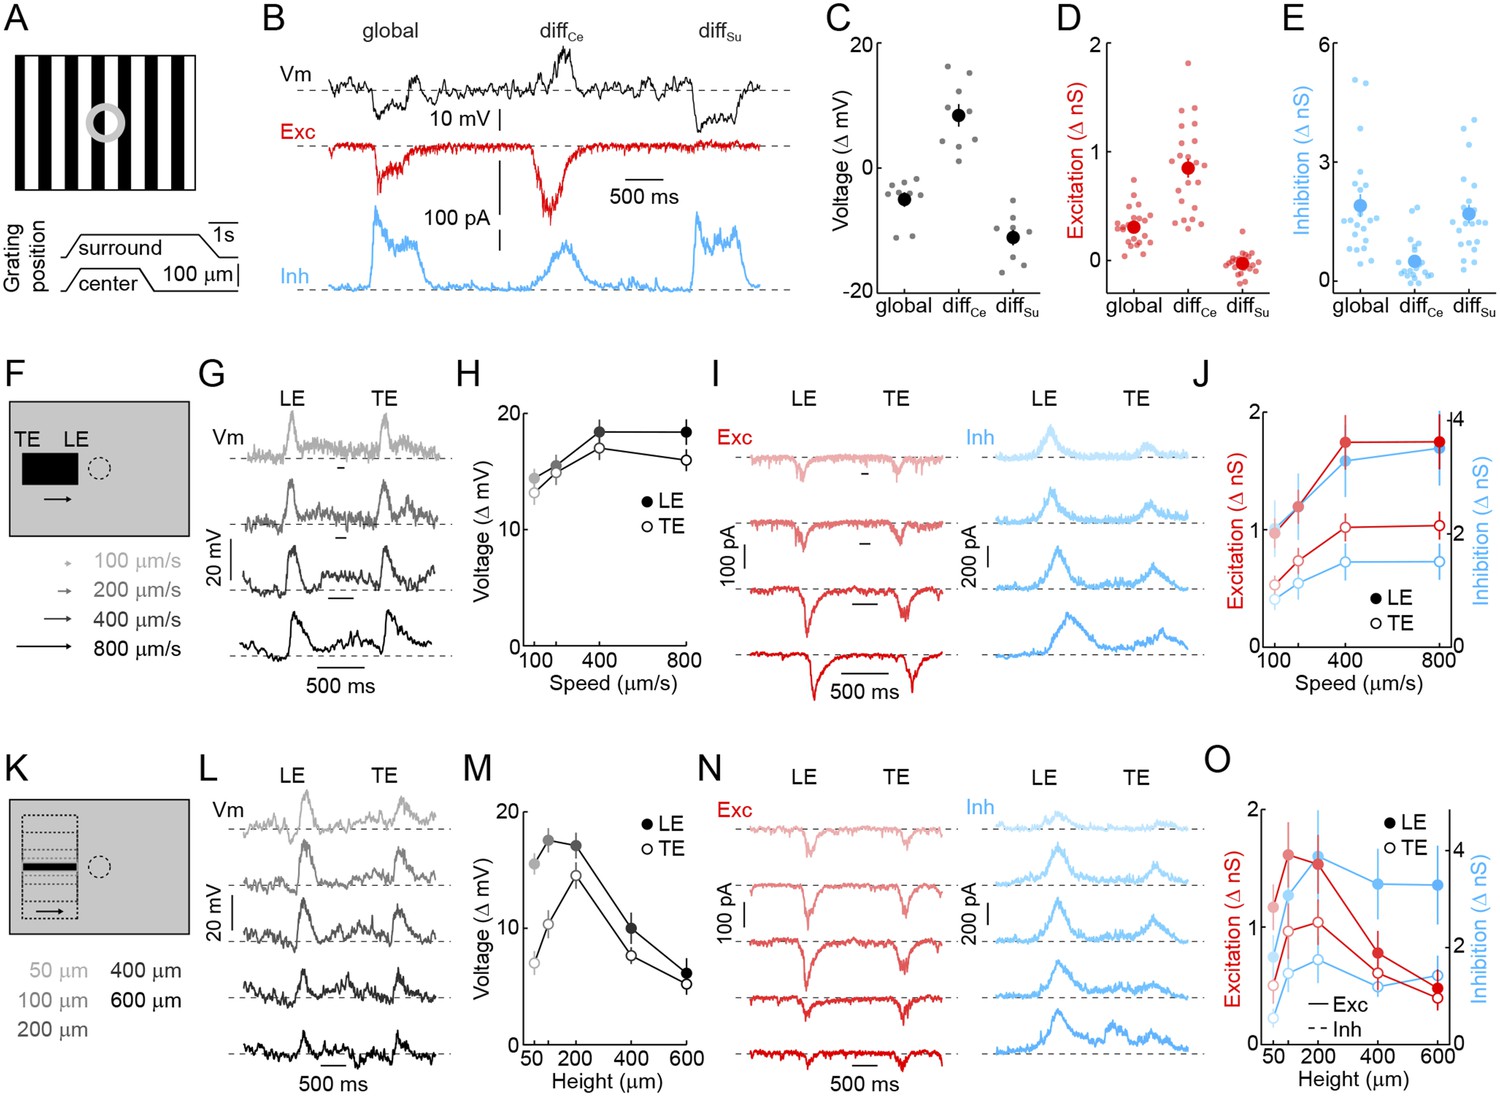
Detection of object motion by VG3-ACs.
(A) Schematic illustrating texture motion stimuli. Two square-wave gratings (bar width: 50 μm), one covering the center and one the surround region of the VG3-AC receptive field, are separated by a gray annulus. During stimulus presentation, both gratings move first together (global) and then separately (differential center motion denoted by diffCe and differential surround motion by diffSu). (B) Representative voltage (black), EPSC (red), and IPSC (blue) traces recorded during presentation of the stimulus shown in (A). (C–E) Summary data of voltage (C), excitatory (D), and inhibitory (E) response amplitudes to global, differential center (diffCe), and differential surround (diffSu) motion stimuli. Dots show data from individual cells (voltage n = 9, excitation n = 22, inhibition n = 22, p < 10−7 for all comparisons), and circles (error bars) indicate mean (±SEM) of the respective population. (F) Schematic illustrating a stimulus in which a narrow bar (height: 200 μm) is moved across the receptive field of a VG3-AC at a variety of speeds annotated in (F) and encoded by color saturation throughout. (G, I) Representative voltage (G, black), EPSC (I, red), and IPSC (I, blue) traces recorded in response to bars moving at different speeds. Time points when the leading (LE) and trailing edges (TE) of the bar are in the center of the receptive field are indicated. (H, J) Summary data of voltage (H, black), excitation (J, red), and inhibition (J, blue) response amplitudes. Circles (error bars) indicate the mean (±SEM) of these data sets (voltage n = 32, excitation n = 8, inhibition n = 5). (K) Schematic illustrating a stimulus in which bars of varying height are moved across the receptive field of a VG3-AC at a constant speed (400 μm/s). Bar heights are encoded in by color saturation as indicated in (K). (L–O) Representative voltage (L, black), EPSC (N, red), and IPSC (N, blue) traces. Summary data of voltage (M), excitation (O, red), and inhibition (O, blue) response amplitudes reveal suppression of edge responses for voltage and excitation, but not inhibition at greater bar heights (comparison of 200 μm and 600 μm, voltage n = 32, p < 10−7 excitation n = 8, p < 0.001, inhibition n = 5, p > 0.14). Circles (error bars) indicate the mean (±SEM) of these data sets. See also Figure 1—figure supplement 3.
Figure 2—figure supplement 1
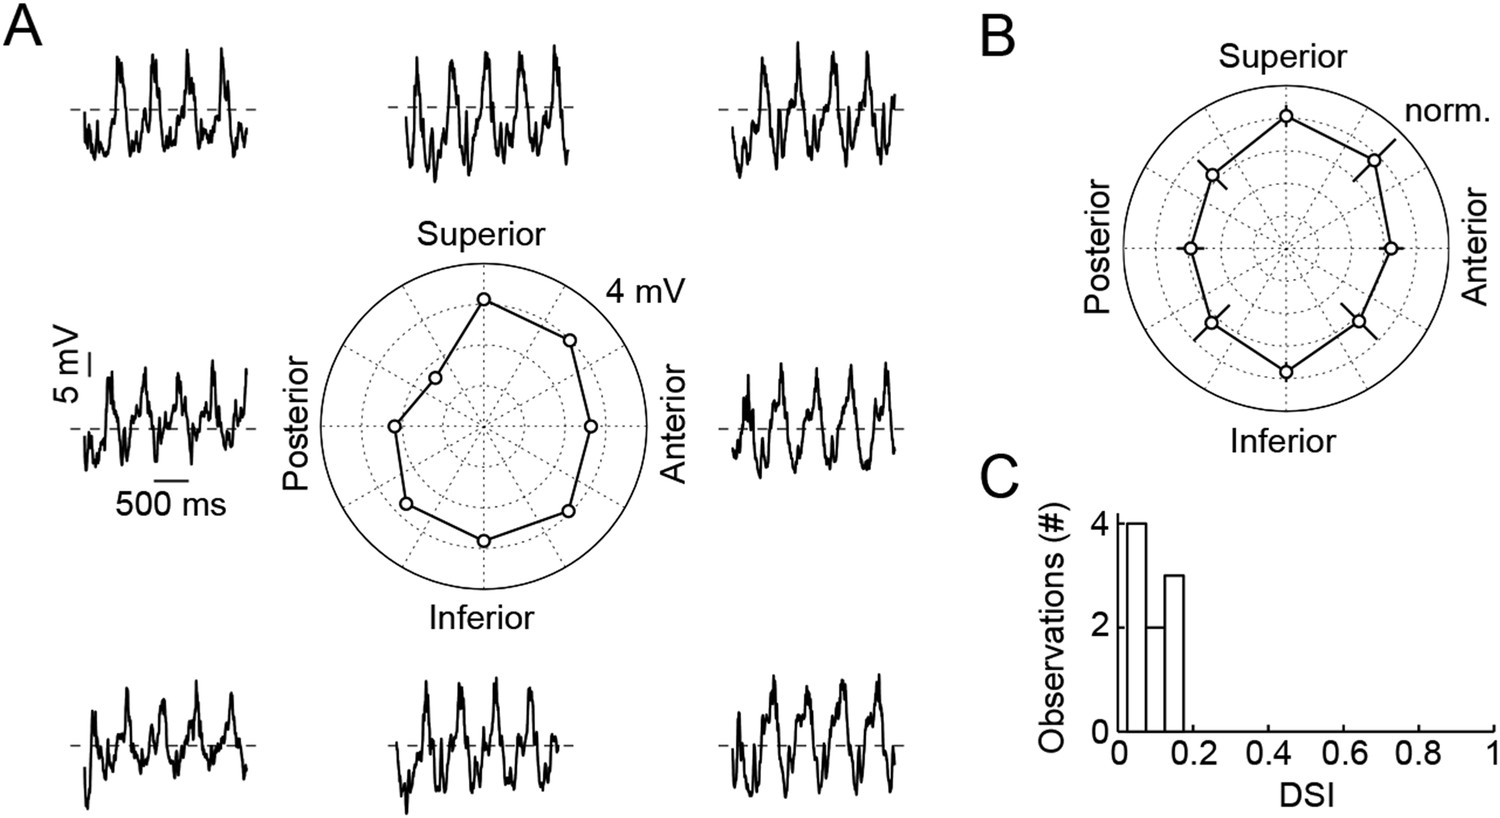
Responses of VG3-ACs are not direction selective.
(A) Representative responses of a VG3-AC to a sine grating drifting in eight different directions (frequency: 2 Hz). The polar plot in the center shows the Fourier amplitude of the response at the stimulus frequency (F1). (B) Polar plot summarizing responses of nine VG3-ACs (mean ± SEM). (C) Histogram of direction selectivity index (DSI) values of these VG3-ACs. The DSI was calculated as the absolute amplitude of .
Figure 3

Spiking ACs mediate surround suppression of VG3-ACs.
(A) Representative voltage traces recorded from a VG3-AC during presentation of the texture motion stimulus illustrated in Figure 2A in control conditions (top, black) and in the presence of TTX (bottom, blue). (B) Bars (error bars) indicating mean (±SEM) response amplitudes to different segments of the texture motion stimulus in control conditions (left, black) and in the presence of TTX (right, blue). TTX abolishes the suppression by global and differential surround motion (control n = 9, TTX n = 5, p < 10−4 for TTX vs control) but does not affect the response to differential center motion (p > 0.2 for TTX vs control). (C, D) Representative traces (C) and summary data (D, mean ± SEM) for voltage responses of VG3-ACs to narrow dark bars (height: 200 μm) moving at different speeds (100 μm/s, 200 μm/s, 400 μm/s, and 800 μm/s from top to bottom), encoded by matching color saturation in (C) and (D) in the absence (left, black) or presence (right, blue) of TTX. TTX did not significantly alter responses to narrow bars irrespective of their speed (control n = 32, TTX n = 7, p > 0.1 for all comparisons). (E, F) Exemplary traces (E) and population data (F, mean ± SEM) for voltage responses of VG3-ACs to dark bars of different heights (50 μm, 100 μm, 200 μm, 400 μm, and 600 μm from top to bottom) moving at 400 μm/s, indicated by matching color saturation in (E) and (F), in the absence (left, black) or presence (right, blue) of TTX. Surround suppression is canceled by TTX leading to increased responses to larger bars (at 600 μm, control n = 32, TTX n = 7, p < p < 10−4).
Figure 4 with 4 supplements
Anatomy and function of input from VG3-ACs to W3-RGCs.
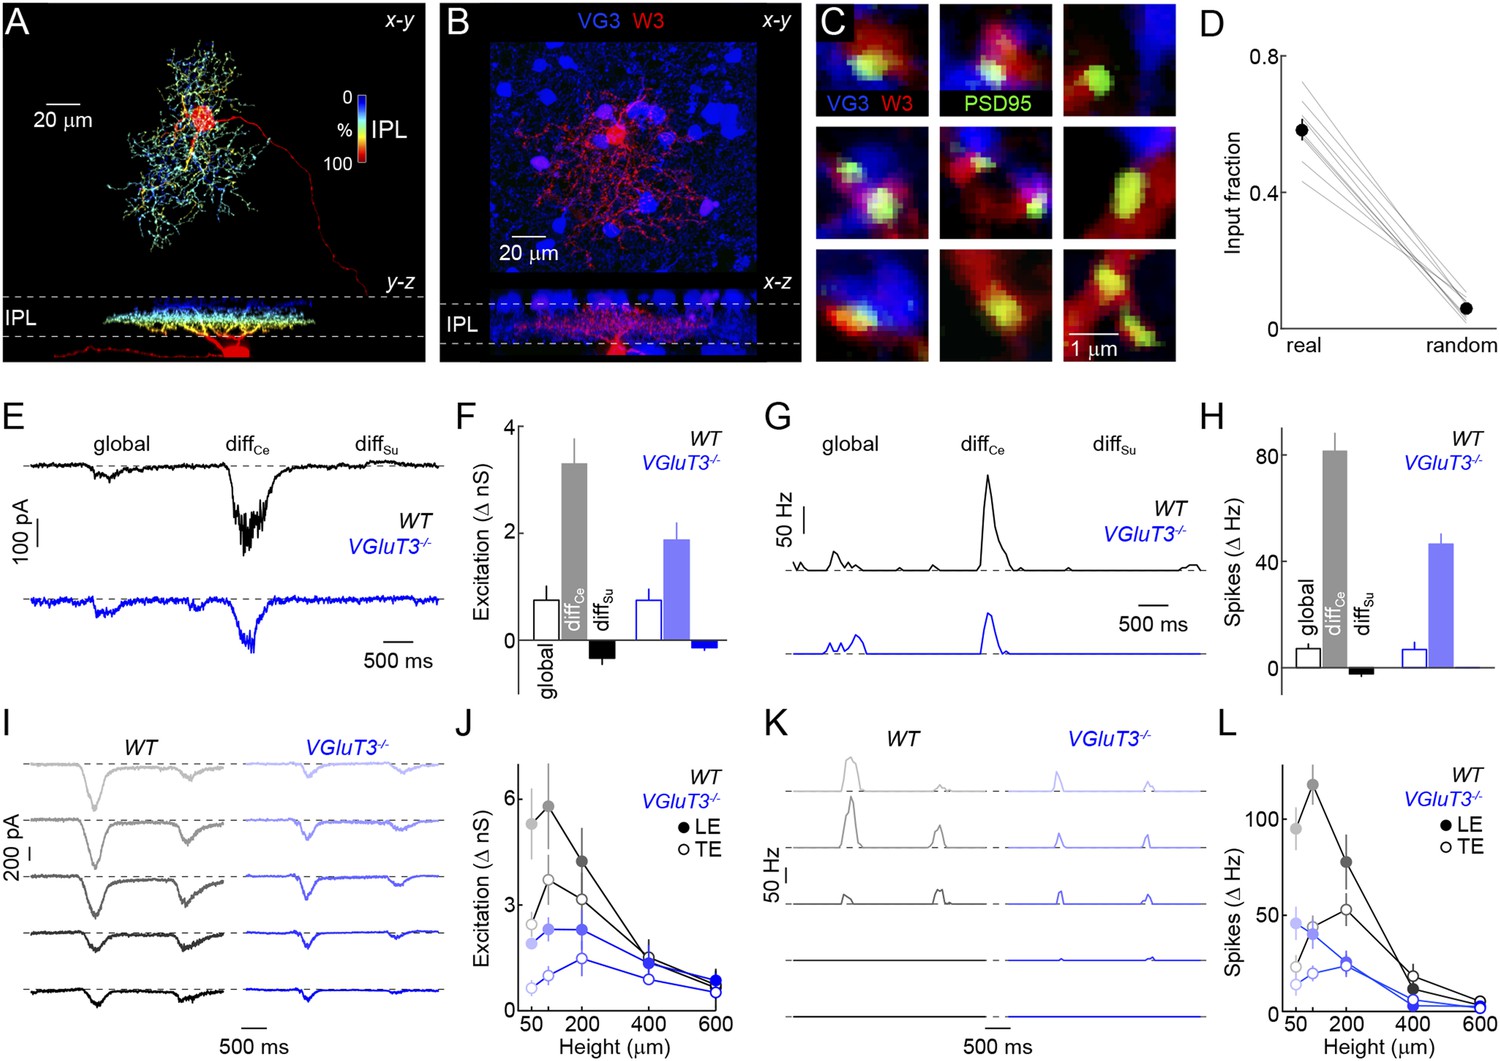
(A) Orthogonal projections of a confocal image stack through a representative W3-retinal ganglion cell (RGC) labeled biolistically with cyan fluorescent protein (CFP). W3-RGCs were identified by their characteristic morphology (Kim et al., 2010; Zhang et al., 2012) with small dendritic fields (territory size: 10,783 ± 409 μm2, n = 25) filled by densely branched neurites stratifying in the center of the IPL with a secondary arborization near the border between the inner plexiform and inner nuclear layers (INLs). The fluorescent signal is colored to represent depth in the IPL. Inset bar graph shows the mean ± SEM territory size of W3-RGCs (n = 15) measured as the areas of the smallest convex polygons to encompass their arbors in a z-projection. (B, C) Overview projections (B) and single plane excerpts (C) of a W3-RGC biolistically labeled with CFP (red) and PSD95-YFP (green) in a VG3-Cre Ai9 mouse (tdTomato shown in blue). (D) Summary data indicating the fraction of PSD95-YFP puncta apposed by VG3-AC boutons (‘Materials and methods’) in the obtained images (real) or when positions of PSD95-YFP puncta were randomized within the synaptic layer (random) in Monte Carlo simulations (n = 9 cells, p < 10−6). Gray lines indicate data from individual cells; circles (error bars) show the mean (±SEM) of the population. (E–H) Representative EPSC (E) and spike response (G) traces to the texture motion stimulus illustrated in Figure 2A recorded from W3-RGCs (wild-type [WT] black, vesicular glutamate transporter 3 [VGluT3−/−] blue), and bar plots summarizing differences in excitatory conductance (F) and spike rates (H) during different segments of the stimulus in WT (left, black) and VGluT3−/− mice (right, blue). Bars (error bars) indicate the mean (±SEM) of the respective data sets. W3-RGC EPSCs in VGluT3−/− mice were significantly reduced compared to WT littermates during differential center motion (WT n = 8, VGluT3−/− n = 9, p < 0.02), but not global or differential surround motion (p > 0.1 for both). A similar pattern was observed in the spike responses of W3-RGCs, which were decreased for differential center motion (WT n = 13, VGluT3−/− n = 9, p < 0.001), but not altered during global image motion (p > 0.9). (I–L) Representative EPSC (I) and spike response (K) traces, and summary data (excitation in J, spikes in L, mean ± SEM) recorded in W3-RGCs during stimulation with dark bars of different heights (indicated by color saturation) moving at 400 μm/s in WT (left, black) and VGluT3−/− mice (right, blue). Whereas excitatory inputs and spike responses were reduced for narrow bars (excitation at 100 μm, WT n = 6, VGluT3−/− n = 6, p < 0.03, spikes at 100 μm, WT n = 14, VGluT3−/− n = 8, p < 0.01), they did not differ significantly for bars of greater heights (excitation at 600 μm, WT n = 6, VGluT3−/− n = 6, p > 0.6, spikes at 600 μm, WT n = 14, VGluT3−/− n = 8, p < 0.2). See also Figure 2—figure supplement 1, Figure 4—figure supplement 1 and Figure 4—figure supplement 2.
Figure 4—figure supplement 1
Detection of object motion by W3-RGCs.
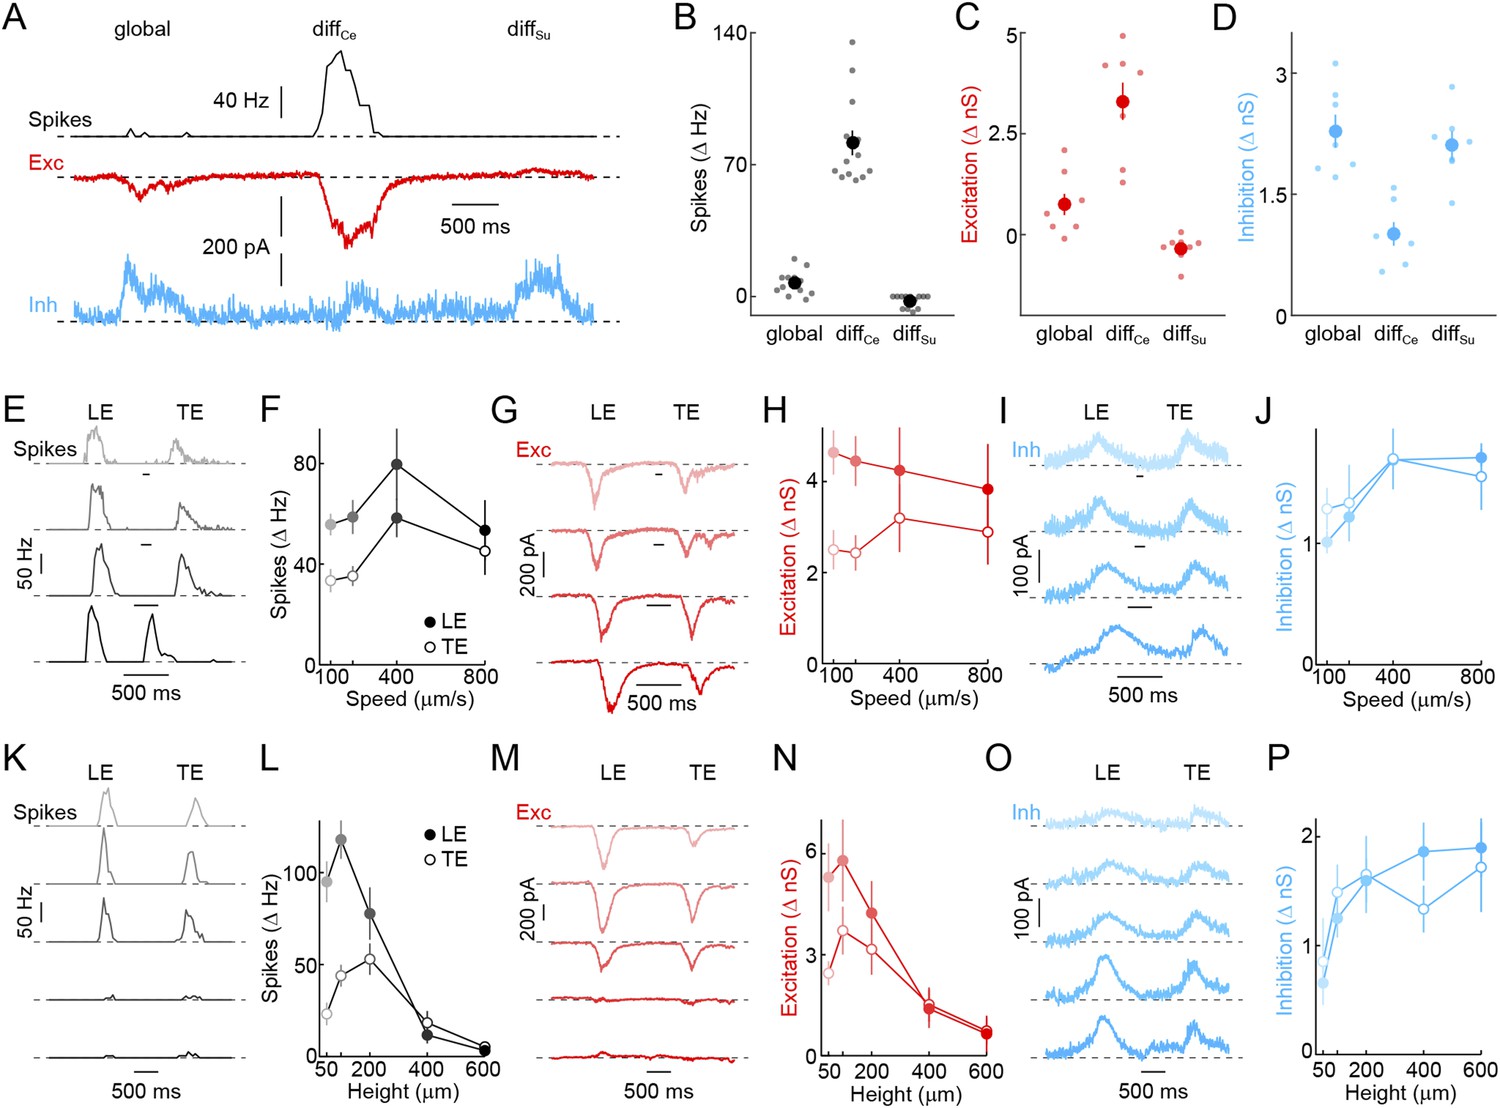
(A) Representative spike rate (black), EPSC (red), and IPSC (blue) traces recorded from W3-RGCs during presentation of the texture motion stimuli (illustrated in Figure 2A). W3-RGCs were either recorded under conventional infrared illumination and identified by characteristic responses in cell-attached recordings or targeted under 2-photon guidance in Isl2-GFP transgenic mice (Triplett et al., 2014). In both cases, correct targeting was confirmed by intracellular dye filling and reconstruction of dendritic arborizations at the end of the recordings. (B–D) Summary data of spike rate (B, black), excitatory (C, red), and inhibitory (D, blue) response amplitudes to global, differential center (diffCe), and differential surround (diffSu) motion segments. Dots show data from individual cells and circles (error bars) indicate mean (± SEM) of the respective population. W3-RGCs remain mostly silent during global and differential surround motion stimulation, but show robust spike responses to grating movements restricted to their receptive field center (n = 13, p < 10−7 for diffCe vs global and vs diffSu). Differential motion sensitivity of WG3-RGCs appears to be inherited from their excitatory input, which during center-only motion exceeds that observed during global motion nearly fivefold, and which is suppressed from tonic levels during isolated surround stimulation (n = 8, p < 0.003 for diffCe vs global and vs diffSu). In addition, W3-RGCs receive stronger direct inhibition when grating movements include the surround (n = 7, p < 0.001 for diffCe vs global and vs diffSu) (E–J) Representative spike rate (E, black), EPSC (G, red), and IPSC (I, blue) traces and summary data of spike (F, black), excitatory (H, red), and inhibitory (J, blue) response amplitudes to dark bars (height: 200 μm) moving at different speeds indicated by matching color saturation of example traces and summary data. Circles (error bars) represent the mean (± SEM) of these data sets (spikes n = 32, excitation n = 8, inhibition n = 5). (K–P) Representative spike rate (K, black), EPSC (N, red), and IPSC (O, blue) responses elicited by bars of different heights moving at 400 μm/s and summary data of spike rate (L, black), excitatory (N, red), and inhibitory (P, blue) response amplitudes. Bar heights are encoded by matching color saturation of responses traces and summary data. Circles (error bars) represent the mean (± SEM) of these data sets. Responses of W3-RGCs are progressively suppressed when bar heights increase above 100 μm (n = 14, p < 10−4 for 200 μm vs 600 μm bar heights). The spatial tuning of the excitatory input to W3-RGCs is similar to that observed in spike responses (n = 6, p < 0.02 for 200 μm vs 600 μm bar heights), whereas inhibition rises monotonically and saturates with increasing bar heights (n = 6, p > 0.4 for 200 μm vs 600 μm bar heights).
Figure 4—figure supplement 2
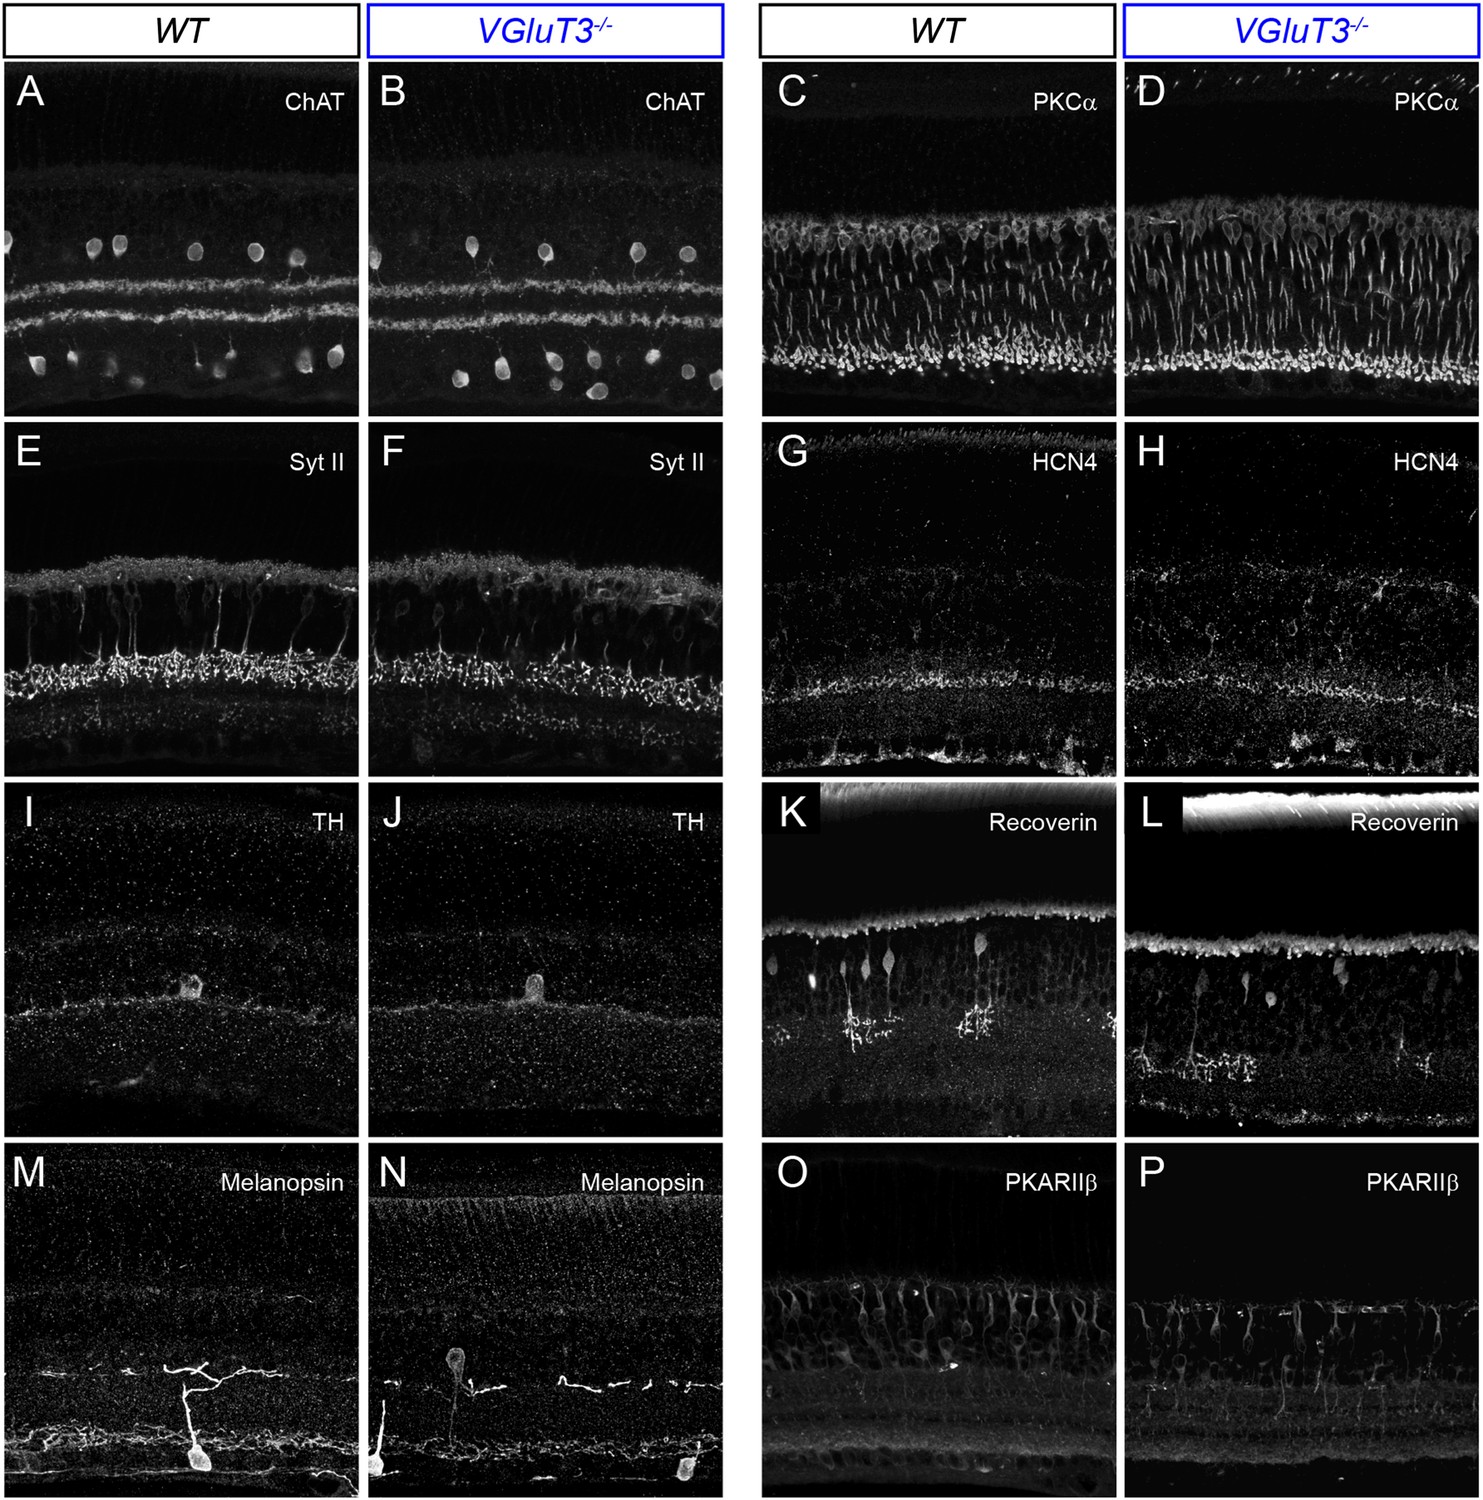
Lamination patterns of cells and neurites are preserved in VGluT3−/− mice.
(A–P) Maximum intensity projections of confocal image stacks of representative vibratome sections of WT (A, C, E, G, I, K, M, O) and VGluT3−/− (B, D, F, H, J, L, N, P) retinas. Sections were stained for choline acetyltransferase (ChAT, A, B), protein kinase C alpha (PKCα, C, D), synaptotagmin II (Syt II, E, F), hyperpolarization activated cyclic nucleotide gated potassium channel 4 (HCN4, G, H), Tyrosine hydroxylase (TH, I, J), Recoverin (K, L), Melanopsin (M, N), and Protein Kinase A regulatory subunit II beta (PKARIIβ, O, P).
Figure 4—figure supplement 3
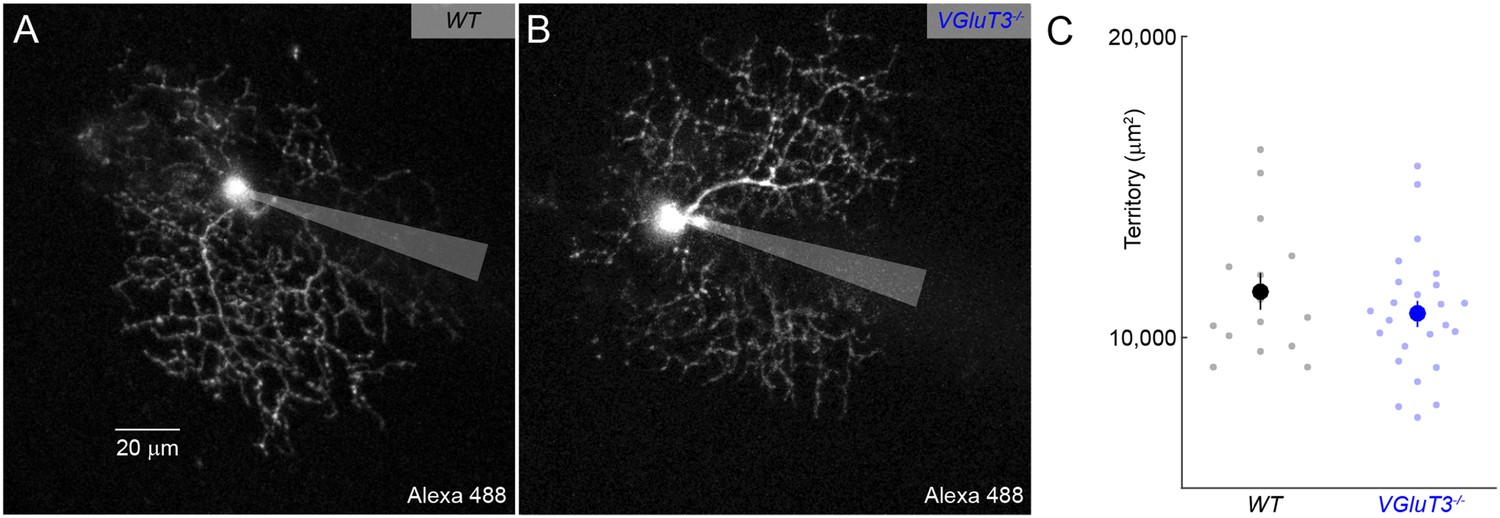
Dendritic morphology of W3-RGCs is unchanged in VGluT3−/− mice.
(A, B) Maximum intensity projections through 2-photon image stacks of representative W3-RGCs recorded in WT (A) and VGluT3−/− (B) mice. (C) Summary data of dendritic territories covered by W3-RGCs labeled biolistically or filled during patch-clamp recordings in WT (black) or VGluT3−/− (blue) retinas.
Figure 4—figure supplement 4
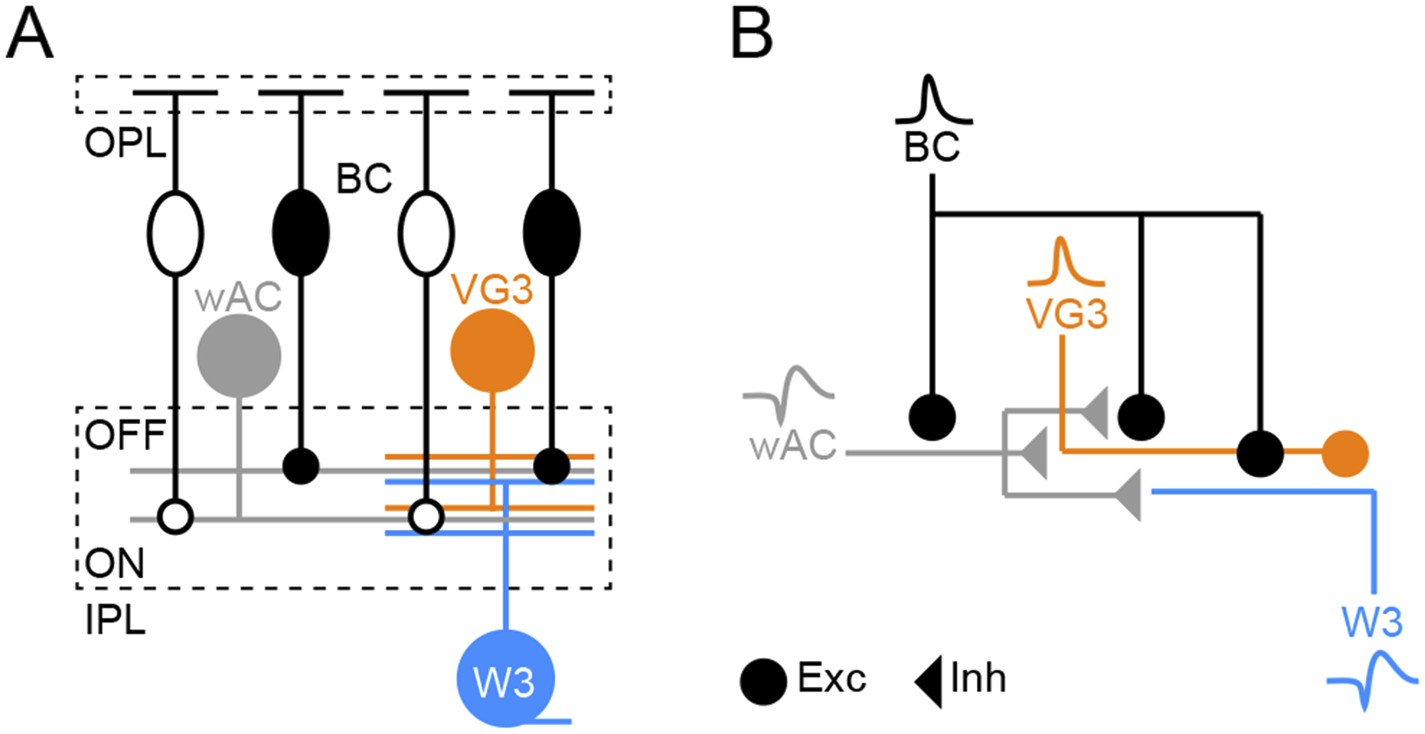
Schematic of object motion detection circuit.
(A) Overview illustration of the object motion detection circuit. Somata of ON and OFF BCs are shown as open and filled ovals, respectively. Axons of these neurons converge onto the other components of the circuit: wide-field ACs (wACs), VG3-ACs, and W3-RGCs. (B) Schematic of the inferred connectivity motif, repeated in ON and OFF layers of the object motion detection circuit. Excitatory and inhibitory synaptic output is shown by circles and triangles, respectively, and use of spikes (wAC, ss) or graded potentials (BC, VG3) is indicated by different waveforms.
Download links
A two-part list of links to download the article, or parts of the article, in various formats.
Downloads (link to download the article as PDF)
Open citations (links to open the citations from this article in various online reference manager services)
Cite this article (links to download the citations from this article in formats compatible with various reference manager tools)
An excitatory amacrine cell detects object motion and provides feature-selective input to ganglion cells in the mouse retina
eLife 4:e08025.
https://doi.org/10.7554/eLife.08025


