Cell-to-cell infection by HIV contributes over half of virus infection
- Kyushu University, Japan
- Japan Science and Technology Agency, Japan
- Kyoto University, Japan
- University of Tokyo, Japan
- Hospital Saint Louis, France
- Université Paris Diderot, Sorbonne Paris Cité, France
- Tokyo University of Agriculture, Japan
Figures
Figure 1
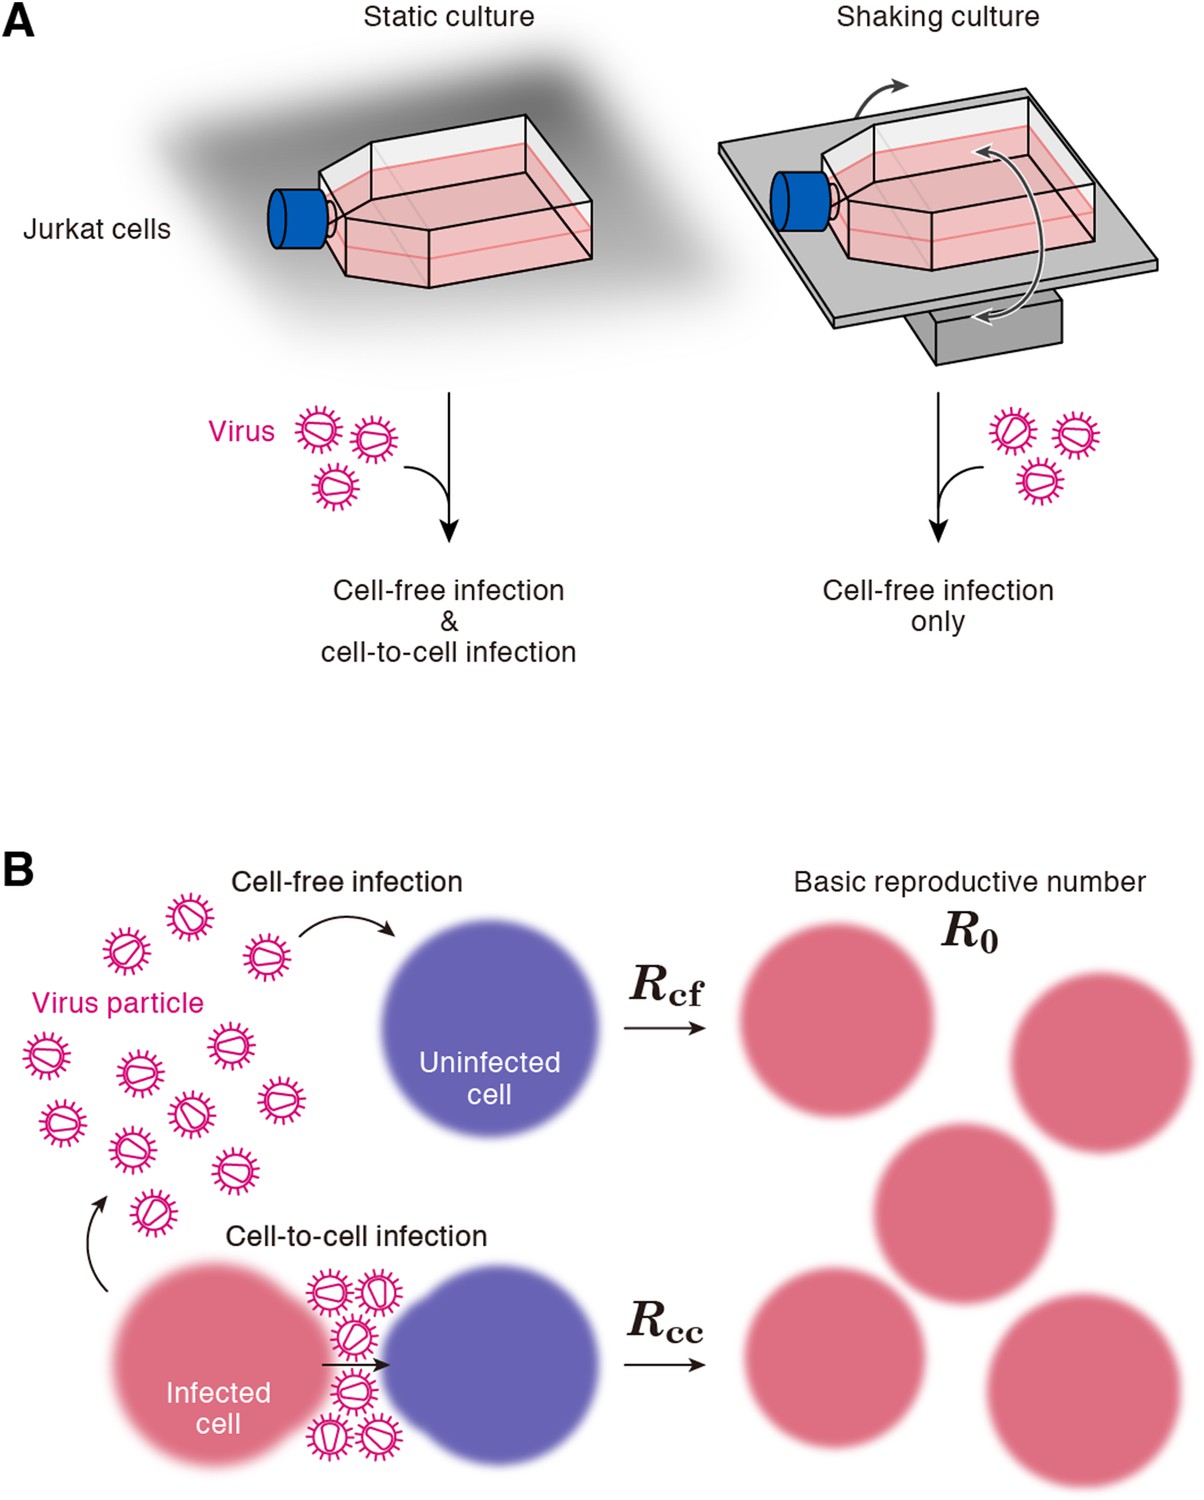
Cell culture systems and the basic reproduction number under cell-to-cell and cell-free infection.
(A) Static and shaking cultures of Jurkat cells. The static and shaking cell cultures allow human immunodeficiency virus type 1 (HIV-1) to perform both cell-free and cell-to-cell infection, and only cell-free infection, respectively. (B) The basic reproduction number, R0, is defined as the number of the secondly infected cells produced from a typical infected cell during its infectious period. In the presence of the cell-to-cell and cell-free infection, the basic reproduction number consists of two sub-reproduction numbers through the cell-free infection, Rcf, and through the cell-to-cell infection, Rcc, respectively.
Figure 2 with 3 supplements
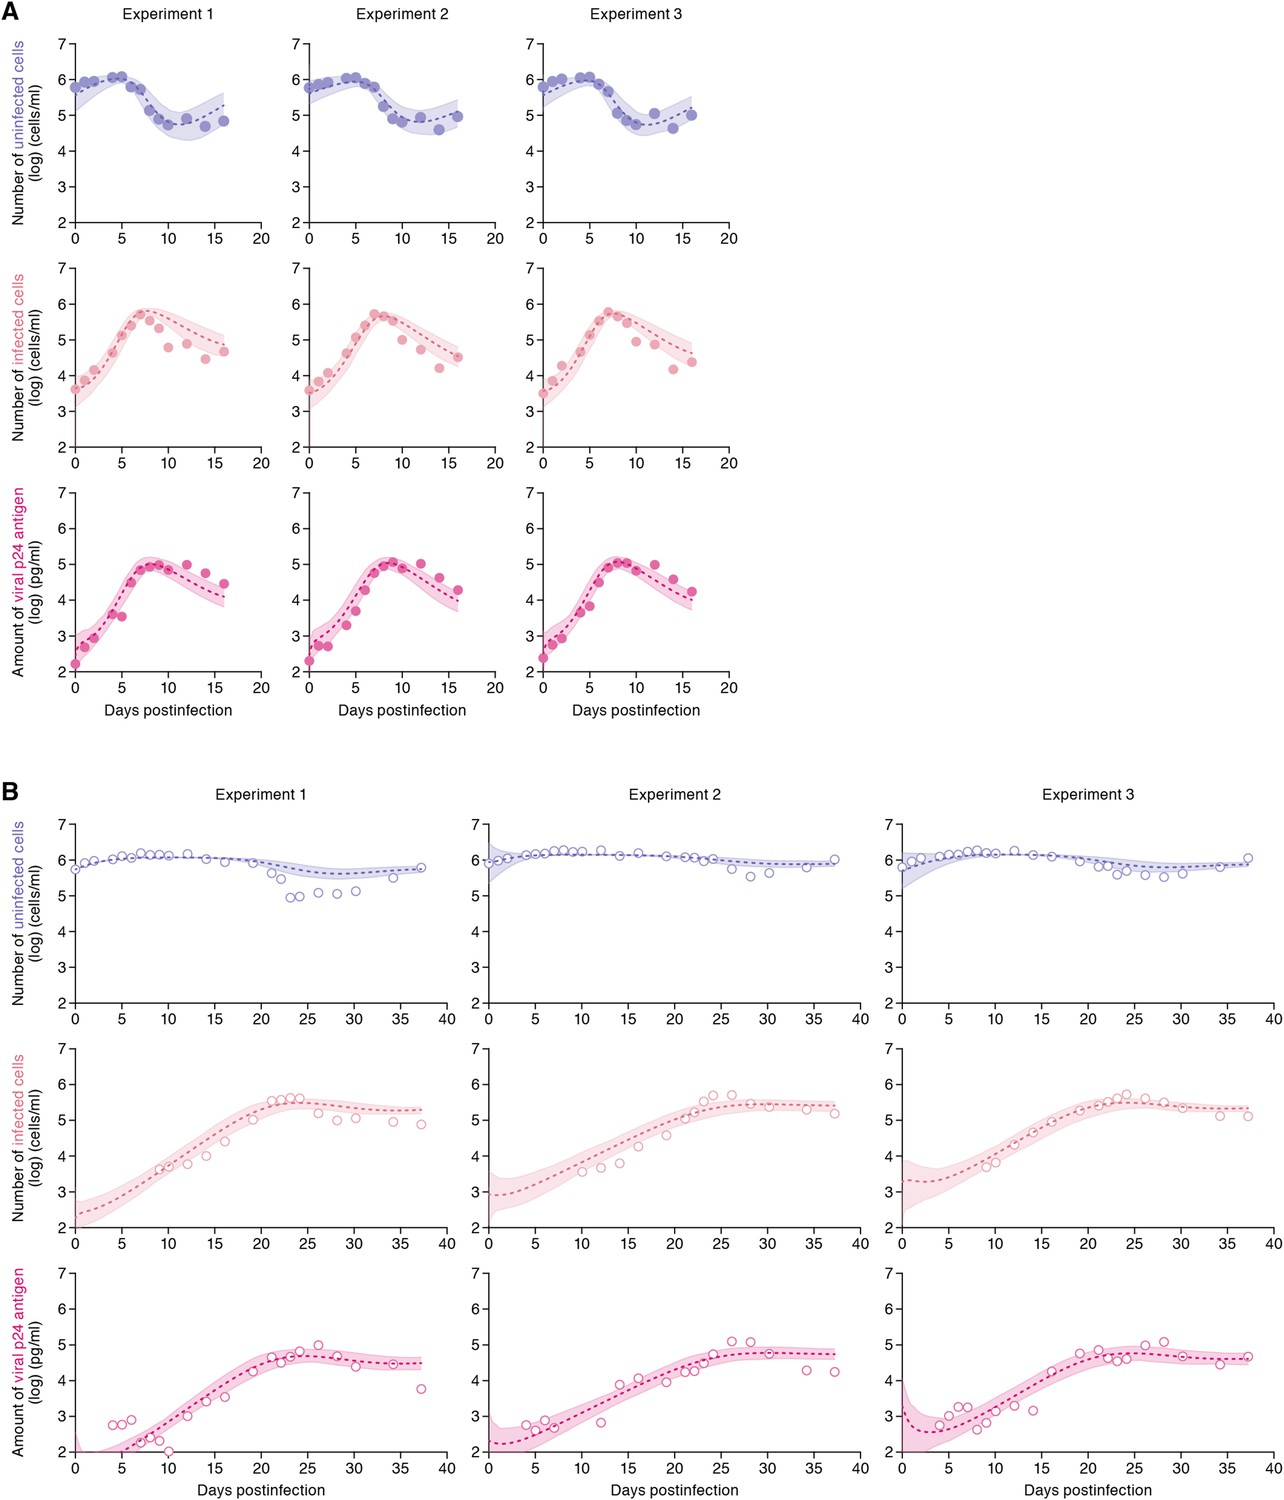
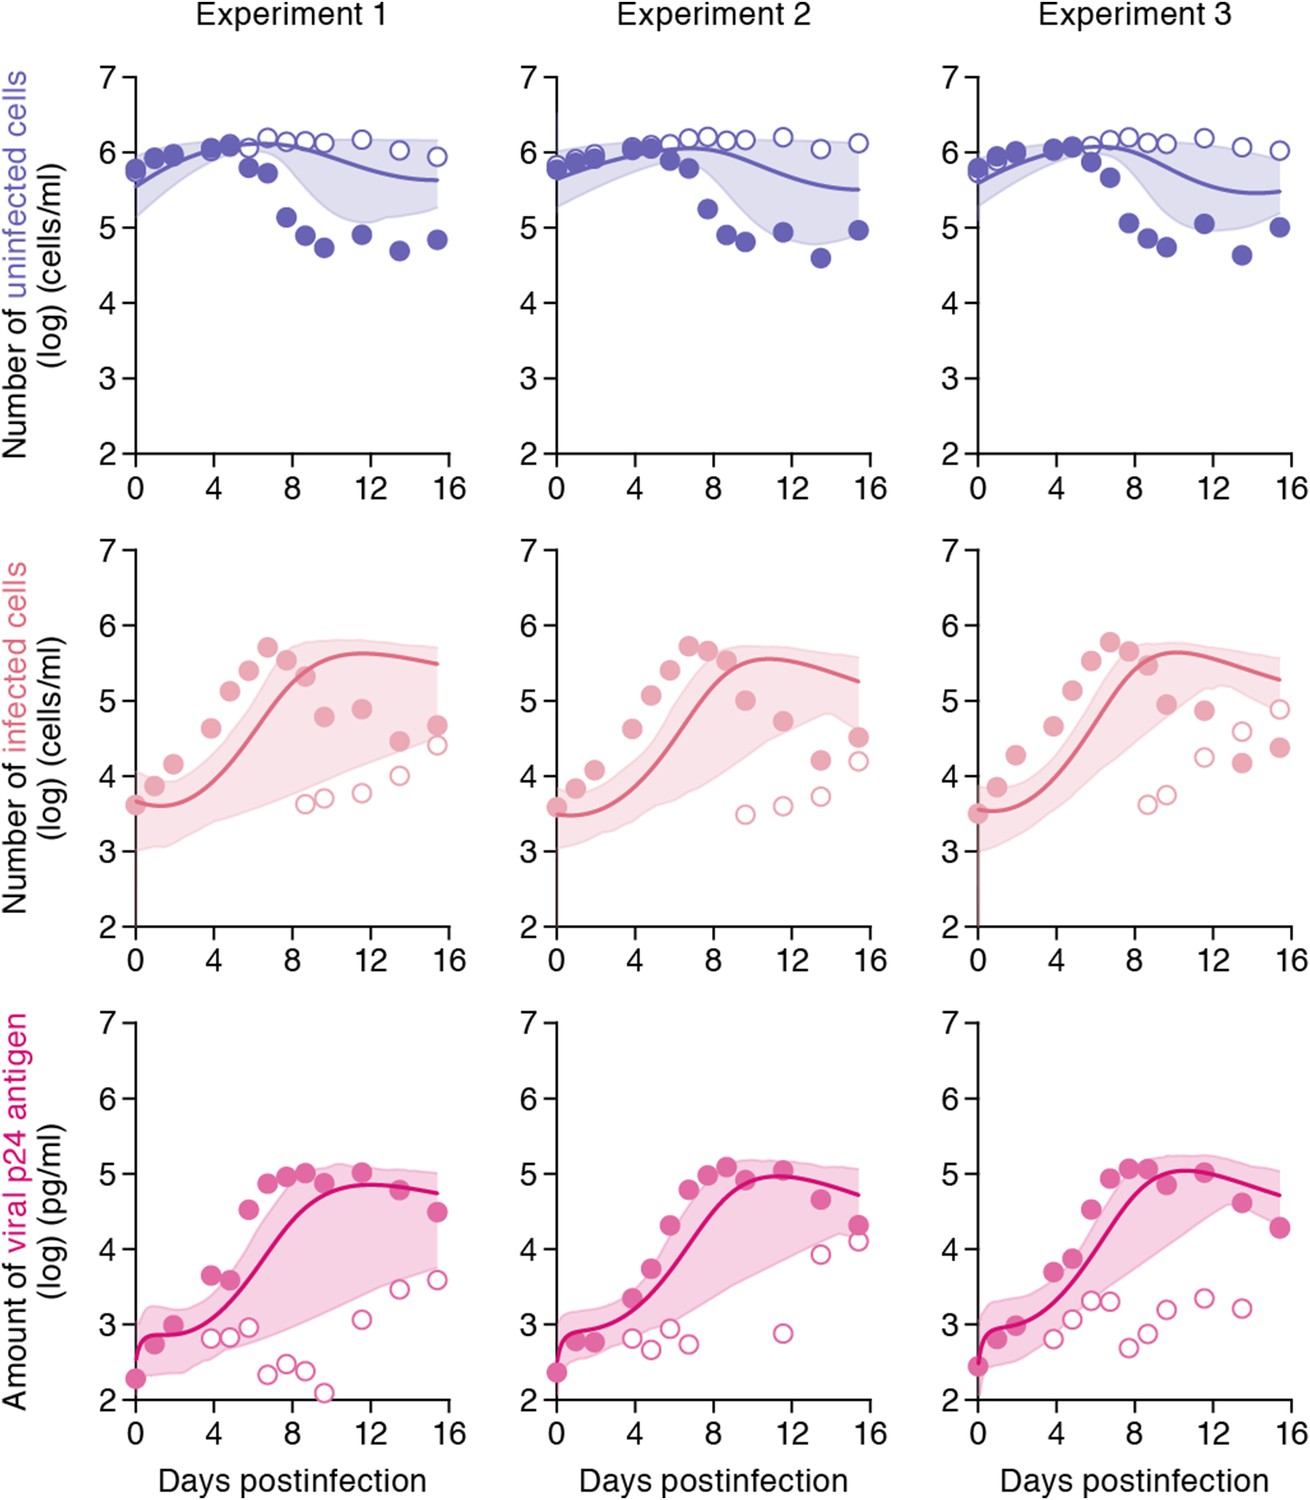
Dynamics of HIV-1 infection in Jurkat cells through cell-free and cell-to-cell infection.
Jurkat cells were inoculated with HIV-1 (at multiplicity of infection 0.1) in the static and shaking cell cultures. Panels A and B show the time-course of experimental data for the numbers of uninfected cells (top) and infected cells (middle), and the amount of viral protein p24 (bottom) in the static and shaking cell culture systems, respectively. The shadow regions correspond to 95% posterior predictive intervals, the dashed curves give the best-fit solution (mean) for Equations 1–3 to the time-course dataset. All data in each experiment were fitted simultaneously. In panels A and B, the results of three independent experiments are respectively shown.
Figure 2—figure supplement 1
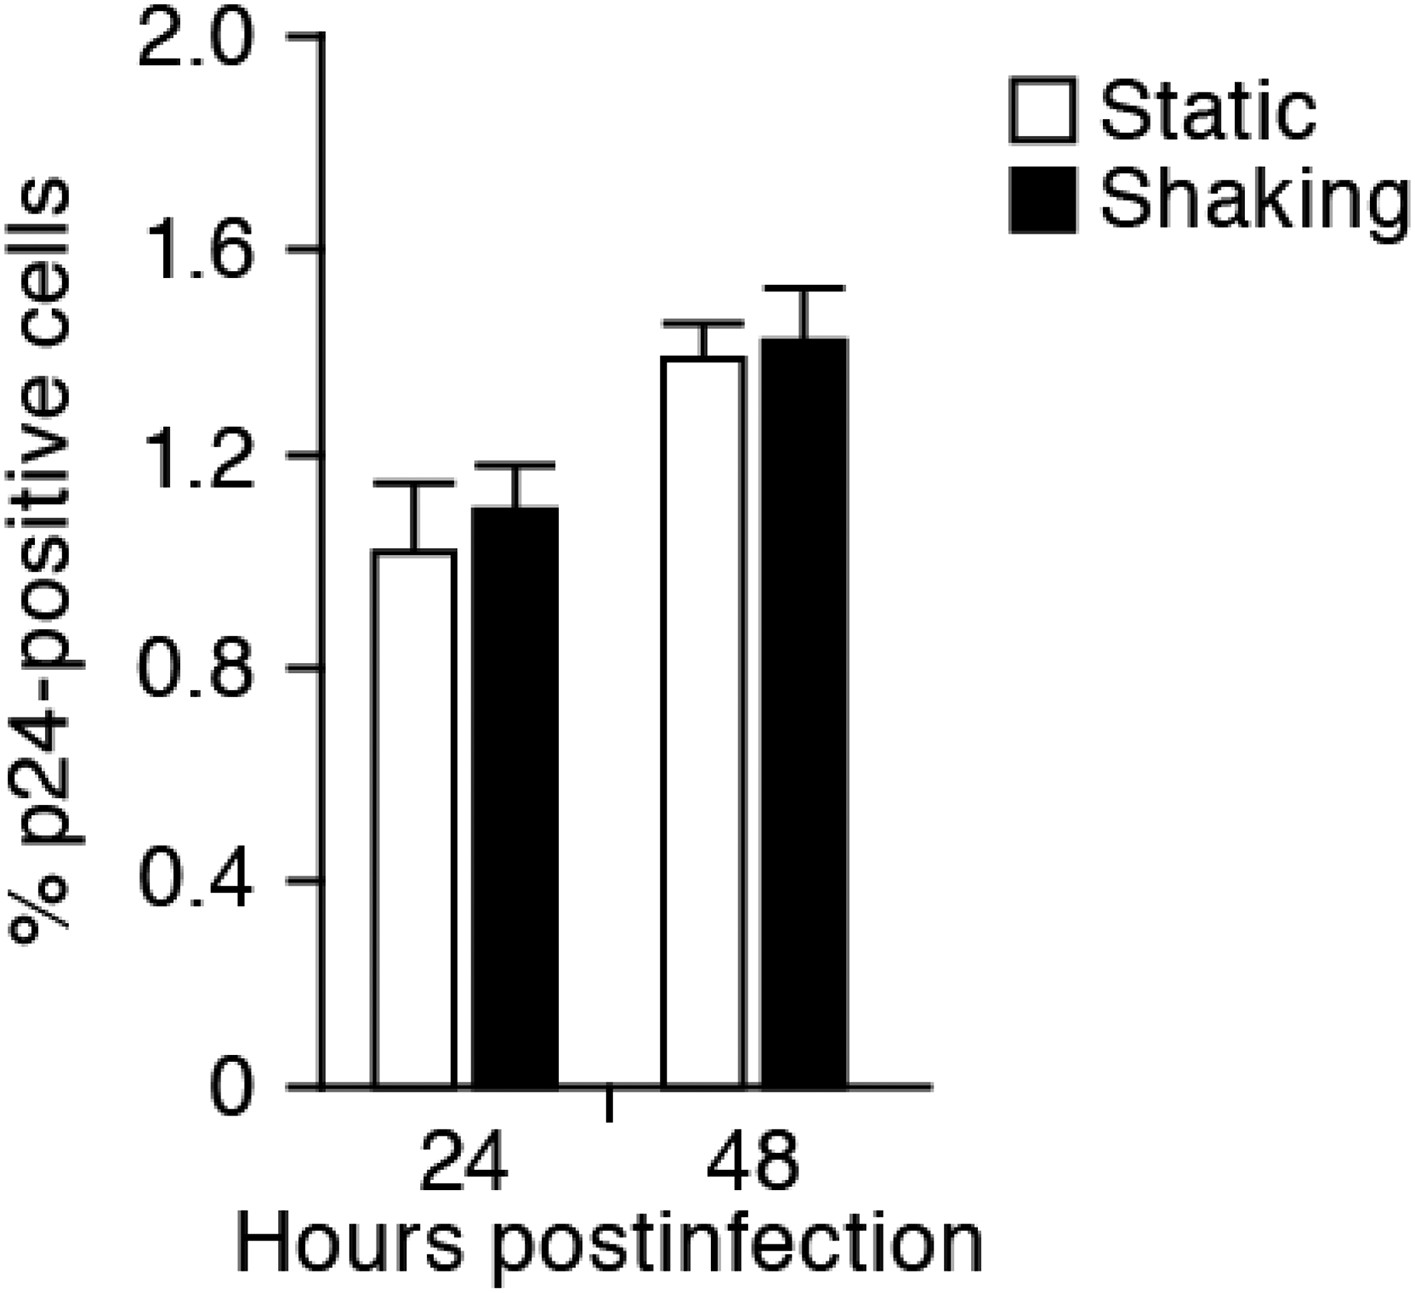
No effect of the shaking procedure on HIV-1 cell-free infection.
Jurkat cells were infected with HIV-1 (at multiplicity of infection 1) as described in ‘Materials and methods’, and the infected cells were cultured in the static and the shaking condition. By harvesting the cells at 24 and 48 hr postinfection, the cells were analyzed by flow cytometry as described in ‘Materials and methods’. The percentage of the average of p24-positive cells are shown with SD. The assay was performed in triplicate, and the representative result is shown. Note that the ratio of input virus to target cells (multiplicity of infection) of this experiment is 10-fold higher than that of the experiment shown in Figure 2. This is for the clear detection of the infected cells (p24-positive cells) during early time points.
Figure 2—figure supplement 2
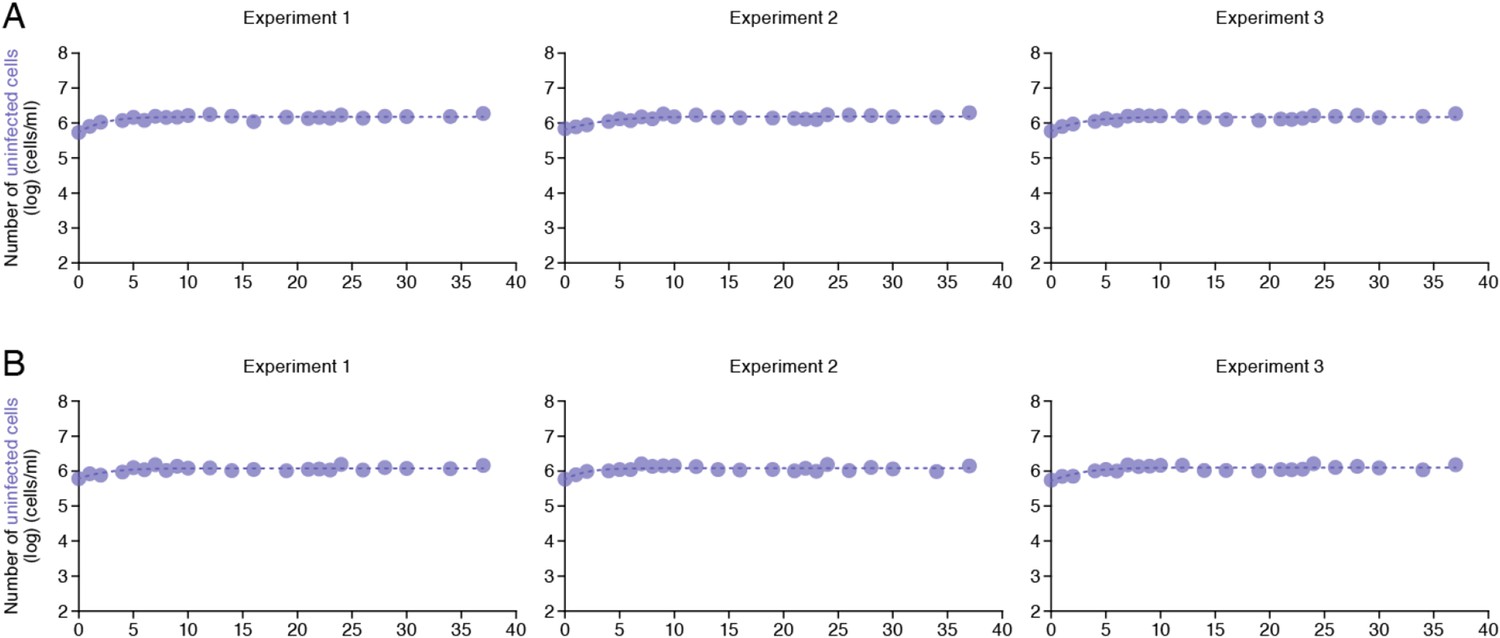
Dynamics of Jurkat cell growth.
Dynamics of Jurkat cell growth in the static and shaking cell cultures. By harvesting the cells for 37 days (A) in the static and (B) in the shaking cell cultures, the growth kinetics of Jurkat cells in these conditions was estimated as described in Materials and methods.
Figure 2—figure supplement 3
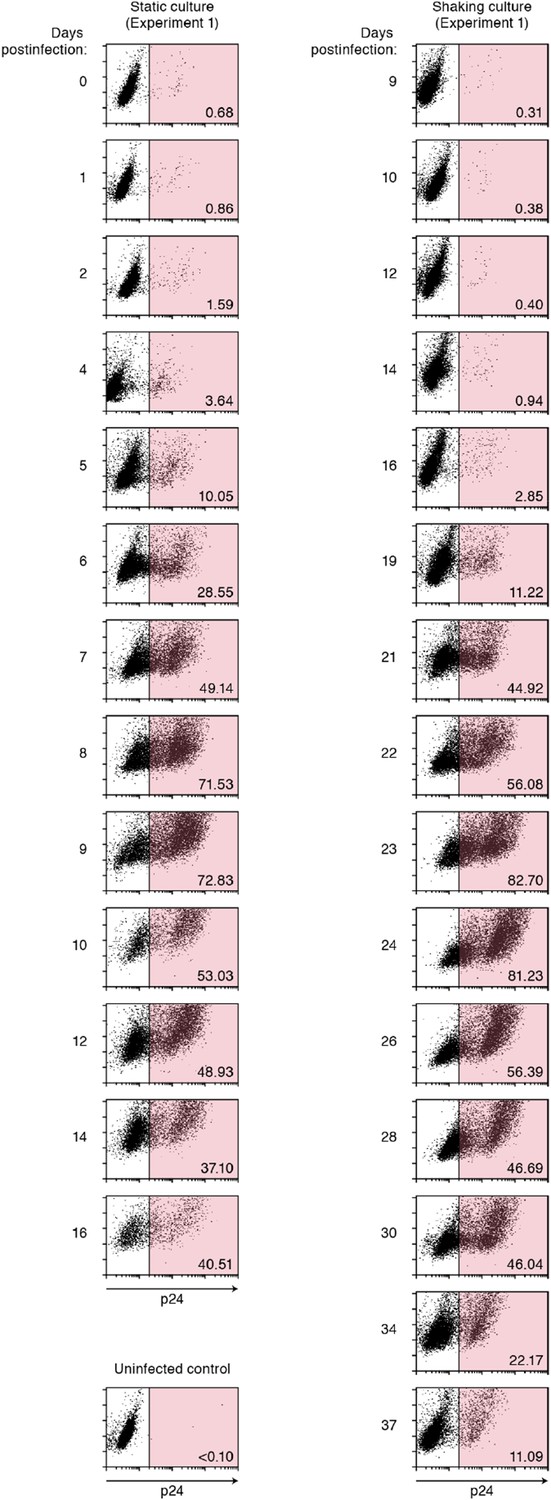
Dot plots of infected cells by flow cytometry.
Representative results of flow cytometry (experiment 1). Time-course results of flow cytometry analyses on experiment 1 of static (left) and shaking (right) cultures are respectively shown. The cells positive for p24 antigen is gated in pink, and the number in the bottom right of the gate indicates the percentage of p24-positive cells. The data is available upon request.
Figure 3
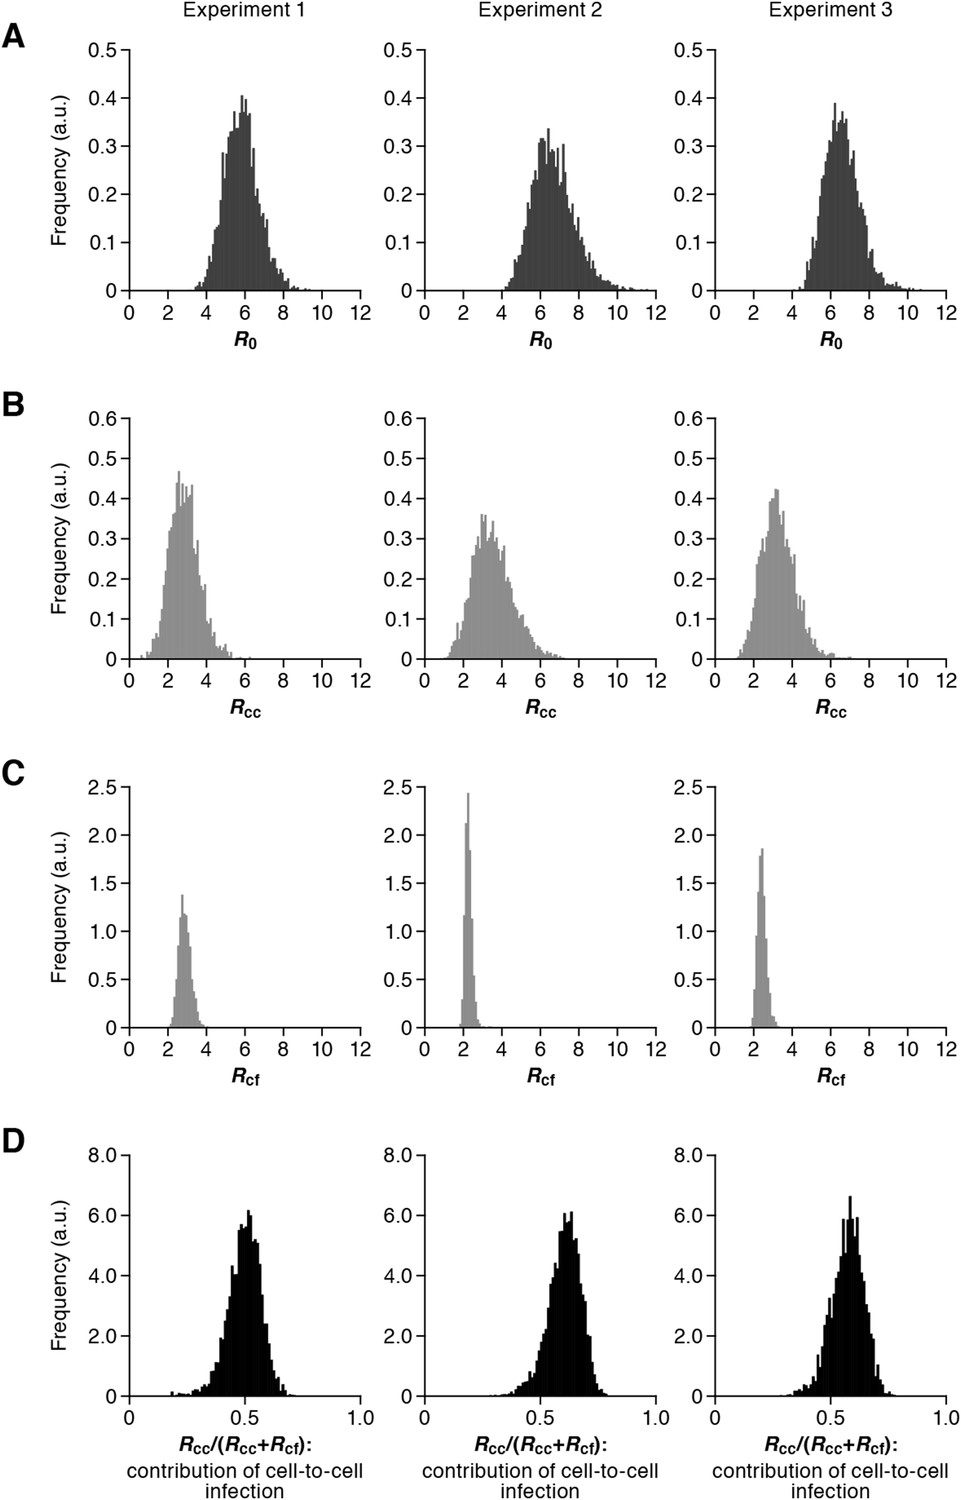
Distribution of the basic reproduction numbers, generation time, and Malthus coefficient.
The distribution of the basic reproduction number, R0, the number of secondary infected cells through the cell-free infection, Rcf, and the cell-to-cell infection, Rcc, calculated from all accepted Markov Chain Monte Carlo (MCMC) parameter estimates are shown in A, B, and C, respectively. The contribution of the cell-to-cell infection (i.e., Rcc/(Rcf + Rcc)) is distributed as in D. For each plot, the last 15,000 MCMC samples among the total 50,000 samples are used. a.u., arbitrary unit.
Figure 4
Simulating cell-to-cell infection of HIV-1.
Using our estimated parameters, the pure cell-to-cell infection is simulated in silico (solid curves). The simulated values are located between the time course of experimental data under the static conditions (closed circles) and those under the shaking conditions (open circles). The shadowed regions correspond to 95% posterior predictive intervals.
Author response image 1
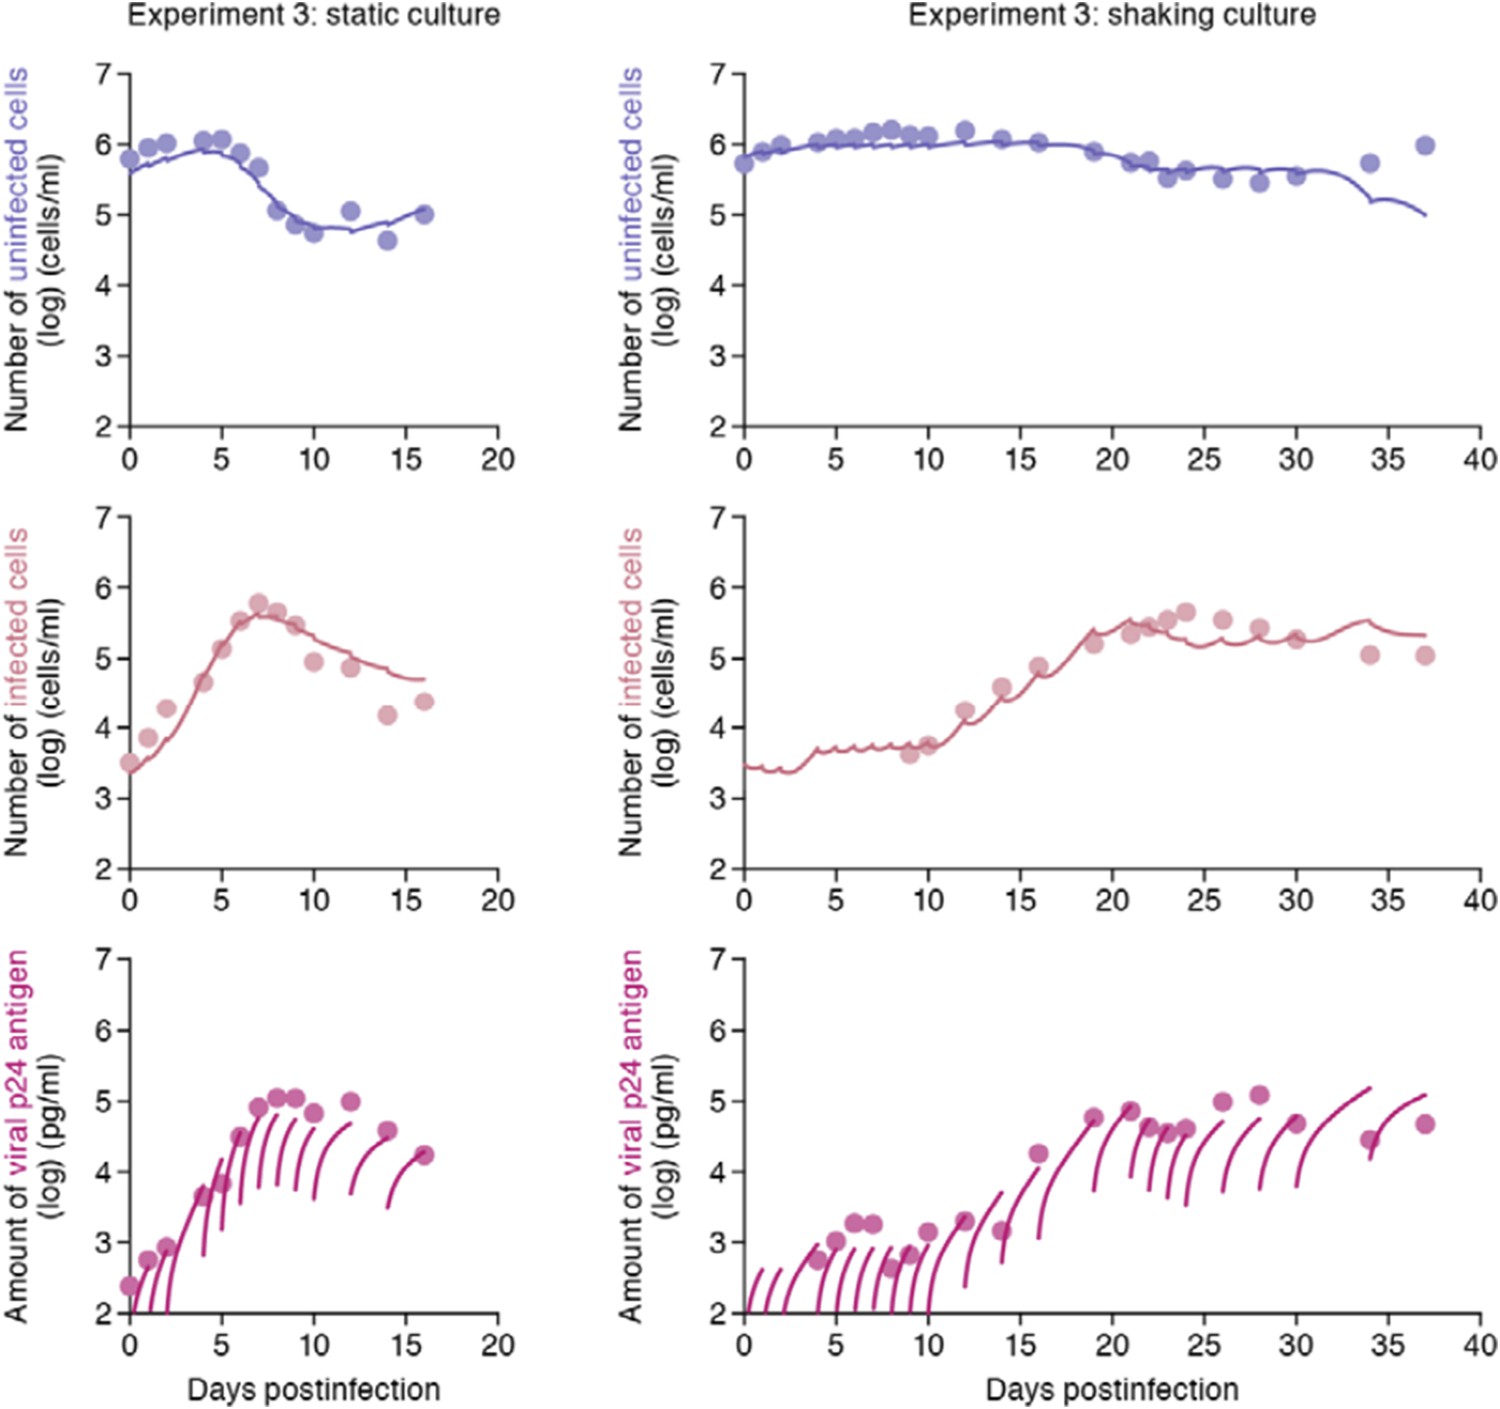
Punctual model for parameter estimation.
The time course of experimental data for the numbers of uninfected cells (top) and infected cells (middle), and the amount of viral p24 antigen (bottom) in the static (left) and shaking (right) culture systems, respectively. The solid curves depict the best fit of the punctual model to the time-course dataset. All data in the experiment 3 were fitted simultaneously. For the experiments 1 and 2, we obtained similar fitting and parameter estimation values (data not shown).
Tables
Table 1
Parameters estimated by mathematical-experimental analysis
| Parameter name | Symbol | Unit | Exp. 1 | Exp. 2 | Exp. 3 | Ave. ± S.D. |
|---|---|---|---|---|---|---|
| Parameters obtained from simultaneous fit to time-course experimental dataset | ||||||
| Rate constant for cell-free infection | β | 10−6 × (p24 day)−1 | 5.59* (3.54–8.41)† | 3.27 (2.05–5.01) | ‡3.70 (2.28–5.77) | 4.18 ± 1.41 |
| Rate constant for cell-to-cell infection | ω | 10−6 × (cell day)−1 | 0.88 (0.45–1.39) | 1.25 (0.70–1.97) | 1.13 (0.64–1.79) | 1.09 ± 0.33 |
| Production rate of total viral protein | p | day−1 | 0.37 (0.22–0.59) | 0.59 (0.34–0.92) | 0.54 (0.31–0.86) | 0.50 ± 0.16 |
| Death rate of infected cells | δ | day−1 | 0.45 (0.32–0.64) | 0.54 (0.38–0.75) | 0.50 (0.36–0.68) | 0.50 ± 0.10 |
| Quantities derived from fitted values | ||||||
| Basic reproduction number through cell-free infection | Rcf | – | 2.88 (2.34–3.53) | 2.27 (1.98–2.66) | 2.43 (2.04–2.95) | 2.44 ± 0.23 |
| Basic reproduction number through cell-to-cell infection | Rcc | – | 2.95 (1.48–4.70) | 3.65 (1.77–6.05) | 3.39 (1.82–5.38) | 3.39 ± 0.91 |
| Basic reproduction number | R0 | – | 5.83 (4.20–7.75) | 5.92 (3.99–8.46) | 5.83 (4.21–7.89) | 5.83 ± 0.94 |
| Contribution of cell-to-cell infection | – | 0.50 (0.34–0.63) | 0.60 (0.44–0.72) | 0.57 (0.43–0.70) | 0.57 ± 0.07 | |
-
*
Mean value.
-
†
95% confidence interval.
-
‡
Average and standard deviation of merged values in experiment 1, 2, and 3.
Table 2
Generation time and Malthus coefficient of virus infection
| Cell culture system | Exp. 1 | Exp. 2 | Exp. 3 | Ave. ± S.D. |
|---|---|---|---|---|
| Generation time of HIV-1 | ||||
| Static cell culture | 2.51* days | 2.08 days | 2.22 days | (2.22 ± 0.32)‡ days |
| (1.78–3.38) days | (1.54–2.78) days | (1.69–2.93) days | – | |
| Shaking cell culture | 2.73† days | 2.34 days | 2.47 days | (2.47 ± 0.32) days |
| (1.99–3.59) days | (1.77–3.06) days | (1.91–3.18) days | – | |
| Malthus coefficient of HIV-1 | ||||
| Static cell culture | 1.61 day−1 | 2.03 day−1 | 1.86 day−1 | (1.86 ± 0.37) day−1 |
| (1.10–2.27) day−1 | (1.32–3.01) day−1 | (1.26–2.72) day−1 | – | |
| Shaking cell culture | 0.57 day−1 | 0.46 day−11 | 0.49 day−1 | (0.49 ± 0.05) day−1 |
| (0.47–0.67) day−1 | (0.38–0.56) day−1 | (0.39–0.61) day−1 | – | |
-
*
Mean value.
-
†
95% confidence interval.
-
‡
Average and standard deviation of merged values in experiment 1, 2, and 3.
-
HIV-1, human immunodeficiency virus type 1.
Additional files
-
Supplementary file 1
Technical details of MCMC computations.
- https://doi.org/10.7554/eLife.08150.012
-
Supplementary file 2
Estimated parameter values for Jurkat cell growth.
- https://doi.org/10.7554/eLife.08150.013
-
Supplementary file 3
Estimated initial values for HIV-1 infection.
- https://doi.org/10.7554/eLife.08150.014
Download links
A two-part list of links to download the article, or parts of the article, in various formats.
Downloads (link to download the article as PDF)
Open citations (links to open the citations from this article in various online reference manager services)
Cite this article (links to download the citations from this article in formats compatible with various reference manager tools)
Cell-to-cell infection by HIV contributes over half of virus infection
eLife 4:e08150.
https://doi.org/10.7554/eLife.08150


