A meta-analysis of threats to valid clinical inference in preclinical research of sunitinib
- McGill University, Canada
- Ottawa Hospital Research Institute, Canada
Figures
Figure 1 with 1 supplement

Descriptive analysis of (A) internal, construct, and (B) external validity design elements.
External validity scores were calculated for each malignancy type tested, according to the formula: number species used + number of models used; an extra point was assigned if a malignancy type tested more than one species and more than one model.
-
Figure 1—source data 1
(A) Coding details for IV and CV categories.
- https://doi.org/10.7554/eLife.08351.004
Figure 1—figure supplement 1
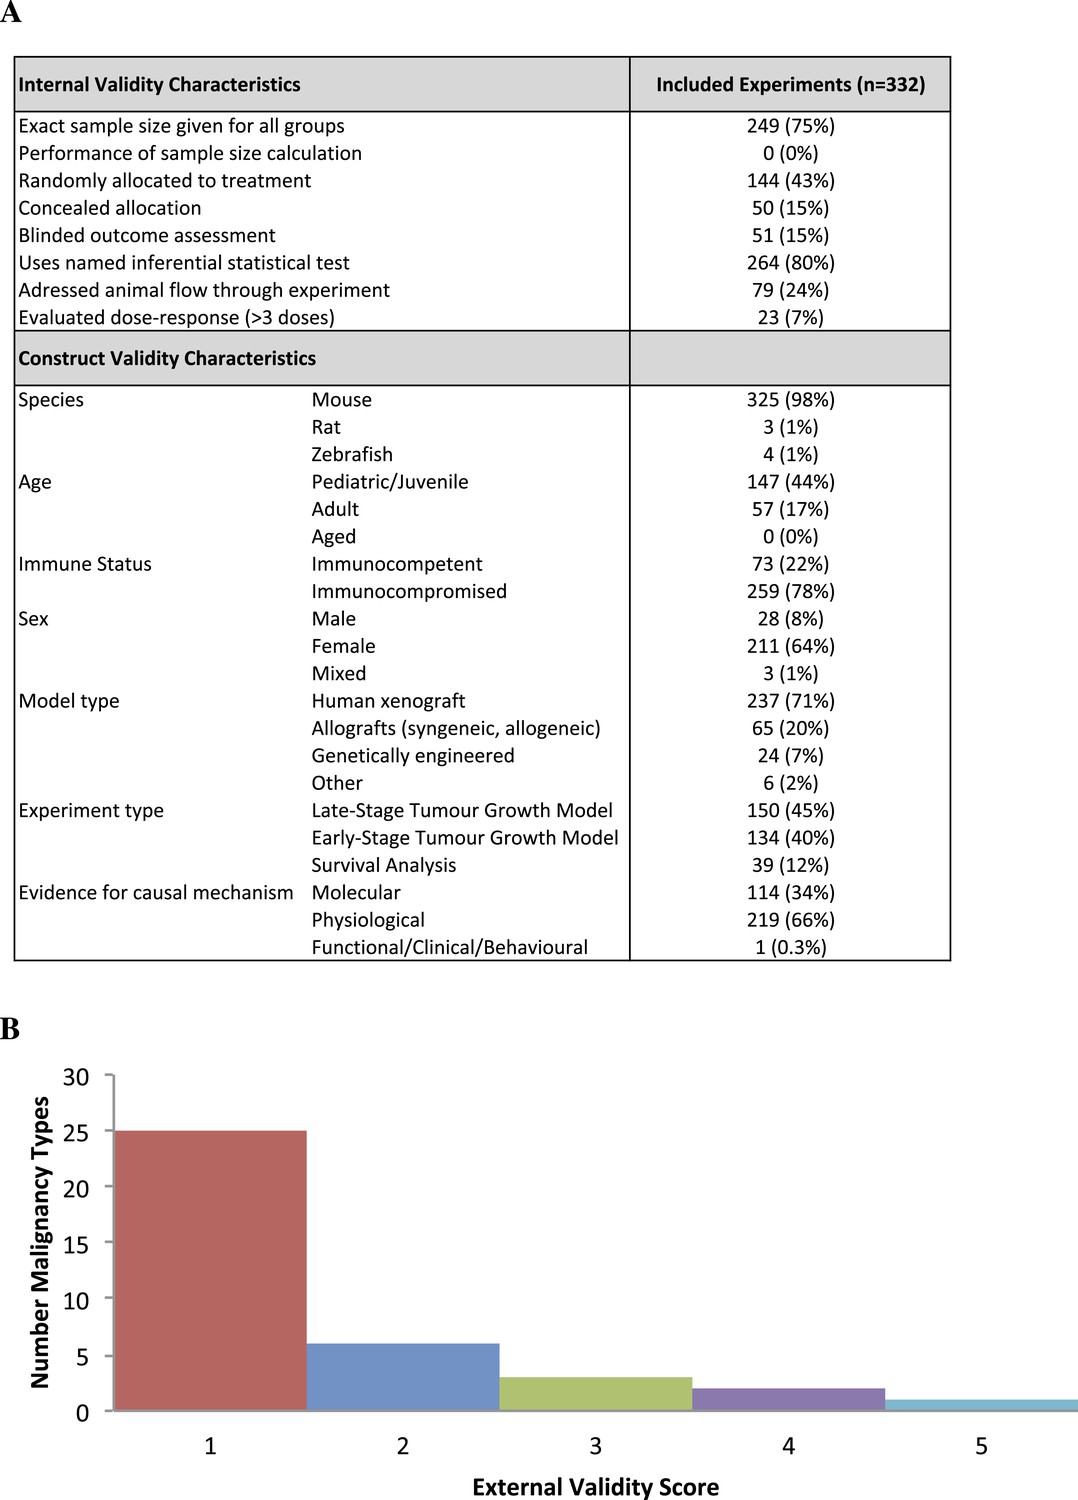
Descriptive analysis of (A) internal, construct, and (B) external validity design elements for all experiments (n = 332) extracted for validity data parameters.
https://doi.org/10.7554/eLife.08351.005
Figure 2 with 1 supplement
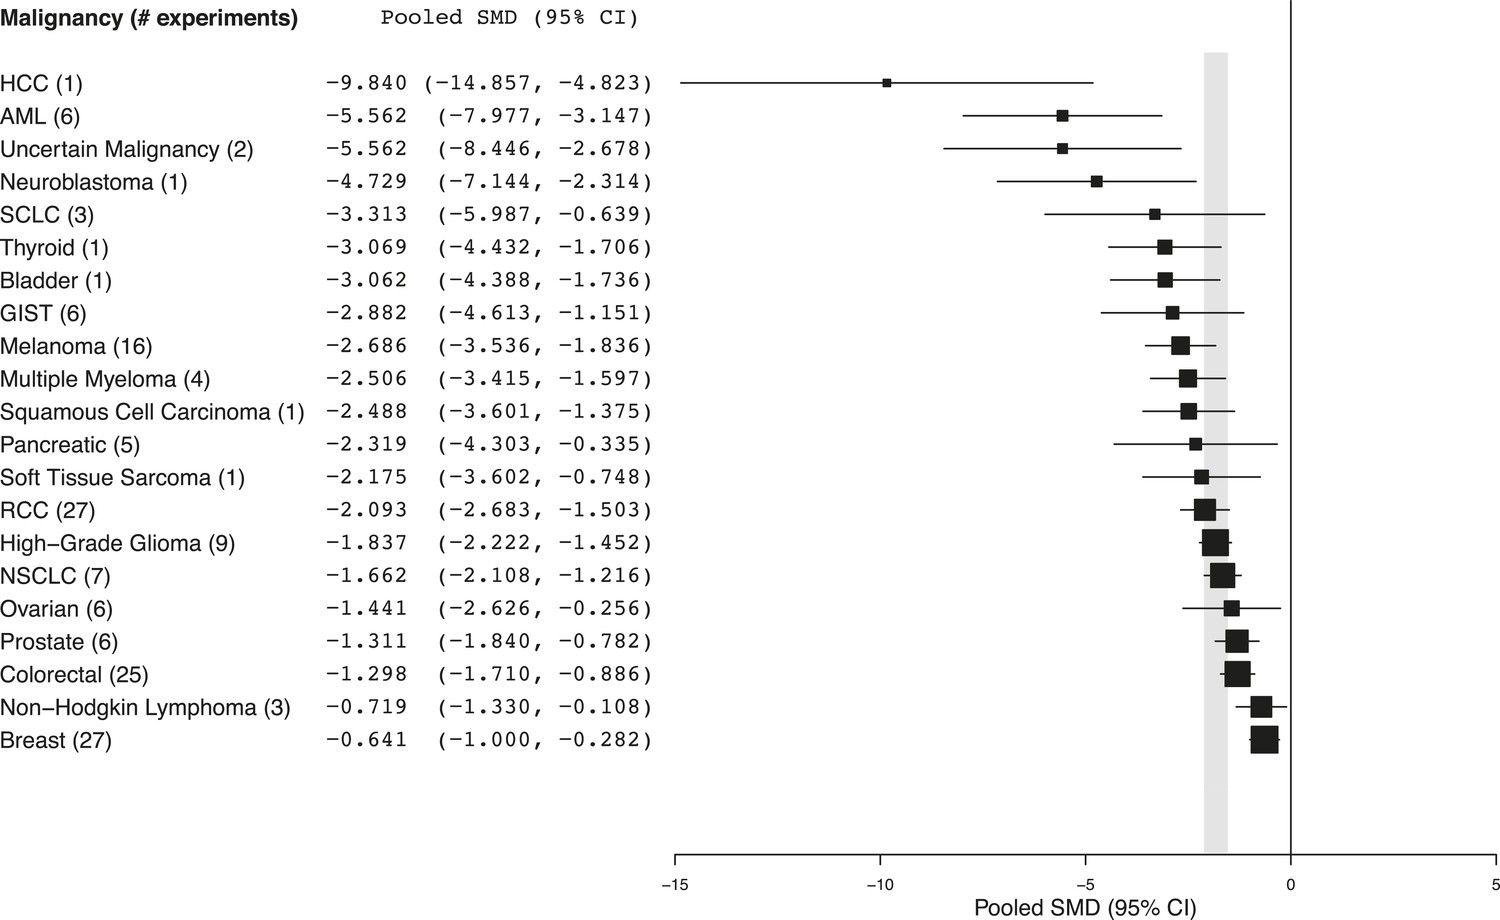
Summary of pooled SMDs for each malignancy type.
Shaded region denotes the pooled standardized mean difference (SMD) and 95% confidence interval (CI) (−1.8 [−2.1, −1.6]) for all experiments combined at the last common time point (LCT).
-
Figure 2—source data 1
(B) Heterogeneity statistics (I2) for each malignancy sub-group.
- https://doi.org/10.7554/eLife.08351.009
Figure 2—figure supplement 1
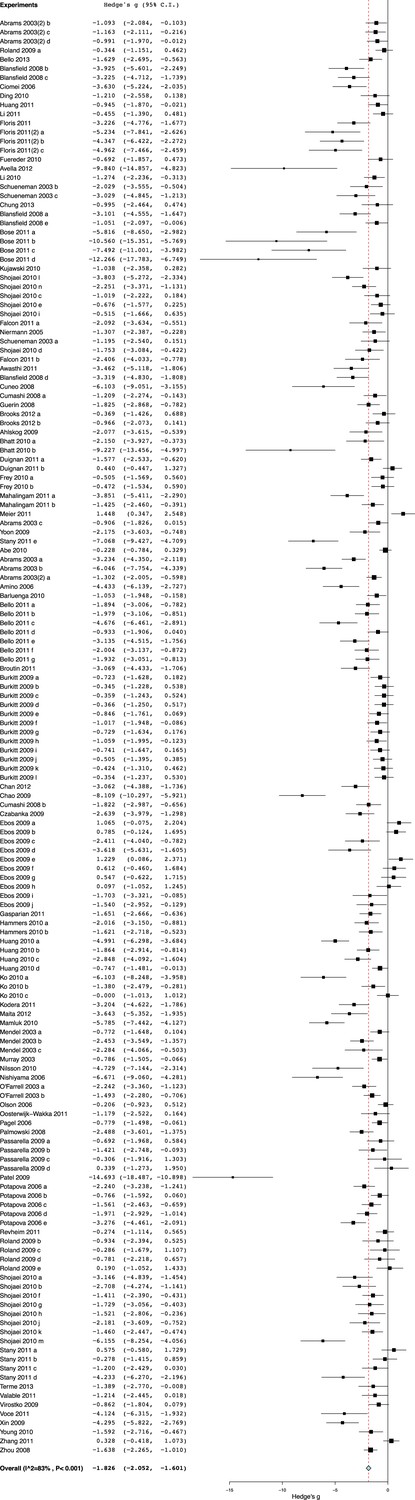
Effect sizes for all included experiments (n = 158).
https://doi.org/10.7554/eLife.08351.010
Figure 3
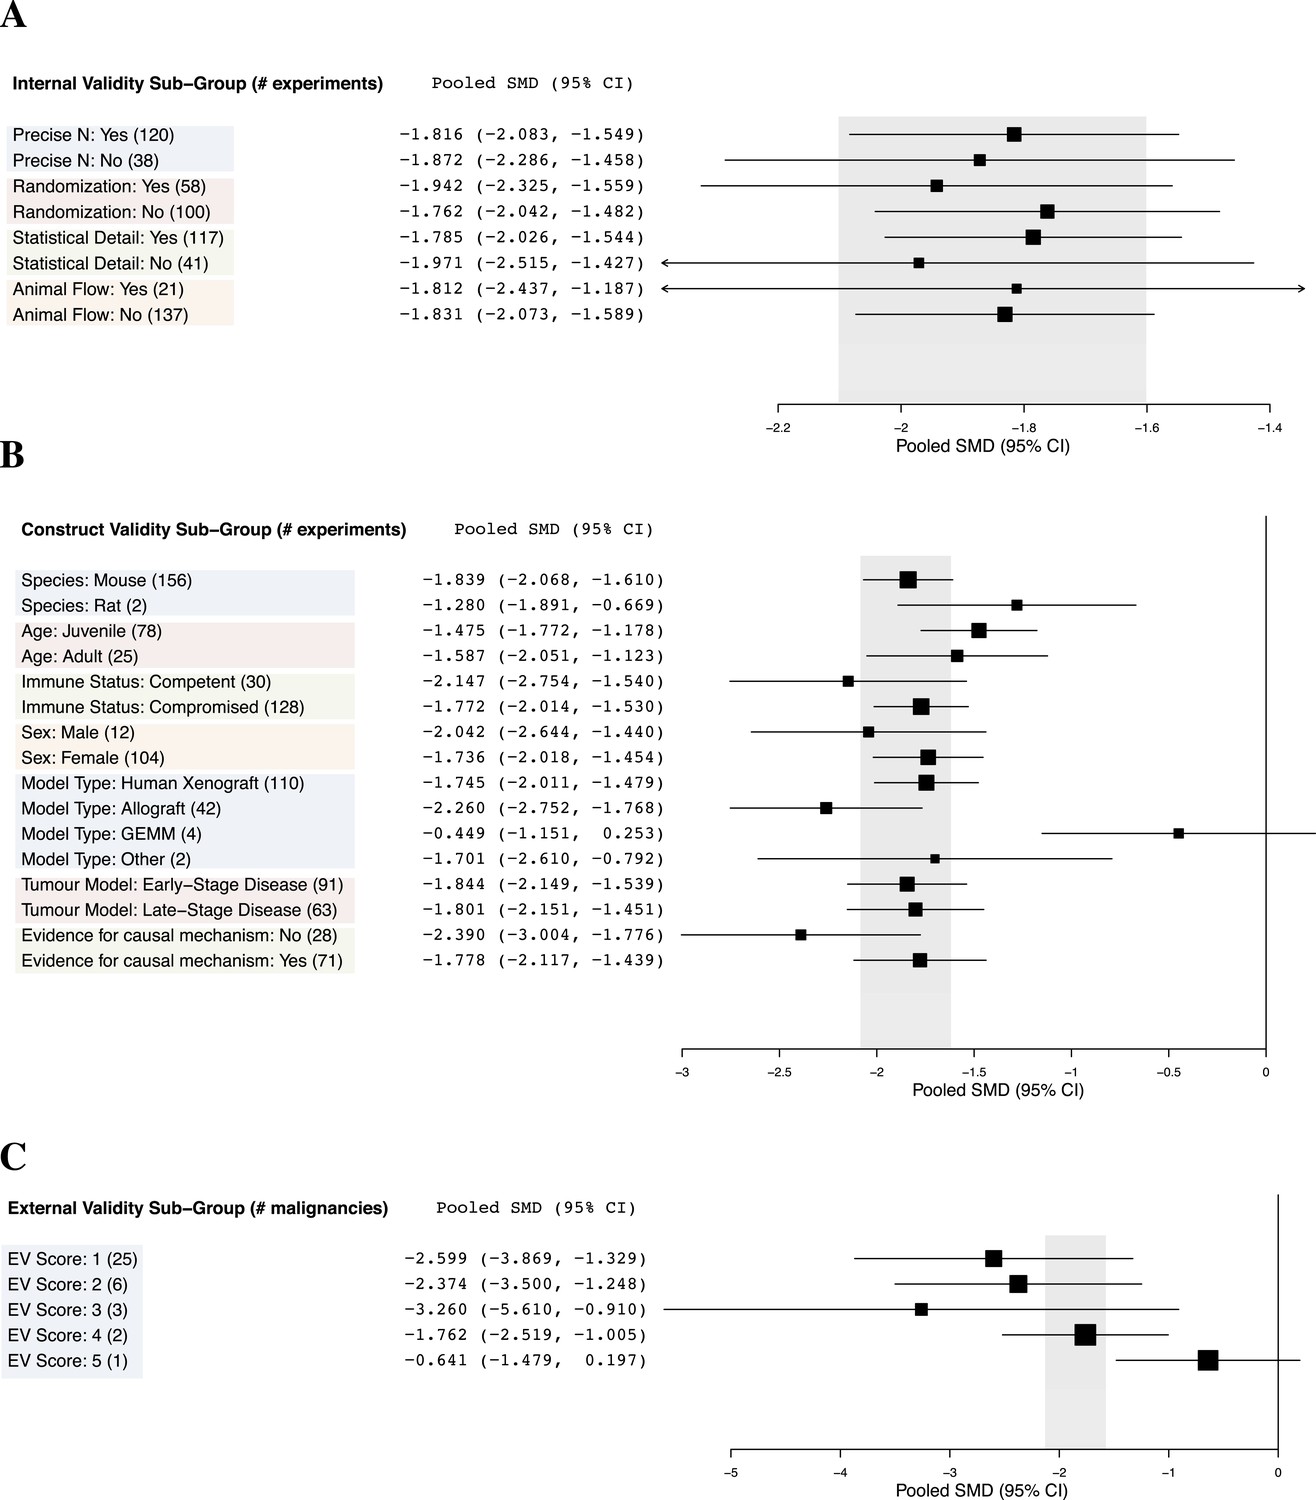
Relationship between study design elements and effect sizes.
The shaded region denotes the pooled SMD and 95% CI (−1.8 [−2.1, −1.6]) for all experiments combined at the LCT.
Figure 4
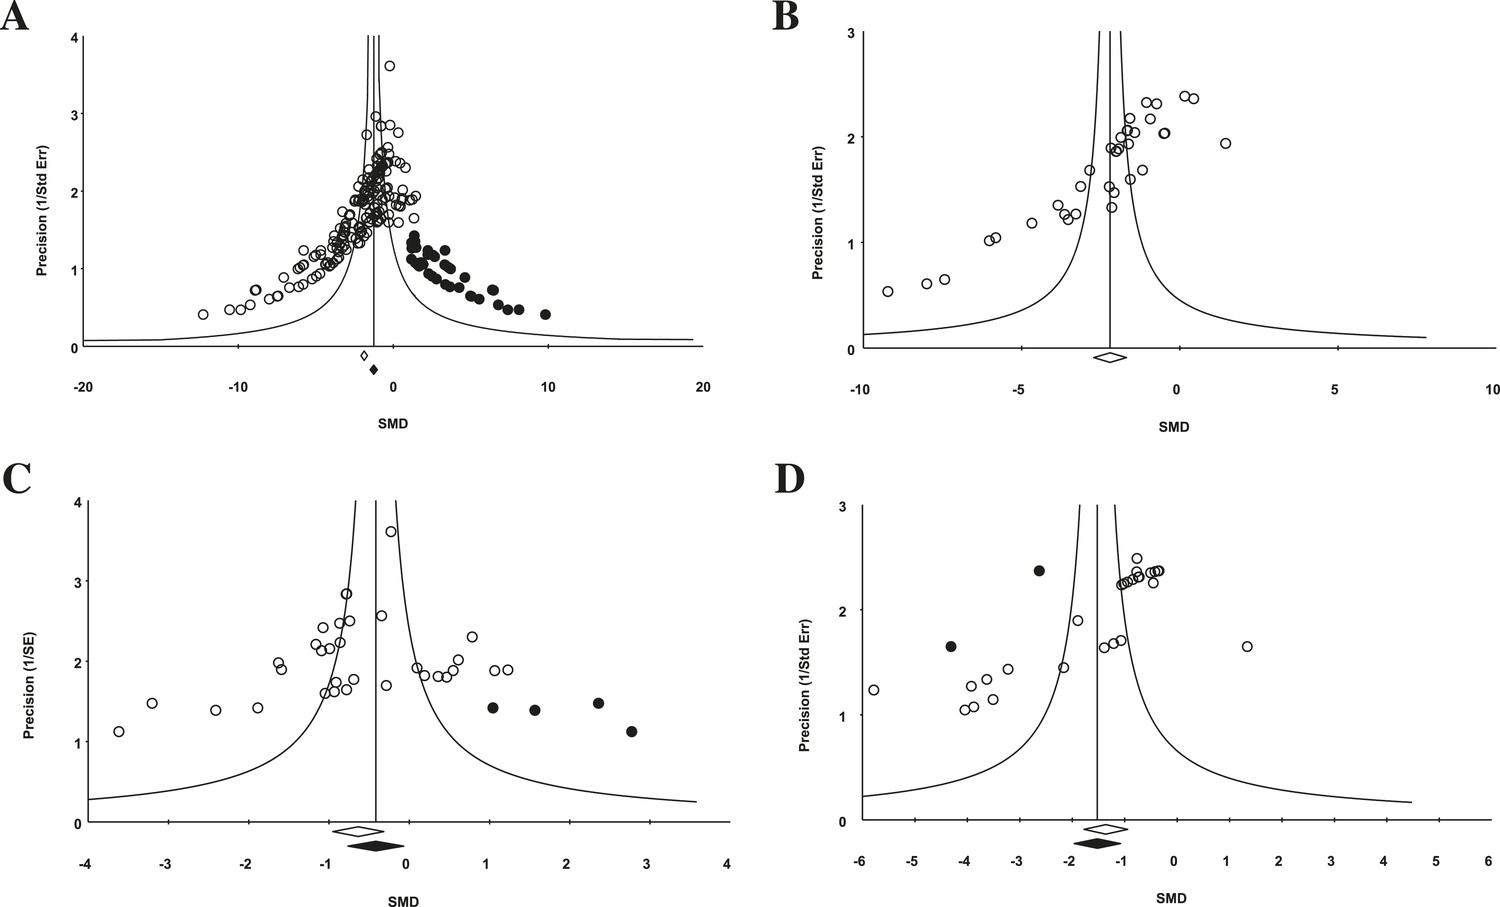
Funnel plot to detect publication bias.
Trim and fill analysis was performed on pooled malignancies, as well as the three malignancies with the greatest study volume. (A) All experiments for all malignancies (n = 182), (B) all experiments within renal cell carcinoma (RCC) (n = 35), (C) breast cancer (n = 32), and (D) colorectal cancer (n = 29). Time point was the LCT. Open circles denote original data points whereas black circles denote ‘filled’ experiments. Trim and fill did not produce an estimate in RCC; therefore, no overestimation of effect size could be found.
Figure 5
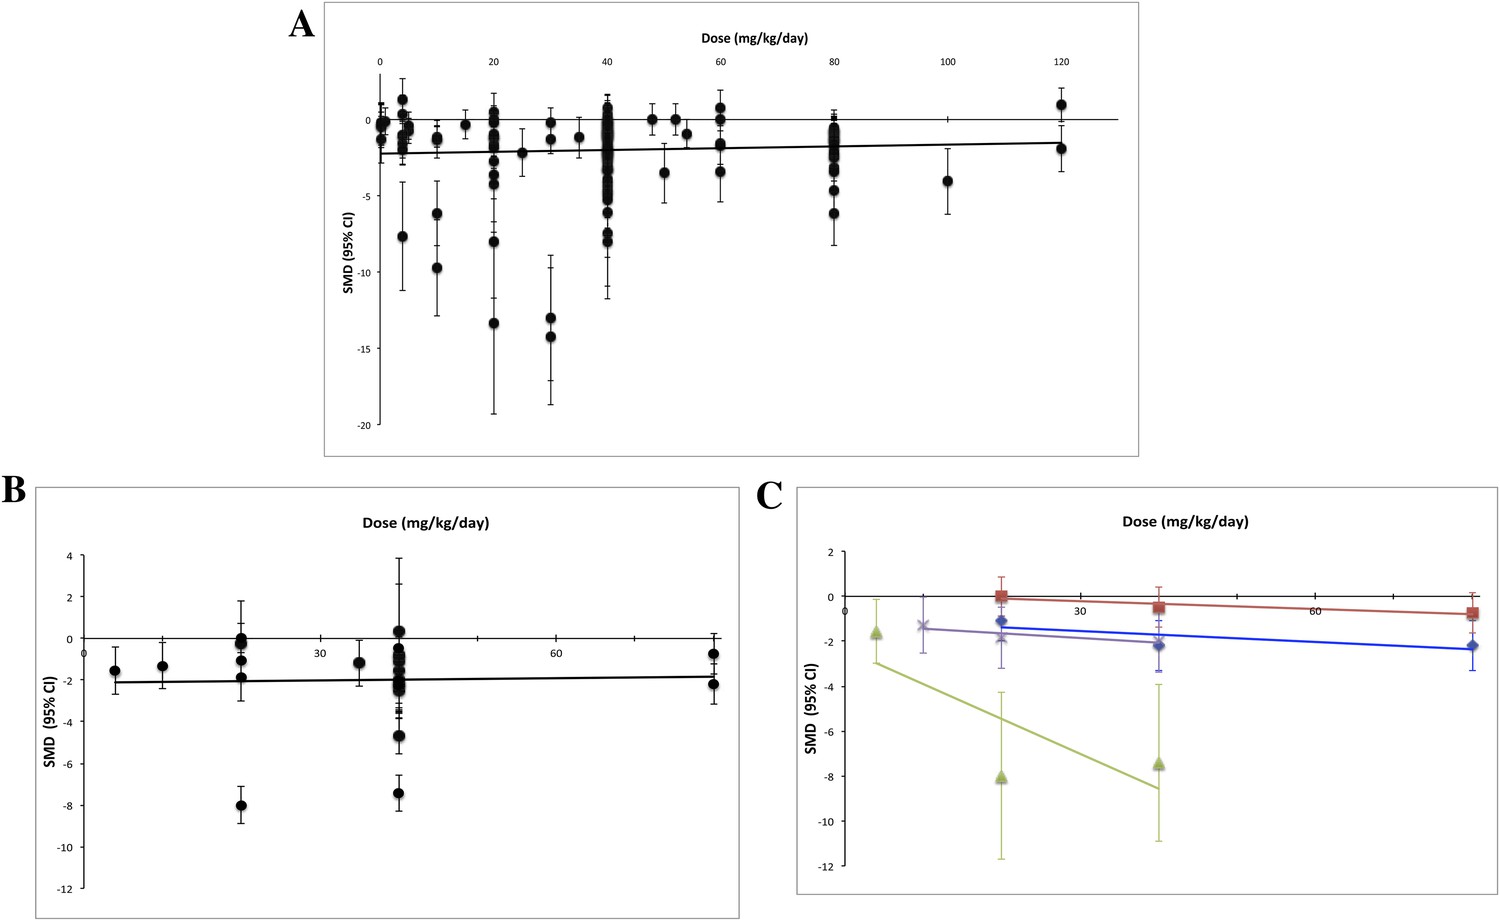
Dose–response curves for sunitinib preclinical studies.
Only experiments with a once daily (no breaks) administration schedule were included in both graphs. Effect size data were taken from a standardized time point (14 days after first sunitinib administration). (A) Experiments (n = 158) from all malignancies tested failed to show a dose–response relationship. (B) A dose–response relationship was not detected for RCC (n = 24). (C) Dose–response curves reported in individual studies within the RCC subset showed dose–response patterns (blue diamond = Huang 2010a [n = 3], red square = Huang 2010d [n = 3], green triangle = Ko 2010a [n = 3], purple X = Xin 2009 [n = 3]).
Tables
Table 1
Demographics of included studies
| Study level demographics | Included studies (n = 74) |
|---|---|
| Conflict of interest | |
| Declared | 19 (26%) |
| Funding statement* | |
| Private, for-profit | 44 (59%) |
| Private, not-for-profit | 35 (47%) |
| Public | 37 (50%) |
| Other | 2 (3%) |
| Recommended clinical testing | |
| Yes | 37 (50%) |
| Publication date | |
| 2003–2006 | 13 (18%) |
| 2007–2009 | 17 (23%) |
| 2010–2013 | 44 (59%) |
-
*
Does not sum to 100% as many studies declared more than one funding source.
-
Table 1—source data 1
(C) Search Strategies. (D) PRISMA Flow Diagram. (E) Demographics of included studies at qualitative level.
- https://doi.org/10.7554/eLife.08351.007
Download links
A two-part list of links to download the article, or parts of the article, in various formats.
Downloads (link to download the article as PDF)
Open citations (links to open the citations from this article in various online reference manager services)
Cite this article (links to download the citations from this article in formats compatible with various reference manager tools)
A meta-analysis of threats to valid clinical inference in preclinical research of sunitinib
eLife 4:e08351.
https://doi.org/10.7554/eLife.08351


