Single-molecule imaging of telomerase reverse transcriptase in human telomerase holoenzyme and minimal RNP complexes
- University of California, Berkeley, United States
Figures
Figure 1 with 1 supplement
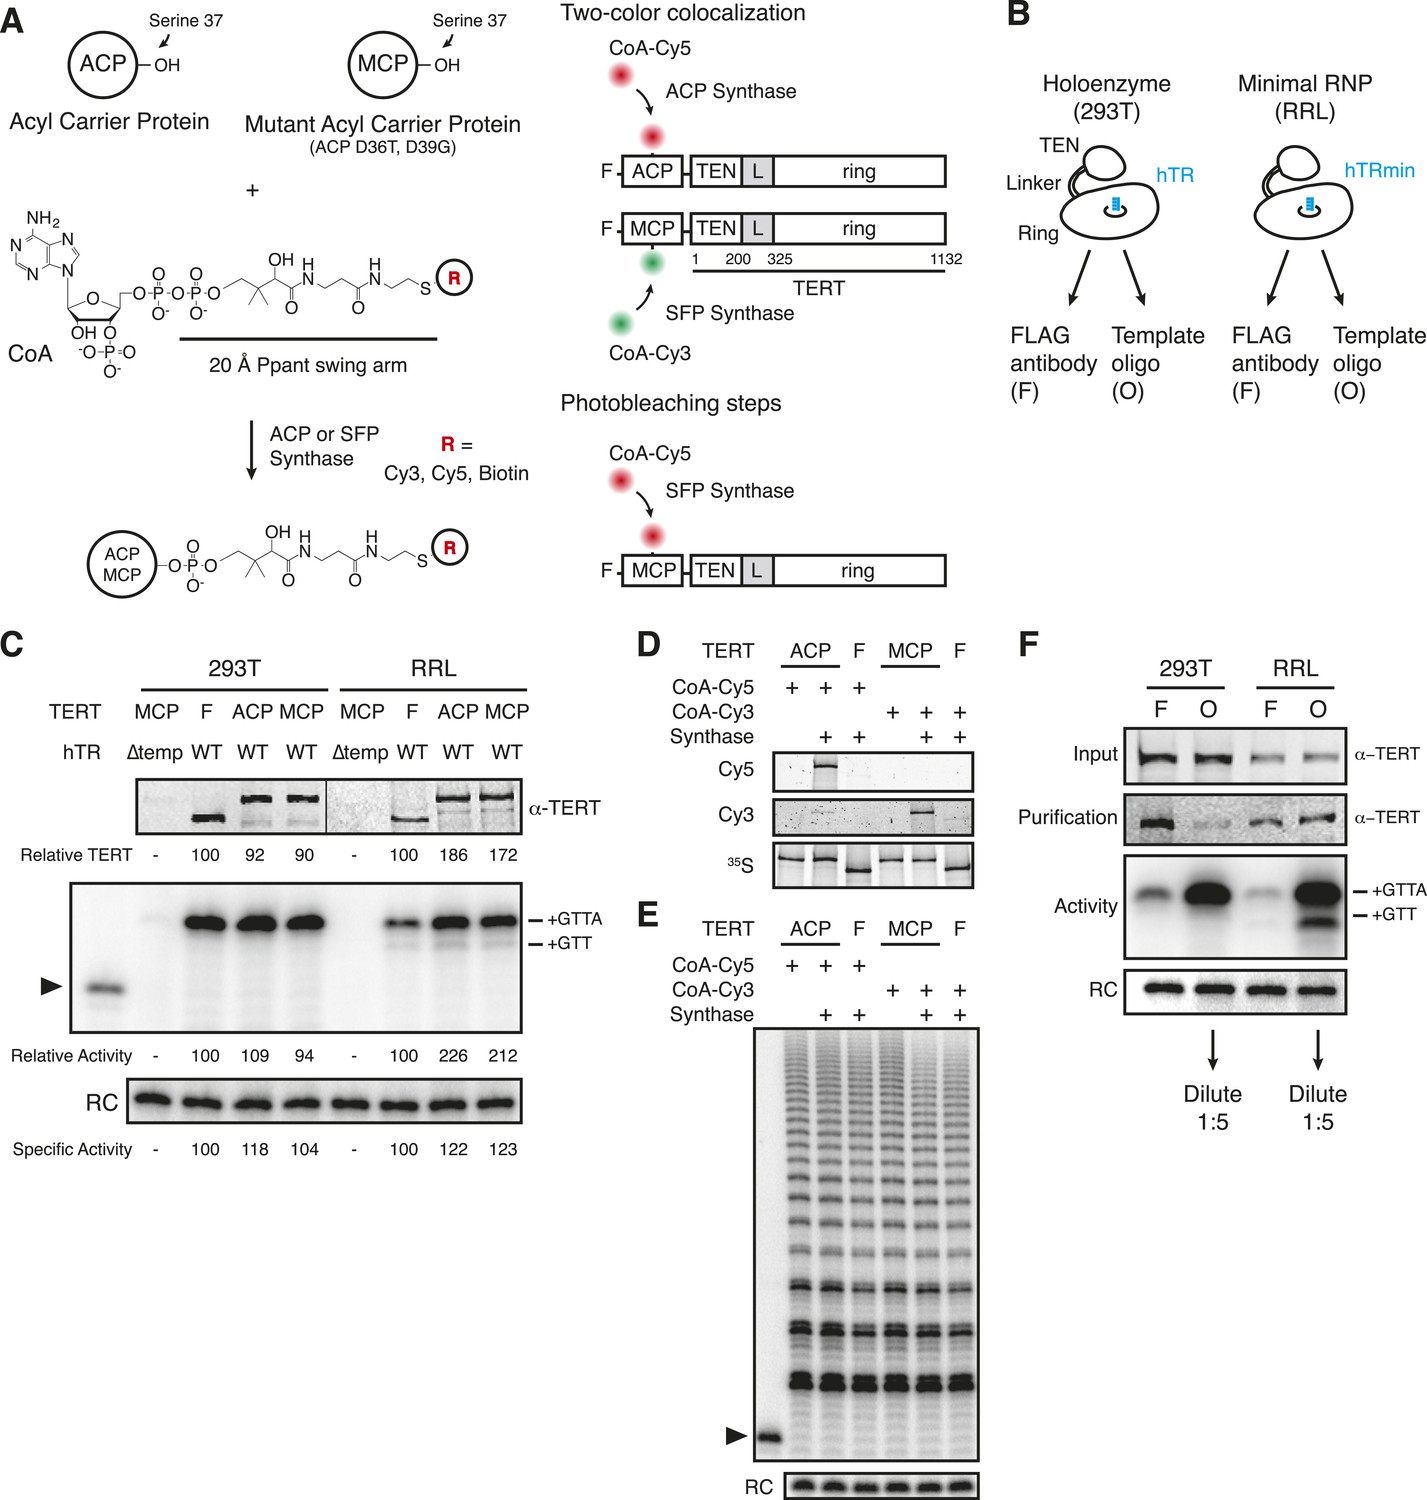
Reconstitution, purification, and labeling of human TERT.
(A) Left: derivatized CoA Ppant prosthetic group transfer to acyl carrier protein (ACP) or MCP tag by ACP or SFP synthase. The MCP tag is a modified version of the ACP tag, containing two amino acid substitutions, D36T and D39G. CoA can be modified with dye or biotin groups (R) for enzymatic labeling of a fusion protein. Right: schematic of two ACP- and/or MCP-telomerase reverse transcriptase (TERT)-labeling strategies using Cy5 (red) and Cy3 (green). An ACP or MCP tag is N-terminal to the TERT TEN domain, which is connected to the TERT ring by a linker region (L). Numbering refers to the full-length TERT amino acid sequence. A 3xFLAG tag is N-terminal to the ACP or MCP tag. (B) Schematic of telomerase holoenzyme reconstitution by overexpression of TERT with full-length hTR in cells (293T) or minimal ribonucleoprotein (RNP) reconstitution by TERT expression with hTRmin in vitro (rabbit reticulocyte lysate [RRL]) followed by FLAG antibody purification for the TEN tag (FLAG antibody purification, F) or purification using a 2′OMe RNA oligonucleotide complementary to the hTR template (Template oligo purification, O). Only the template of hTR or hTRmin is illustrated (blue). (C) TERT and telomerase activity measured for O-purified, eluted complexes. Various N-terminally tagged TERT proteins were detected by TERT antibody immunoblot. The hTR ∆temp reconstitutions used template-less hTR or hTRmin with a 5′ end at hTR position 64. Elution fractions were assayed for telomerase activity by primer extension with dTTP, ddATP, and α-32P dGTP, followed by denaturing gel electrophoresis. End-radiolabeled oligonucleotide was added prior to product precipitation to serve as a recovery control (RC), here and in subsequent panels. End-radiolabeled primer is a size marker (▶), here and in subsequent panels. Specific activity in this panel indicates product DNA normalized to amount of TERT. (D) SDS-PAGE analysis of RRL-expressed TERT in telomerase reconstitutions of ACP-, MCP-, or only F-TERT in the presence of hTRmin, labeled with 35S-methionine and any additional label as indicated. ACP synthase was used for ACP-TERT dye labeling and SFP synthase was used for MCP-TERT dye labeling. (E) Activity of telomerase reconstituted with ACP-, MCP-, or F-TERT in RRL with hTRmin and labeled as indicated. Activity was detected in reactions containing dATP, dGTP, dTTP, and α-32P dGTP, followed by denaturing gel electrophoresis. (F) TERT content and telomerase activity in bulk purifications of MCP-TERT reconstituted in 293T cells or RRL, assayed as described in (C). TERT immunoblot with input extracts used 3% of the total purification input. Half of the post-purification sample was used for activity assays and half for TERT immunoblot. For single-molecule detection, O-purifications were diluted relative to F-purifications from the same extract. The following figure supplement is available for Figure 1—figure supplement 1.
Figure 1—figure supplement 1
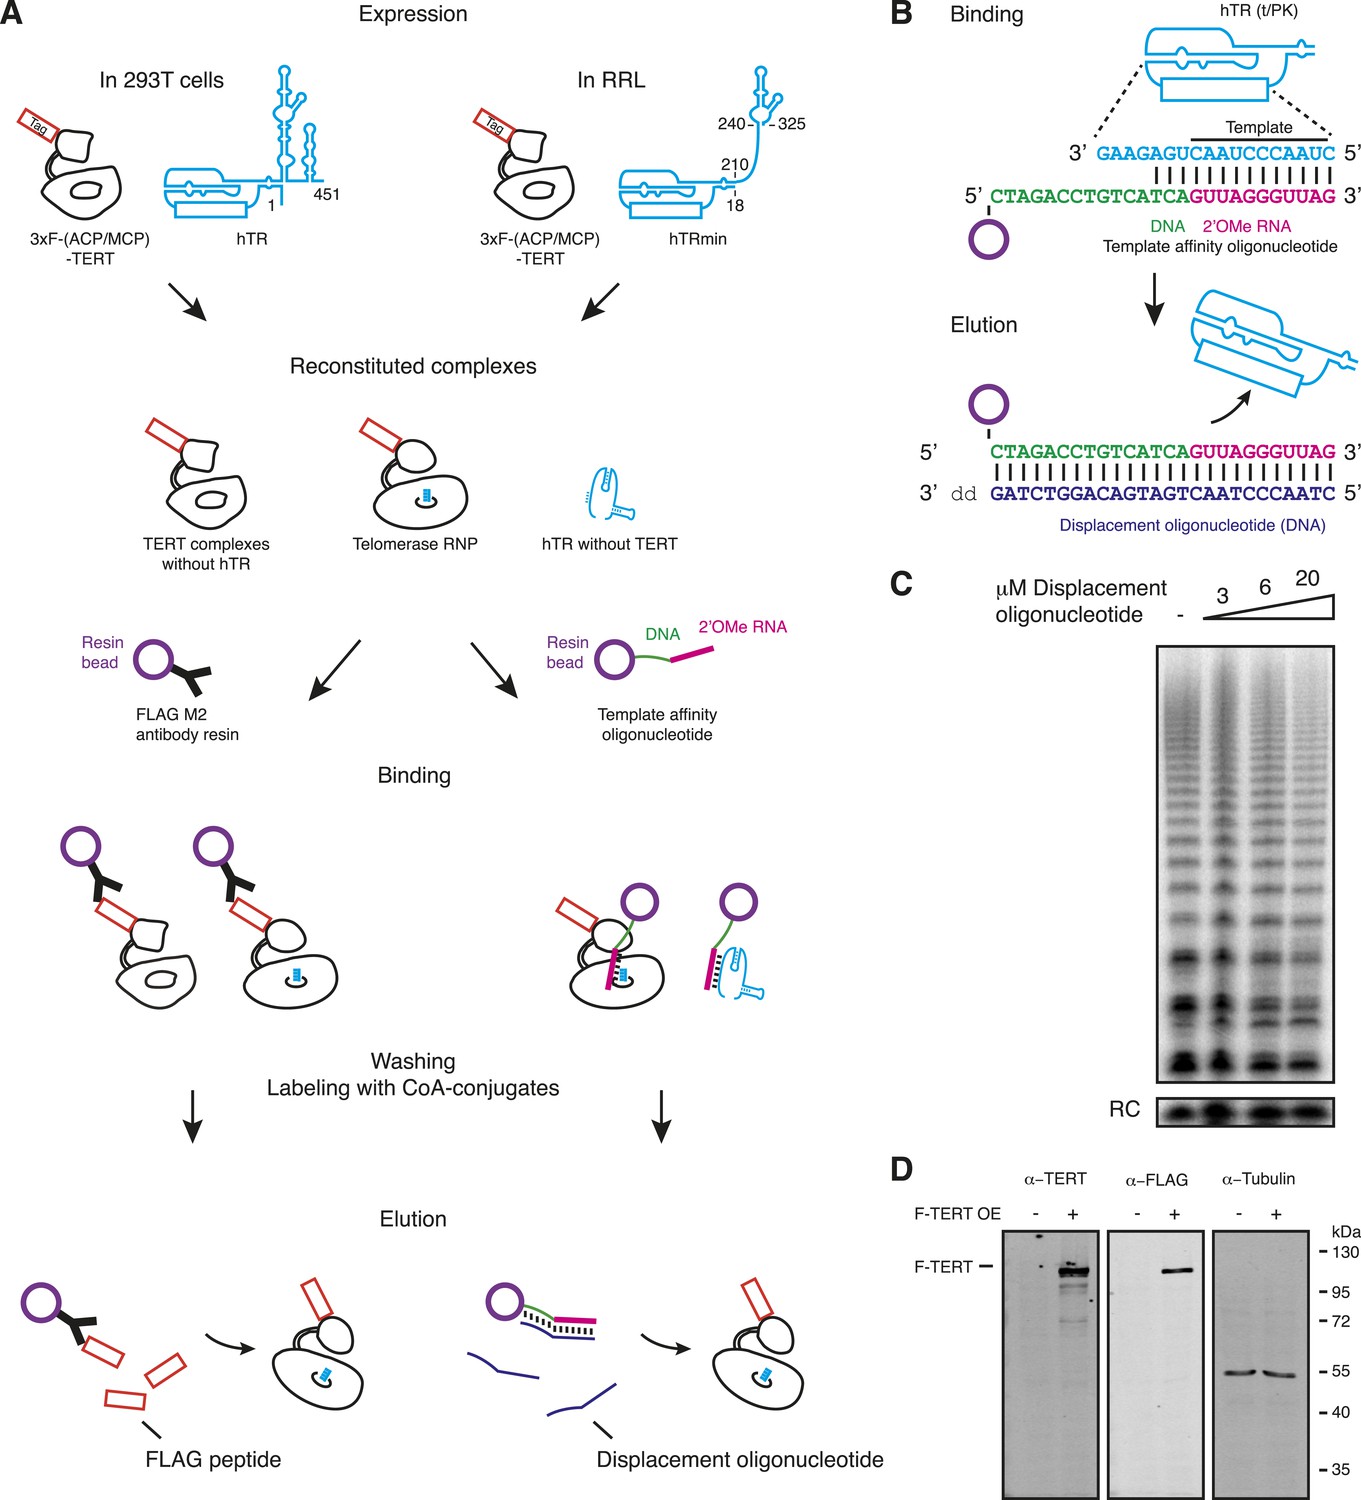
Methods of human telomerase reconstitution and purification.
(A) Telomerase reconstitutions in cells with full-length hTR or in RRL with hTRmin generate hTR-free TERT, TERT RNPs, and TERT-free hTR. These are differentially enriched by TERT-based vs template-based affinity purification. The template region is boxed as an overlay on RNA secondary structure overall (position numbering is from full-length hTR). Reconstituted complexes are schematized with only part of the RNA, and proteins other than TERT are not depicted. Telomerase RNP is shown with template in the active site. Relative elution of TERT RNP vs TERT-free hTR or hTR-free TERT was not determined. (B) Sequence of the template affinity oligonucleotide and displacement oligonucleotide used for RNA-based purification. Only the template/pseudoknot (t/PK) domain of hTR is illustrated; the template region primary sequence is shown maximally base-paired to the template affinity oligonucleotide. (C) Activity of RRL-reconstituted, F-purified TERT RNP with displacement oligonucleotide added directly to the activity assay reaction at the concentration indicated. (D) Detection of overexpressed (OE) 293T F-TERT in unpurified cell extract by immunoblot with TERT antibody or FLAG antibody. Cell extract lacking overexpressed TERT was used as the negative control, and detection of tubulin was used as a loading control.
Figure 2 with 1 supplement
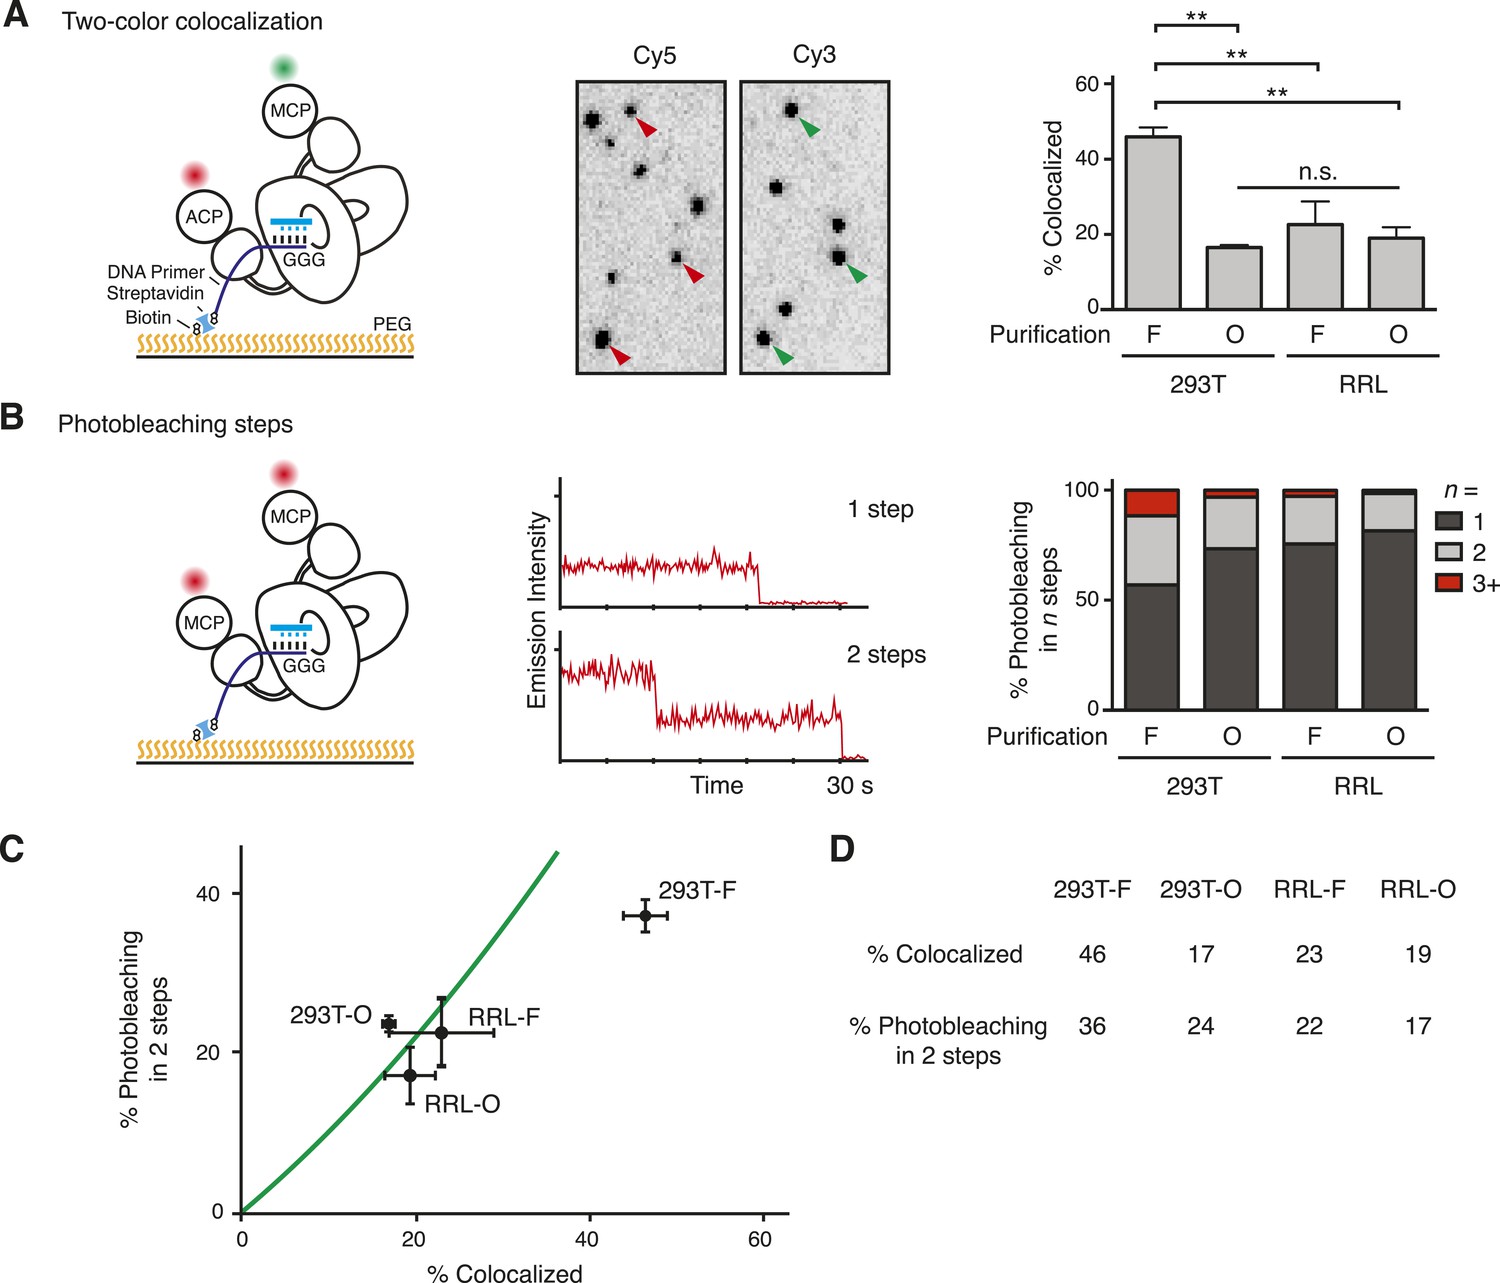
Single-molecule detection of the TERT subunit content in DNA-bound complexes.
(A) Left: schematic for detection of TERT content by two-color co-localization. ACP-TERT was labeled with Cy5 (red) and MCP-TERT was labeled with Cy3 (green). PEG indicates polyethylene glycol. Center: example of detection of two-color co-localization indicated by arrowheads, for a 293T-F sample. Right: percentage of two-color co-localization for DNA-bound complexes with co-expressed ACP- and MCP-TERTs, purified by the TERT tag (F) or template-complementary 2′OMe RNA oligonucleotide (O). For this and subsequent quantifications, values are averaged from three assays using experimentally independent replicates with standard error of the mean shown. **p < 0.01 using one-way ANOVA, followed by Tukey's multiple comparison test; n.s. is not significant. (B) Left: schematic for detection of TERT content by steps of photobleaching. MCP-TERT was labeled with Cy5 (red). Center: examples of photobleaching in one or two steps. Right: percentage of MCP-TERT DNA-bound complexes labeled with Cy5 that photobleached in one, two and three, or more (3+) steps. Values are the average of triplicate experimental replicates. (C) The predicted relationship between detections of TERT subunit co-localization and two-step photobleaching is shown as the green line (see Materials and methods, Equation 3). Data were plotted according to measured co-localization and photobleaching in two steps only. Error bars represent standard error of the mean from triplicate experimental replicates of each measured parameter. (D) Measured two-color co-localization and two-step photobleaching as determined by the experiments in (A) and (B), respectively. The following figure supplement is available for Figure 2—figure supplement 1.
Figure 2—figure supplement 1
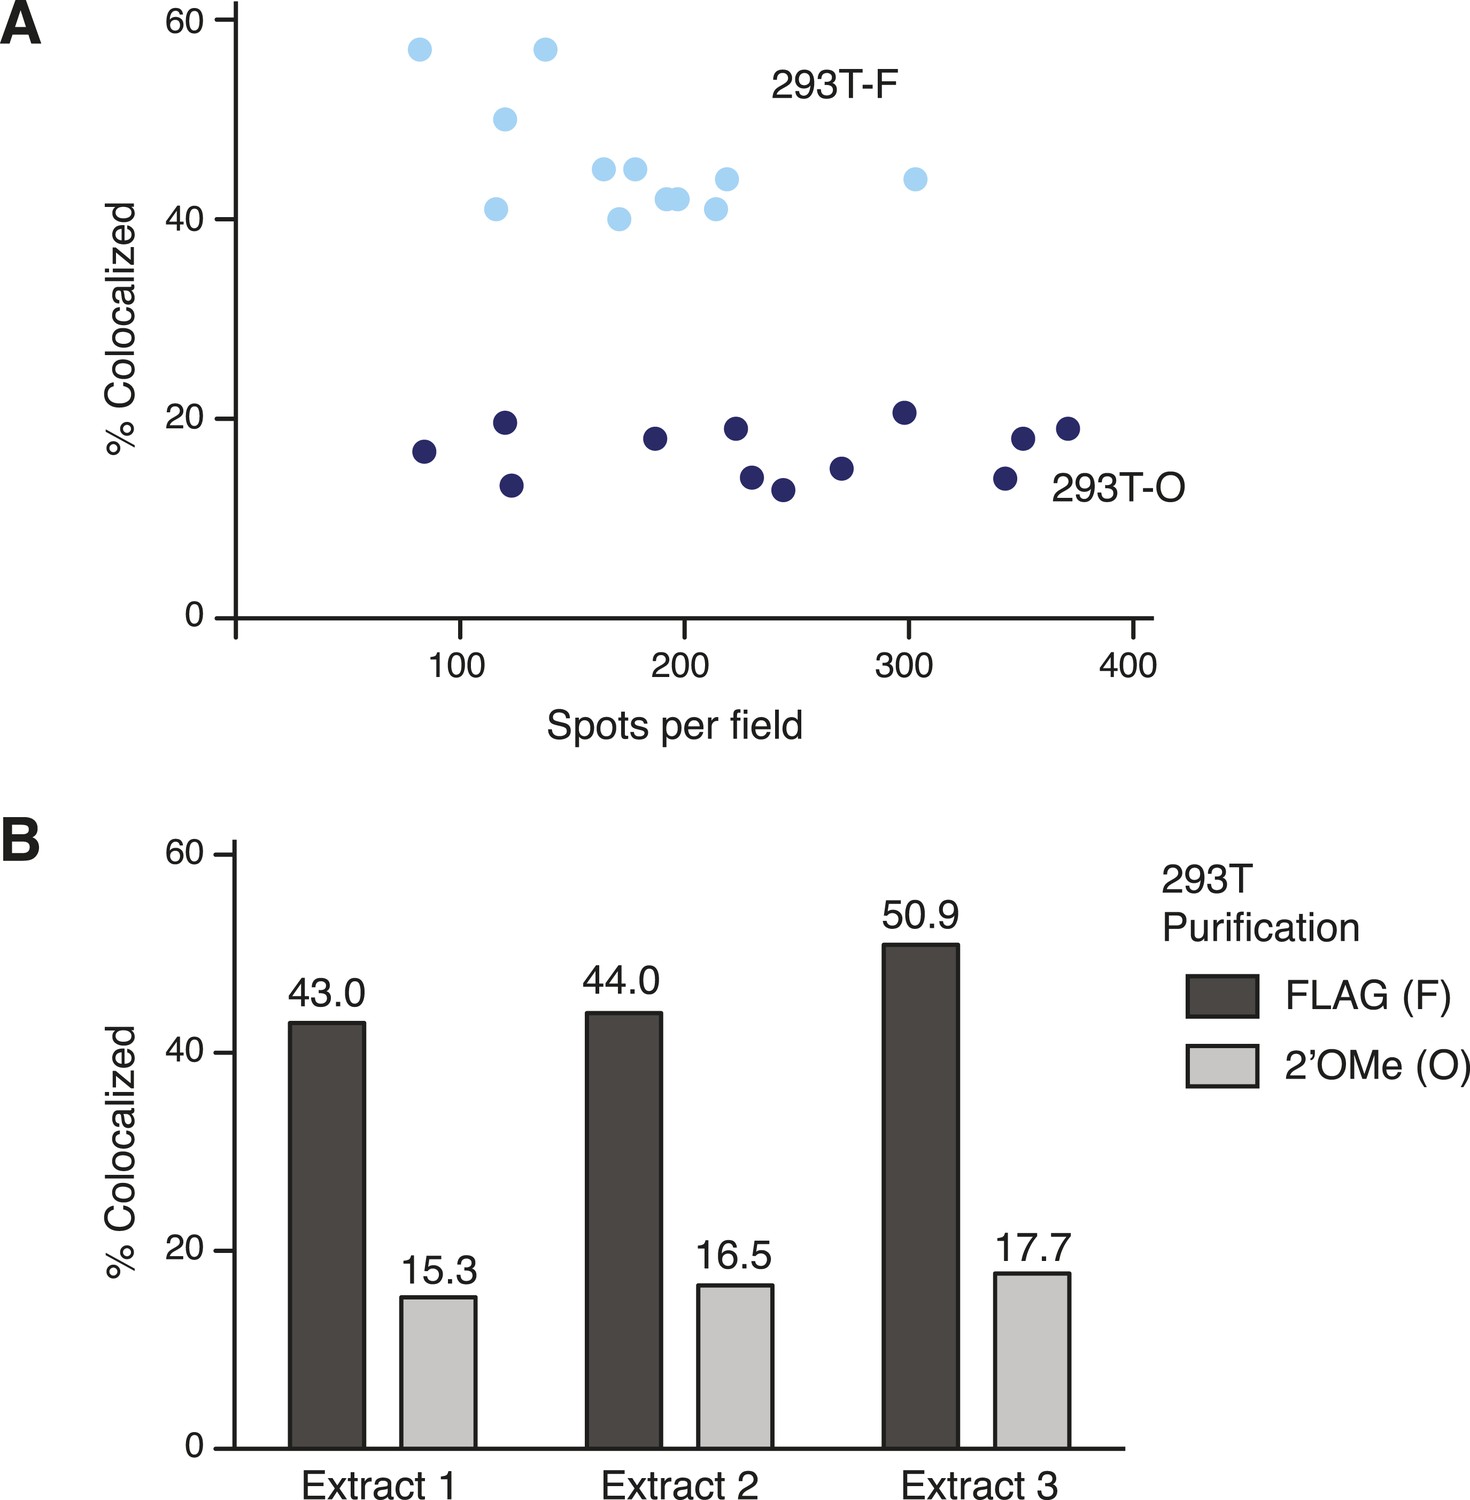
Technical robustness of the two-color co-localization assay for TERT subunit content.
Quantification of two-color co-localization for DNA-bound 293T-F and 293T-O TERT complexes was consistent across different spot densities per field (A) and using cell extracts from independent transfections of 293T cells (B). In (A), light blue dots are 293T-F quantification and dark blue dots are 293T-O quantifications from imaging multiple (≥8) fields for each of triplicate experimental replicates. In (B), averages are from multiple (≥8) fields counted for each sample.
Figure 3
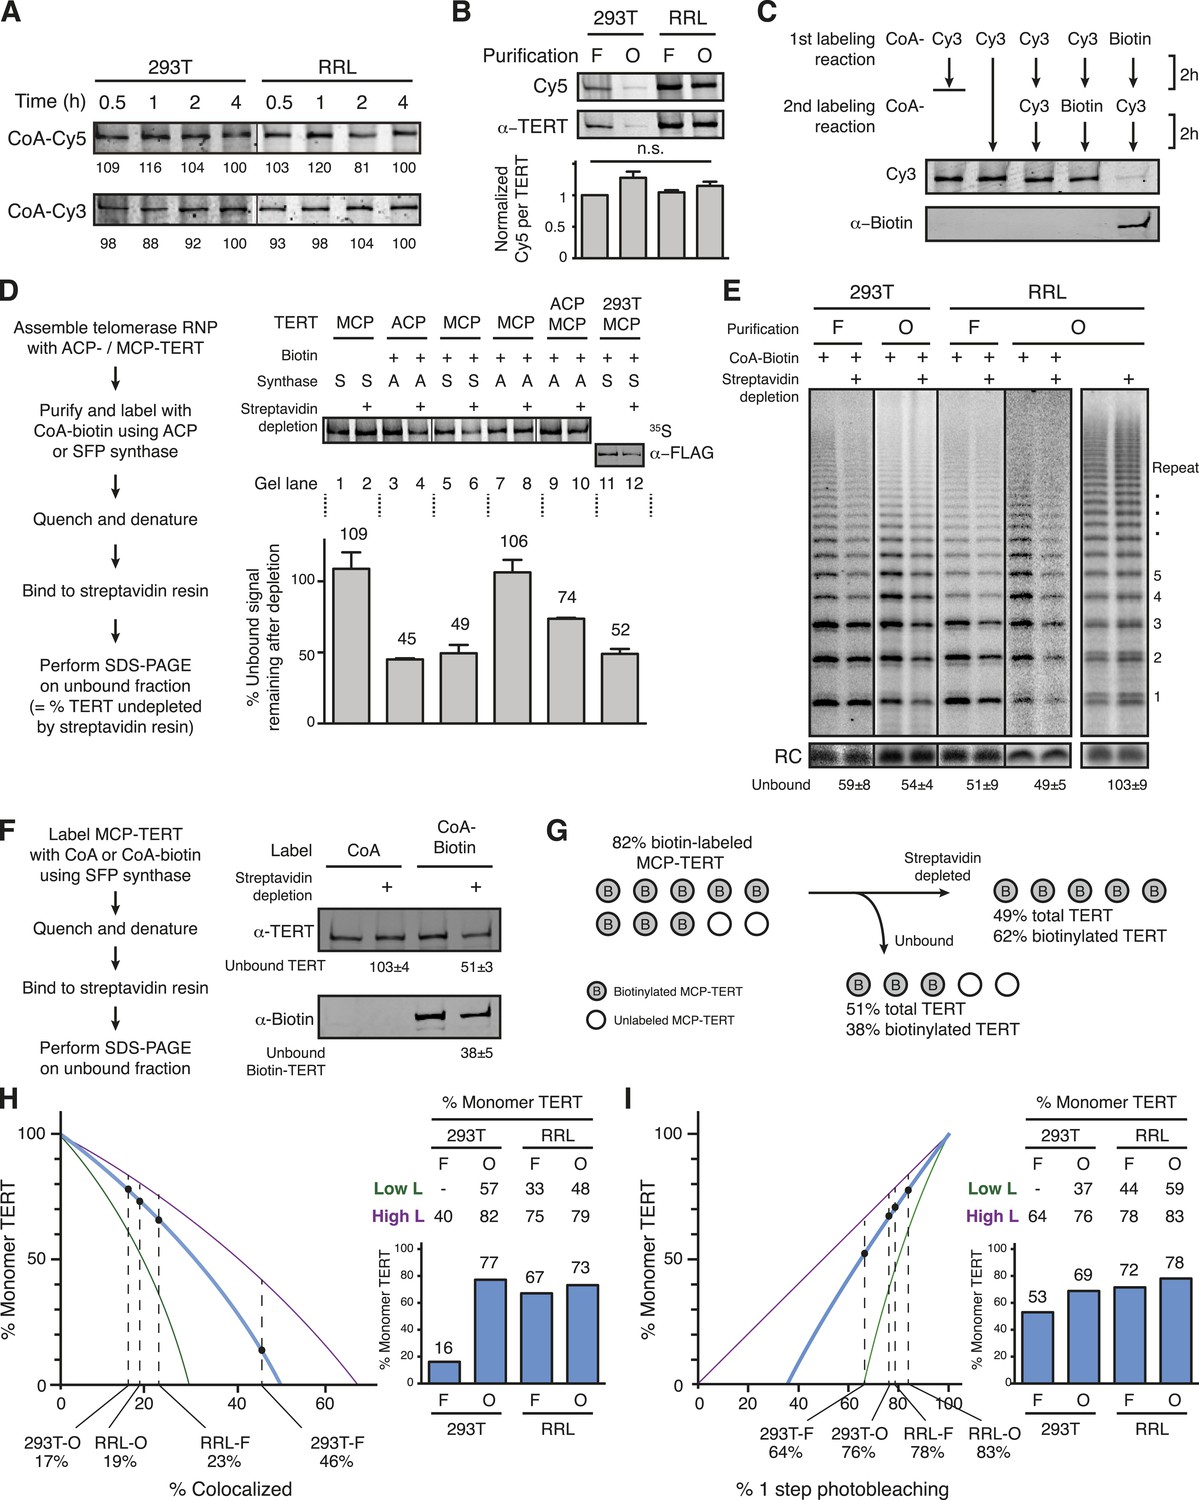
Quantification of the TERT monomer vs multimer content in purified samples based on TERT-labeling efficiency.
(A) SDS-PAGE analysis of the kinetics of labeling F-purified 293T- or RRL-reconstituted MCP-TERT in reactions with CoA-Cy5 or CoA-Cy3 and SFP synthase. Lines within the panel indicate separate sets of gel lanes. Quantification of labeling intensity was normalized to labeling at the 4-hr time point after subtraction of background. (B) Cy5 labeling relative to TERT amount analyzed for telomerase reconstituted and purified as indicated. TERT was detected by TERT immunoblot. Values are the average of triplicate experimental replicates. (C) Validation of equivalent labeling using CoA-dye or CoA-biotin by sequential labeling of F-purified, RRL-expressed MCP-TERT with SFP synthase. Initial TERT labeling using CoA-Cy3 or CoA-biotin competes for subsequent TERT labeling by the other CoA derivative. The biotin label on MCP-TERT was detected by biotin antibody immunoblot. (D) Left: schematic of the biotinylated TERT depletion procedure. Right: quantification of ACP- and/or MCP-TERT remaining after streptavidin agarose depletion, following reconstitution (RRL unless indicated otherwise), F-purification and labeling using CoA-biotin and ACP (A) or SFP (S) synthase. RRL-expressed TERT was 35S-methionine labeled and 293T-expressed TERT was detected by FLAG antibody immunoblot. Samples labeled in reactions lacking CoA-biotin (not Biotin +) were labeled with CoA and those not applied to streptavidin agarose (not Streptavidin depletion +) were mock-depleted on Myc antibody agarose. Lines within the panel indicate separate sets of gel lanes run in parallel. Percentage unbound was calculated as unbound signal normalized to unbound signal of the control depletion. Values are the average of triplicate experimental replicates. (E) Activity of the unbound fraction after streptavidin agarose depletion of biotinylated telomerase labeling using CoA-biotin and SFP synthase, under native binding conditions. Telomerase activity was assayed in reactions with dATP, dGTP, dTTP, and α-32P dGTP, followed by denaturing gel electrophoresis; number of 6-nucleotide repeats added to product DNA is indicated. Samples not depleted with streptavidin agarose were mock-depleted on Myc antibody agarose. Lines within the panel indicate separate sets of gel lanes run in parallel. Percentage unbound was normalized to unbound after control depletion. Values are the average of triplicate experimental replicates. (F) Left: schematic of the biotinylated TERT depletion procedure and unbound fraction analysis. Right: quantification of total TERT and biotinylated MCP-TERT in the unbound fraction of 293T-reconstituted, F-purified telomerase, following labeling using CoA-biotin or CoA and depletion by streptavidin agarose or mock-depletion on Myc antibody agarose. MCP-TERT and the biotin label on MCP-TERT were detected by immunoblot. Values are the average of triplicate experimental replicates. (G) Illustration of labeling efficiency determination by comparison of the percent unbound total MCP-TERT and unbound biotinylated MCP-TERT. (H) Calculated percentage of DNA-bound TERT monomer complexes according to fraction TERT subunit co-localization (percentages indicated), assuming the TERT-labeling efficiency measured value (82%, blue line; bar graph at right), lower bound (51%, green line; Low L numbers at right), or upper bound (100%, purple line; High L numbers at right). Vertical dashed lines are the observed fraction of two-color co-localization (from Figure 2A). (I) Calculated percentage of DNA-bound TERT monomer complexes according to fraction of one-step photobleaching (percentages indicated), assuming the TERT-labeling efficiency measured value (82%, blue line; bar graph at right), lower bound (51%, green line; High L numbers at right), or upper bound (100%, purple line; Low L numbers at right). Vertical dashed lines are the observed fraction of one-step photobleaching (from Figure 2B).
Figure 4
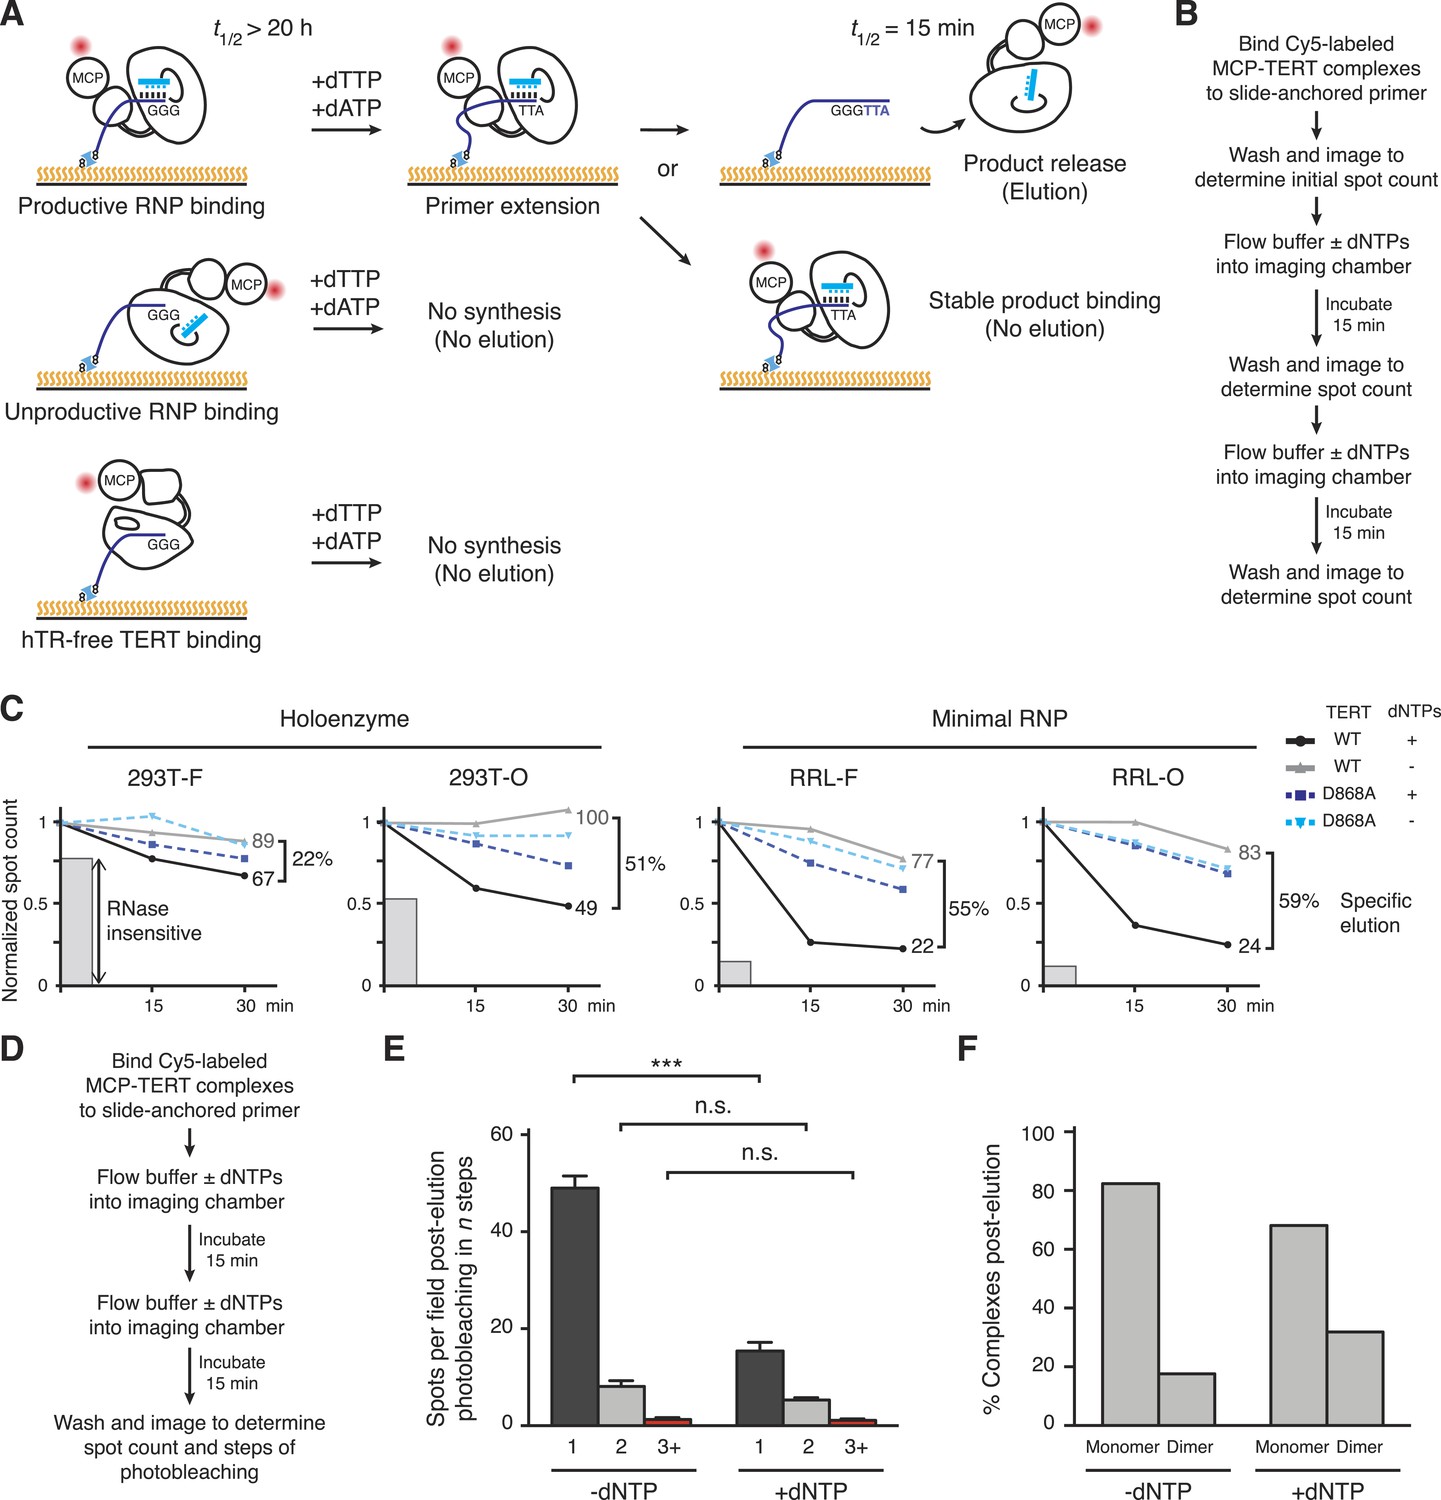
Distinct profiles of activity-dependent elution across populations of TERT complexes.
(A) Schematic of TERT complexes' interaction with bound DNA. In the presence of dTTP and dATP, complexes bound productively to primer end GGG-3′ would elongate the primer to GGGTTA-3′ accompanied by increased likelihood of DNA release (elution, at top). Non-productively bound RNP complexes and hTR-free TERT would not elongate the primer and therefore not elute by DNA synthesis, and some productively bound RNP complexes could also fail to elongate primer and/or to release from product DNA. The t1/2 values are from published studies using human telomerase holoenzyme (Wallweber et al., 2003). (B) Schematic of the activity-dependent elution procedure. (C) Activity-dependent elution of Cy5-labeled wild-type (WT) or catalytic-dead (D868A) MCP-TERT complexes using buffer containing dATP + dTTP or buffer only. Spot count per field of labeled TERT complexes was normalized to the initial time point. Specific elution was calculated by subtracting the fraction of complexes with buffer-only elution from the fraction eluted with dNTPs. The relative count of DNA-bound complexes from sample pre-treated with RNase A is indicated by shaded gray bars. (D) Schematic of the procedure for post-elution counting and photobleaching of labeled complexes. (E) Number of MCP-TERT DNA-bound complexes labeled with Cy5 per imaging field that photobleached in one, two and three, or more steps after elution incubation with or without dNTPs. ***p < 0.001 by unpaired Student's t-test, n.s. is not significant. (F) Calculated percentage of DNA-bound TERT monomer and dimer complexes after elution according to fractional one-step photobleaching, assuming 82% TERT-labeling efficiency.
Figure 5
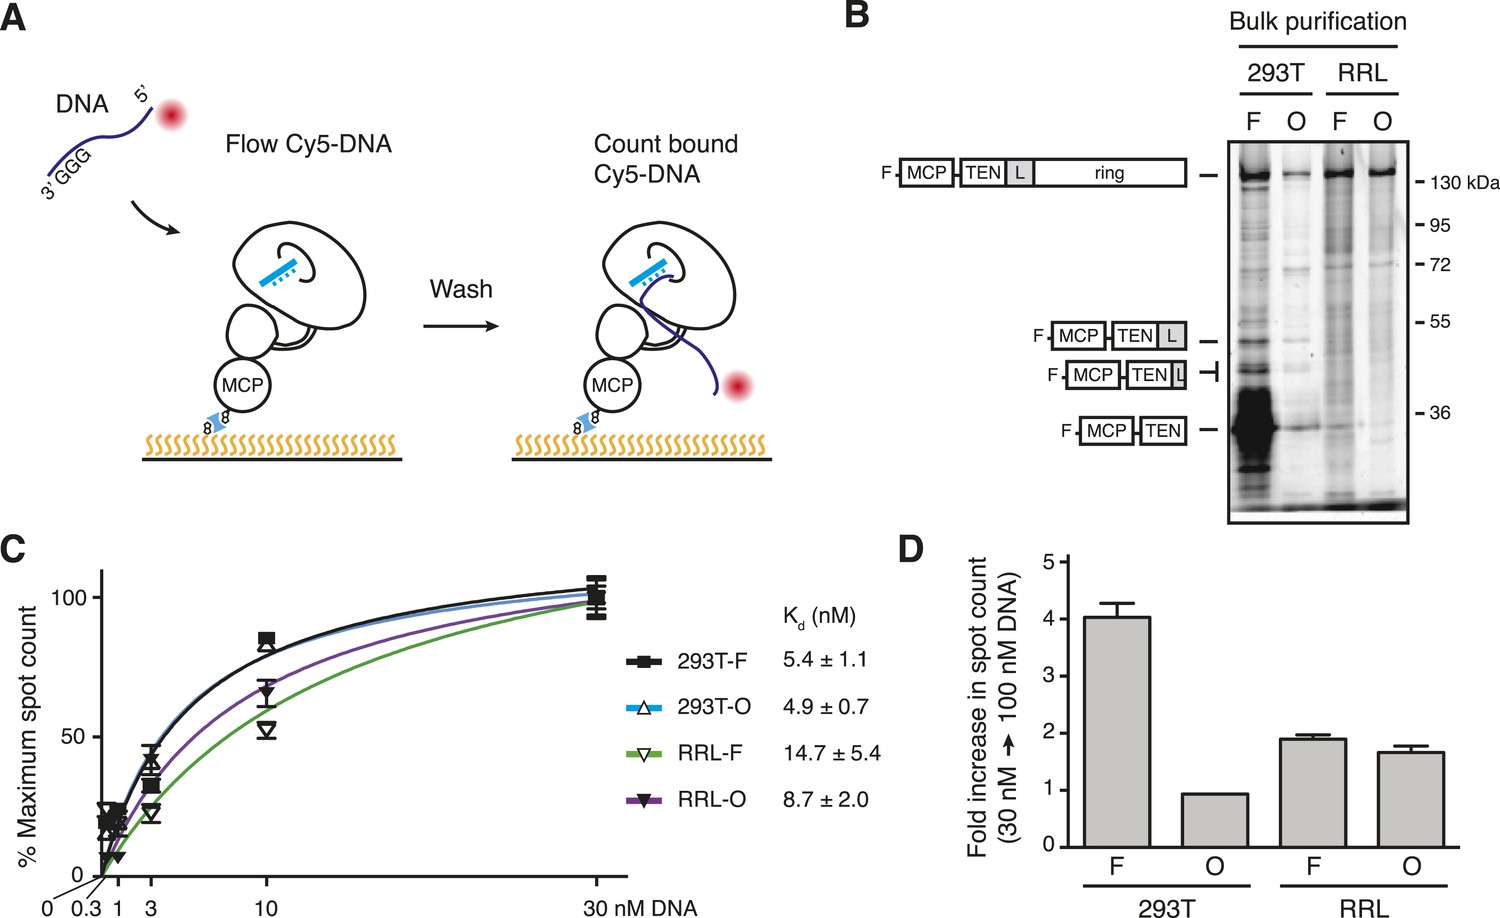
Direct DNA-binding affinity comparison for TERT complexes in bulk purifications.
(A) Schematic for detection of Cy5-labeled DNA binding to biotinylated TERT complexes. (B) SDS-PAGE analysis of MCP-TERT complexes labeled using CoA-Cy5. Cy5-labeled MCP-TERT proteolysis products that retain the N-terminal F-MCP tag and are enriched in the 293T-F purification are schematized in comparison to full-length TERT. (C) Concentration dependence of Cy5-labeled DNA retention by slide-anchored TERT complexes across a titration of 0.3, 1, 3, 10, and 30 nM DNA. Spot count per field was normalized to the 30 nM DNA quantification for each sample. Error bars represent standard error of the mean of spot counts of five fields per sample per DNA concentration. (D) Graph of the change in Cy5-labeled DNA spot count comparing assays of 30 vs 100 nM DNA, normalized to the 30 nM DNA quantifications for each sample. Error bars represent standard error of the mean of spot counts of five fields per sample per DNA concentration.
Figure 6

Telomerase RNP assembly and activity without the TEN domain linker.
(A) Schematic representation and expression of N-terminally F-tagged human TERT proteins with the linker replaced by 20, 10, or 5 repeats of the sequence NAAIRS (TERT-20N through 5N) or linker deleted without compensating sequence insertion (TERT-∆PAL). TERTs expressed in 293T cells were detected by immunoblot with TERT antibody, and TERTs expressed in RRL were detected by 35S-methionine labeling during synthesis. (B) Activity and hTR content of 293T- or RRL-reconstituted, F-purified TERT RNPs with altered linker sequence, bound to FLAG antibody resin. Spot-blot hybridization was used to detect hTR. Relative activity and hTR content were normalized to the WT TERT purification after background subtraction of activity or hTR in the purification of untagged WT TERT. Specific activity was calculated from relative activity and relative hTR. (C) Processive extension of 5′-labeled (T2AG3)3 primer by telomerase assembled with WT, ∆PAL, or 20N TERT bound to FLAG antibody resin. The labeled primer was extended for 5 min before chase addition of unlabeled primer for a total extension time of 10, 20, or 40 min. (D) Activity and hTR content of telomerase in 293T input extracts or bound to Myc antibody resin. TPP1 OB-fold domain expression and purification were confirmed by immunoblot detection of the 3xMyc tag. Immunoblot and activity assay with whole-cell extract used 2% of the total purification input. Half of the post-purification sample was used for activity assays and half for Myc immunoblot. Spot-blot hybridization was used to detect hTR. Relative activity and hTR content were normalized to the input or bound sample for TPP1 purification of WT TERT, after bound hTR background subtraction using the purification without tagged TPP1 OB-fold domain. Relative percentage enrichment was calculated as relative bound activity adjusted for relative input activity. Specific activity was calculated from relative activity and relative hTR. (E) SDS-PAGE analysis of O-purified 293T MCP-TERT complexes labeled using CoA-Cy5. MCP-TERT fragments resulting from proteolysis within the PAL of WT TERT are schematized, in comparison to full-length TERT.
Figure 7
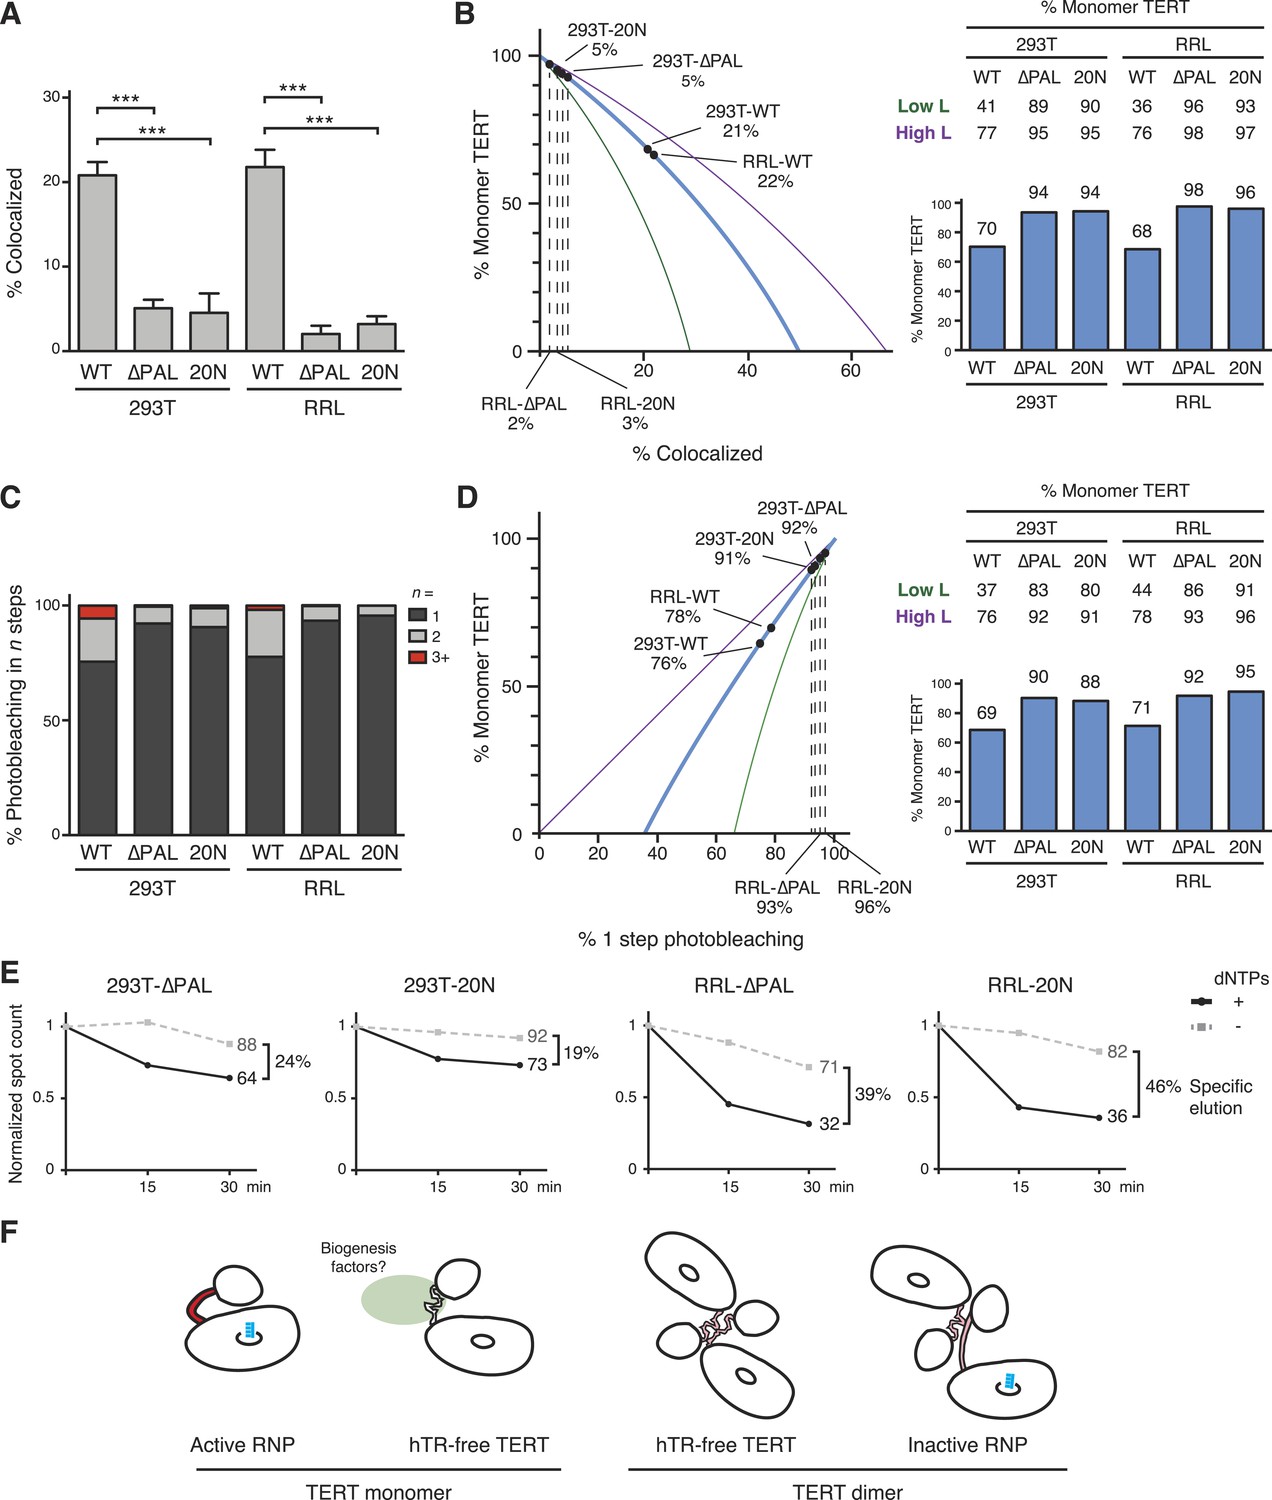
PAL-mediated TERT dimerization.
(A) Two-color co-localization quantification for DNA-bound O-purified complexes of coexpressed ACP- and MCP-TERTs. Values are the average of triplicate experimental replicates. ***p < 0.001 using one-way ANOVA, followed by Tukey's multiple comparison test. (B) Calculated percentage of DNA-bound TERT monomer complexes according to the fraction of two-color TERT co-localization (percentages indicated), assuming the TERT-labeling efficiency measured value (82%, blue line; bar graph at right), lower bound (51%, green line; Low L numbers at right), or upper bound (100%, purple line; High L numbers at right). (C) Photobleaching step quantification for DNA-bound O-purified MCP-TERT complexes labeled with Cy5. Values are the average of triplicate experimental replicates. (D) Calculated percentage of DNA-bound TERT monomer complexes according to the fraction of one-step photobleaching (percentages indicated), assuming the TERT-labeling efficiency measured value (82%, blue line; bar graph at right), lower bound (51%, green line; Low L numbers at right), or upper bound (100%, purple line; High L numbers at right). (E) Activity-dependent elution of O-purified Cy5-labeled MCP-TERT complexes using buffer containing dATP + dTTP or buffer only. Spot count per field of labeled TERT complexes was normalized to the initial time point of each sample. Specific elution was calculated by subtracting the fraction of complexes with buffer-only elution from the fraction eluted with dNTPs. (F) Illustration presenting the hypothesis of differences in TERT PAL conformation that occur with TERT RNP assembly or dimerization. The PAL is shown with conformations that correlate with catalytically active (red) or inactive (pink) TERT complexes.
Download links
A two-part list of links to download the article, or parts of the article, in various formats.
Downloads (link to download the article as PDF)
Open citations (links to open the citations from this article in various online reference manager services)
Cite this article (links to download the citations from this article in formats compatible with various reference manager tools)
Single-molecule imaging of telomerase reverse transcriptase in human telomerase holoenzyme and minimal RNP complexes
eLife 4:e08363.
https://doi.org/10.7554/eLife.08363


