Archaeal TFEα/β is a hybrid of TFIIE and the RNA polymerase III subcomplex hRPC62/39
- University College London, United Kingdom
- Max Planck Institute for Terrestrial Microbiology, Germany
- University of Freiburg, Germany
Figures
Figure 1 with 2 supplements
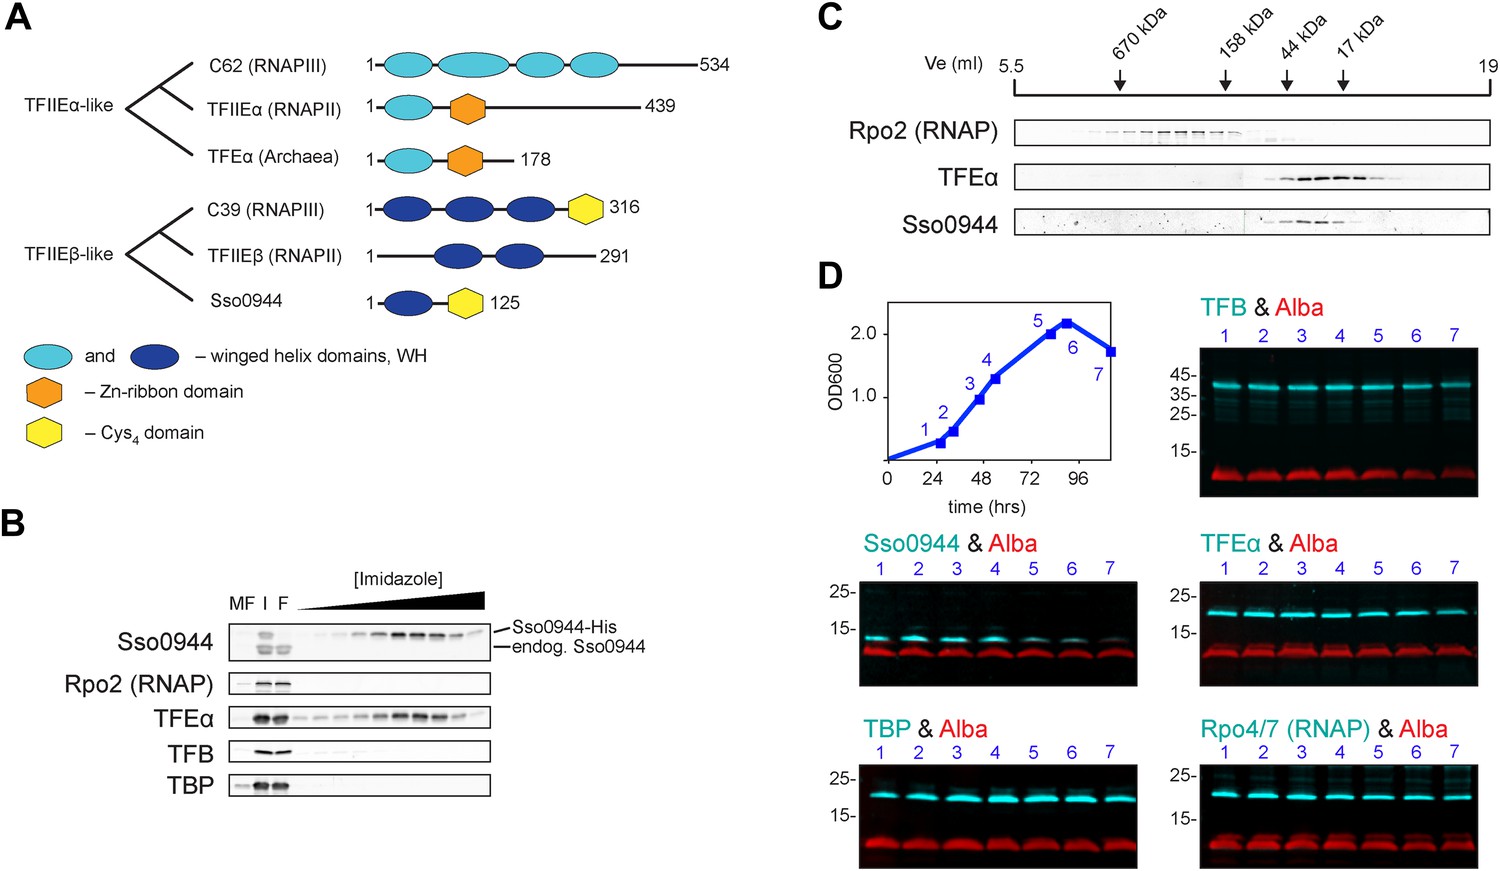
Identification of a dimeric TFE factor in S. solfataricus.
(A) Conserved and acquired domains of TFIIEα and TFIIEβ-related proteins in Eukaryotes and Archaea derived from (Blombach et al., 2009; Vannini and Cramer, 2012). (B) Homologous expression and nickel affinity purification of Sso0944 as C-terminal His10-tag fusion. Immunodetection was used to detect co-purification of Sso RNAP (subunit Rpo2) and the basal transcription factors. MF—membrane fraction. I—input (soluble fraction) loaded onto column. F—flow-through fraction. (C) Immunodetection of RNA polymerase (RNAP), TFEα and Sso0944 (TFEβ) in S. solfataricus P2 cell lysate fractionated by size exclusion chromatography. (D) Multiplex immunodetection of Sso RNAP (stalk subunits Rpo4/7) and the basal transcription factors in S. solfataricus P2 during different growth phases. Samples were taken at the indicated time points (blue). 18 µg of lysed cells (total soluble protein content) was loaded into each lane. Immunodetection of the chromatin protein Alba served as loading control. Immunodetection of Rpo4/7 yielded a strong signal for Rpo7 at around 20 kDa, but only faint signal for Rpo4 (around 13 kDa). The experiment was carried out in triplicate and a typical result is shown.
Figure 1—figure supplement 1
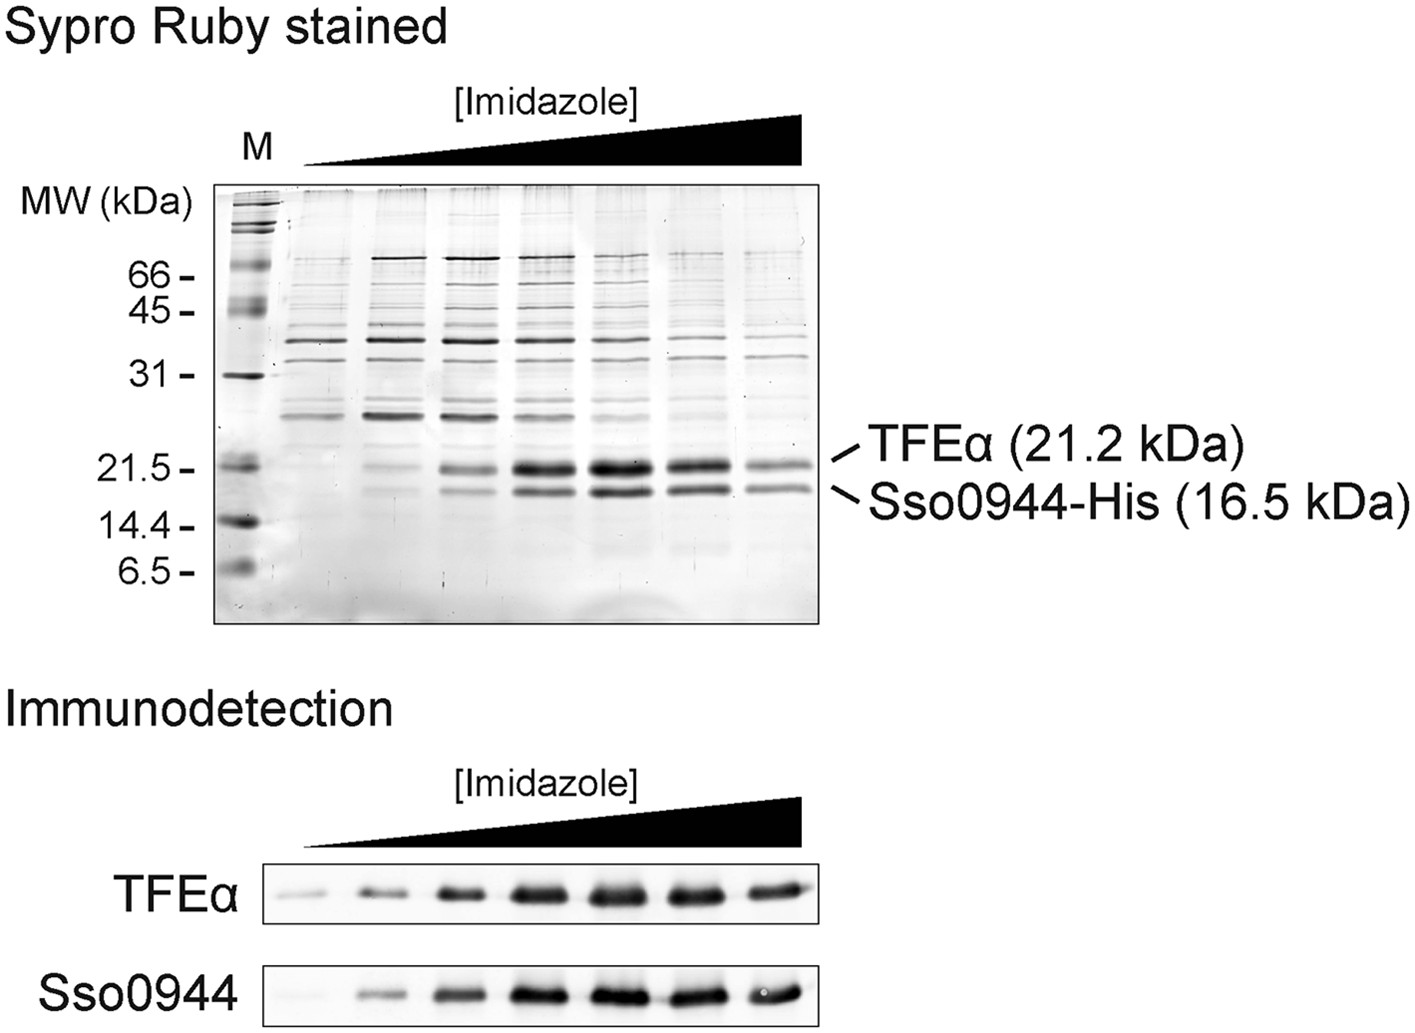
Sso0944 and TFEα form a dimeric complex.
Sso0944 was isolated as C-terminal His10-tag fusion from S. solfataricus M16 transformed with pMJ0503-Sso0944 under more stringent conditions. The salt concentration during the Ni-affinity purification was raised to 500 mM KCl and a 20 CV wash with 50 mM imidazole was introduced prior to elution. The upper panel shows an SDS-gel with the Ni-affinity elution fractions with total protein stained with SYPRO Ruby. The lower panel shows the immunodetection with Sso0944 and TFEα antisera of the Ni-affinity elution fractions.
Figure 1—figure supplement 2
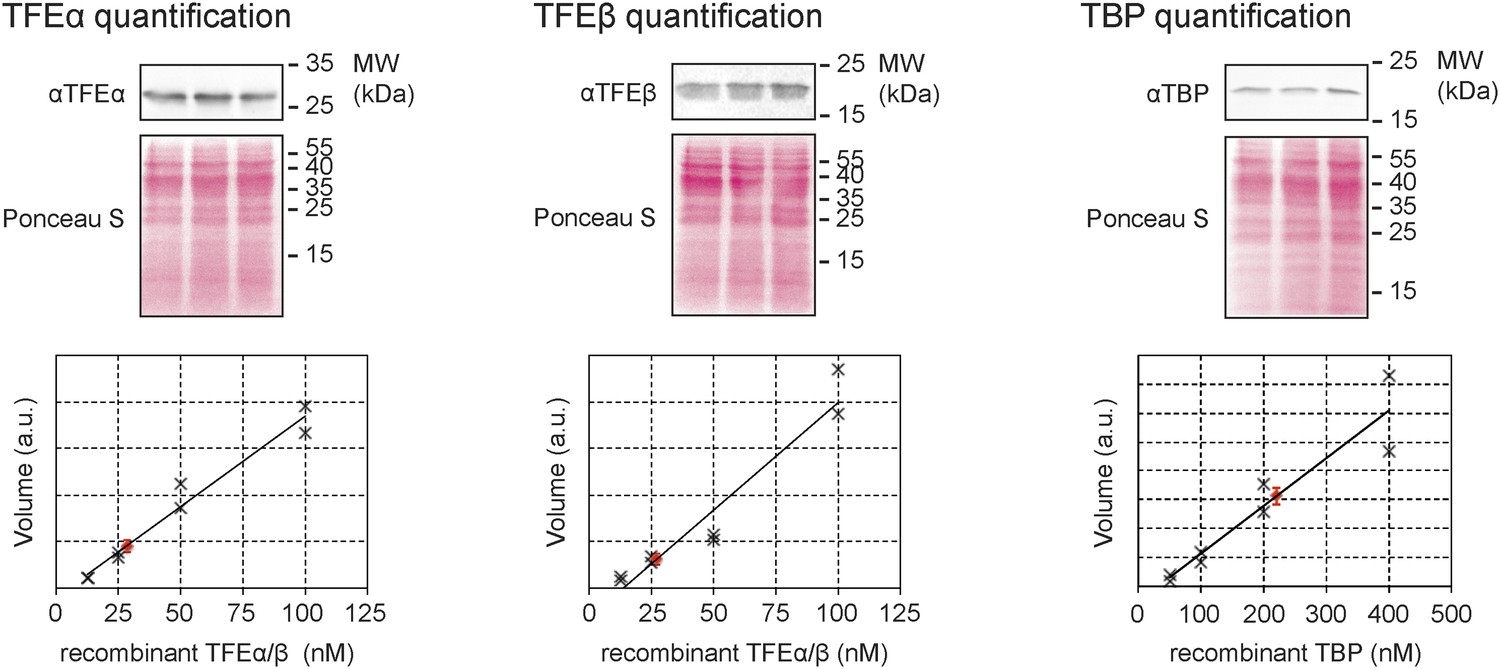
Quantitative immunodetection of TFEα, TFEβ and TBP in S. solfataricus P2 cell lysates during exponential growth phase (n = 3).
18 µg of cell lysate (total soluble protein content) was loaded into each lane. Total protein-staining of the Western blots was performed using Ponceau S to verify loading of equal protein amounts. In parallel increasing amounts of recombinant dimeric TFEα/β (non-His-tagged) or TBP were loaded in order to generate a calibration curve (black crosses) that was used to determine the expression levels of TFEα, TFEβ and TBP (red diamond, average value, error bars show 1× standard deviation).
Figure 2 with 2 supplements
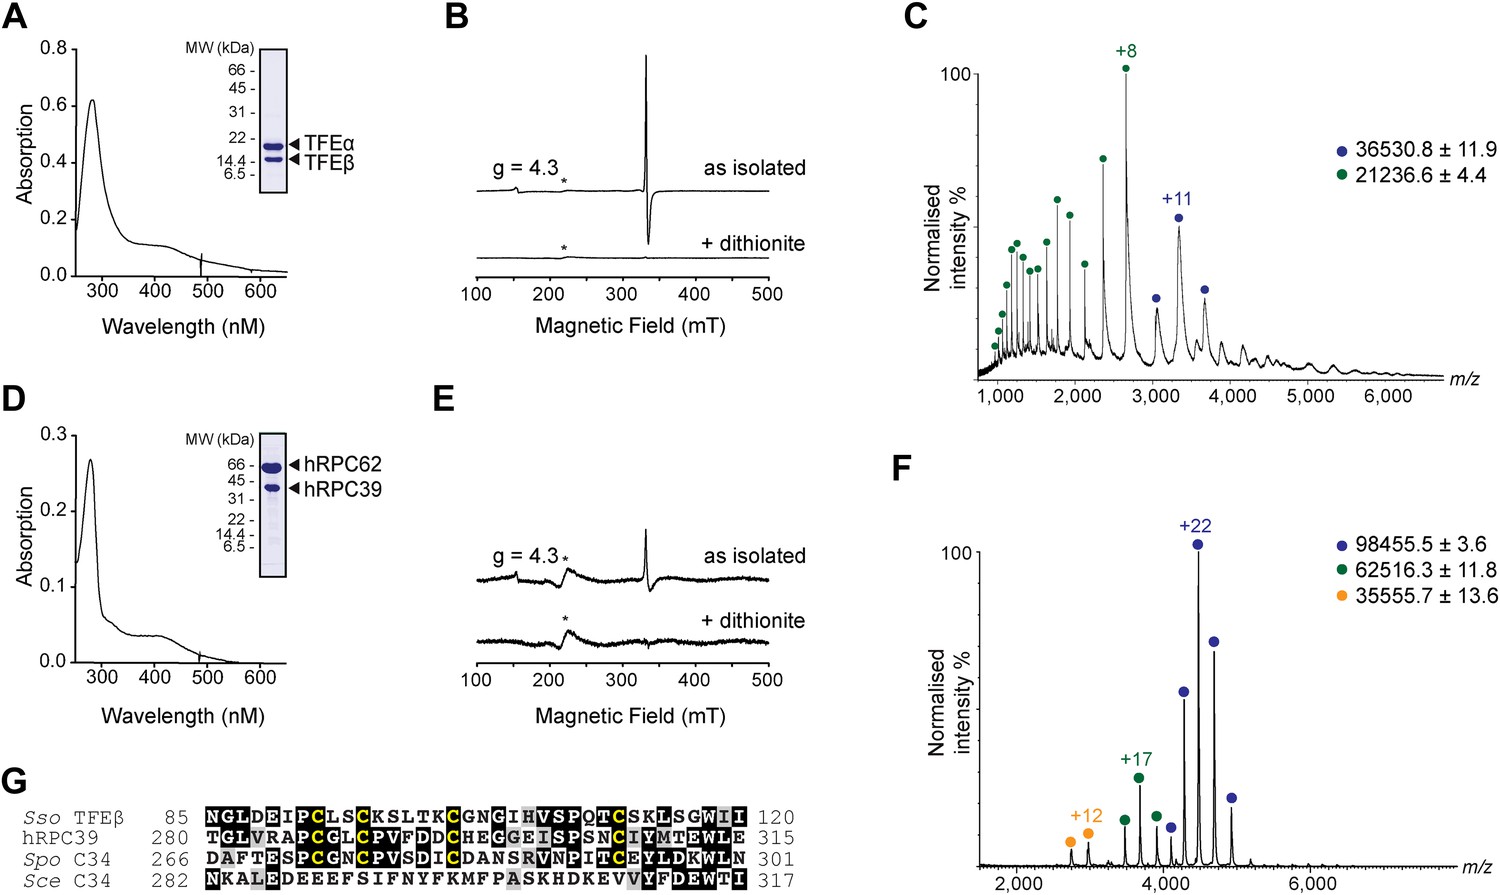
The C-terminal domain of Sso TFEβ harbours a 4Fe-4S cluster that is conserved in human RNAPIII subcomplex hRPC62/39.
(A) UV-vis spectrum of TFEα/β-His. (B) Cw-EPR spectra of TFEα/β prepared in the presence of 1 mM DTT with or without the addition of 20 mM Na-dithionite. Besides the main [3Fe-4S]+ cluster signal at g = 2.01, a small amount of spurious high spin Fe3+ at g = 4.3 was also detected. The asterisks denote a background signal. (C) Nano-electrospray ionization (nESI) mass spectrum of TFEα/β-His. Filled circles indicate the different charge state series: TFEα/β-His + Zn ion + 4Fe-4S cluster (blue), TFEα + Zn ion (green). (D) UV-vis spectrum of recombinant human RNAP III subcomplex hRPC62/C39. (E) Cw-EPR spectra of hRPC62/39 prepared in the presence of the reducing agent Na-dithionite. The asterisks denote a background signal. (F) nESI mass spectrum of recombinant human hRPC62/C39. Filled circles indicate the different charge state series: hRPC62/C39 complex + 4Fe-4S cluster (blue), monomeric hRPC62 (green), monomeric hRPC39 (yellow). (G) Sequence alignment of the C-terminal domains of S. solfataricus TFEβ (gene id: 1455187), H. sapiens hRPC39 (gene id: 10621), Schizosaccharomyces pombe C34 (gene id: 2538992), and S. cerevisiae C34 (gene id: 855737). Identical and similar residues are shaded in black and grey, respectively. The four cysteine residues coordinating the FeS cluster are highlighted in yellow.
-
Figure 2—source data 1
Theoretical and experimentally calculated masses of proteins and protein complexes.
- https://doi.org/10.7554/eLife.08378.009
Figure 2—figure supplement 1
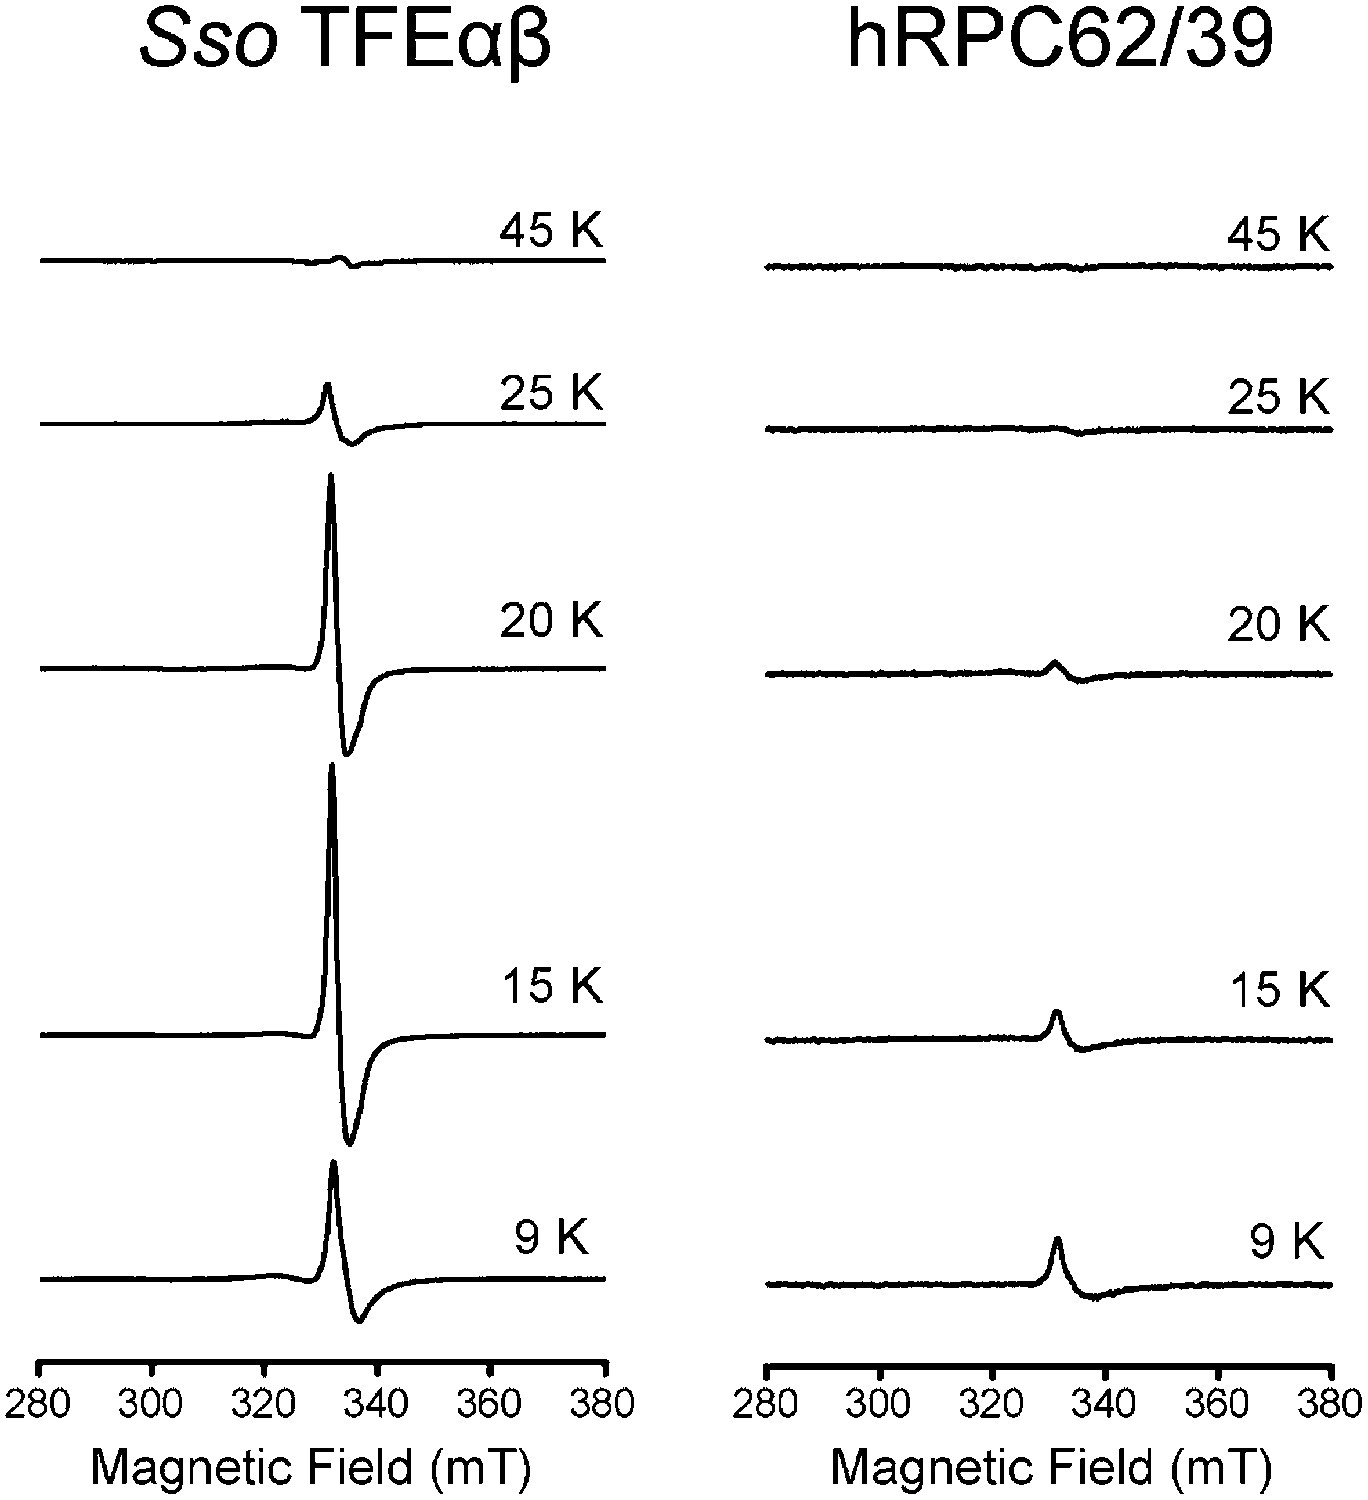
Temperature dependence of the cw-EPR spectra of Sso TFEαβ and hRPC62/39.
The decrease in signal at temperatures above 20 K is characteristic of cubane-like FeS clusters.
Figure 2—figure supplement 2
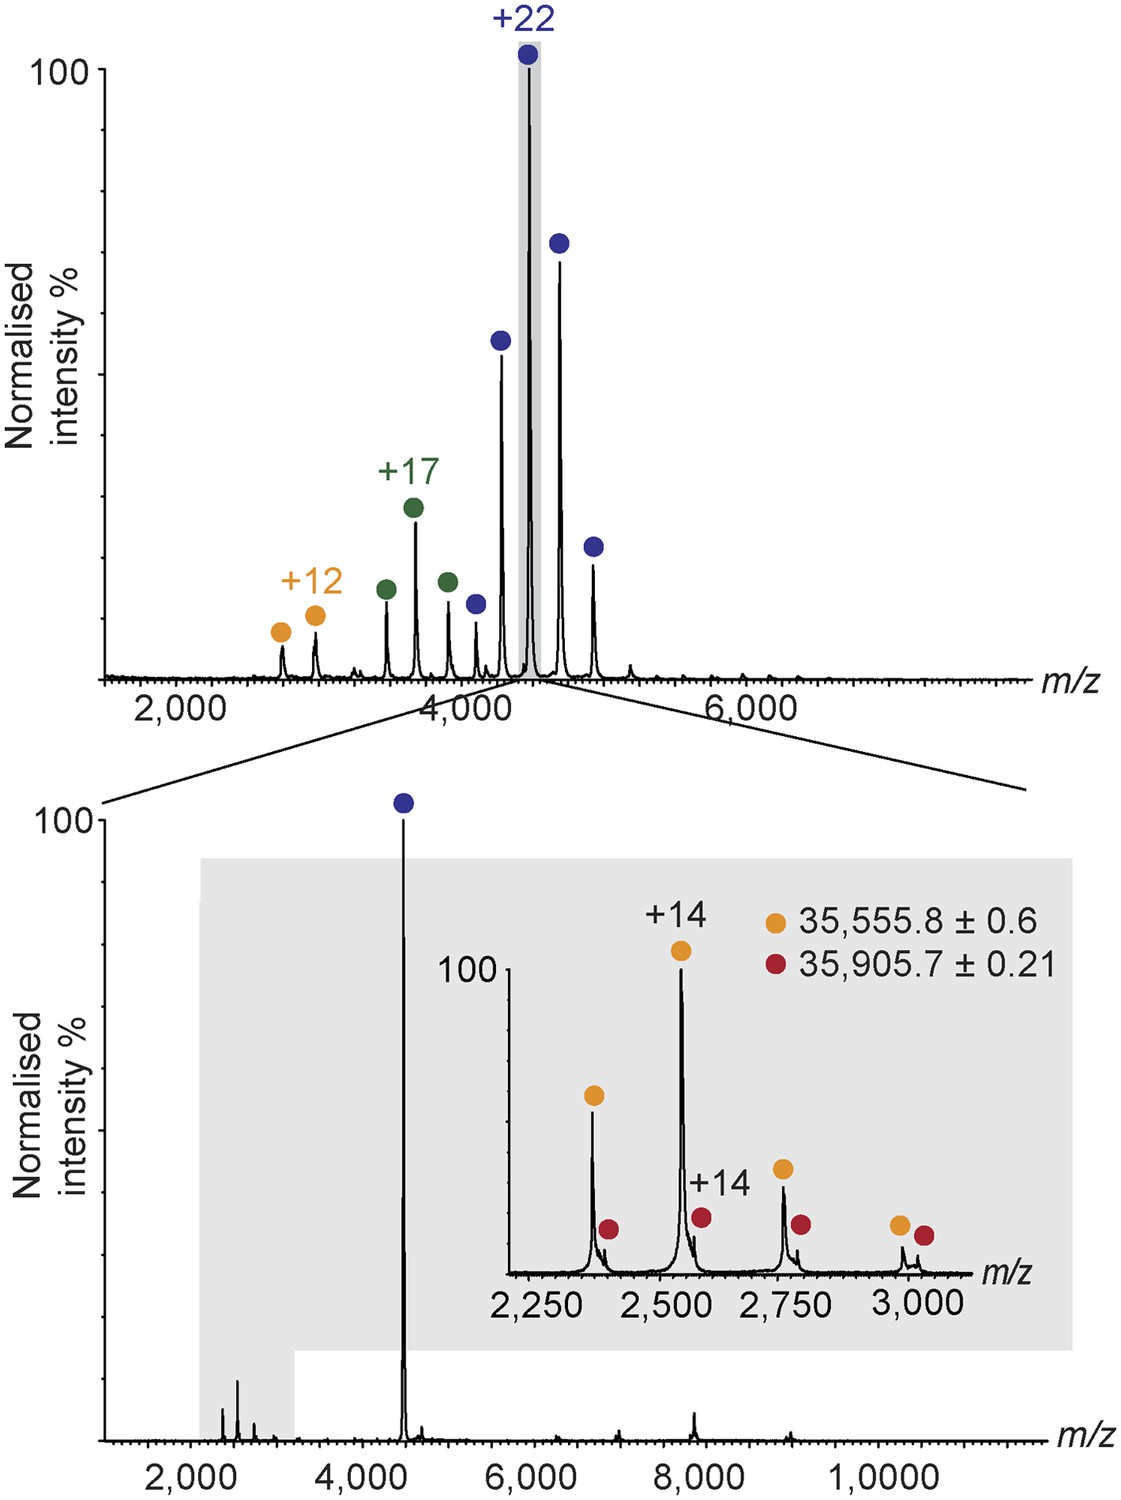
Nano-electrospray ionization mass spectrum of human hRPC62/C39 (top).
The +22 charge state, corresponding to the hRPC62/C39 + [4Fe-4S] complex was subjected to collision induced dissociation. At the low m/z region of the tandem mass spectrum, two charge state series corresponding to hRPC39 (yellow) and hRPC39 + [4Fe-4S] (red) are observed (bottom and Figure 2—source data 1).
Figure 3 with 1 supplement
Characterisation of the TFEα/β heterodimerization interface.
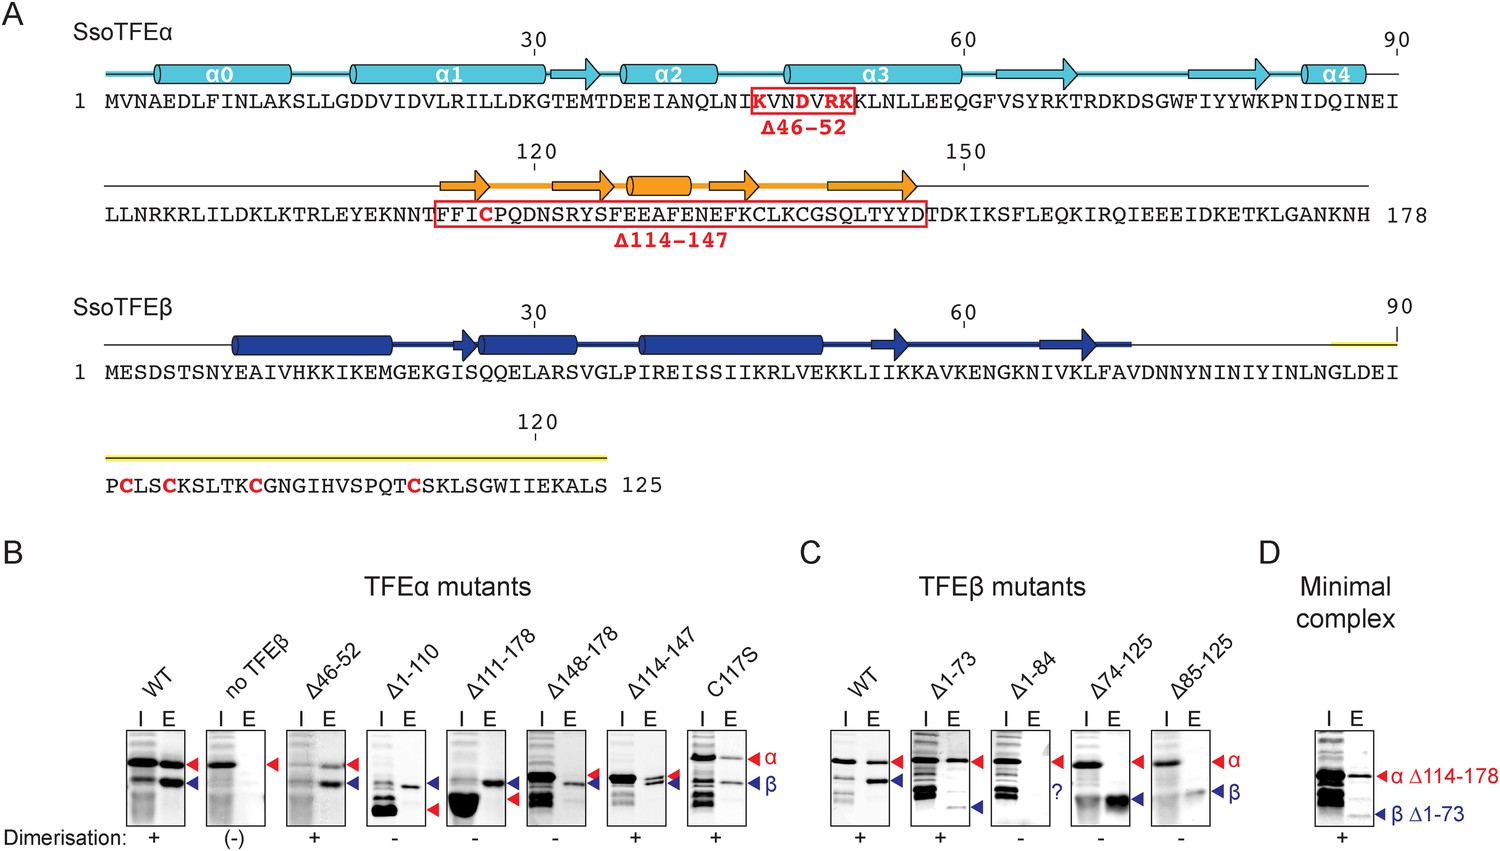
(A) Amino acid sequences and secondary structure of TFEα and TFEβ. The α-helices in the TFEα WH domain are numbered according to (Meinhart et al., 2003). Deletion (red boxes) and substitution deletions (highlighted in red) are indicated. (B, C) TFE α/β interaction analysis using co-purification of TFE alpha and his-tagged TFE beta. TFEα (B) and TFEβ-His (C) substitution- and domain deletion variants were co-expressed in E. coli and purified using Nickel-affinity chromatography. Input (heat-stable cell lysate, 25%) (I) and elution fractions (E) were analysed by SDS-PAGE and Coomassie staining. Red and blue triangles indicate the position of the respective mutant variants of TFEα and TFEβ-His, respectively. The question mark denotes that the TFEβ Δ1–84 variant is probably instable. Note that the TFEα expression levels are higher than TFEβ, and that the expression levels of TFEβ mutants are lower than WT, which in some cases make it difficult to discern in the input fractions. (D) Minimal heterodimeric TFEα/β complex consisting of TFEα Δ114–178 and TFEβ Δ1–73.
Figure 3—figure supplement 1

Additional mutants of the N-terminal tip of α-helix 3 of TFEα and their effect on dimerization with TFEβ
Ni-affinity co-purification assays conducted for TFEβ-His co-expressed with TFEα (WT), TFEα K46E, TFEα D49T, or TFEα R51E/K52E. Red and blue triangles indicate the position of the respective mutant variants of TFEα and TFEβ-His, respectively.
Figure 4
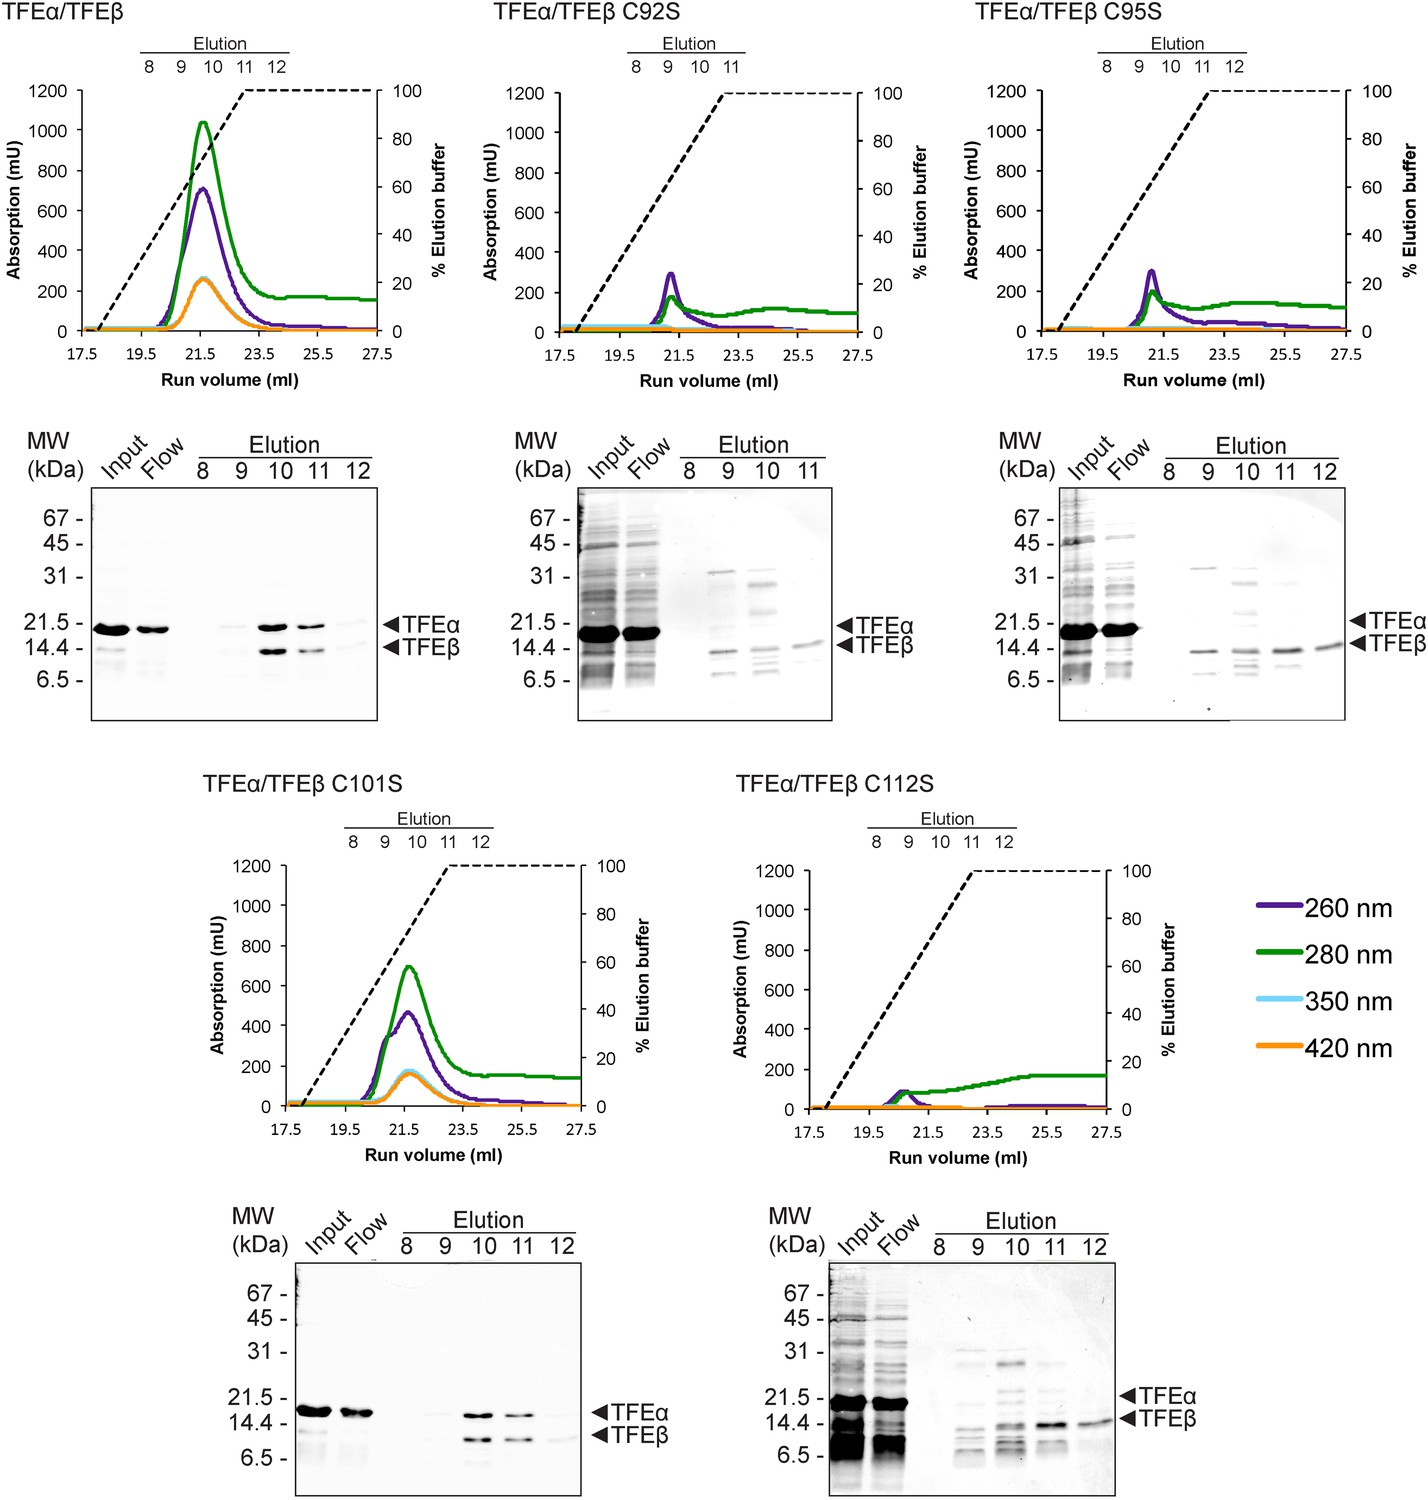
TFEαβ dimerization depends on the integrity of the Fe-S cluster.
Ni-affinity chromatography of TFEβ-His (WT), TFEβ-His C92S, TFEβ-His C95S, TFEβ-His C101S or TFEβ-His C112S co-expressed with TFEα. The graphs show the absorption profile monitored at 260 nm, 280 nm, 350 nm, and 420 nm. Absorption in the visible light range (350 nm and 420 nm) is indicative for the presence of the Fe-S cluster. The elution fractions analysed by SDS-PAGE are indicated. The panels below show Coomassie-stained SDS-gels with the (heat-stable) input, flow, and elution fractions.
Figure 5

TFEα/β forms a stable interaction with the RNAP clamp module.
10 μM TFEα/β-His were incubated together with 10 μM recombinant RNAP clamp and the sample was resolved gel filtration. The presence of RNAP clamp and TFEα/β in the fractions was determined by SDS-PAGE and silver staining. The position of peaks for gel filtration marker proteins is indicated on top. For experiments with TFEα/β ΔWH the contrast was enhanced for the lower part of the gel in order to visualize TFEβ ΔWH.
Figure 6 with 1 supplement
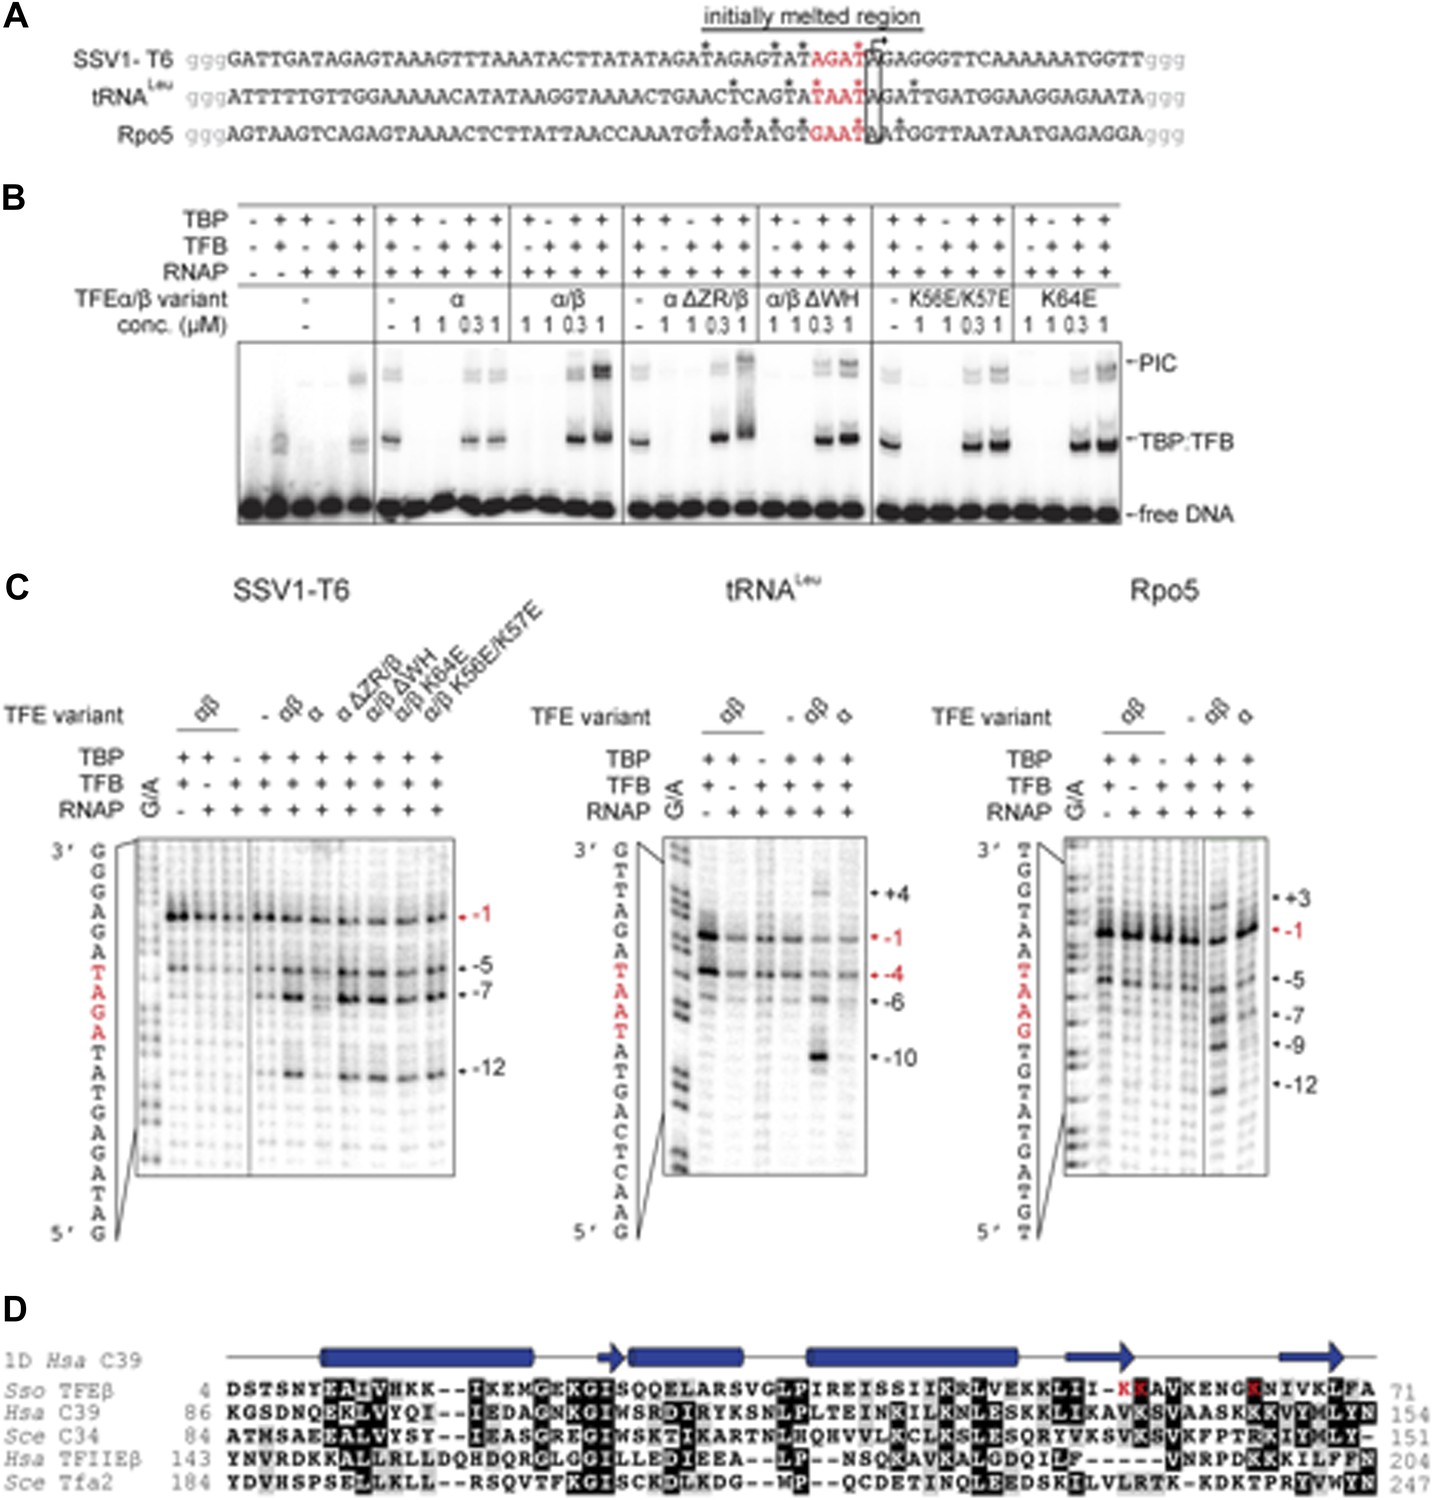
TFEα/β increases the stability of the preinitiation complex (PIC) and promotes DNA melting.
(A) NTS sequence of the DNA templates for the promoters tested in electrophoretic mobility shift assay (EMSA) and potassium permanganate footprinting assays. The templates incude a 4 nt heteroduplex region (positions −4 to −1 relative to the TSS, in red) that was generated by introducing transition mutations into the template strand Asterisks mark permanganate-reactive T residues (see panel C). Additional G residues (in grey) were added to stabilize the termini. (B) PIC formation on the SSV1-T6 promoter in response to TFEα/β, TFEα and mutant variants using EMSAs. K56E/K57E and K64E denote mutations in the TFEβ WH. (C) The non-template strand of the SSV1-T6 and Sso Rpo5 and Sso tRNALeu promoters was probed in potassium permanganate footprinting assays. The position of reactive T residues is indicated on the right. G/A ladder and the DNA sequence are shown on the left. (D) Sequence alignment of the WH domains of TFEβ (gene id: 1455187), WH2 of human C39 (gene id: 10621), WH2 of yeast C34 (gene id: 855737), WH2 of human TFIIEβ (gene id: 2961), and WH2 of yeast Tfa2 (gene id: 853936). Identical and similar residues are shaded in black and grey, respectively. On top of the alignment the secondary structure of WH2 of human C39 (PDB id: 2DK5) is depicted (α-helices as barrels and β-strands as arrows). Residues K56, K57 and K64 in the WH domain of TFEβ where mutations were introduced are highlighted in red.
Figure 6—figure supplement 1
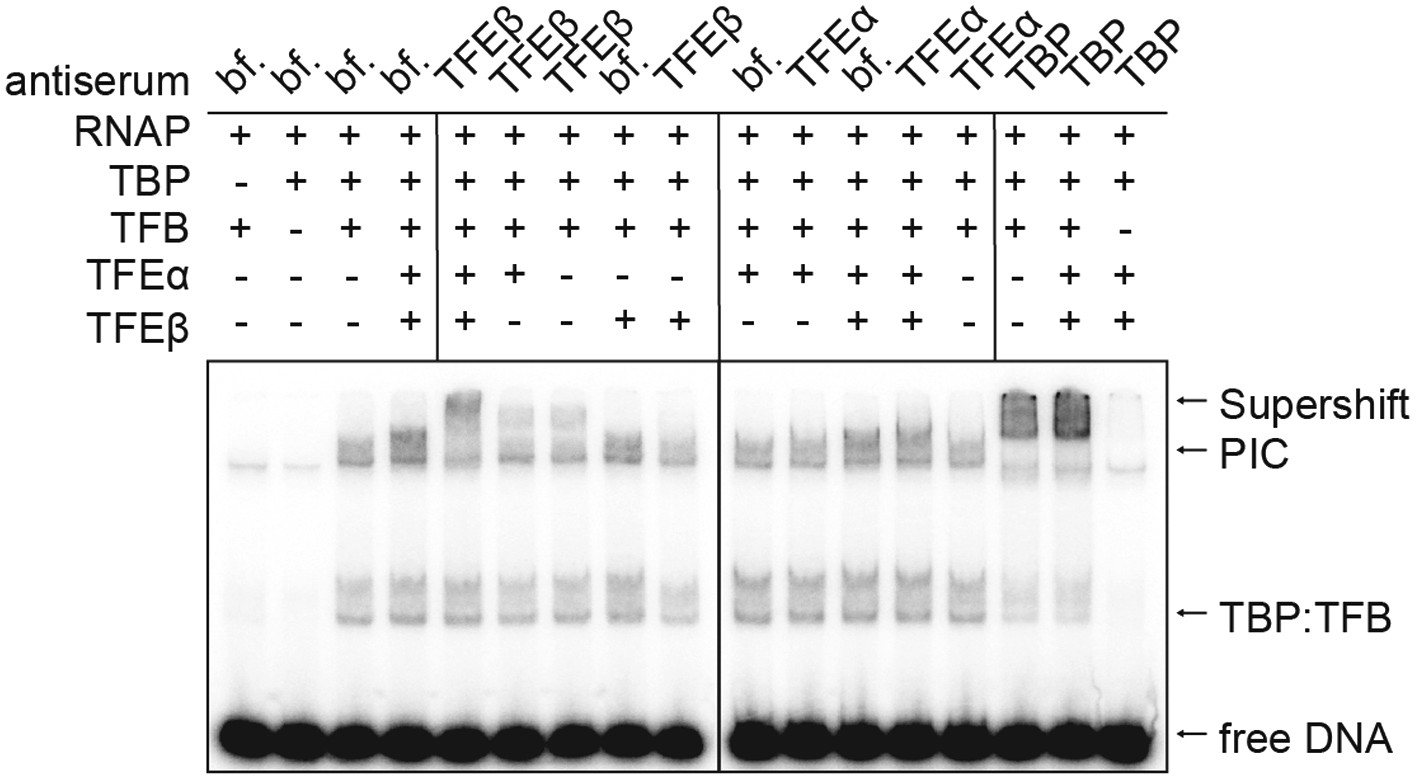
TFEα/β is part of the PIC.
Supershift EMSA with PICs formed in presence or absence of TFEα/β (0.1 µM) being exposed to antisera directed against TFEα, TFEβ and TBP. Antibody-PIC complexes migrate slower in the gel compared to PIC alone causing a supershift.
Figure 7 with 2 supplements
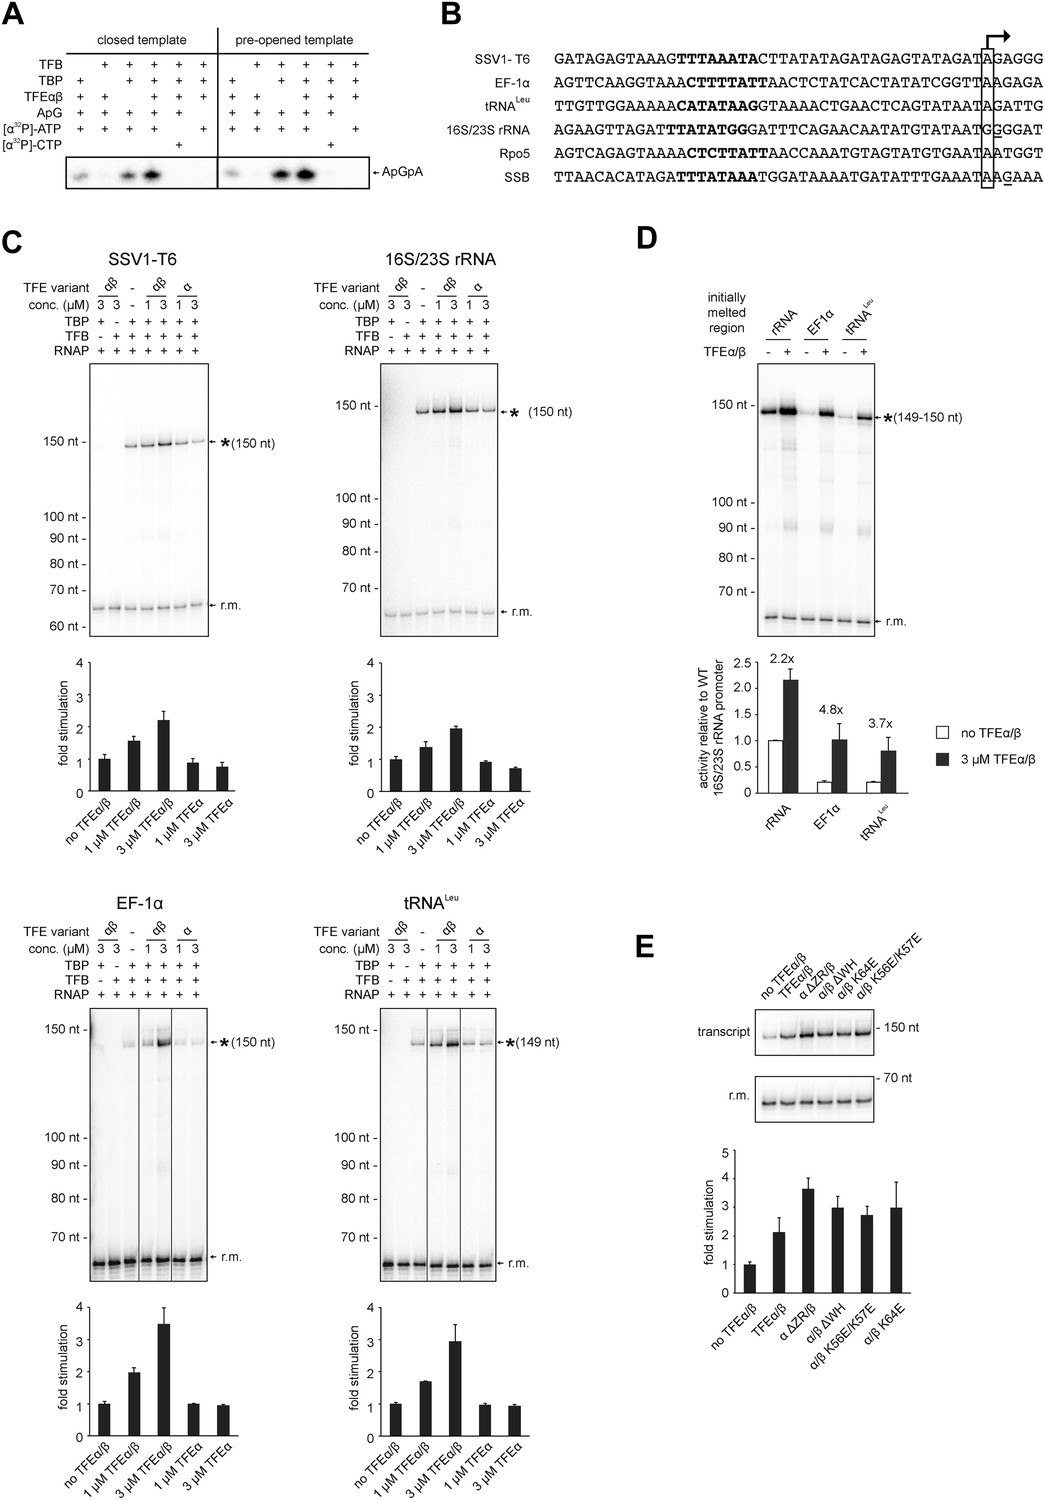
TFEα/β stimulates abortive and productive transcription.
(A) Abortive transcription assays measuring ApGpA trinucleotide synthesis on −4/−1 heteroduplex and homoduplex SSV1-T6 promoter templates in the presence or absence of 1 µM TFEα/β. (B) NTS sequence of the different promoters tested in productive transcription assays. The TSS is boxed and putative TATA-boxes are shown in bold. Residues underlined are C to G mutations in order to construct a C-less cassette. (C) Productive transcription assays on four different promoters. Circular relaxed plasmids with different S. solfataricus promoters fused to C-less cassettes were used as templates. The position of the run-off transcripts (asterisk) and its expected size are indicated. A recovery marker (r.m.) was included. The lower panels show the quantifications of synthesized transcript. (D) Effect of the initially melted region on TFEα/β stimulation. Productive transcription assays with hybrid promoters encompassing the TATA-box and surrounding region (position −46 to −13) of the weakly stimulated 16S/23S rRNA promoter with the initially melted and transcribed regions of the stronger stimulated tRNALeu (−12 to +5) or EF-1α promoters (−12 to +7). (E) Effect of TFEα/β mutant variants (3 µM) on productive transcription on the T6 promoter. The mean of three technical replicates is shown. Error bars depict 1× standard deviation.
Figure 7—figure supplement 1
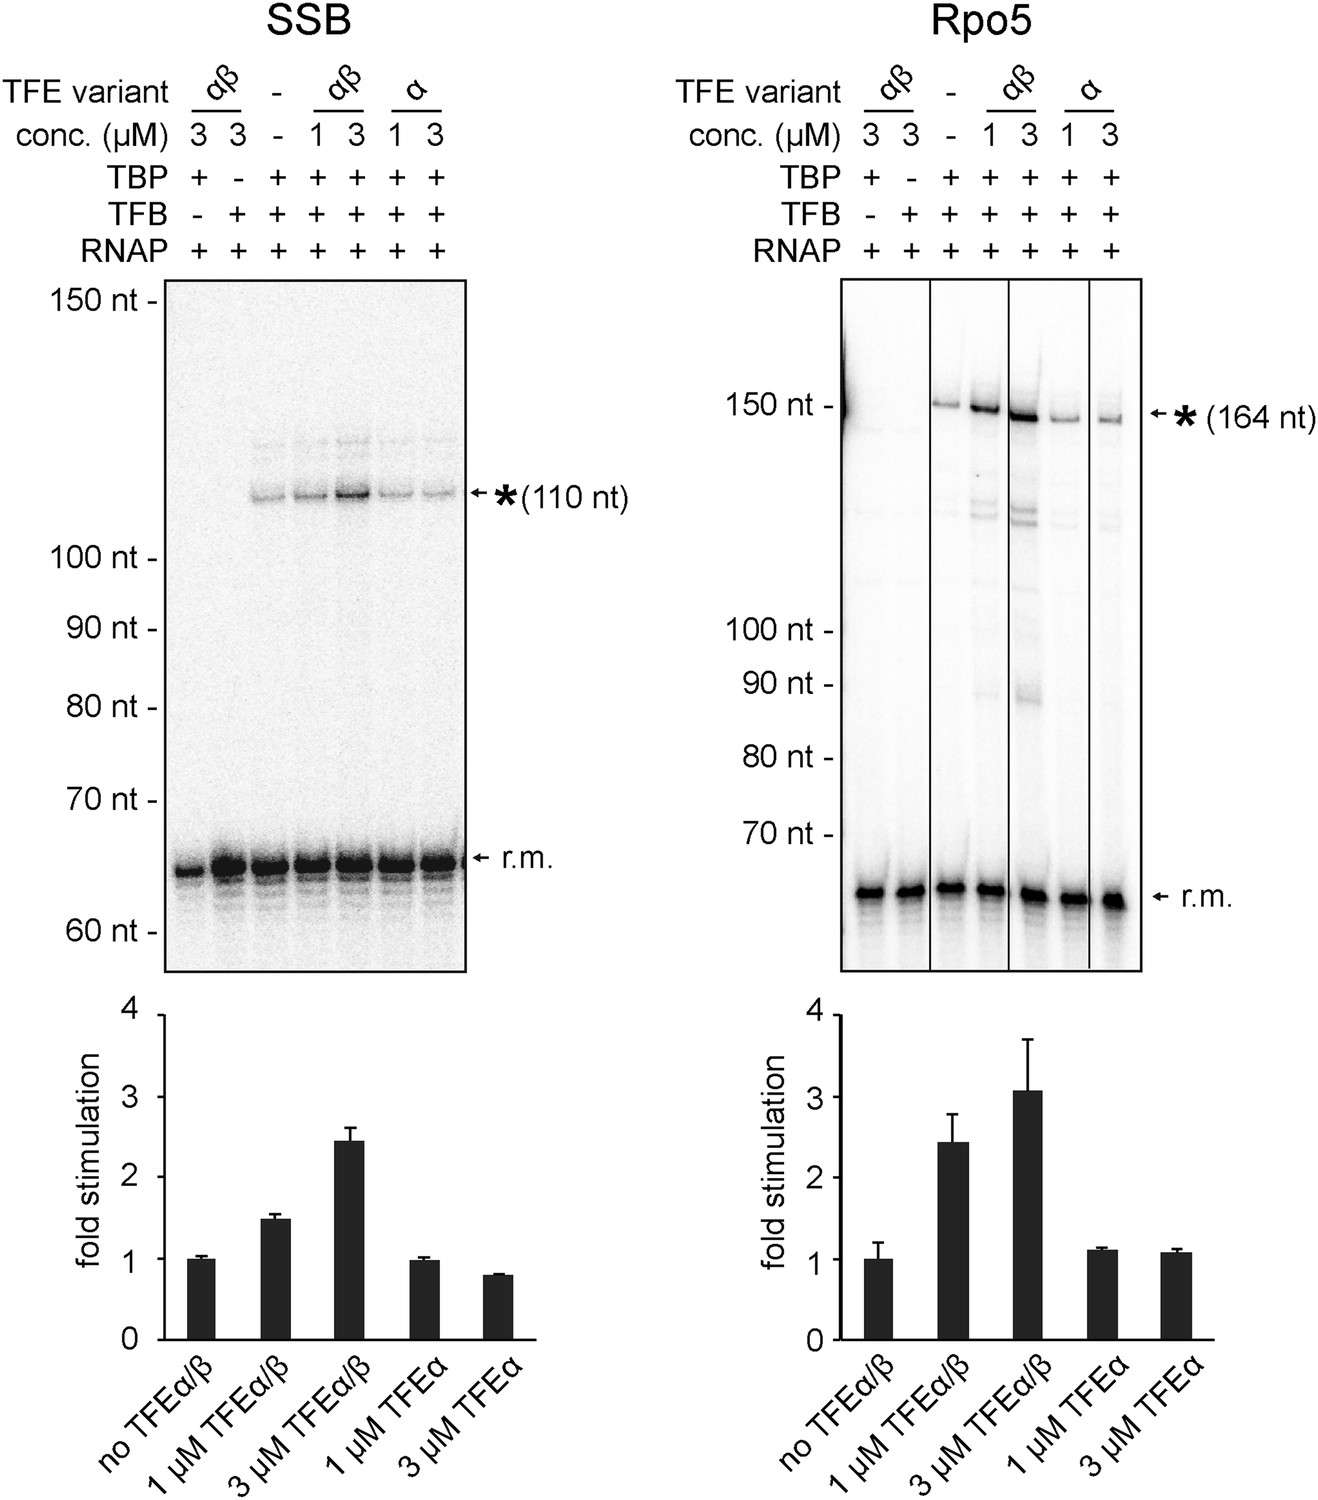
Productive transcription assays using the SSB and Rpo5 promoters.
Circular relaxed plasmids with different S. solfataricus promoters fused to C-less cassettes were used as templates. The position of the run-off transcripts (asterisk) and its expected size is indicated. A recovery marker (r.m.) was included. The lower panels show the quantifications of synthesized transcript.
Figure 7—figure supplement 2
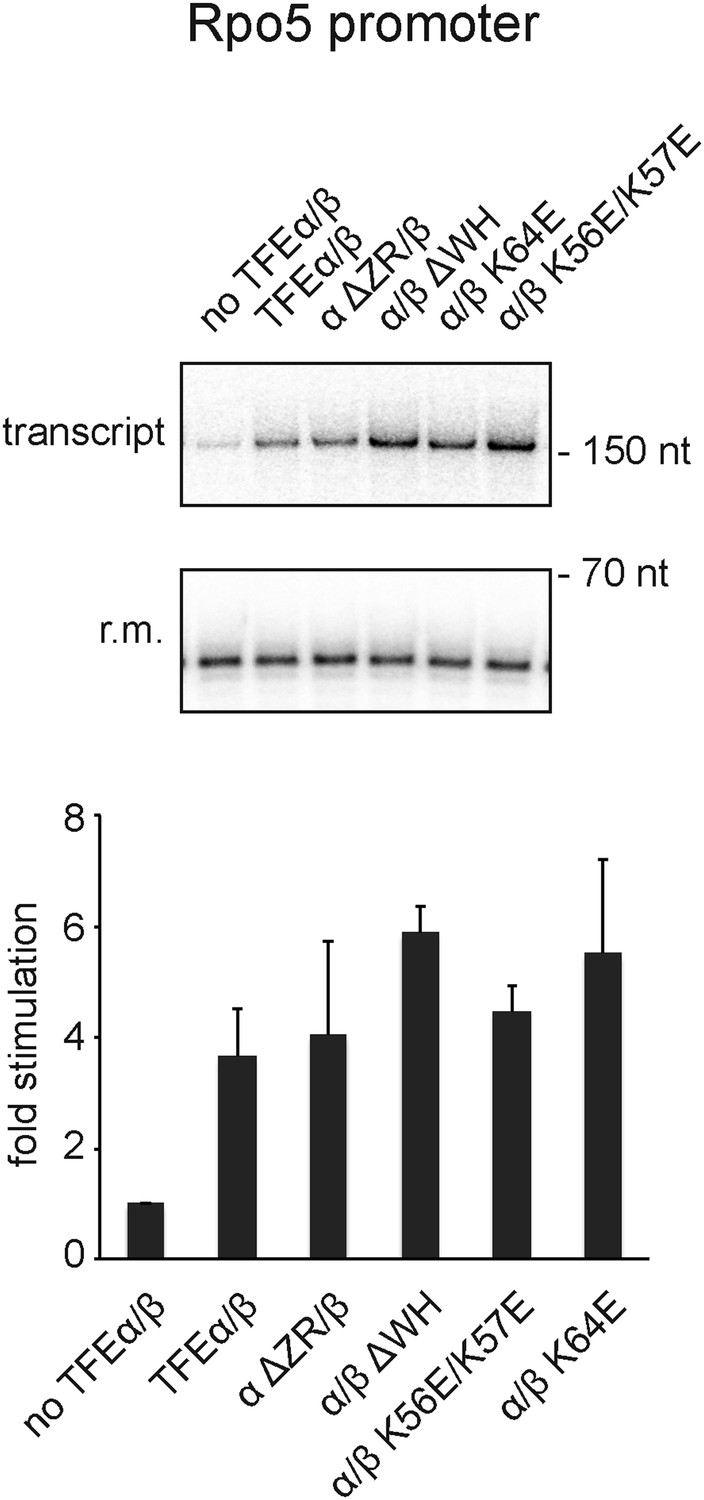
Effect of TFEα/β mutant variants on productive transcription on the Rpo5 promoter.
Transcription assays and quantification were carried out as described above with 3 µM TFEα/β or variant. The mean of three technical replicates is shown. Error bars depict 1× standard deviation.
Figure 8
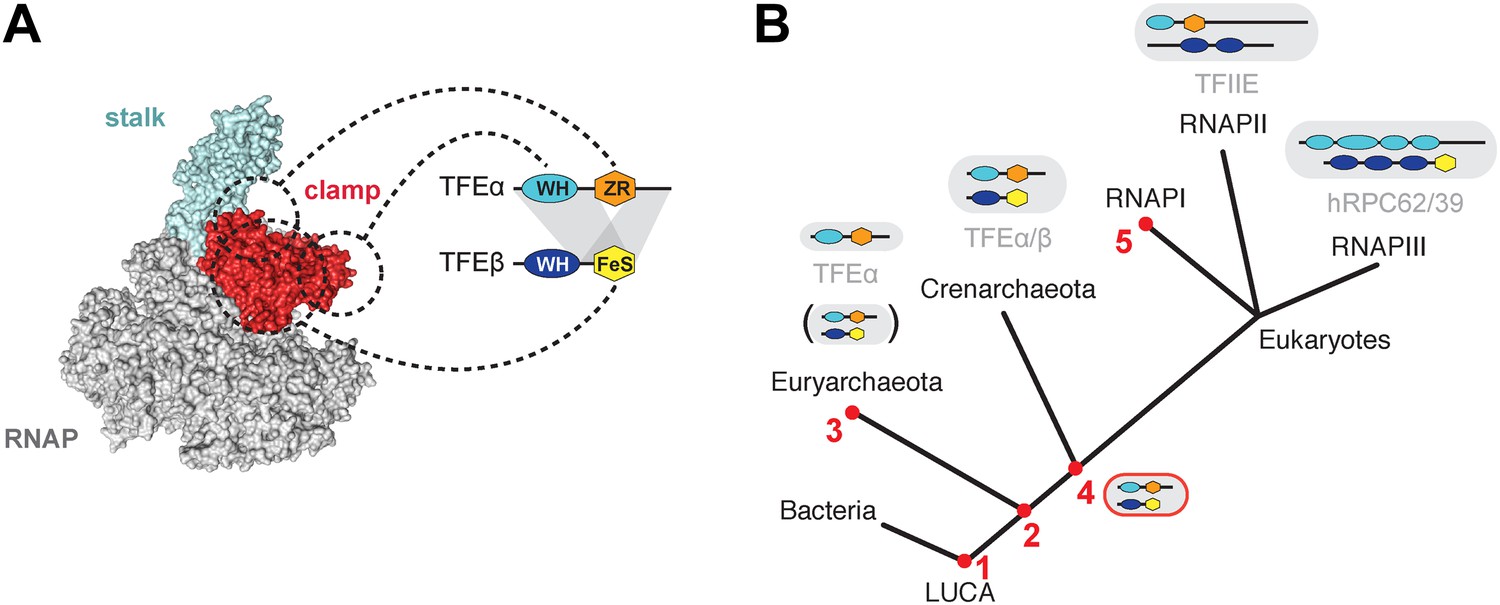
Structure and evolution of TFEα/β.
(A) Model of the dimerization interface of TFEα/β and its interaction with the RNAP clamp based on data presented here and elsewhere (Grohmann et al., 2011; Grünberg et al., 2012; He et al., 2013). Grey areas indicate domains of TFEα and β that are required for dimerization. Dashed lines indicate interactions between the WH and zinc ribbon domains of TFEα and the RNAP clamp. The FeS domain of TFEβ stabilizes the interaction with the RNAP clamp and might directly bind. (B) A scenario for the evolution of TFIIE-like proteins in archaea and eukaryotes under assumption of an archaeal origin of eukaryotes according to the ‘eocyte’ hypothesis (Guy and Ettema, 2011; Williams et al., 2013). Our model includes only Euryarchaeota and Crenarchaeota, the two most studied archaeal clades. Five key steps are indicated with red numbers: 1—TFEα and TFEβ WH domains are related to bacterial MarR-type WH domains indicating their early evolutionary origin (Aravind et al., 2005; Blombach et al., 2009). 2—The wide distribution of TFEα and TFEβ encoding genes indicate that both genes date back to the last common archaeal ancestor. 3—In several euryarchaeal species the TFEβ encoding gene was lost (Blombach et al., 2009) and all biochemically characterised euryarchaeal TFEα appear to function as monomeric factors. Nevertheless, dimeric TFEα/β may exist in other euryarchaeal species. 4—Latest possible emergence of the dimeric TFEα/β-like factor predating the split of Crenarchaeota and the ‘archaeal parent’ of eukaryotes. After gene duplication, this precursor evolved to give rise to TFIIE in the RNAPII transcription machinery and the RNAPIII subcomplex hRPC62/39. 5—Eukaryotic RNAPI has lost its dependence on TFIIE-like factors.
Tables
Table 1
Genetic experiments showing that the TFEβ encoding gene Saci_1342 is essential
| Parental strain | Plasmid integration relative to Saci_1342 | Number of clones tested | Clones with Saci_1342 deletion obtained |
|---|---|---|---|
| MW001 | upstream | 40 | 0 |
| downstream | 40 | 0 | |
| MW001 Saci_1162::Saci_1342 | upstream | 10 | 4 |
| downstream | 10 | 0 |
-
Table 1—source data 1
Genetic experiments showing that the TFEβ encoding gene Saci_1342 is essential
- https://doi.org/10.7554/eLife.08378.007
Additional files
-
Supplementary file 1
List of plasmids generated by restriction enzyme-based cloning.
- https://doi.org/10.7554/eLife.08378.022
-
Supplementary file 2
List of plasmids generated by PCR-based Site-directed mutagenesis.
- https://doi.org/10.7554/eLife.08378.023
-
Supplementary file 3
List of oligonucleotides used in this study.
- https://doi.org/10.7554/eLife.08378.024
-
Supplementary file 4
List of in vitro transcription templates with promoters fused to a C-less cassette.
- https://doi.org/10.7554/eLife.08378.025
Download links
A two-part list of links to download the article, or parts of the article, in various formats.
Downloads (link to download the article as PDF)
Open citations (links to open the citations from this article in various online reference manager services)
Cite this article (links to download the citations from this article in formats compatible with various reference manager tools)
Archaeal TFEα/β is a hybrid of TFIIE and the RNA polymerase III subcomplex hRPC62/39
eLife 4:e08378.
https://doi.org/10.7554/eLife.08378


