Signal transducer and activator of transcription 5 (STAT5) paralog dose governs T cell effector and regulatory functions
- National Institutes of Health, United States
Figures
Figure 1
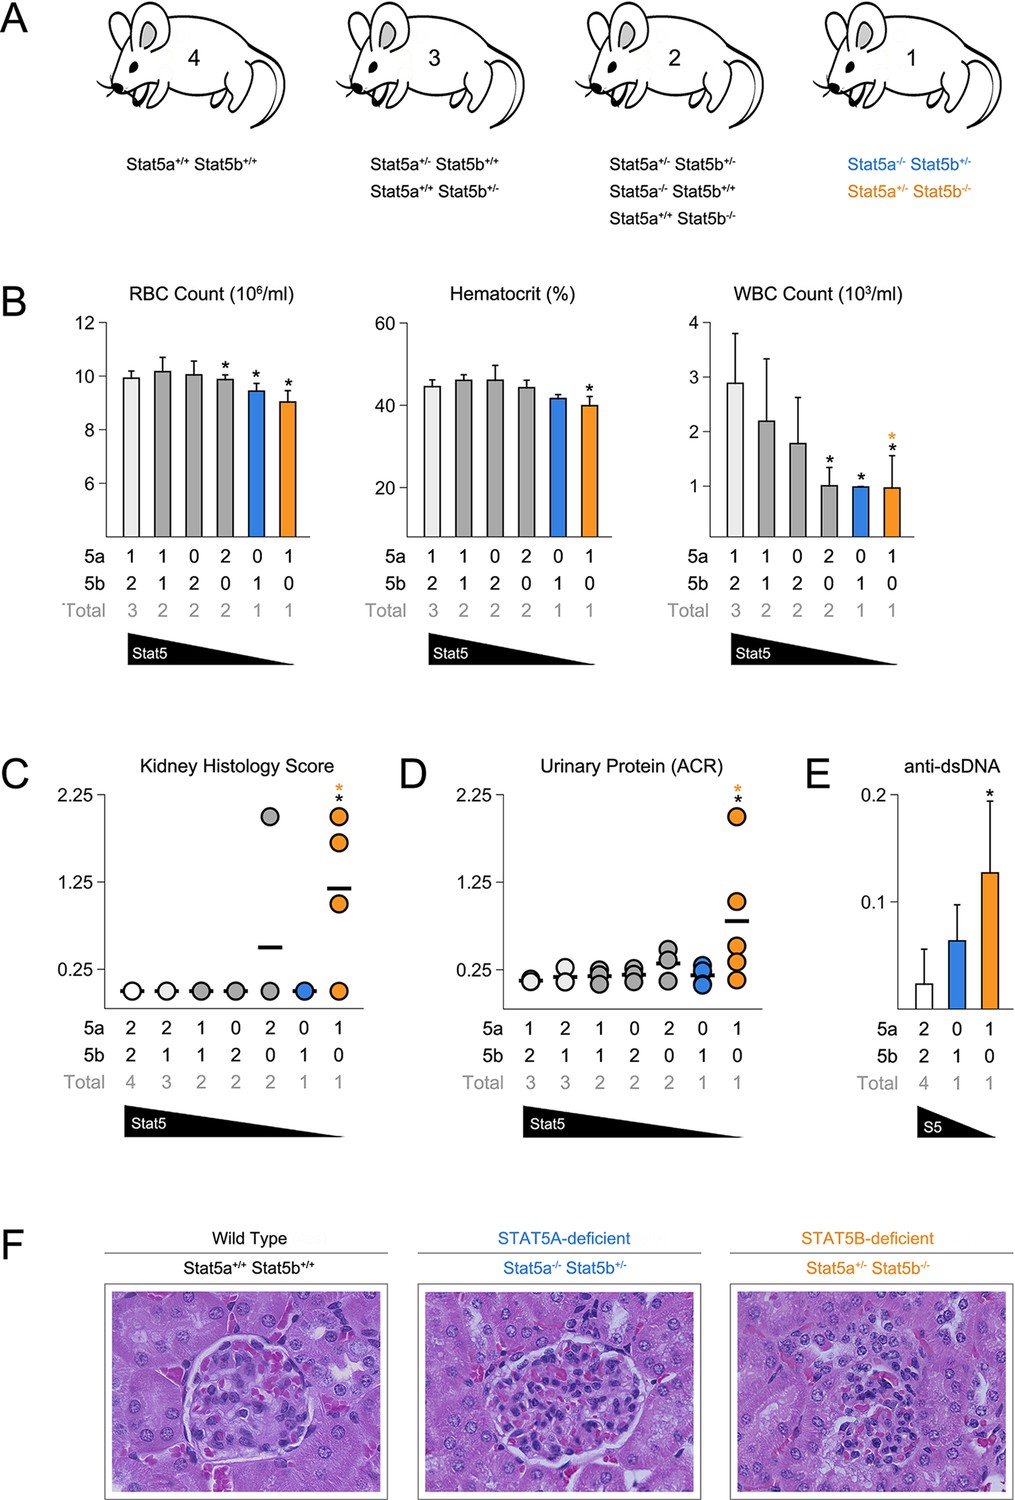
Stat5b is required for immunological tolerance.
(A) Cartoon depicts the mutant mice used in this study. Genotypes are grouped according to total Stat5 alleles. (B) Bar graphs show averaged RBC, hematocrit and WBC counts. (C) Scatter plot shows kidney pathology scores. (D) Scatter plot shows urinary albumin/creatinine protein ratios. (E) Bar graph shows ELISA measurements (O.D.) for anti-double stranded DNA antibodies in serum. (F) Micrographs show representative H & E kidney sections (40X magnification). (B–E) Number of Stat5a, Stat5b and total Stat5 alleles (i.e. genotype) is explained in the key below each graph. Data are compiled from 3–5 mice per genotype. Error bars indicate standard deviation.
Figure 2
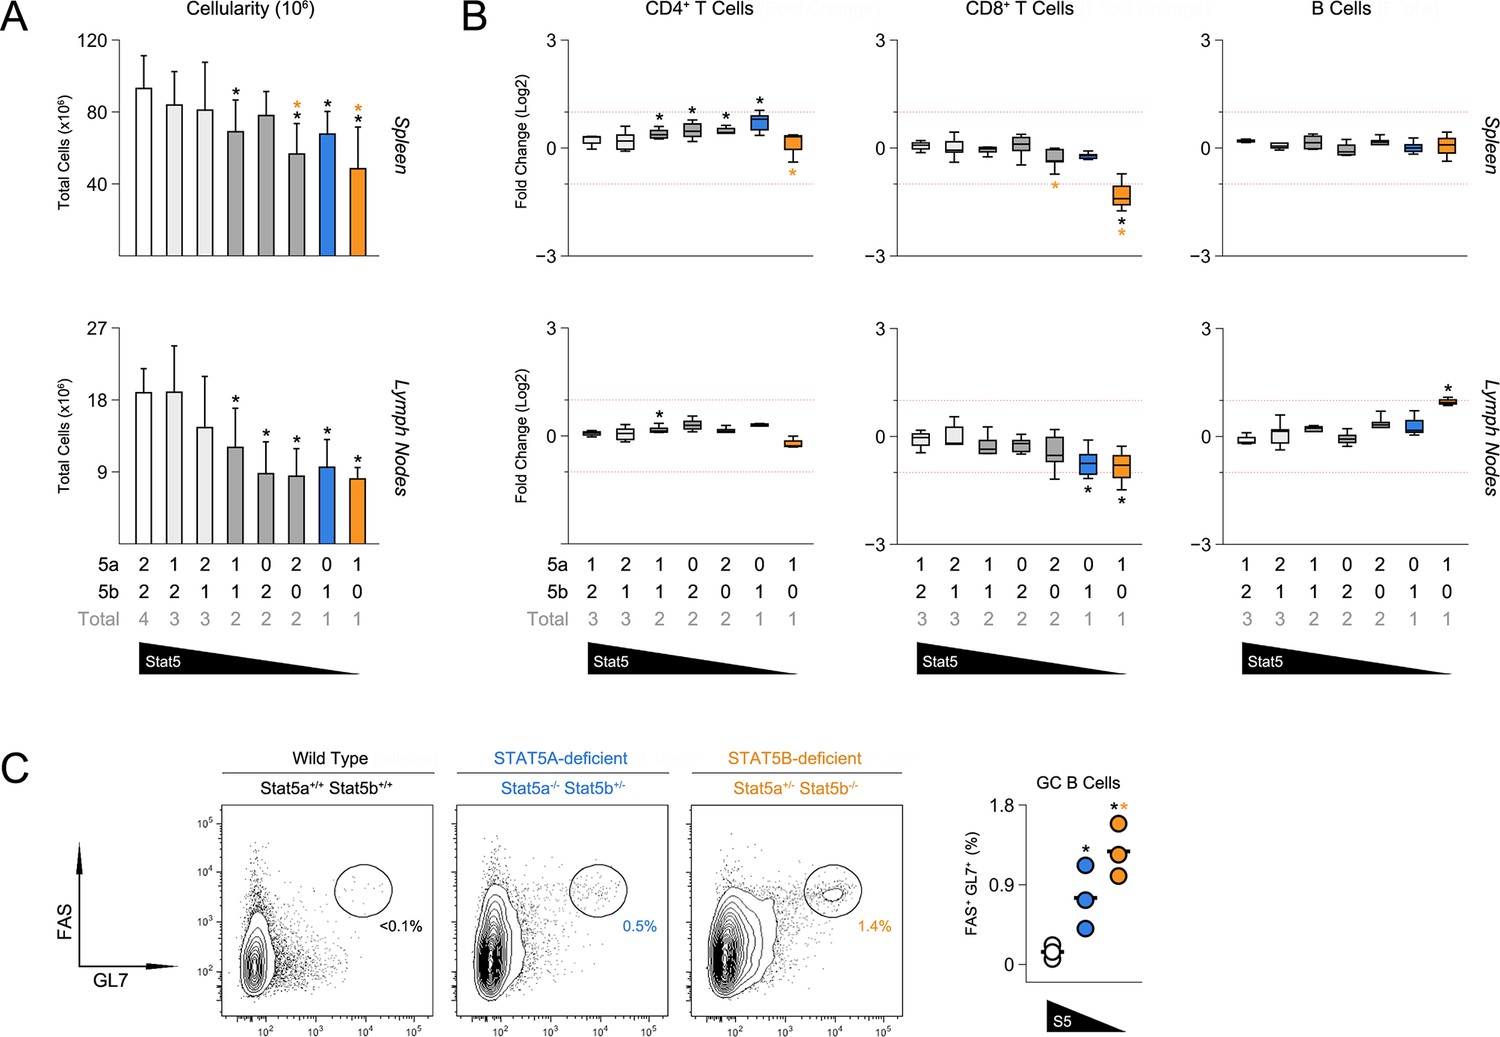
Impact of STAT5 paralog deficiency on B and T cells.
(A) Bar graphs show averaged cell counts for spleens (top row) and lymph nodes (bottom row). Error bars indicate standard deviation. (B) Percentages of CD4+ T cells (CD3+ CD4+ CD8α-), CD8+ T cells (CD3+ CD4- CD8α+) and B cells (CD3- B220+) were measured in spleens (top row) and LNs (bottom row). Box plots show log2 fold changes relative to wild type controls (WT=0; not shown). Dotted red lines indicate two-fold changes. (A–B) Number of Stat5a, Stat5b and total Stat5 alleles is explained in the key below each graph. Data are compiled from 5 experiments. (C) Contour plots show percentages of GL7+ Fas+ germinal center B cells in lymph nodes. Scatter plot shows percentages of LN resident GC B cells compiled from 3 experiments (3–4 mice per group). Genotypes are ordered as in Figure 1E (WT mice = white, one-allele Stat5a-deficient mice = blue, one-allele Stat5b-deficient mice = orange).
Figure 3 with 1 supplement

Aberrant effector T cell responses in the absence of Stat5b.
(A) Contour plots show percentages of CD44low IL-7R+naive and CD44high effector/memory CD4+ T cells in the spleens of 8 week-old mice. (B) Scatter plots show percentages of naive CD4+ T cells in spleens (left) and lymph nodes (right). Genotypes are ordered as in Figure 1C. (C) Contour plots show percentages of IFN-ɣ+ or IL-17+ CD4+ T cells in the spleens of 8 week-old mice. (D) Box plots show log2 fold changes for IFN-ɣ+ and IL-17+ cells relative to wild type controls (WT=0; not shown). (E) Contour plots show percentages of PD1+ CXCR5high Tfh cells in the spleens of 8 week-old mice. (F) Box plots show log2 fold changes for Tfh cells in spleens (left) and LNs (right) relative to wild type controls (WT=0; not shown). (D and F) Genotypes are ordered as in Figure 1D. Data are compiled from 4 experiments (3–6 mice/group). Dotted red lines indicate two-fold changes.
Figure 3—figure supplement 1
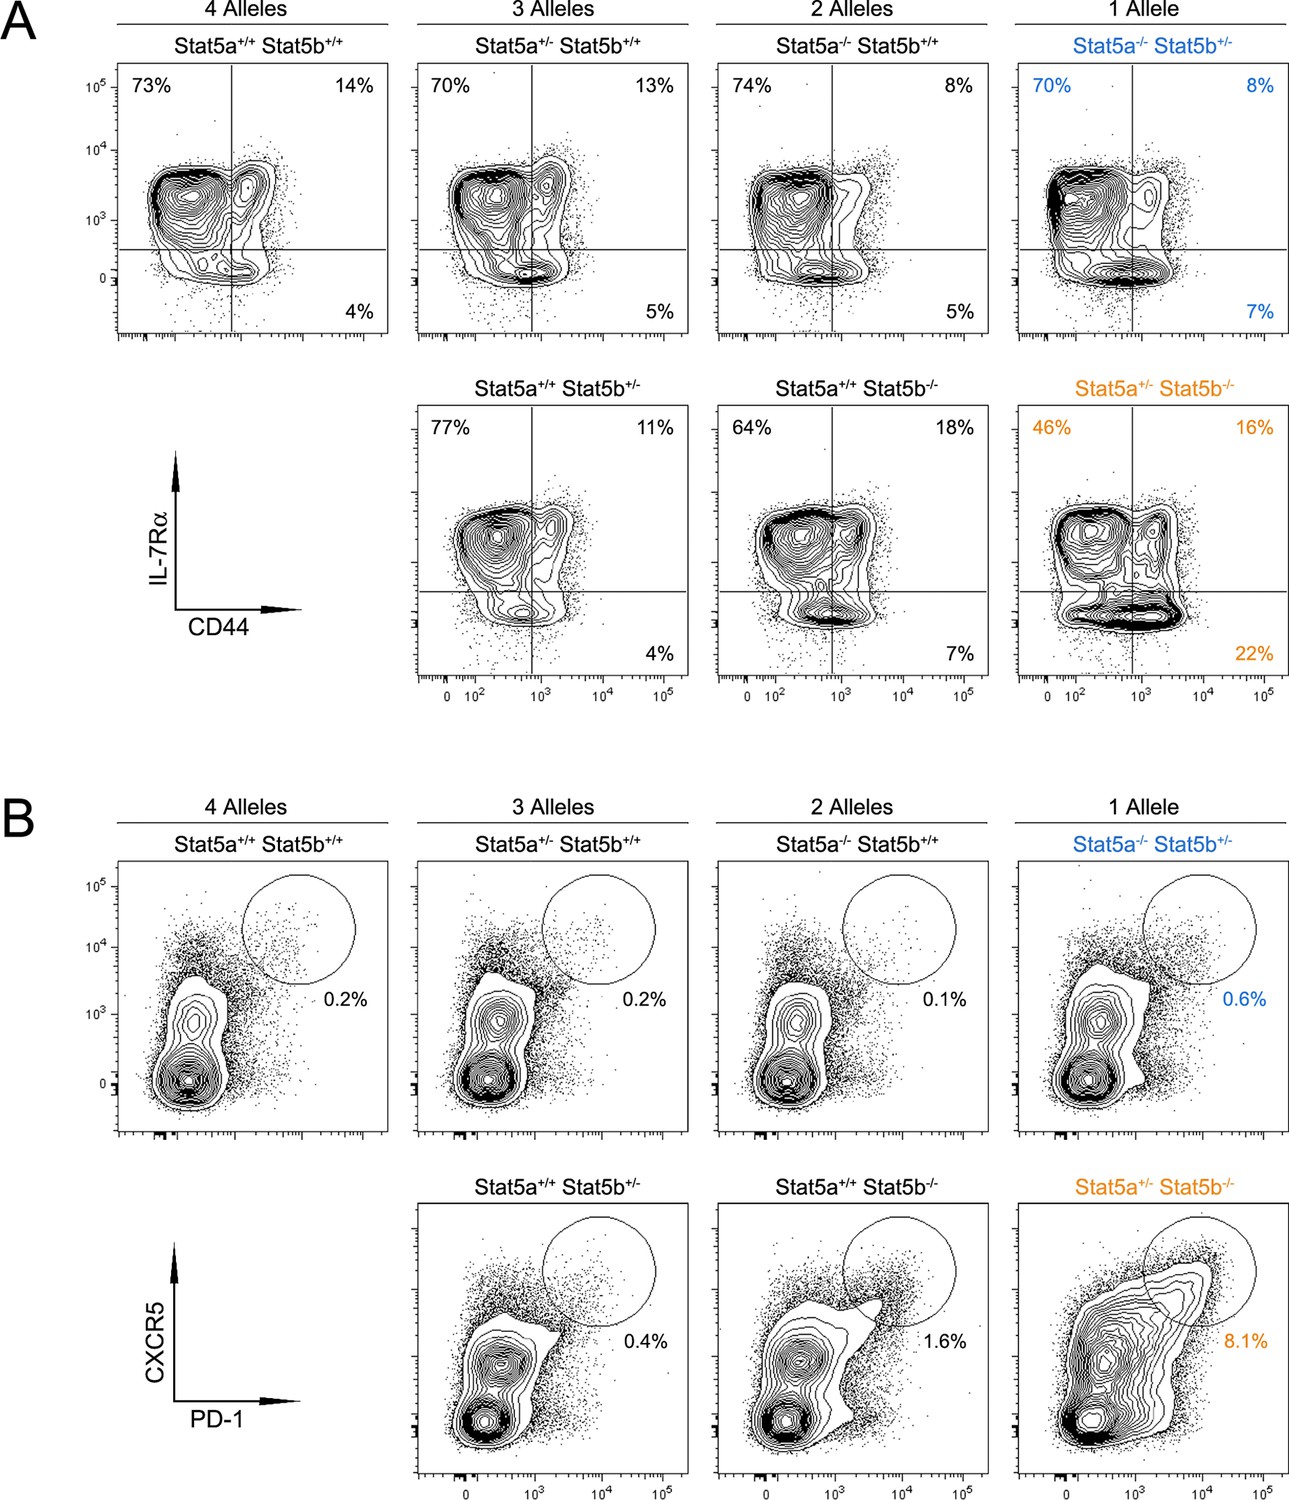
Impact of Stat5 allele depletion on effector T cell responses.
(A) Contour plots show percentages of CD44low IL-7R+ naive and CD44high effector/memory CD4+ T cells. (B) Contour plots show percentages of PD1+ CXCR5high T follicular helper cells. (A and B) Data are from spleens of 8 week-old mice and are representative of 4–5 experiments.
Figure 4 with 1 supplement
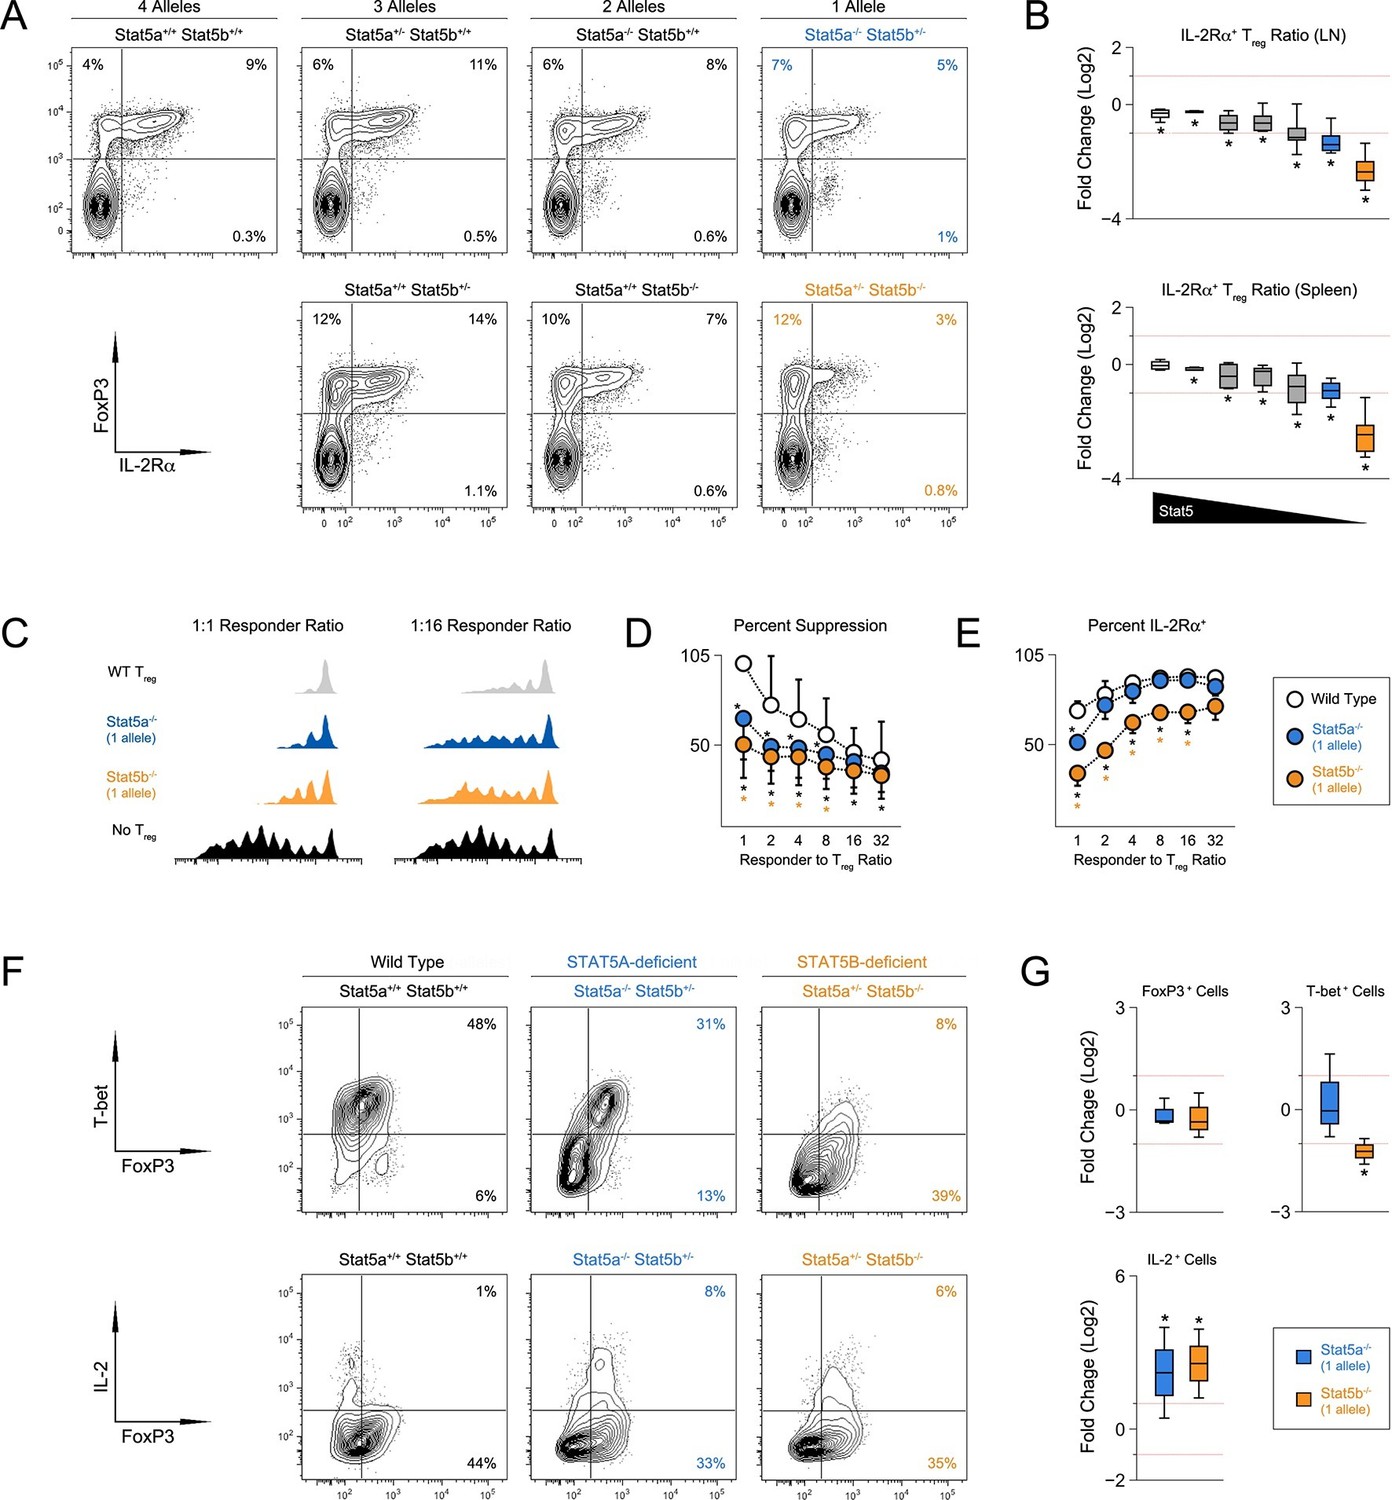
T regulatory cell function is impaired in Stat5b-deficient mice.
(A) Contour plots show percentages of IL-2Rα+ cells within the FOXP3+ Treg compartment in spleens of 8 week-old mice. (B) Box plots show log2 fold changes in the ratio of IL-2Rα+/IL-2Rα- Treg (WT=0; not shown). LN (top) and spleen (bottom) data are compiled from 5 experiments (4–6 mice/group) and genotypes ordered as in Figure 1D. (C) IL-2Rα+ Treg cells from WT and Stat5a- or Stat5b-deficient mice were used for in vitro suppression assays. Histograms show CFSE dilution of responder T cells. (D) Line graph shows percent suppression across a range of responder:Treg ratios. Baseline is set according to WT controls at a 1:1 ratio. Data are compiled from 3 experiments. (E) Line graph shows the percent Treg cells that remained IL-2Rα+ during in vitro suppression. (F) IL-2Rα+ Treg cells were cultured with IL-2 for 72 hr. Contour plots show the percentage of FOXP3+ Treg cells expressing TBX21 (top) or IL-2(bottom). (G) Box plots show log2 fold changes for TBX21+, FOXP3+ and IL-2+ cells relative to wild type controls (WT=0; not shown). Data are compiled from 3 experiments. Dotted red lines indicate two-fold changes.
Figure 4—figure supplement 1

Impact of Stat5 allele depletion on Treg cells.
Bar graphs show total numbers of Treg cells in spleens and LNs of 8 week old mice (4–6 mice per genotype). Number of Stat5a, Stat5b and total Stat5 alleles (i.e. genotype) is explained in the key below each graph. Error bars indicate standard deviation.
Figure 5
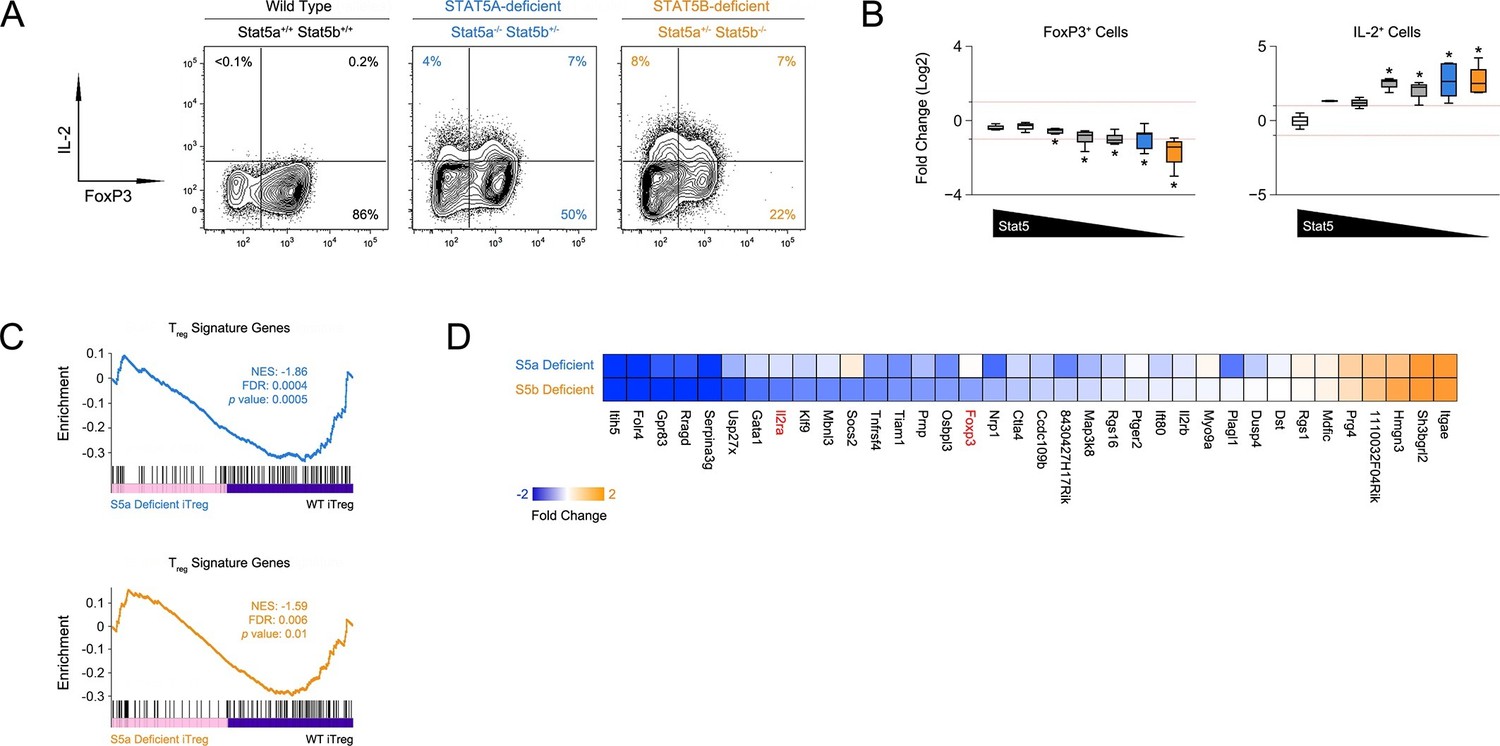
Defective iTreg differentiation in the absence of Stat5b.
(A) Naive CD4+ T cells were cultured under iTreg-inducing conditions. Contour plots show percentages of FOXP3+ and IL-2+ cells. (B) Box plots show log2 fold changes for FOXP3+ and IL-2+ cells relative to wild type controls (WT=0; not shown). Data are compiled from 3 experiments and genotypes ordered as in Figure 1D. (C) Naive T cells from one-allele Stat5a- or Stat5b-deficient mice were cultured as in (A) and processed for RNA-seq. GSEA plots show enrichment of Treg signature genes within the Stat5a-deficient (top) or Stat5b-deficient (bottom) datasets relative to WT controls. (D) Heat map shows a selection of STAT5-regulated, Treg signature transcripts. Data are presented as log2 fold changes relative to WT controls (not shown). RNA-seq analyses are compiled from 2 biological replicates per genotype.
Figure 6 with 2 supplements
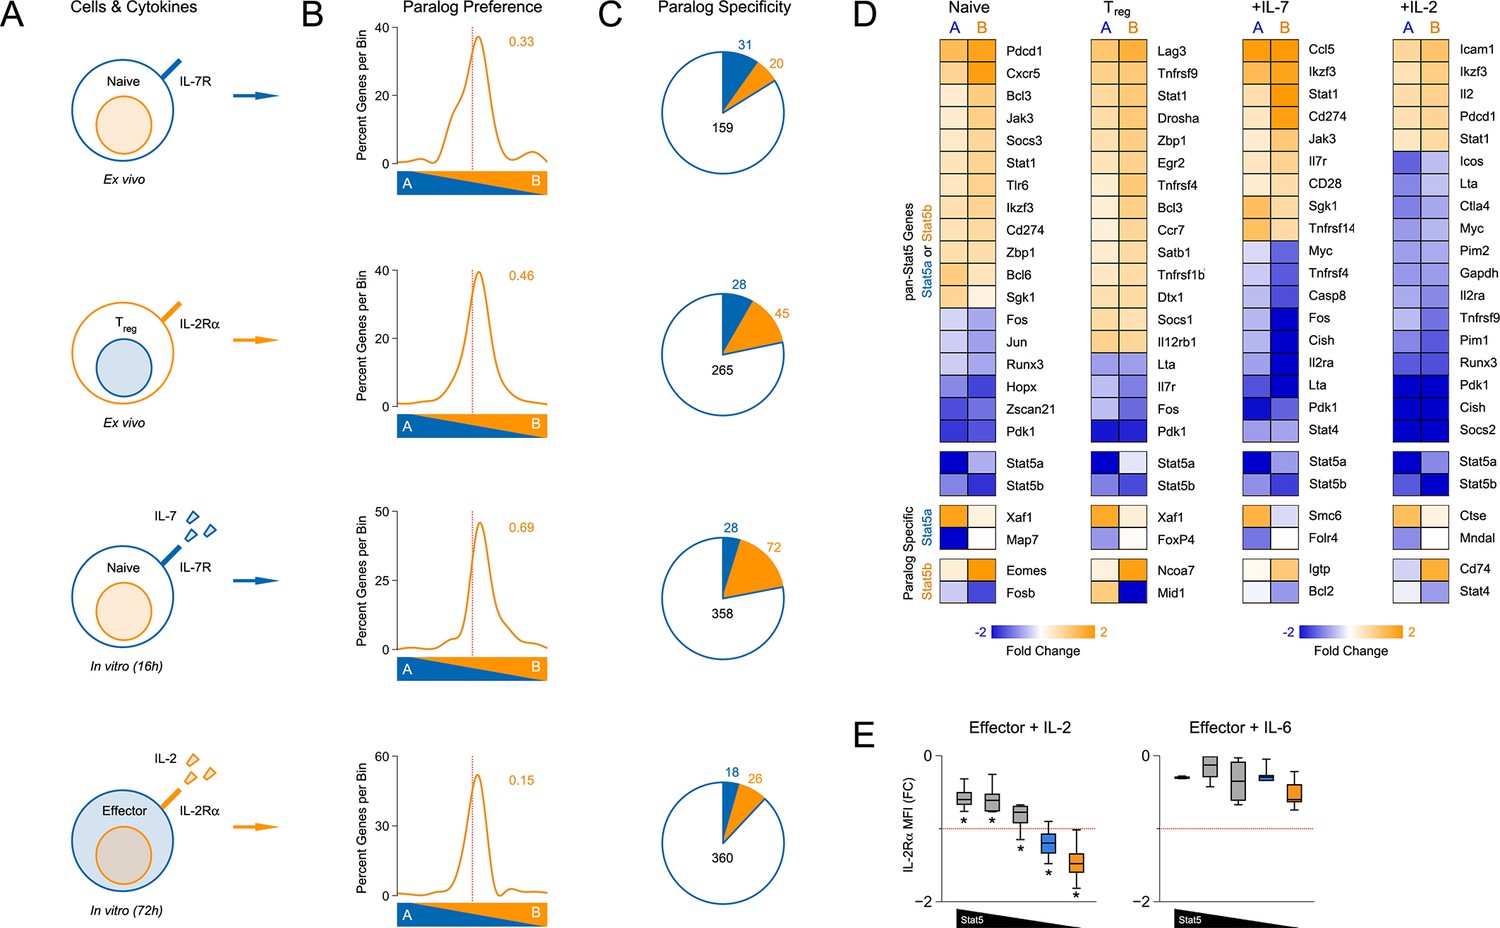
Redundancy and specificity of STAT5 paralogs for gene transcription.
(A) Cartoons depict the cell types and experimental conditions used for RNA-seq. (B) Histograms show STAT5 paralog preference for all STAT5-regulated transcripts. Those which were more influenced by the loss of Stat5a are positioned to the left (X<0) while those that were more influenced by the loss of Stat5b are positioned to the right (X>0). Dotted red lines denote equivalence (X=0) and numbers indicate median paralog preference. (C) Pie charts depict paralog-specific transcripts. Those impacted only in Stat5a-deficient cells are indicated in blue, those impacted only in Stat5b-deficient cells are indicated in orange and those impacted in both genotypes are indicated in black. (D) Heat maps show a selection of STAT5-regulated transcripts. Data are presented as the log2 fold change relative to WT controls (not shown). (E) IL-2Rα protein was measured in T cells treated with IL-2 (left) or IL-6 (right). Box plots show log2 fold changes for mean fluorescence intensity relative to wild type controls (WT=0; not shown). Genotypes are ordered as in Figure 1D. Dotted red lines indicate a two-fold change. (A–D) RNA-seq analyses are compiled from 2–3 biological replicates per genotype.
Figure 6—figure supplement 1
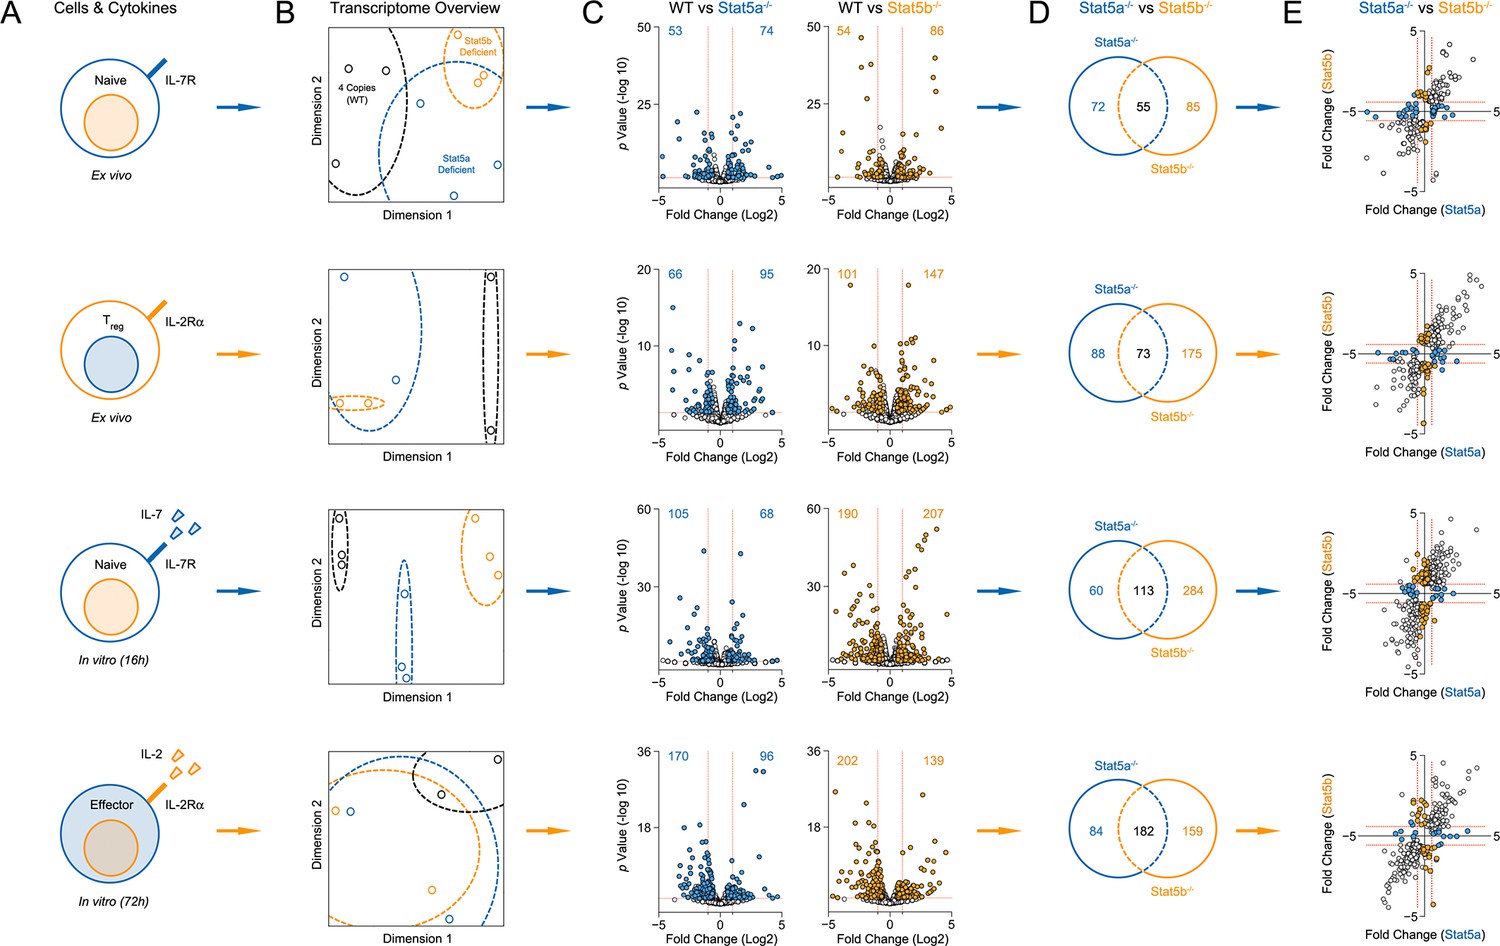
Transcriptomic analysis of Stat5a- and Stat5b-deficient T cells.
(A) Cartoons depict the experimental conditions used for RNA-seq. CD4+ T cells were purified from WT and one-allele Stat5a- or Stat5b-deficient mice, then transcriptomes measured either directly ex vivo or after in vitro treatment with acute STAT5 stimuli. The ex vivo set included naive cells (first row) and IL-2Rα+ Treg cells (second row), while the in vitro set included naive cells exposed to IL-7 (third row) and effector cells exposed to IL-2 (fourth row). (B) Multidimensional scaling (MDS) plots show the overall relatedness between experimental groups. Each biological replicate is represented by black (WT), blue (Stat5a-deficient) or orange (Stat5b-deficient) elements. (C) Volcano plots show fold changes and variances for all transcripts relative to WT controls. Those exhibiting >1.5 fold change and p<0.05 are highlighted. Numbers indicate the sum of transcripts that were down-regulated (upper left) or up-regulated (upper right) in Stat5a- or Stat5b-deficient cells. Dotted red lines are drawn at 2 fold changes and 0.05 p values. (D) Venn diagrams indicate the number of transcripts exhibiting >1.5 fold change and <0.05 p values only in Stat5a-deficient cells (blue), only in Stat5b-deficient cells (orange) or in both genotypes (black). (E) XY plots show log 2 fold change for STAT5-regulated genes in Stat5a-deficient (x axis) versus Stat5b-deficient (y axis) cells. Blue and orange elements represent transcripts designated as STAT5A- or STAT5B-specific, respectively. Dotted red lines are drawn at 1.5 fold changes. (A–-E) Analyses are compiled from 2 to 3 biological replicates per genotype.
Figure 6—figure supplement 2
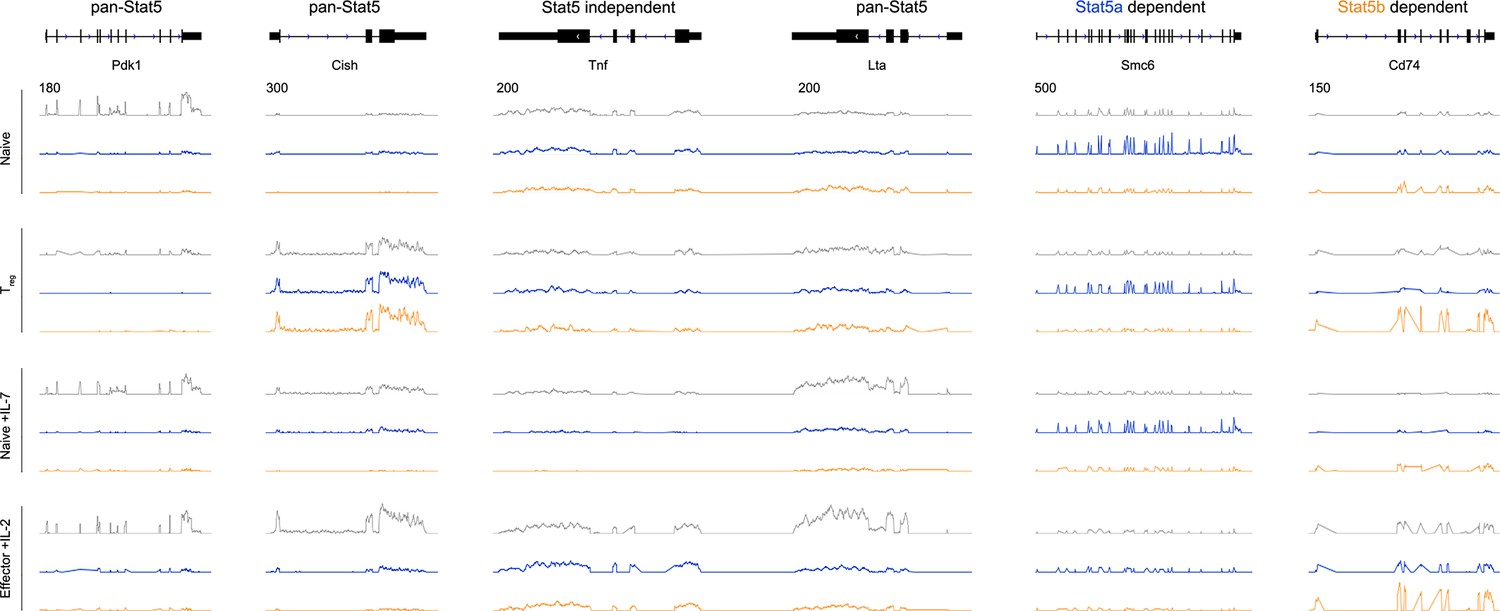
Transcriptomic analysis of Stat5a- and Stat5b-deficient T cells.
Genome browser tracks show transcript abundance in WT (grey), Stat5a-deficient (blue) or Stat5b-deficient (orange) cells. Vertical RPKM scale varies from gene to gene (but not across experimental conditions) and is denoted by the numbers at the upper left of each column. Shown is one of 2–3 biological replicates per genotype.
Figure 7 with 2 supplements
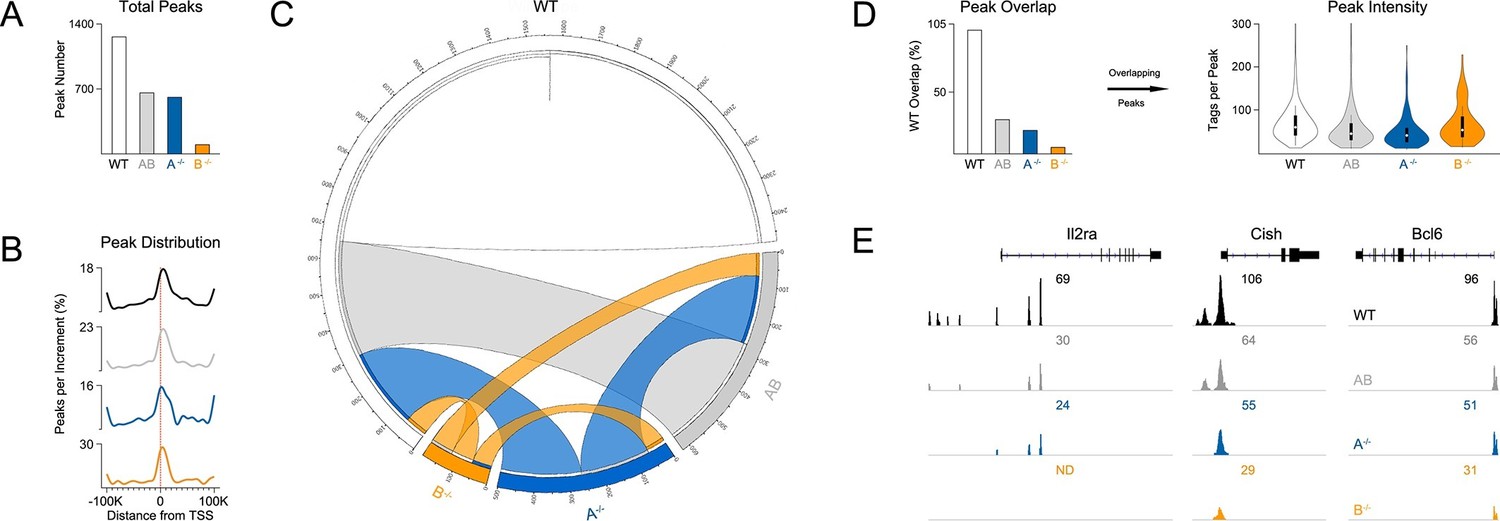
Influence of paralog dose on genomic distribution of STAT5.
(A) CD4+ T cells from WT, Stat5a/bhet and two-allele Stat5a- or Stat5b-deficient mice were cultured in the presence of IL-2, then processed for pan-STAT5 ChIP-seq. Bar graph shows the total number of STAT5-bound peaks in each genotype. (B) Histogram shows distribution of STAT5-bound peaks relative to transcriptional start sites (TSS). (C) Circos plot shows overlap of STAT5-bound beaks across genotypes. Connection width represents the number of overlapping peaks. Only peaks shared with WT cells are shown. Those found only in WT cells are presented as a white semi-circle at the top. (D) Bar graph shows the percentage of WT peaks detected in each genotype (WT=100%). Violin plot depicts the total number of sequenced tags (i.e. peak intensity) for peak shared with WT controls. (E) Genome browser tracks show STAT5 peaks near selected genes. Numbers indicate the maximum peak height within the interval. (A–E) Data are representative of two biological replicates.
Figure 7—figure supplement 1
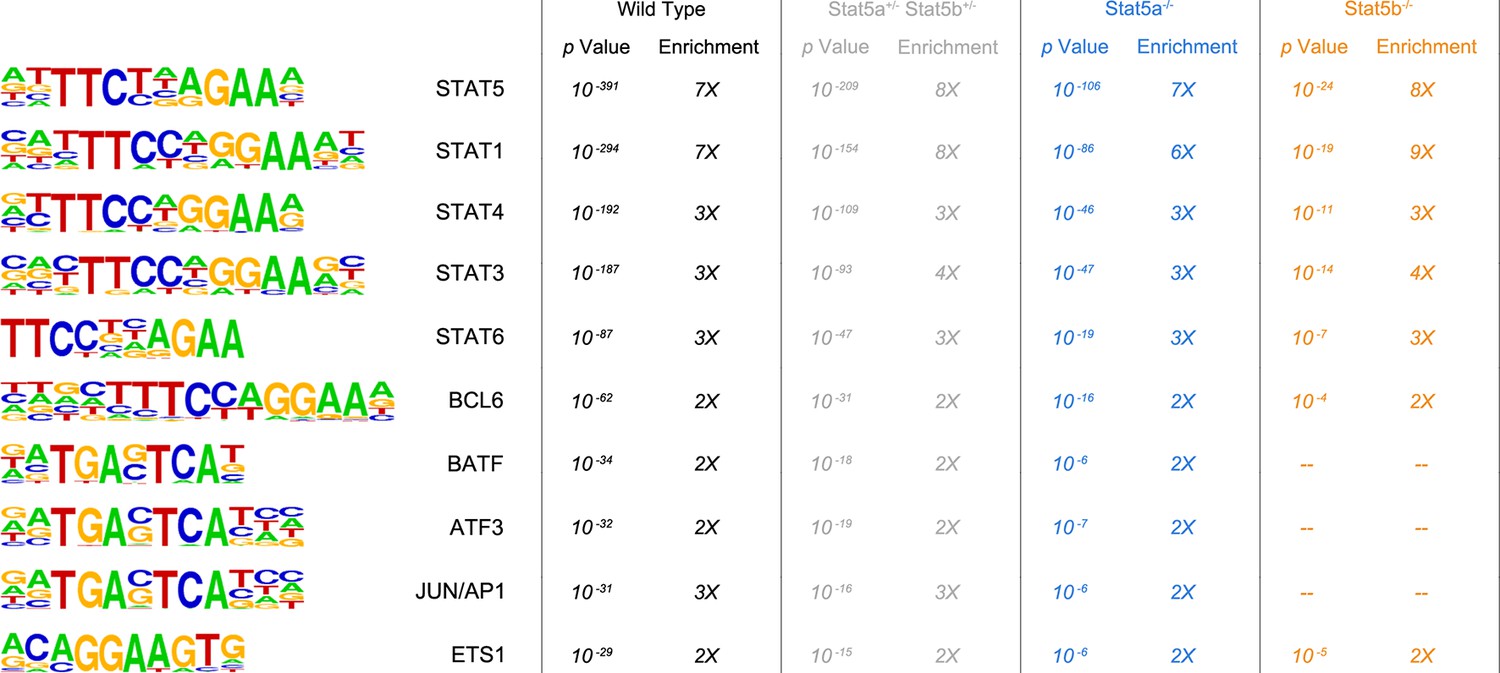
Transcription factor motifs associated with STAT5 binding peaks.
CD4+ T cells were isolated from WT, Stat5a/bhet and two-allele Stat5a- or Stat5b-deficient mice, then cultured in the presence of IL-2 and processed for ChIP-seq. Chart shows the top ten transcription factor-binding motifs associated with STAT5 peaks in each genotype. p Values and enrichment (% STAT5 peaks with indicated motif ÷% random peaks with indicated motif) are shown for one of two biological replicates.
Figure 7—figure supplement 2
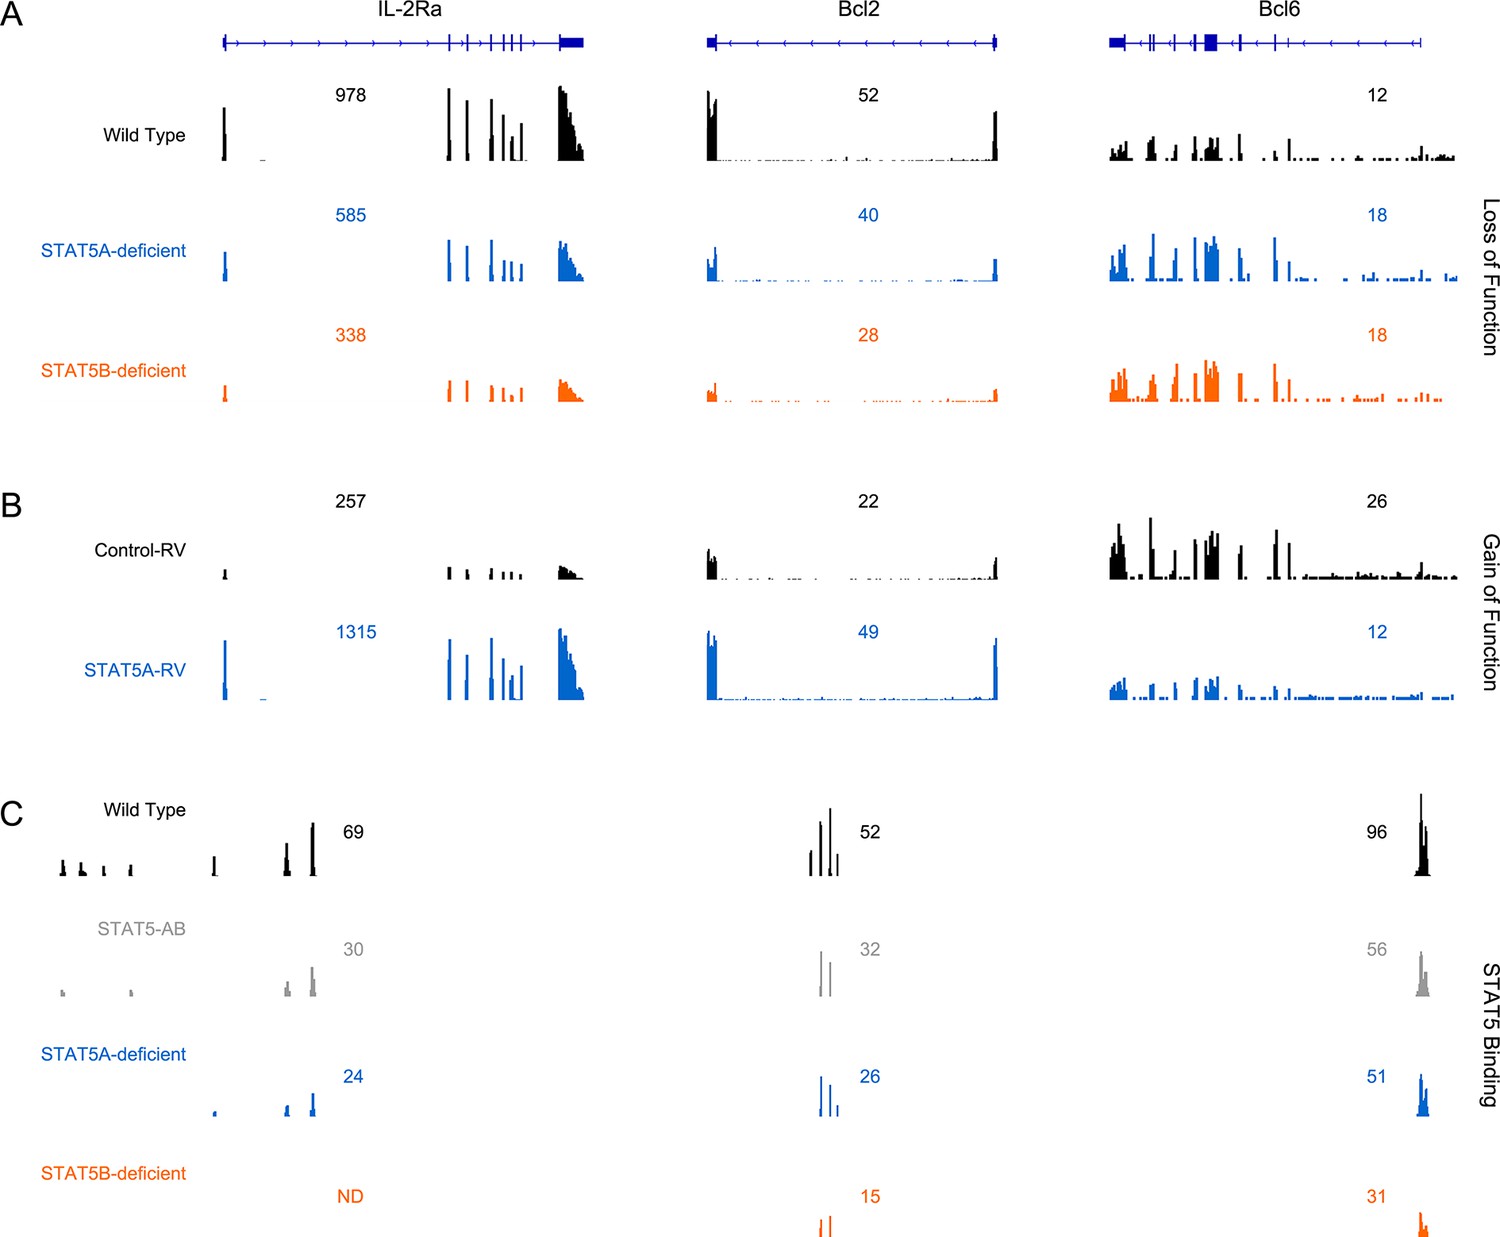
Correlation between STAT5 binding and transcription of Il2ra, Bcl2 and Bcl6.
(A) Effector CD4+ T cells from one-allele Stat5a- or Stat5b-deficient mice were cultured in the presence of IL-2 and processed for RNA-seq. (B) Effector CD4+ T cells from one-allele Stat5b-deficient mice were transduced with control or STAT5A-expressing retrovirus and processed for RNA-seq. (C) Effector CD4+ T cells from WT, Stat5a/bhet and two-allele Stat5a- or Stat5b-deficient mice were cultured in the presence of IL-2 and processed for ChIP-seq. (A–C) Genome browser tracks show transcript abundance or STAT5 binding for selected genes. Numbers indicate either RPKM values for the most detected exon (RNA-seq) or maximum STAT5-binding peak intensity within the interval (ChIP-seq). Shown is one of two biological replicates for each genotype and/or experimental condition.
Figure 8

Preservation of high affinity targets in the absence of STAT5B.
Circle plot relates STAT5 occupancy and STAT5-dependent transcription for genes bound in: (1) only WT cells (white circle), (2) WT and Stat5a/bhet, cells (grey circle), (3) WT, Stat5a/bhet, and Stat5a-/- cells (blue circle), (4) WT, Stat5a/bhet, Stat5a-/- and Stat5b-/- cells (orange circle). STAT5 ChIP-seq peaks were assigned to genes based on proximity to transcriptional start sites (+/- 10 kb). X axis denotes the average height of gene-associated peaks in WT cells. Y axis denotes the average mRNA expression variance (-log10 p value) for the corresponding peak-associated genes. Variance is derived from the comparison WT and one-allele Stat5a- or Stat5b-deficient cells cultured in the presence of IL-2 (from Figure 6). Size of each circle represents the total number of gene-associated peaks in each group (number is shown).
Figure 9 with 3 supplements
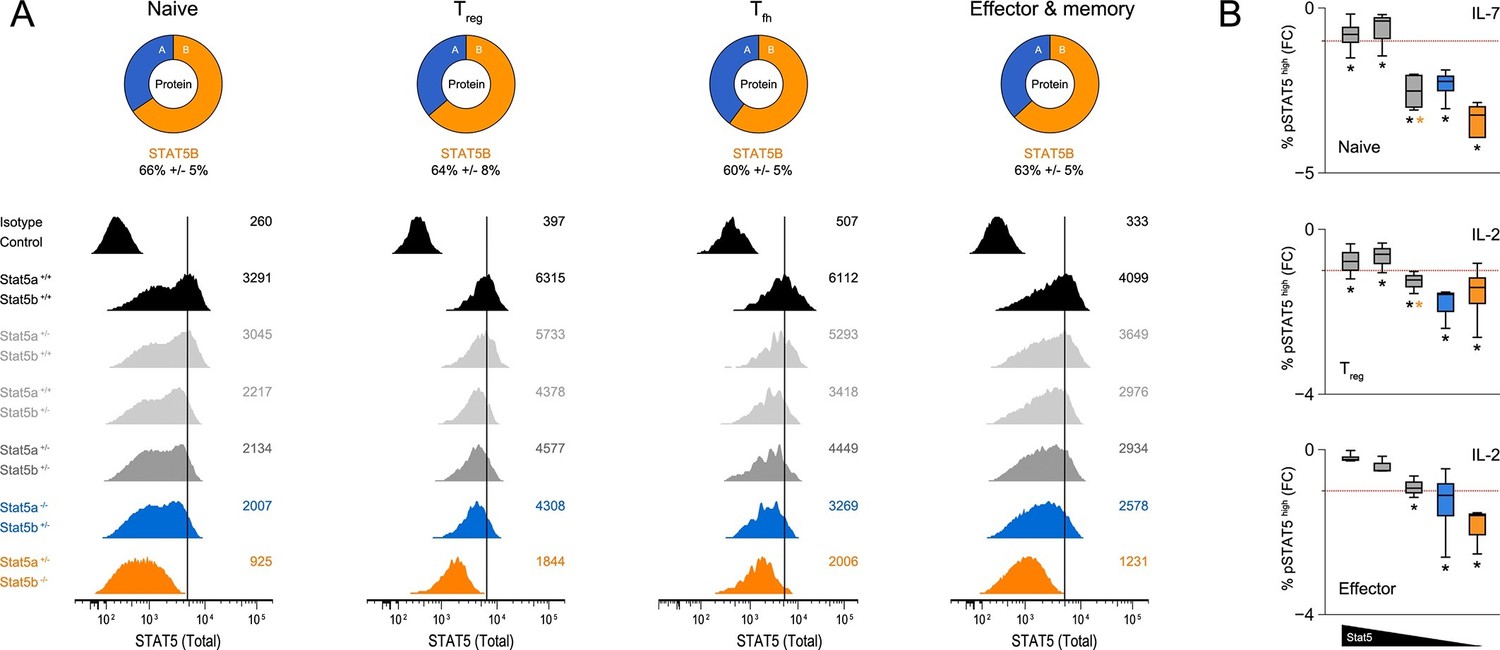
Relative abundance of STAT5A and STAT5B in helper T cells.
(A) Total STAT5 protein was measured in naive, Treg, Tfh and effector/memory T cells. Donut charts indicate the percentage of total STAT5 protein accounted for by each paralog. Histograms show representative flow cytometry data from one of three experiments. (B) Naive, Treg and effector/memory T cells were treated with IL-2 or IL-7 and phospho-STAT5 measured by flow cytometry. Box plots show log2 fold changes for the percentage of p-STAT5high cells relative to wild type controls (WT=0; not shown). Genotypes are ordered as in Figure 1D. Dotted red lines indicate a two-fold change (3–4 replicates/group).
Figure 9—figure supplement 1
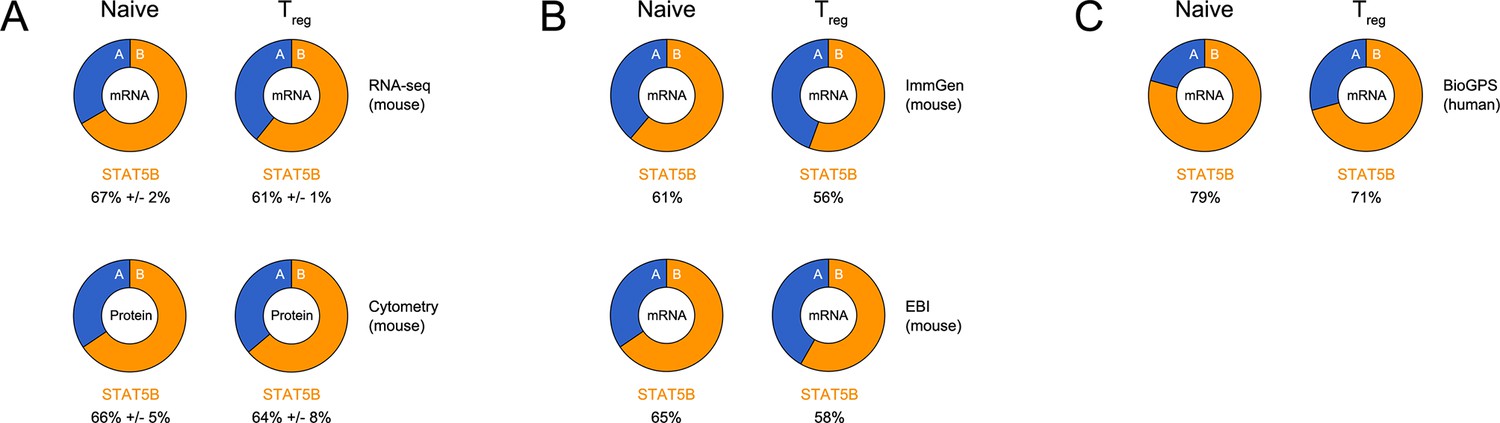
Relative abundance of STAT5A and STAT5B in helper T cells.
(A) Donut charts indicate the percentage total STAT5 mRNA (top) or protein (bottom) accounted for by each paralog in ex vivo naive or Treg cells. mRNA data are compiled from 2–3 RNA-seq replicates and protein data are compiled from 3 flow cytometry replicates (B) Donut charts indicate the percentage total STAT5 mRNA accounted for by each paralog in mouse naive or Treg cells. Data were sourced from the Immunological Genome Project (top) or the EMBL-EBI Expression Atlas (bottom). (C) Donut charts indicate the percentage total STAT5 mRNA accounted for by each paralog in human naive or Treg cells. Data were sourced from the BioGPS Primary Cell Atlas.
Figure 9—figure supplement 2
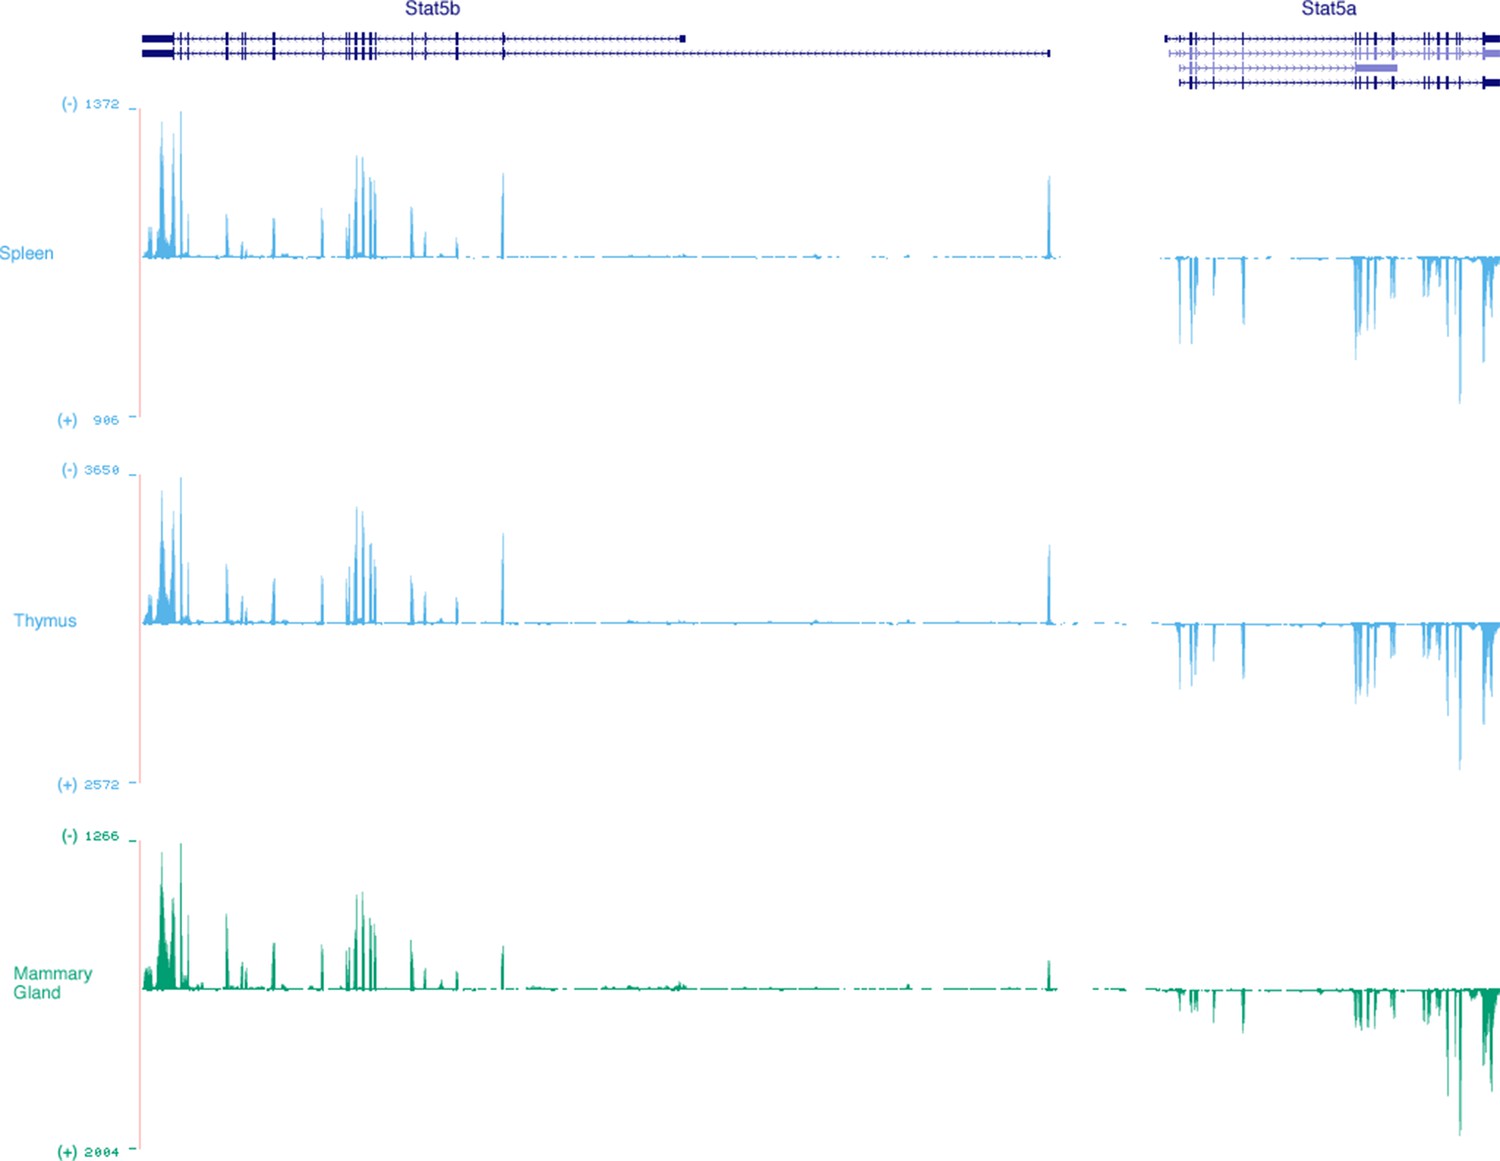
Stat5a and Stat5b are transcribed from opposite DNA strands.
Genome browser tracks show relative abundance and DNA strand origin of Stat5a and Stat5b mRNAs within mouse spleen, thymus and mammary gland. Transcripts originating from the minus (-) strand are presented in the ascending orientation while those from the plus (+) strand are in the descending orientation. Numbers indicate RNA-seq FPKM values for the most detected exon within the interval. Data are sourced from the ENCODE consortium and one of 2 biological replicates visualized using the UCSC genome browser.
Figure 9—figure supplement 3
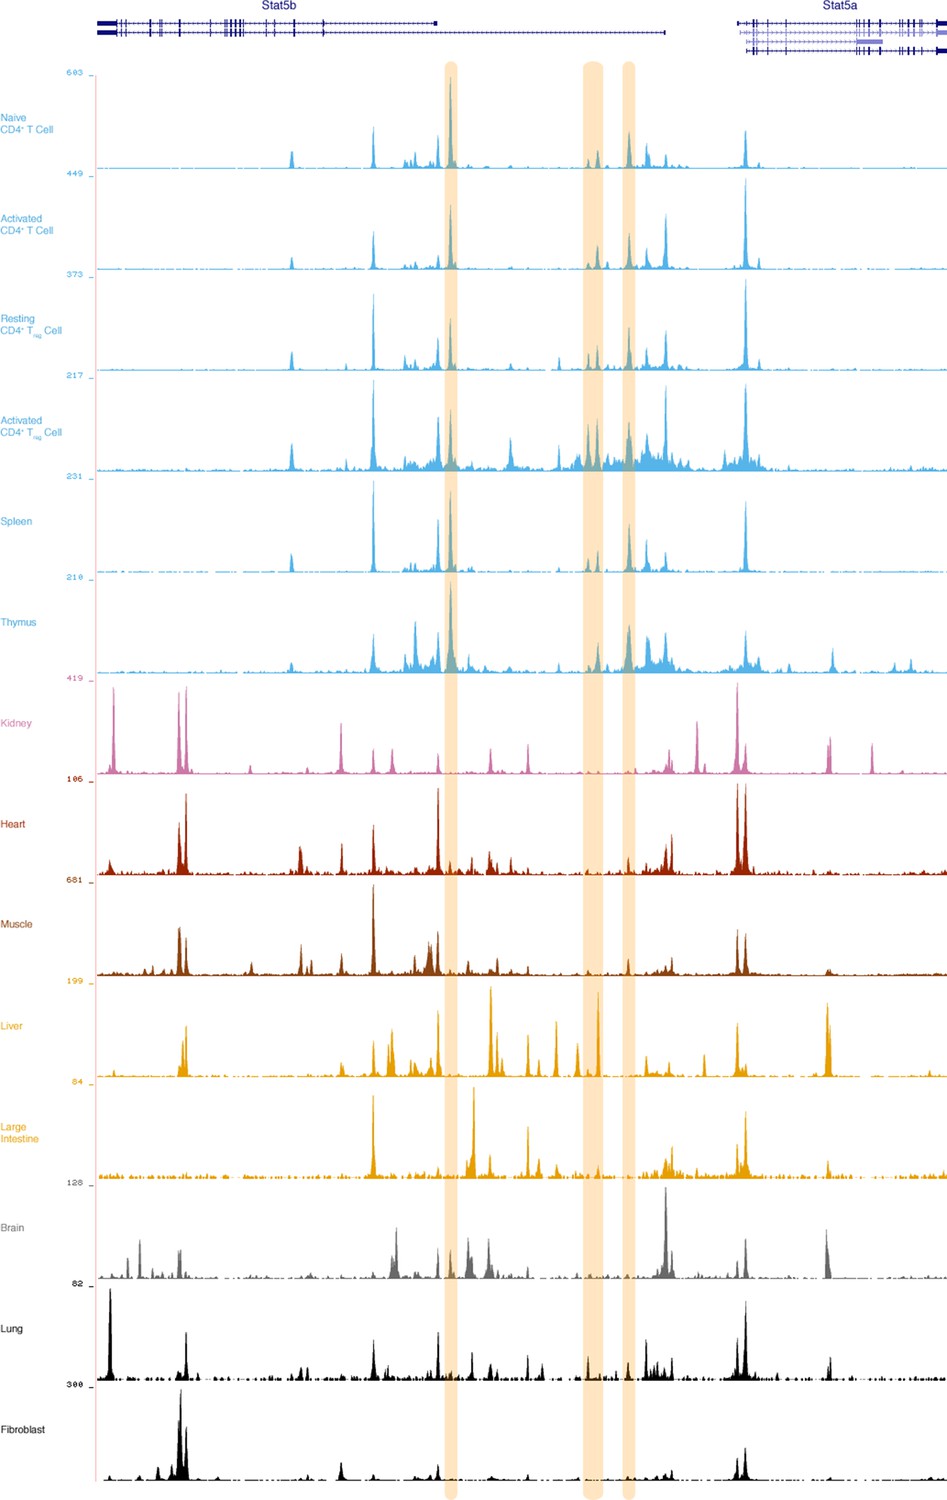
Putative lymphocyte-restricted enhancers within the Stat5a/b locus.
Genome browser tracks display DNAse I hypersensitivity sites (DHS) within the mouse Stat5a/b locus. Shown are data for primary CD4+ T cells (naive, activated, Treg), as well as spleen, thymus and multiple non-lymphoid tissues. 3 putative lymphoid-specific DHS sites are highlighted. Numbers indicate maximum tag count for all DHS sites within the interval. Data are sourced from the ENCODE consortium and one of 2 biological replicates visualized using the UCSC genome browser.
Figure 10 with 1 supplement
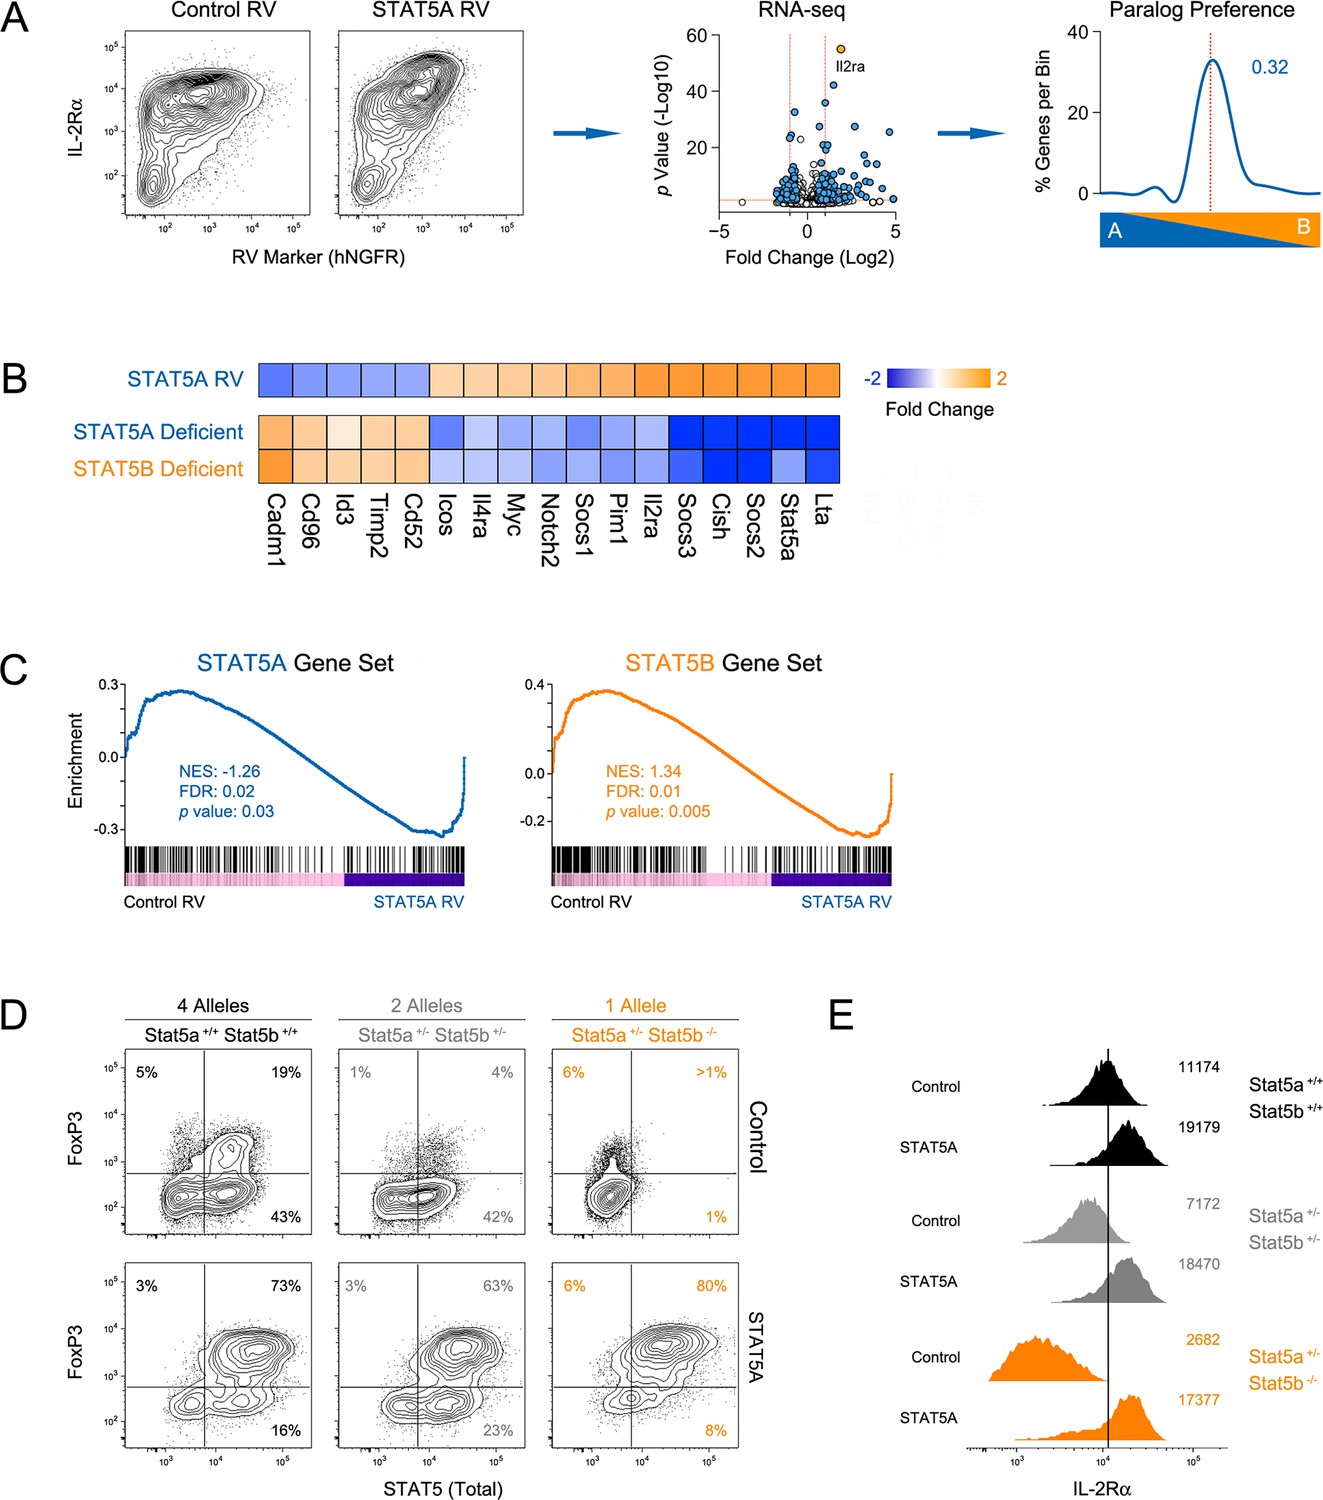
Paralog dose governs STAT5-driven gene transcription.
(A) CD4+ T cells from one-allele Stat5b-deficient mice were transduced with STAT5A retrovirus, then processed for RNA-seq. Contour plots (left) show correlation between the transduction marker (hNGFR) and IL-2Rα protein. Volcano plot (middle) shows log2 fold changes and variances for all transcripts relative to control retrovirus. Those exhibiting >1.5 fold change and p<0.05 are depicted in blue. Dotted red lines indicate 2 fold change and 0.05 p value. Histogram (right) shows STAT5 paralog preference for transcripts mobilized by ectopic STAT5A. Dotted red line denotes equivalence and number indicates median paralog preference. (B) Heat map shows selected transcripts in STAT5A-transduced helper T cells (top row) or IL-2 treated Stat5a- or Stat5b-deficient cells (bottom rows; from Figure 6). Data are presented as the log2 fold change relative to controls (not shown). (C) GSEA plots show enrichment of STAT5A-dependent (left) or STAT5B-dependent (right) genes within the STAT5A-RV dataset. (A–C). RNA-seq analysis is compiled from 2 biological replicates. (D) CD4+ T cells from WT, Stat5a/bhet and one-allele Stat5b-deficient mice were transduced with control (top row) or STAT5A (bottom row) retrovirus under iTreg polarizing conditions. Contour plots show total STAT5 and FOXP3 protein levels in transduced cells. (E) Histograms denote IL-2Rα protein levels on transduced cells. (D–E) Shown is one of two independent experiments.
Figure 10—figure supplement 1
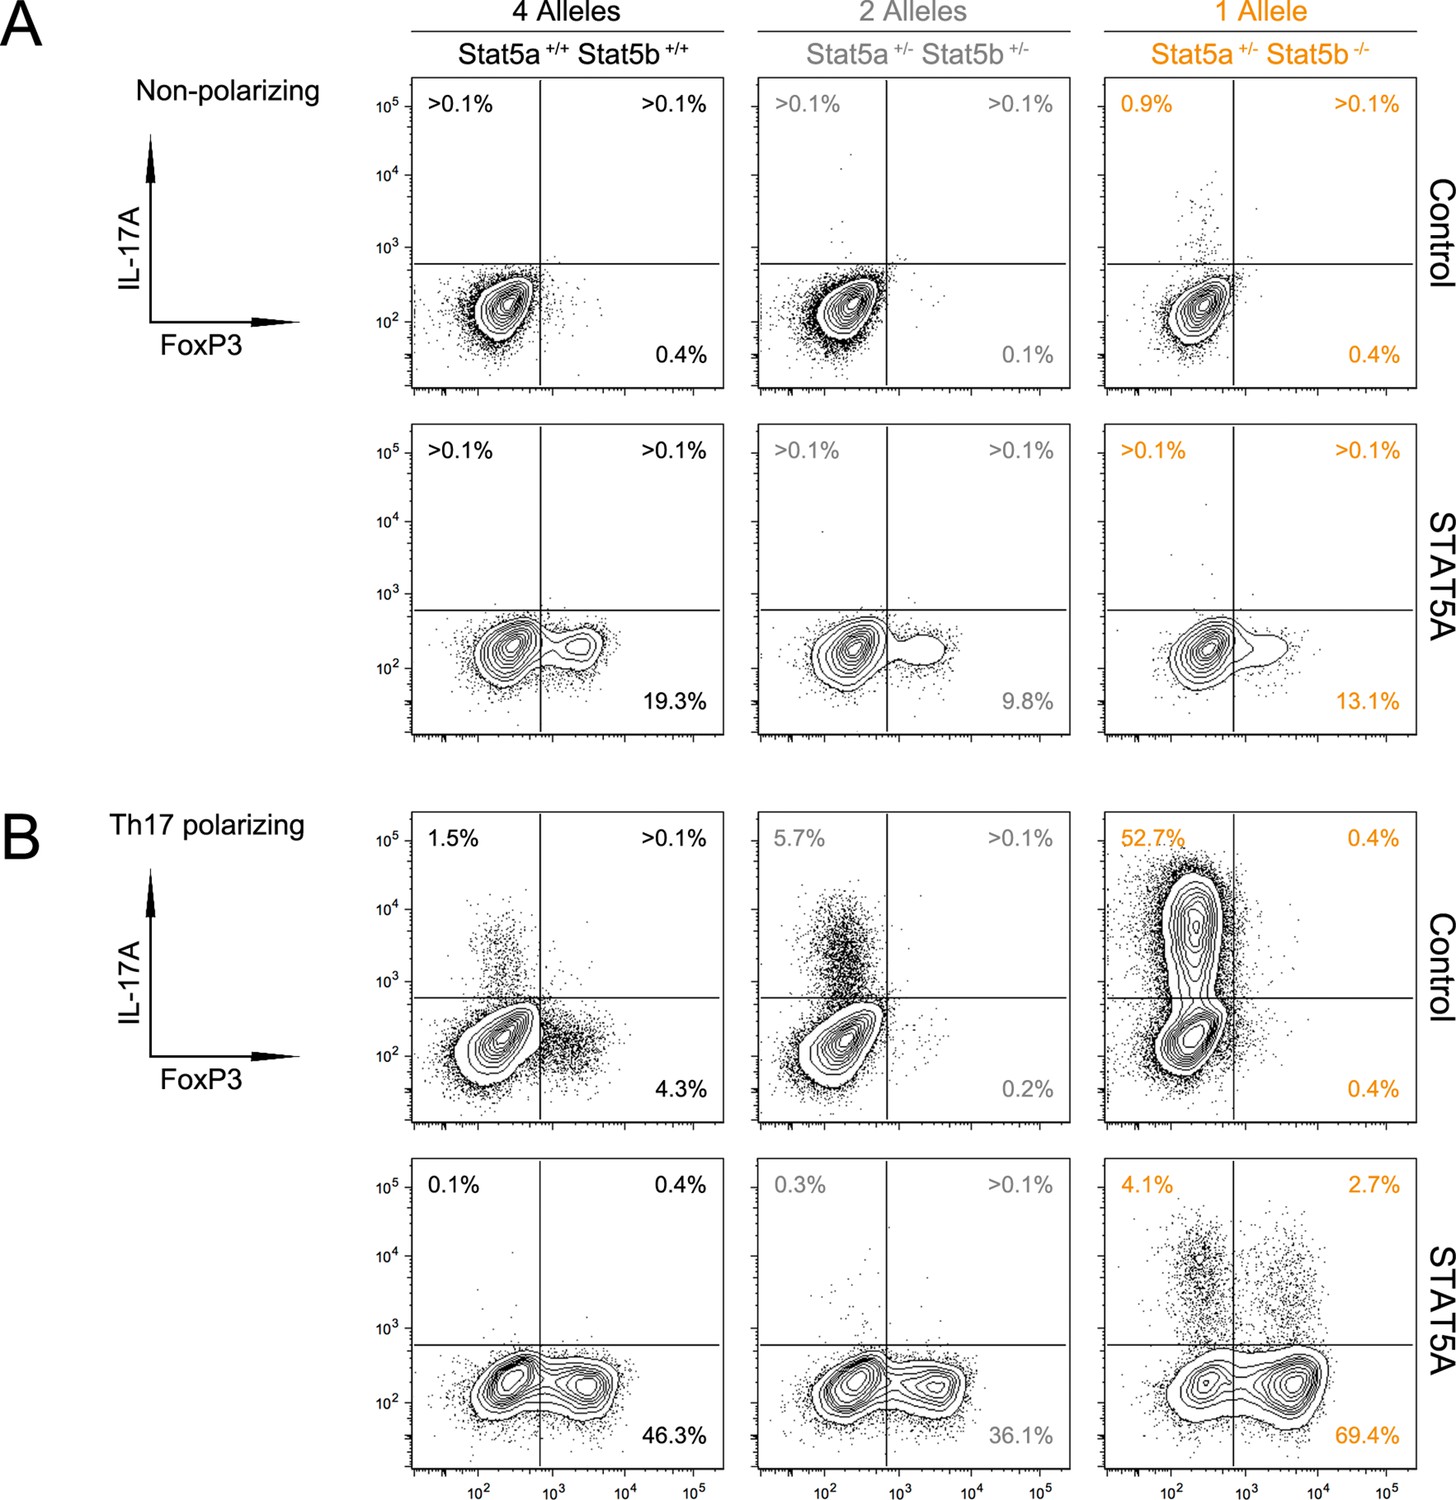
STAT5 paralog dose tips the balance between effector and regulatory T cell programs.
CD4+ T cells from WT, Stat5a/bhet and one-allele Stat5b-deficient mice were were transduced with control or STAT5A retrovirus under (A) non-polarizing or (B) Th17-polarizing conditions. Contour plots denote FOXP3 and IL-17Aprotein levels in transduced cells. Shown is one of two independent experiments.
Additional files
-
Supplementary file 1
Read depth for sequencing experiments.
Spreadsheet reports QC-passing reads for all RNA-seq and ChIP-seq experiments.
- https://doi.org/10.7554/eLife.08384.023
-
Supplementary file 2
RPKM values for transcriptome analysis of STAT5-deficient CD4+ T cells.
Spreadsheet includes RPKM values for all experimental groups and biological replicates.
- https://doi.org/10.7554/eLife.08384.024
-
Supplementary file 3
Paralog preference calculations for STAT5-deficient CD4+ T cells.
Spreadsheet includes paralog preference calculations for all relevant cell types and experimental conditions.
- https://doi.org/10.7554/eLife.08384.025
-
Supplementary file 4
STAT5 paralog-specific genes.
Spreadsheet lists STAT5 paralog-specific genes for all relevant cell types and experimental conditions.
- https://doi.org/10.7554/eLife.08384.026
Download links
A two-part list of links to download the article, or parts of the article, in various formats.
Downloads (link to download the article as PDF)
Open citations (links to open the citations from this article in various online reference manager services)
Cite this article (links to download the citations from this article in formats compatible with various reference manager tools)
Signal transducer and activator of transcription 5 (STAT5) paralog dose governs T cell effector and regulatory functions
eLife 5:e08384.
https://doi.org/10.7554/eLife.08384


