Rapid learning in visual cortical networks
- The University of Texas Medical School at Houston, United States
Figures
Figure 1 with 1 supplement
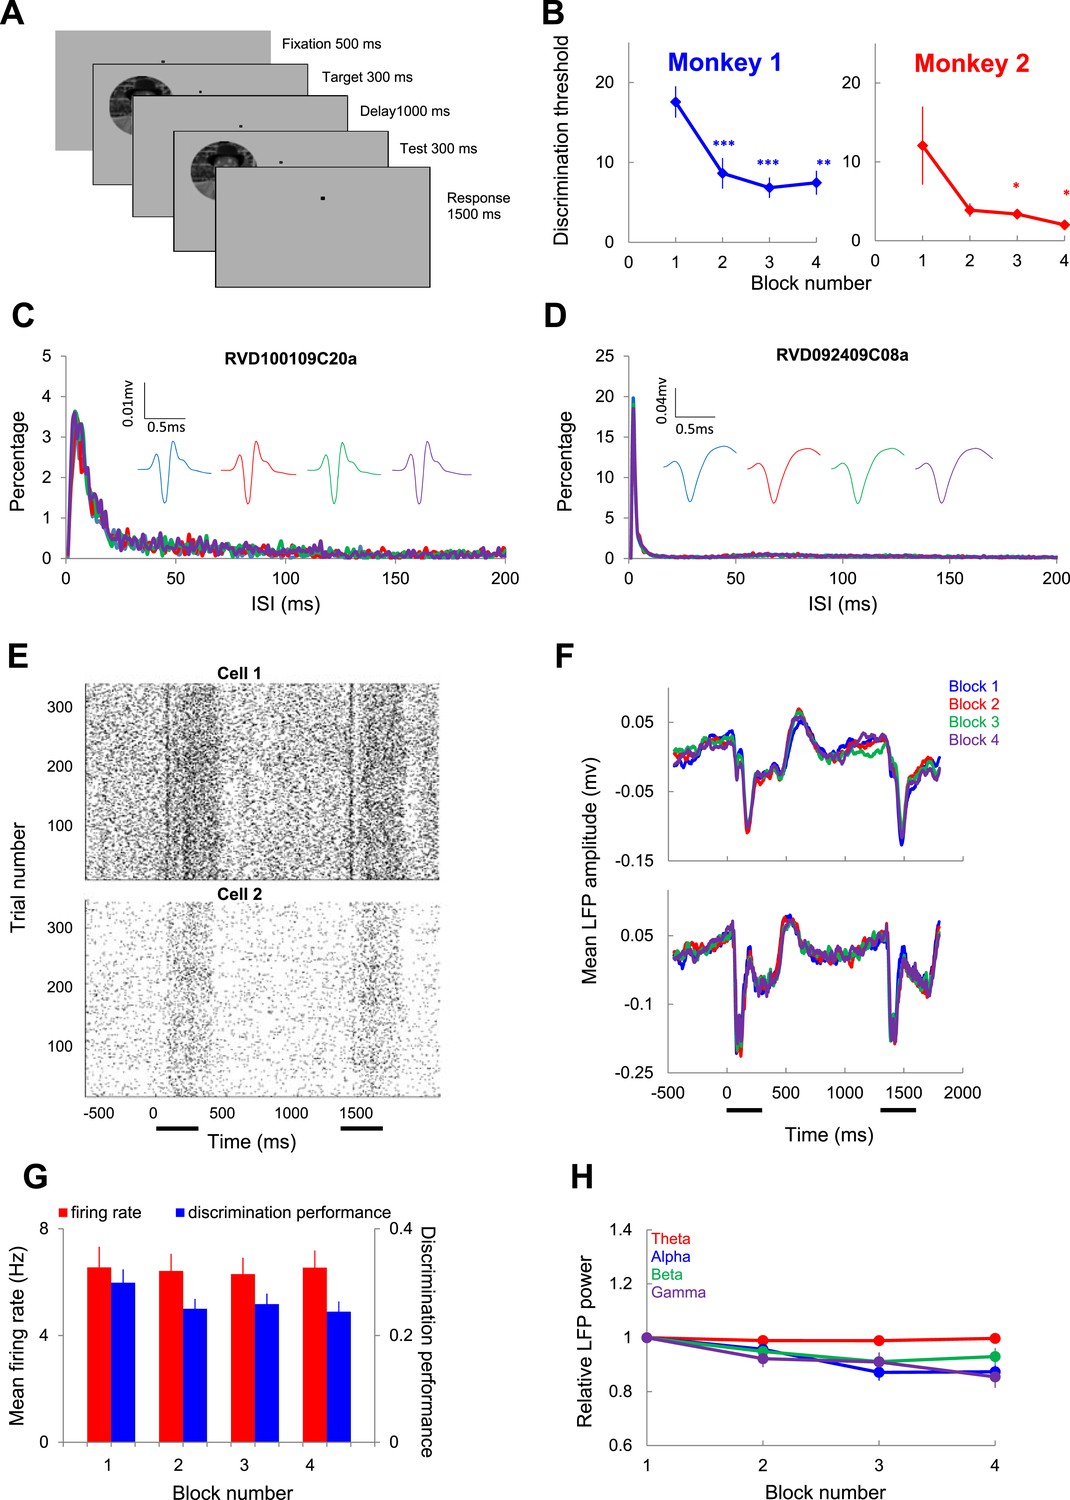
Individual neuron and LFP responses in area V4 during rapid learning.
(A) Schematic description of the rapid learning protocol. After 500 ms of fixation, a target image was presented for 300 ms, followed, after a 1000-ms blank, by a 300-ms test image (monkeys maintained fixation within a 1 × 1 deg window). Monkeys were required to hold a lever for 1500 ms if the test image was rotated relative to the target, and release it within 500 ms if the target and test were identical. (B) Changes in mean behavioral discrimination threshold binned in 96-trial blocks for monkeys 1 and 2. Error bars represent s.e.m. (C, D) Two example inter-spike interval (ISI) distributions for each block in two single units. Insets show average spike waveforms in each block. (E) Raster plots represent the spike timing of two V4 neurons recorded throughout the time course of learning. (F) Examples of local field potential (LFP) responses at two recording sites. Each curve represents the average response across all trials and test orientations within the same block. The horizontal bars mark the 300-ms time windows during which the target and test stimuli were presented. (G) Mean single unit firing rates and discrimination performance (d') across blocks of learning. The error bars represent SEM. (H) Mean relative LFP power in the theta, alpha, beta, and gamma bands in different blocks. The LFP power of individual channel in each block across all test orientation was normalized by the mean in the first block; the mean population LFP power was calculated by averaging across all channels. LFP power in different frequency bands was scaled differently since recordings from different sites depended on electrode impedance.
Figure 1—figure supplement 1
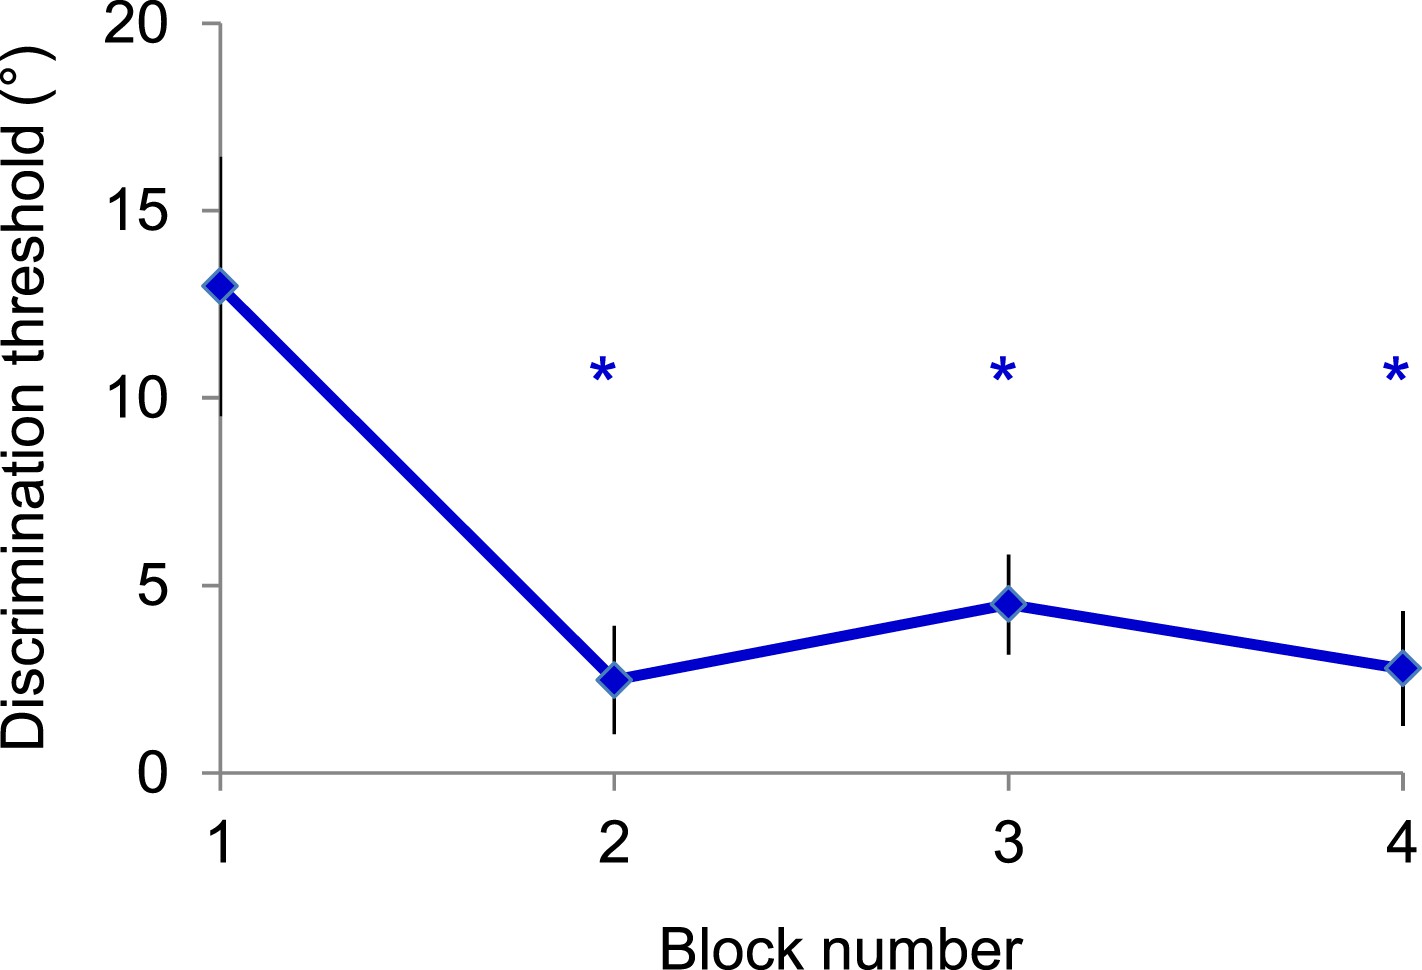
Control experiment—Monkey 2 was passively exposed for 10 sessions to novel natural scenes (similar to those in Figure 1A) while the animal performed a color detection task (red–green task) in the contralateral hemifield.
After 150 trials of passive (unattended) exposure to the image, the monkey was engaged in the rapid learning experiment described in the manuscript (Figure 1A). However, even though images themselves were familiar to the animal, the fact that the monkey did not practice the image orientation discrimination task led to behavioral effects similar to those reported in the manuscript. That is, we found a gradual improvement in discrimination threshold at the end of each session—the gradual learning curve looked similar to that obtained in the original experiments (asterisks indicate p < 0.05).
Figure 2
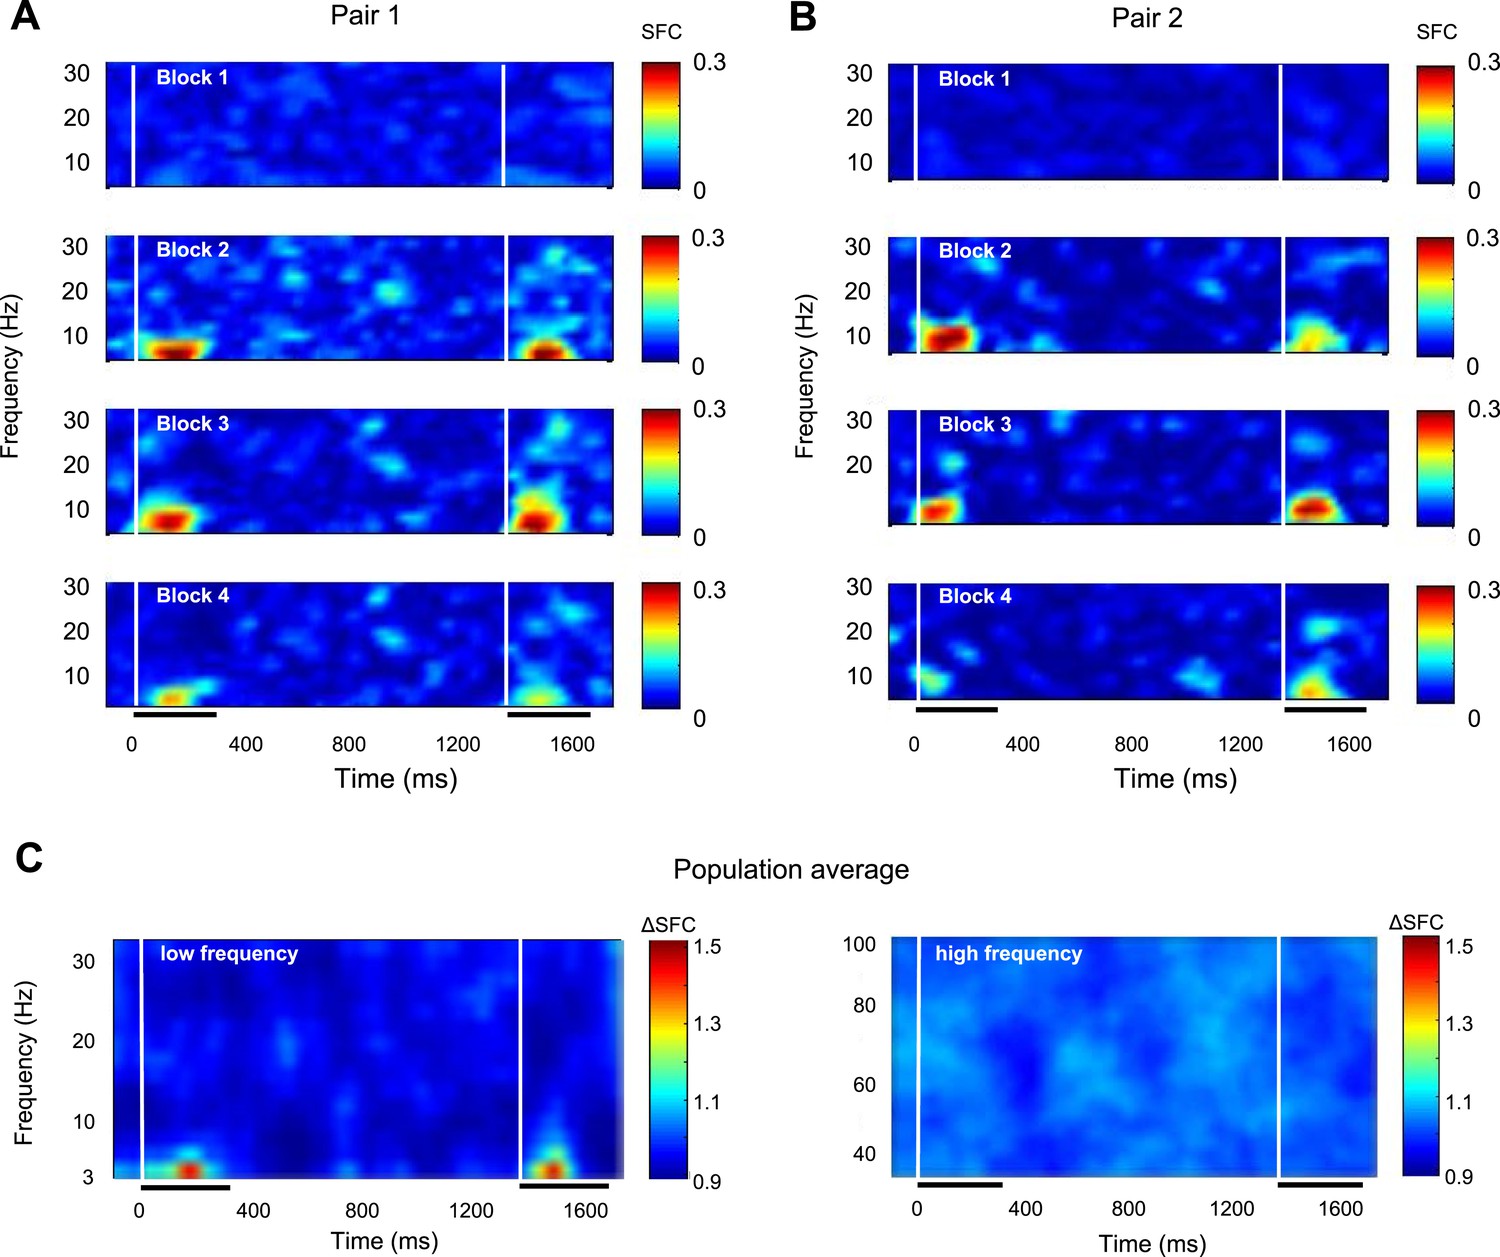
Rapid learning increases spike-LFP theta synchronization.
(A, B) Spike-field coherence (SFC) from two example pairs of recording sites during blocks of learning. Each row shows the mean SFC in the low-frequency bands for the two example pairs in a particular block. (C) SPC—population average. The two panels show the population average (median change) of normalized SFC change in blocks 2–4 relative to block 1 throughout the trial. For each block, SFC was calculated within a 300-ms window sliding every 10 ms, and then the results were normalized for each session. The left panel shows SFC changes for the low frequencies, and the right panel represents frequencies within the gamma band. The x-axis represents time relative to the onset of the target stimulus. The two white vertical bars mark the onset of the target and test stimuli. The horizontal bars represent the time interval when the target and test stimuli are presented.
Figure 3
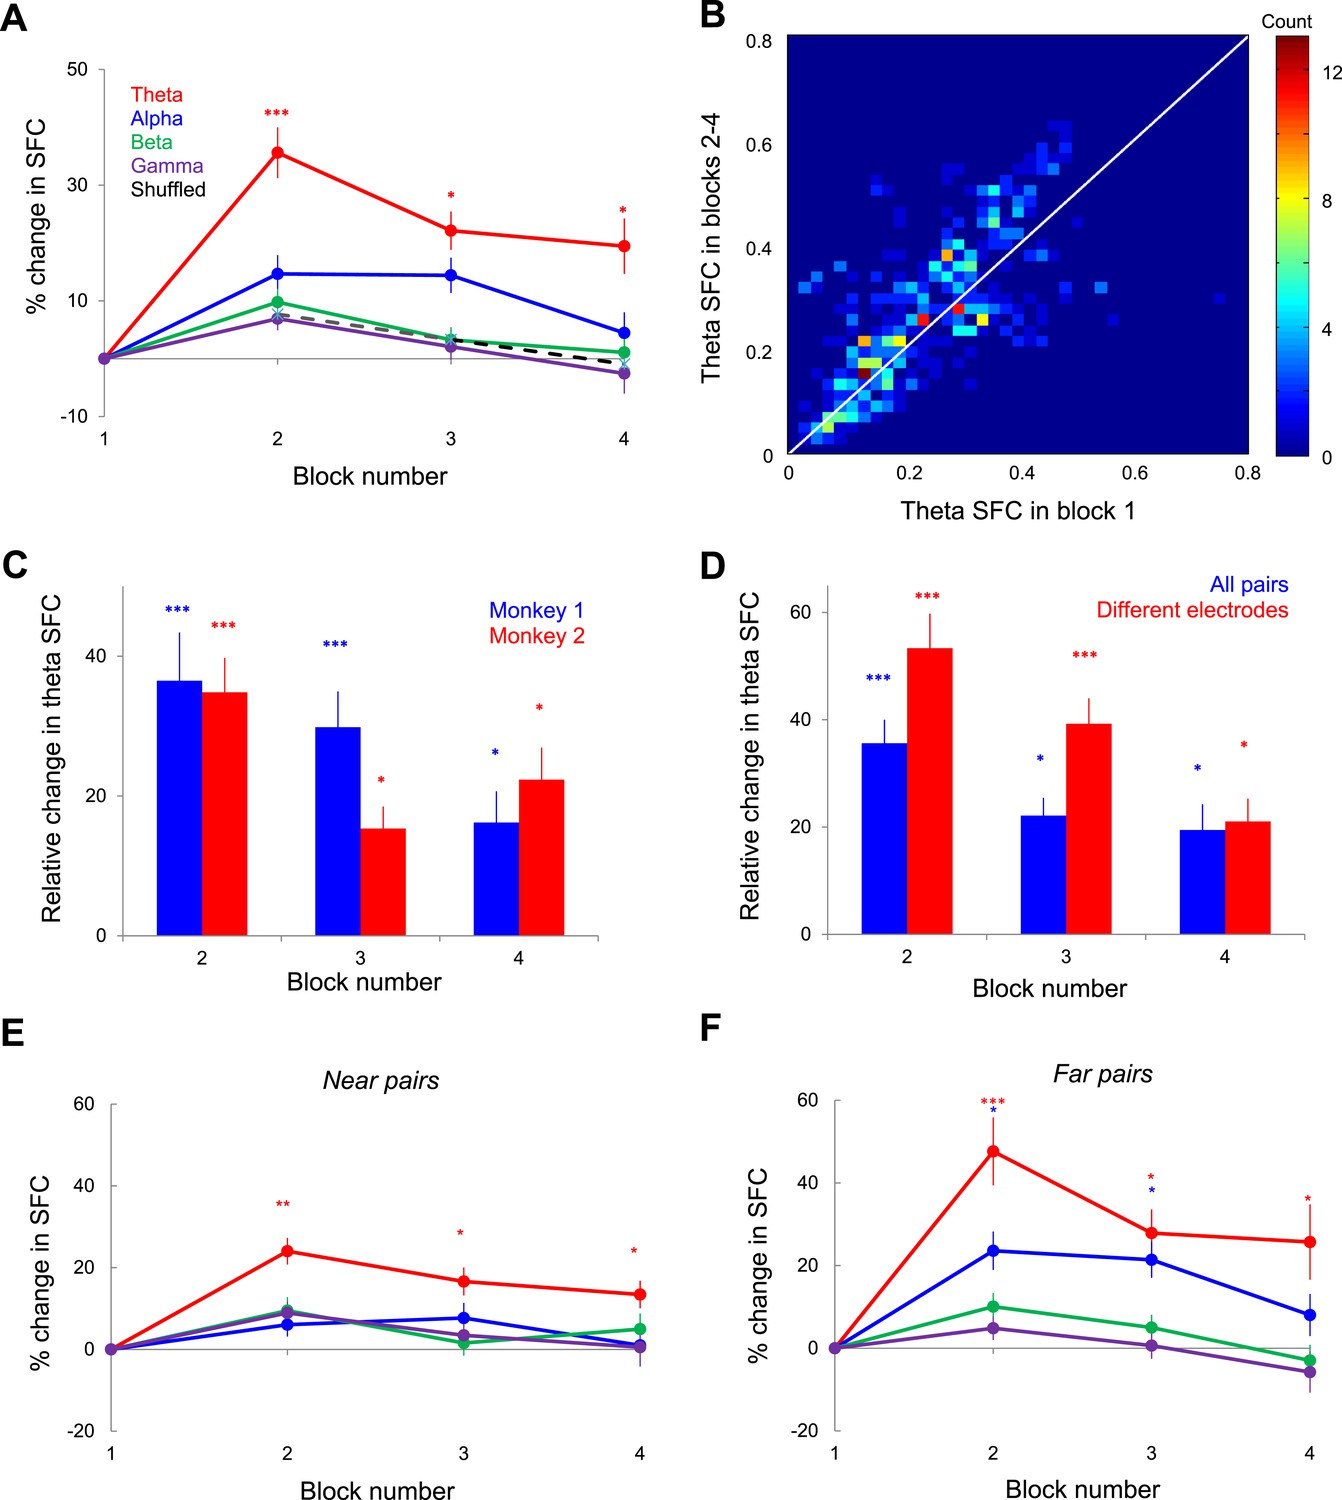
Changes in spike-LFP coherence during learning.
(A) Relative change of mean SFC in each block and frequency band. The error bars represent s.e.m. across spike-LFP pairs. Asterisks for each point show the statistical significance of the difference between SFC in each of blocks 2, 3, and 4 relative to block 1 in each frequency band. (B) Distribution of mean theta SFC values in blocks 2–4 vs block 1. Color indicates the number of spike-LFP pairs measured in blocks 2–4 vs block 1 in 0.02 bins. (C) Block-by-block change in theta SFC relative to block 1 for each monkey. Error bars represent s.e.m. (* represents p < 0.05; *** represents p < 0.001). (D) Relative change in theta SFC when the pairs originating from the same electrode are included (blue, all pairs) or excluded (red, different electrodes). The error bars represent s.e.m. (E) Near pairs (electrode distance <2 mm): Kruskal–Wallis test showed no significant changes induced by learning in alpha, beta, and gamma bands (p = 0.09, 0.19, and 0.12, respectively), but a significant increase in theta band (p = 2.29 10−5). (F) Far pairs (electrode distance >2 mm): Kruskal–Wallis test showed no significant changes in alpha, beta, and gamma bands (p = 0.58, 0.10, and 0.13 respectively), but a significant increase in theta band (p = 1.73 10−6).
Figure 4
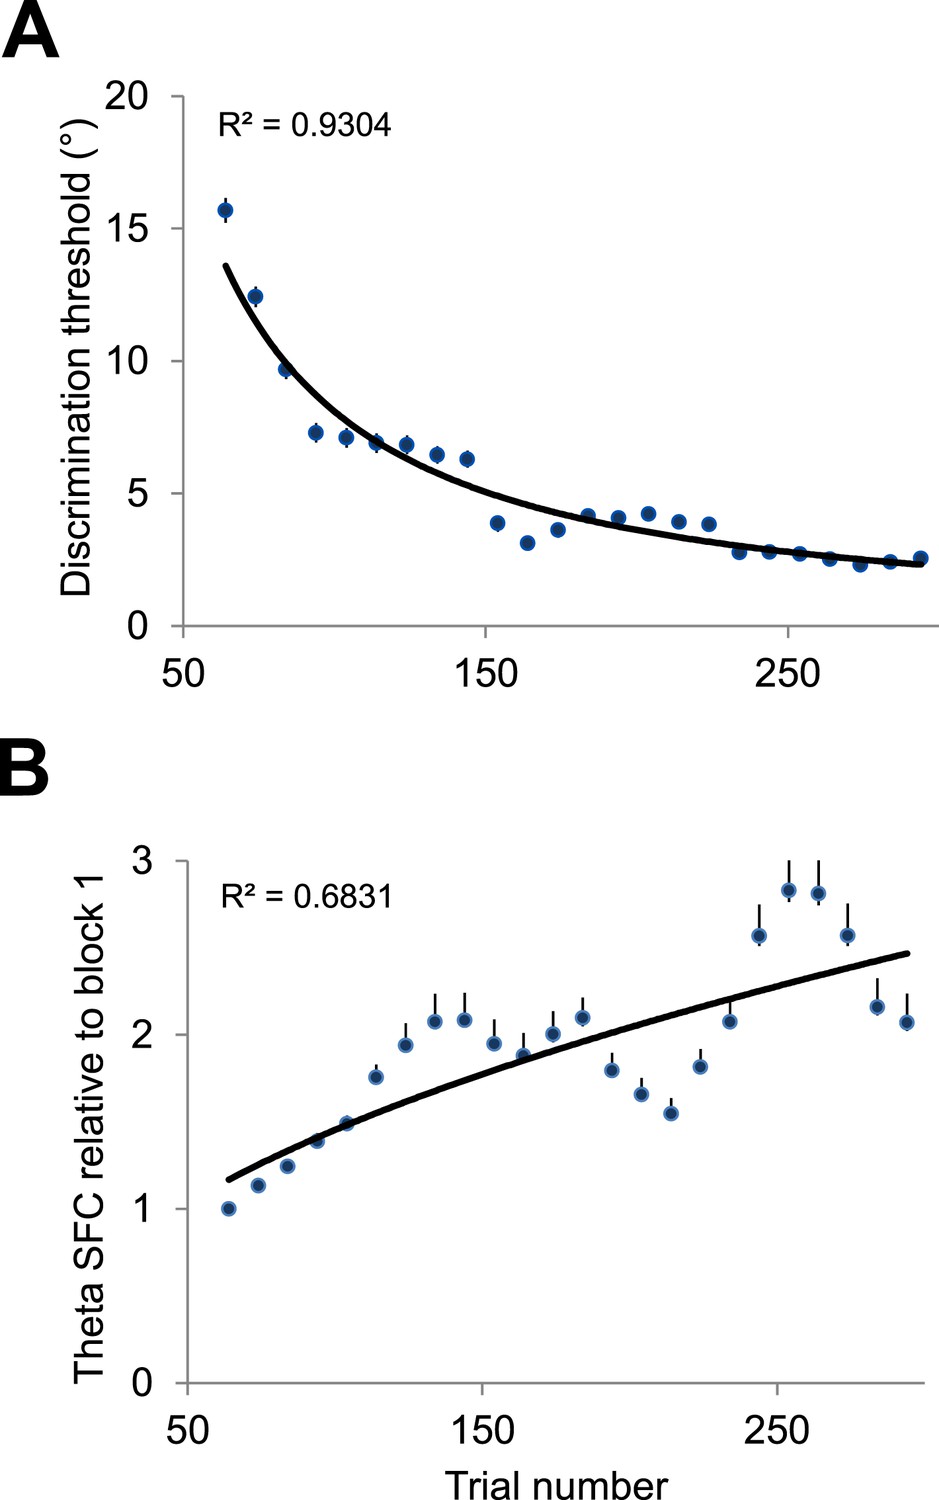
Gradual changes in theta spike-LFP coherence and behavioral performance during learning.
(A) Mean behavioral discrimination threshold calculated throughout the session using a sliding window of 64 trials in steps of 10 trials. The solid line represents the exponential fit. The error bars represent s.e.m. (B) Median change in theta spike-LFP coherence (blocks 2–4 vs block 1) calculated throughout the session using a sliding window of 64 trials in steps of 10 trials. The solid line represents the exponential fit. The error bars represent the distance between the first and third quartiles divided by the square root of n (number of samples).
Figure 5
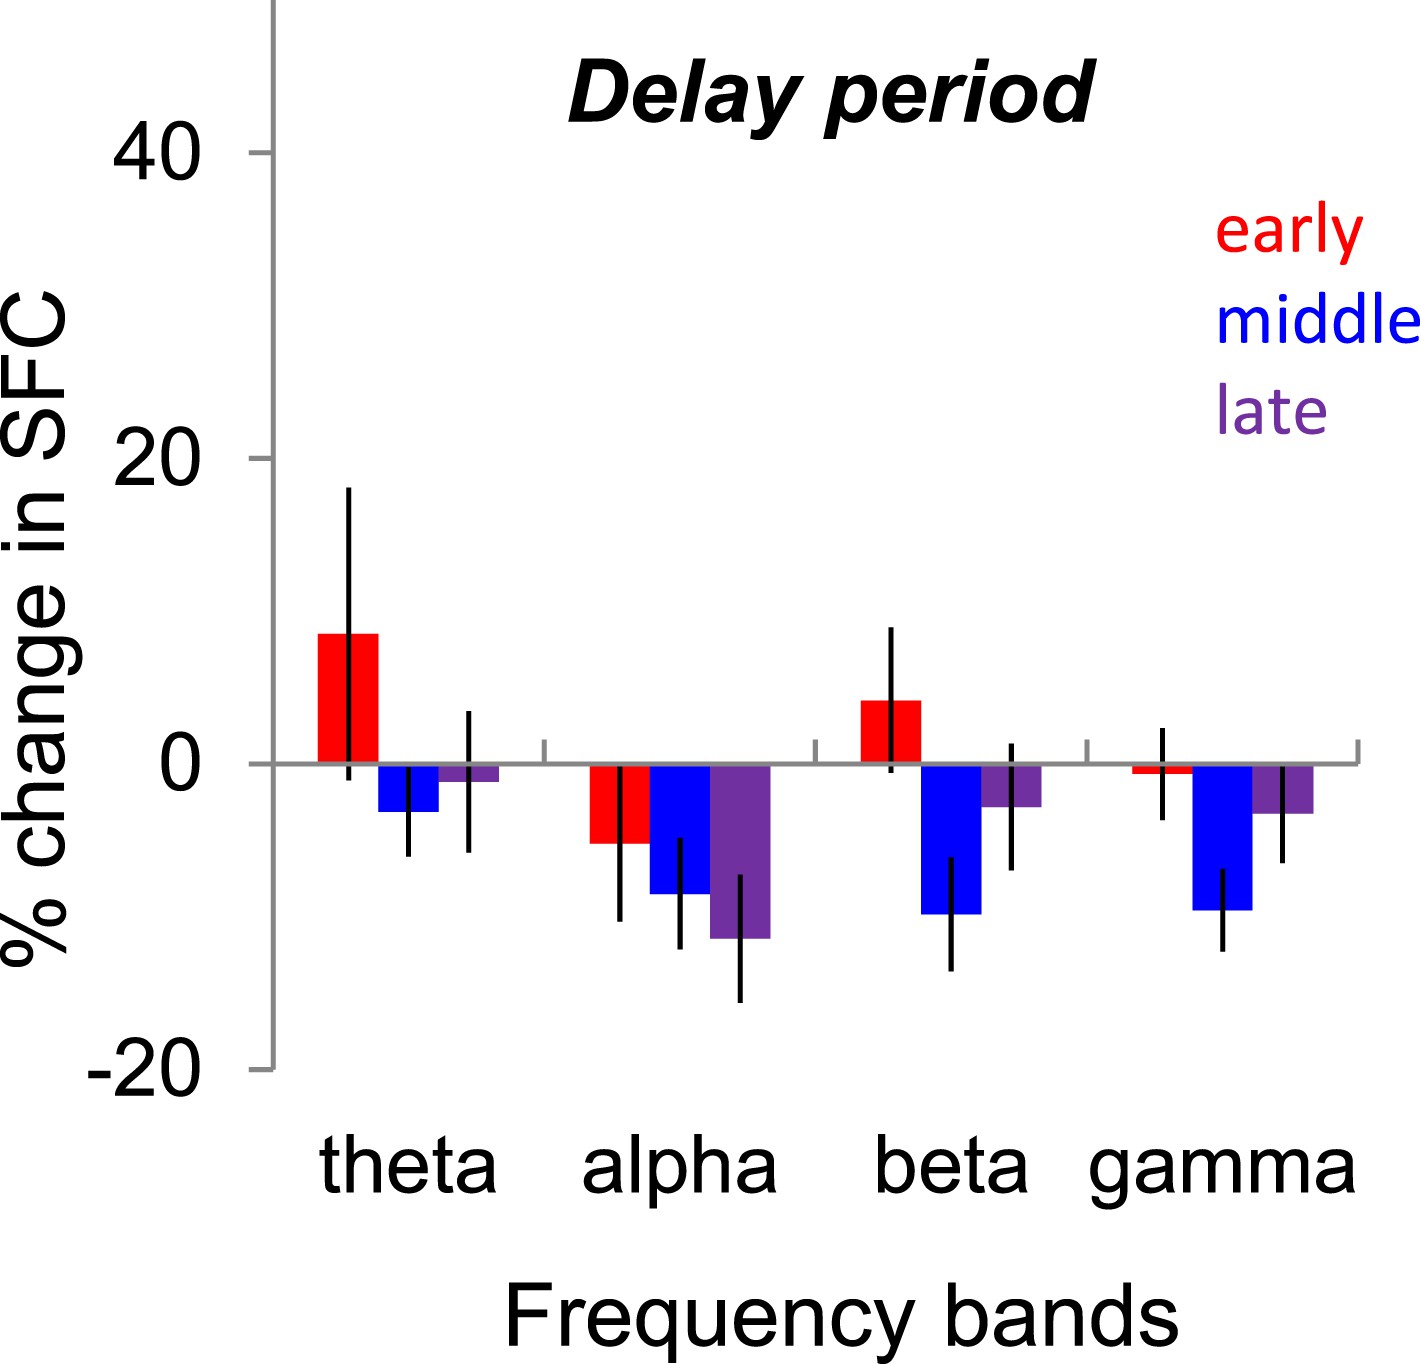
Changes in spike-LFP coherence (SFC, spike-field coherence) during the delay period.
Median change in SFC (blocks 2–4 vs block 1) during the delay period for each frequency band. The 1000-ms delay period was divided into three 333-ms windows referred as early, middle, and late. *** denotes p < 0.001; ** denotes p < 0.01.
Figure 6 with 1 supplement
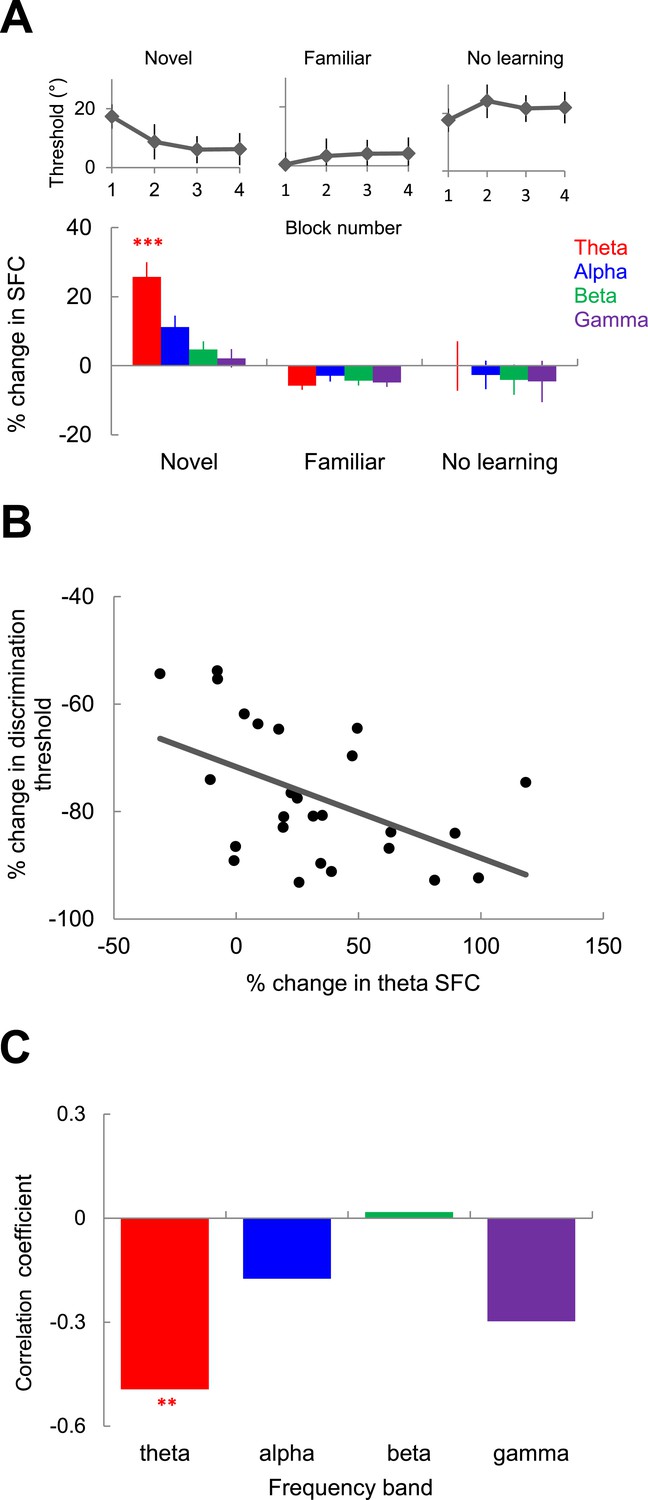
Relationship between spike-field theta synchronization and behavioral performance.
(A) Relative change of SFC in different frequency bands during exposure to novel images (left), during exposure to familiar images (middle), and in the ‘no learning’ condition (right). Error bars represents s.e.m. across spike-LFP pairs. The inset on top shows block-by-block behavioral performance in each type of session. (B) Correlation between the session-by-session change in monkey's orientation discrimination threshold and the mean change in theta synchronization in blocks 2–4 vs block 1 (by averaging across the spike-LFP pairs in a given session). The dark line represents the linear regression fit. (C) Correlation coefficient between the session-by-session change in behavioral discrimination threshold and SFC in different frequency bands. Double asterisks show statistical significance (p < 0.01) in theta band.
Figure 6—figure supplement 1
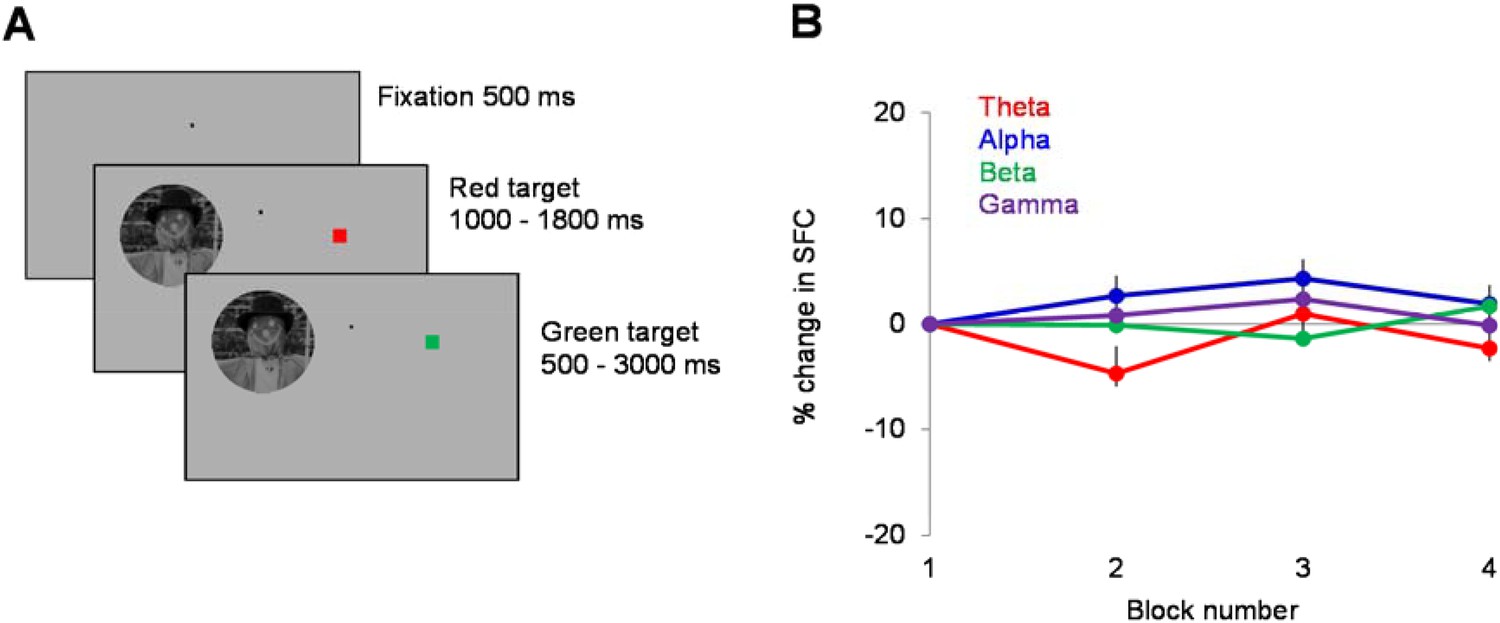
Control experiment—(A) Monkey 2 performed control experiments (n = 12 sessions, 741 cell pairs) in which novel natural scenes were flashed in the neurons' receptive fields, while the animal was engaged in a red/green color detection task in the contralateral hemifield.
Briefly, after 500 ms of fixation, a 5-deg natural scene and a red square (3 deg in diameter) were presented simultaneously for the same random duration (1000–1800 ms) at two symmetric locations on the screen. The animal was required to signal the color change for the attended square (from red to green) within the next 3000 ms. Each session consisted of 400 trials. (B) We examined the block-by-block (each block consisted of 100 trials) changes in spike-LFP coherence (SFC) when the image was presented in the neurons' receptive fields (during the first 1000-ms of stimulus presentation). The results (shown as SFC changes with respect to SFC in block 1) confirm the results of our first control experiment (Figure 6A), that is, we were unable to detect significant block-by-block changes in SFC in any frequency band during inattentive (passive) fixation (theta: p = 0.99, alpha: p = 0.21, beta: p = 0.25, gamma: p = 0.49, Kruskal–Wallis test).
Download links
A two-part list of links to download the article, or parts of the article, in various formats.
Downloads (link to download the article as PDF)
Open citations (links to open the citations from this article in various online reference manager services)
Cite this article (links to download the citations from this article in formats compatible with various reference manager tools)
Rapid learning in visual cortical networks
eLife 4:e08417.
https://doi.org/10.7554/eLife.08417


