Environmental changes in oxygen tension reveal ROS-dependent neurogenesis and regeneration in the adult newt brain
- Karolinska Institute, Sweden
- Linköping University, Sweden
- University of Leicester, United Kingdom
Figures
Figure 1 with 1 supplement
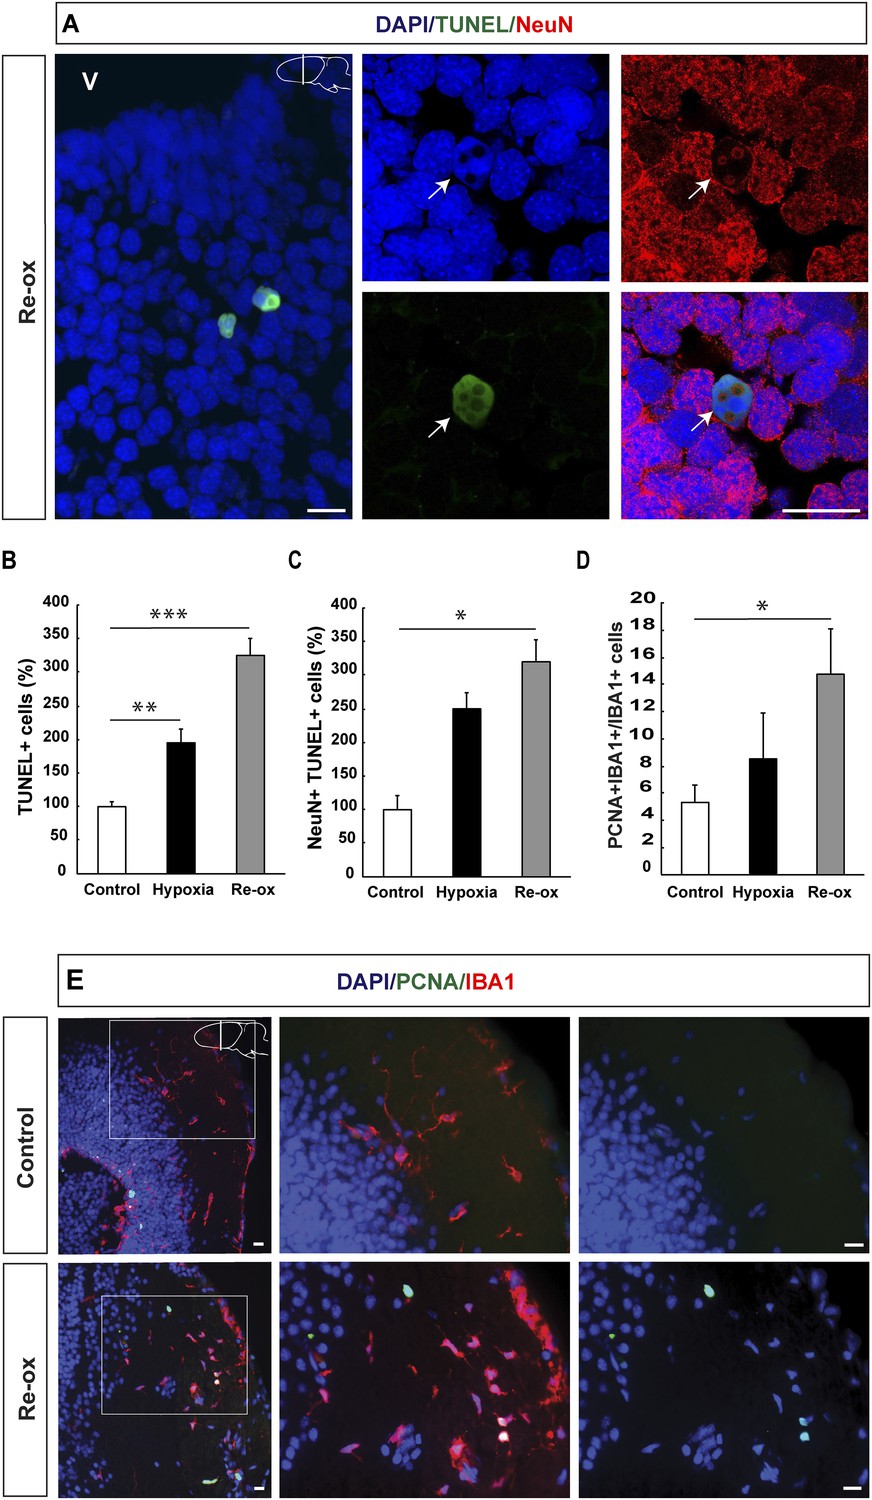
Hypoxia/re-oxygenation-induced neuronal cell death and microglia response.
(A) TUNEL+ cells are shown in the forebrain parenchyma at low magnification. The high-magnification image shows TUNEL+/NeuN+ nucleus (arrow). Note the disappearing NeuN staining in the TUNEL+ cell. (B) Quantification of TUNEL+ cells after hypoxia and hypoxia/re-oxygenation. n = 4, **p < 0.01, ***p < 0.001. (Unpaired t-test). (C) Quantification of NeuN+/TUNEL+ cells after hypoxia and hypoxia/re-oxygenation. n = 4, *p < 0.05. (Mann–Whitney test). (D) Quantification of microglia activation after hypoxia and hypoxia/re-oxygenation. n = 4–5, *p < 0.05. (Unpaired t-test). (E) Low-magnification image illustrating microglia proliferation in control and experimental animals. Scale bar = 20 μm.
-
Figure 1—source data 1
Hypoxia/re-oxygenation-induced neuronal cell death and microglia response.
- https://doi.org/10.7554/eLife.08422.004
Figure 1—figure supplement 1
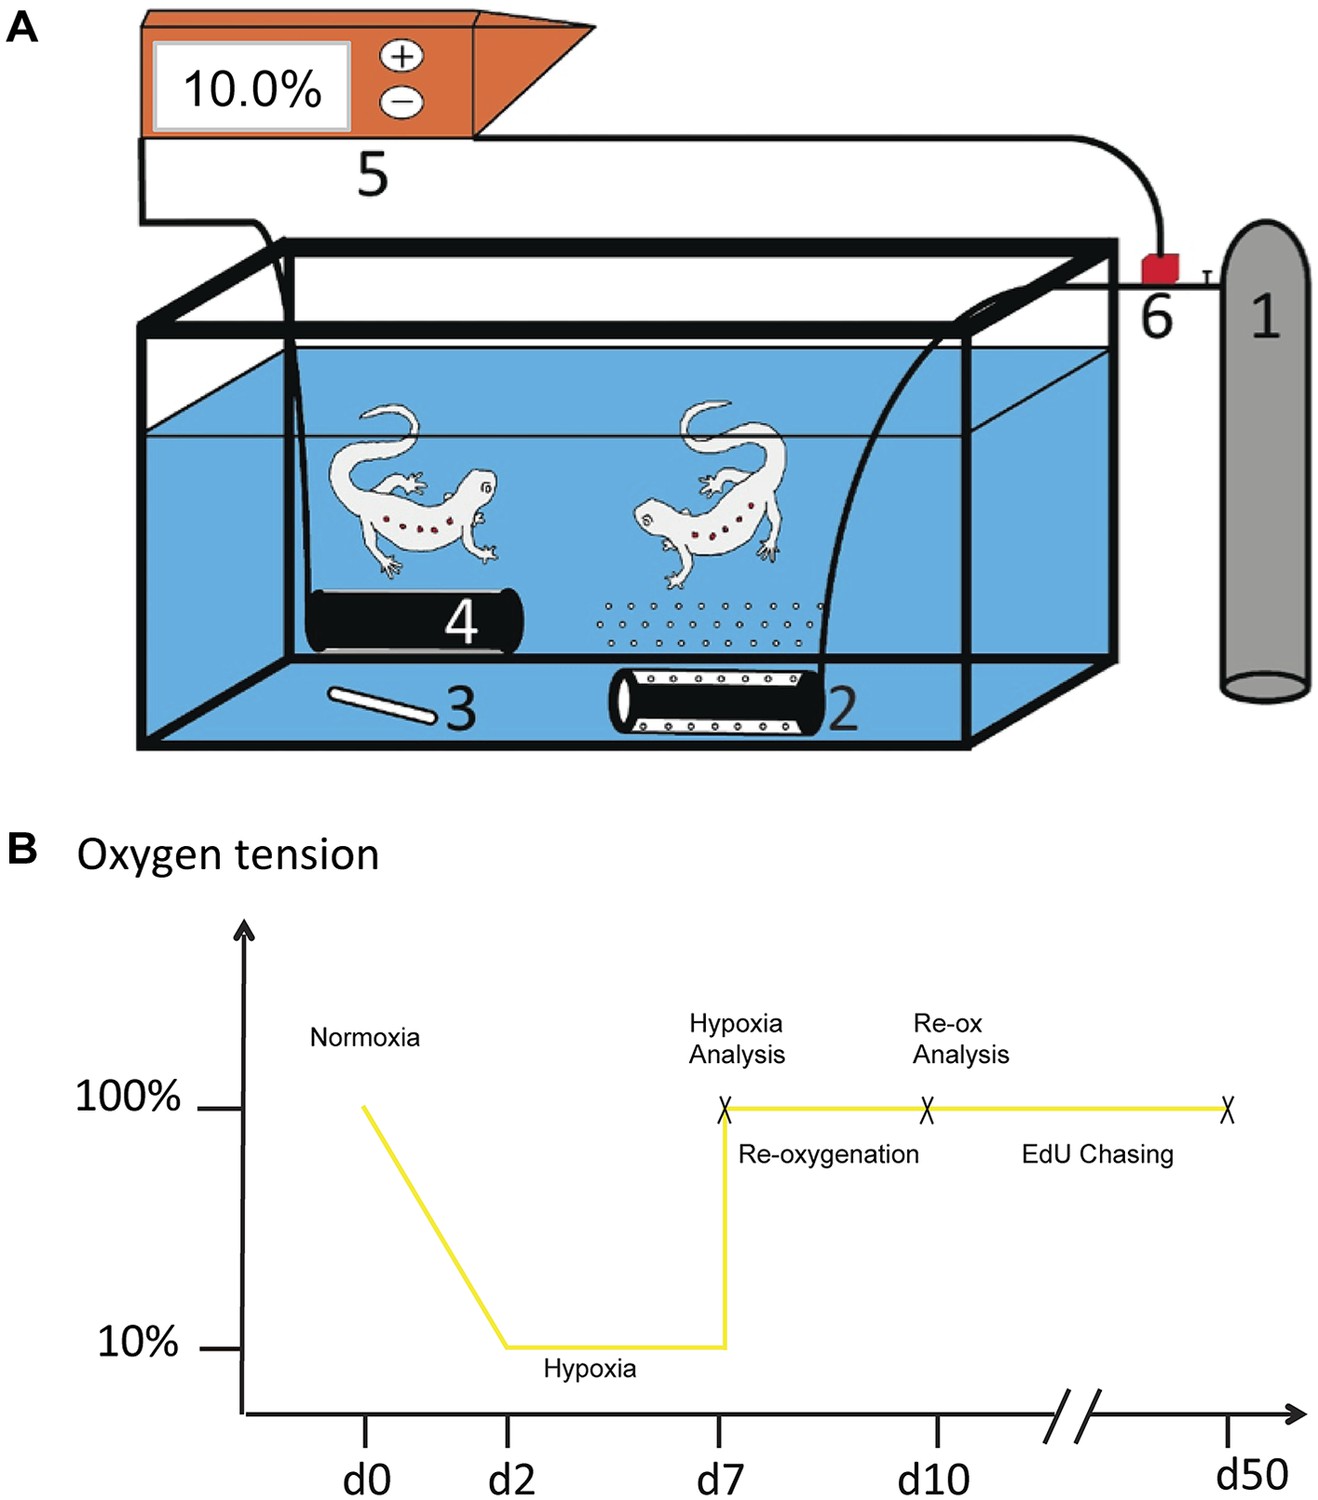
Experimental system for manipulation of oxygen tension.
(A) A gas canister (1) is connected to an air diffuser (2) that bubbles nitrogen gas in to the water. The water is mixed with magnetic stirrer (3) and an oxygen electrode measures oxygen tension in aquarium (4). The oxygen electrode is connected to an oxygen regulator (5) and the regulator is in turn connected to a solenoid valve that regulates the outlet of gas into the aquarium (6). (B) Schematic illustration of the experimental design.
Figure 2 with 1 supplement
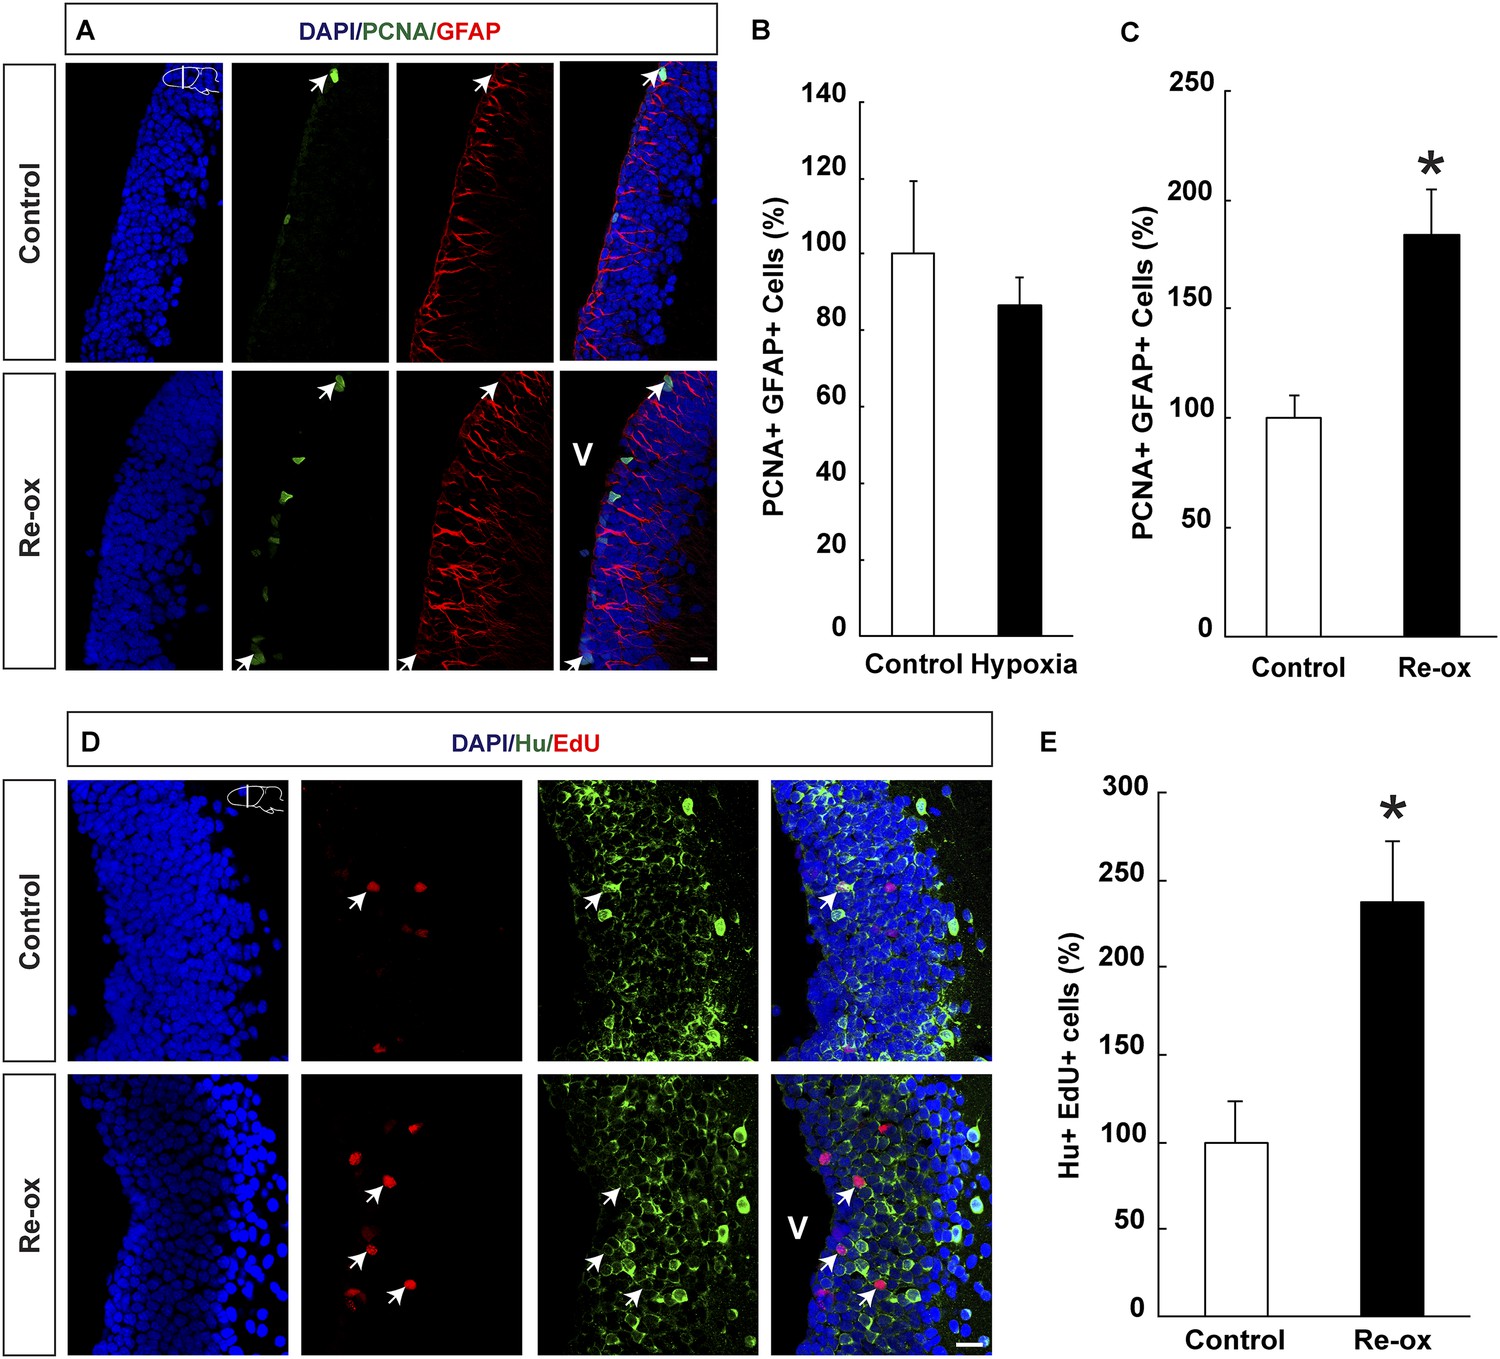
Hypoxia/re-oxygenation-induced ependymoglia activation and neurogenesis.
(A) Low-magnification images illustrating increased proliferation of ependymoglia cells after re-oxygenation. Arrows point to PCNA+/GFAP+ cells. (B, C) Quantification of PCNA+/GFAP+ ependymoglia cells showing increased ependymoglia proliferation after re-oxygenation but not after hypoxia. n = 4–5, *p < 0.05. (Unpaired t-test for B and Mann–Whitney test for C). (D) Low-magnification images illustrating increased number of EdU+/Hu+ cells in the forebrain parenchyma after re-oxygenation. Arrows point to EdU+/Hu+ cells. (E) Quantification of EdU+/Hu+ cells indicating increased neurogenesis in the forebrain parenchyma after re-oxygenation n = 5, *p < 0.05. (Unpaired t-test). Scale bar = 20 μm.
-
Figure 2—source data 1
Hypoxia/re-oxygenation-induced ependymoglia activation and neurogenesis.
- https://doi.org/10.7554/eLife.08422.007
-
Figure 2—source data 2
Re-oxygenation leads to increased proliferation assessed by EdU incorporation.
- https://doi.org/10.7554/eLife.08422.008
Figure 2—figure supplement 1

Re-oxygenation leads to increased proliferation assessed by EdU incorporation.
(A) Images illustrating increased EdU incorporation into ependymoglia cells following re-oxygenation. Arrows point to EdU+/GFAP+ cells. (B) Quantification of the number of EdU+/GFAP+ cells. n = 4, *p < 0.05. (Unpaired t-test). Scale bar = 20 μm.
Figure 3 with 1 supplement
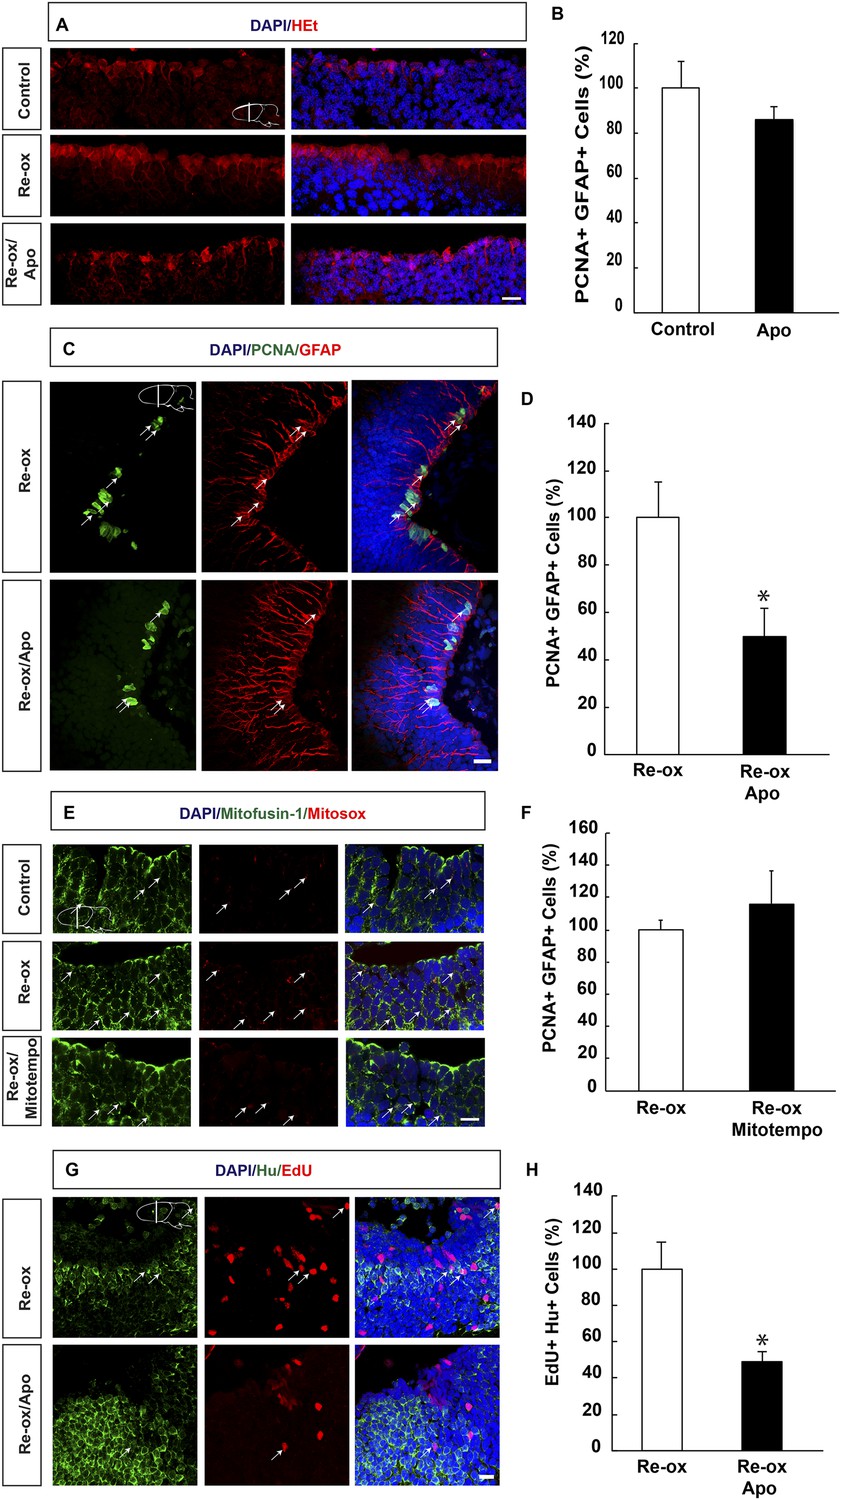
ROS-dependent ependymoglia proliferation and neurogenesis.
(A) Hydroethidine (HEt) shows increased reactive oxygen species (ROS) levels after re-oxygenation particularly in ependymoglia cells. Apocynin inhibits ROS accumulation. (B) Quantification of ventricular PCNA+/GFAP+ cells showing that apocynin does not inhibit homeostatic ependymoglia proliferation. n = 4. (Unpaired t-test). (C) Low-magnification images illustrating that apocynin decreases the hypoxia/re-oxygenation-induced ependymoglia cell proliferation. Arrows point to PCNA+/GFAP+ cells. (D) Quantification of ventricular PCNA+/GFAP+ cells showing that apocynin decreases the hypoxia/re-oxygenation induced ependymoglia cell proliferation. n = 4, *p < 0.05. (Unpaired t-test). (E) Images illustrating accumulation of mitochondrial ROS as indicated by Mitosox signal after re-oxygenation. Administration of the mitochondrially targeted antioxidant, Mitotempo reduces mitochondrial ROS. Note the co-localization of Mitosox signal with the mitochondrial marker mitofusin-1. Arrows point to mitofusin-1+/mitosox+ cells. (F) Administration of Mitotempo does not change ependymoglia proliferation. n = 4 (Unpaired t-test). (G) Low-magnification images illustrating that apocynin decreases the hypoxia/re-oxygenation induced neurogenesis in the forebrain parenchyma. Arrows point to EdU+/Hu+ cells. (H) Quantification of EdU+/Hu+ cells showing that apocynin decreases the hypoxia/re-oxygenation induced neurogenesis in the forebrain parenchyma. n = 4–5, *p < 0.05. (Unpaired t-test). Scale bar = 20 μm.
-
Figure 3—source data 1
ROS-dependent ependymoglia proliferation and neurogenesis.
- https://doi.org/10.7554/eLife.08422.011
-
Figure 3—source data 2
ROS detection in GFAP+ and DCX+ cells in vitro.
- https://doi.org/10.7554/eLife.08422.012
Figure 3—figure supplement 1
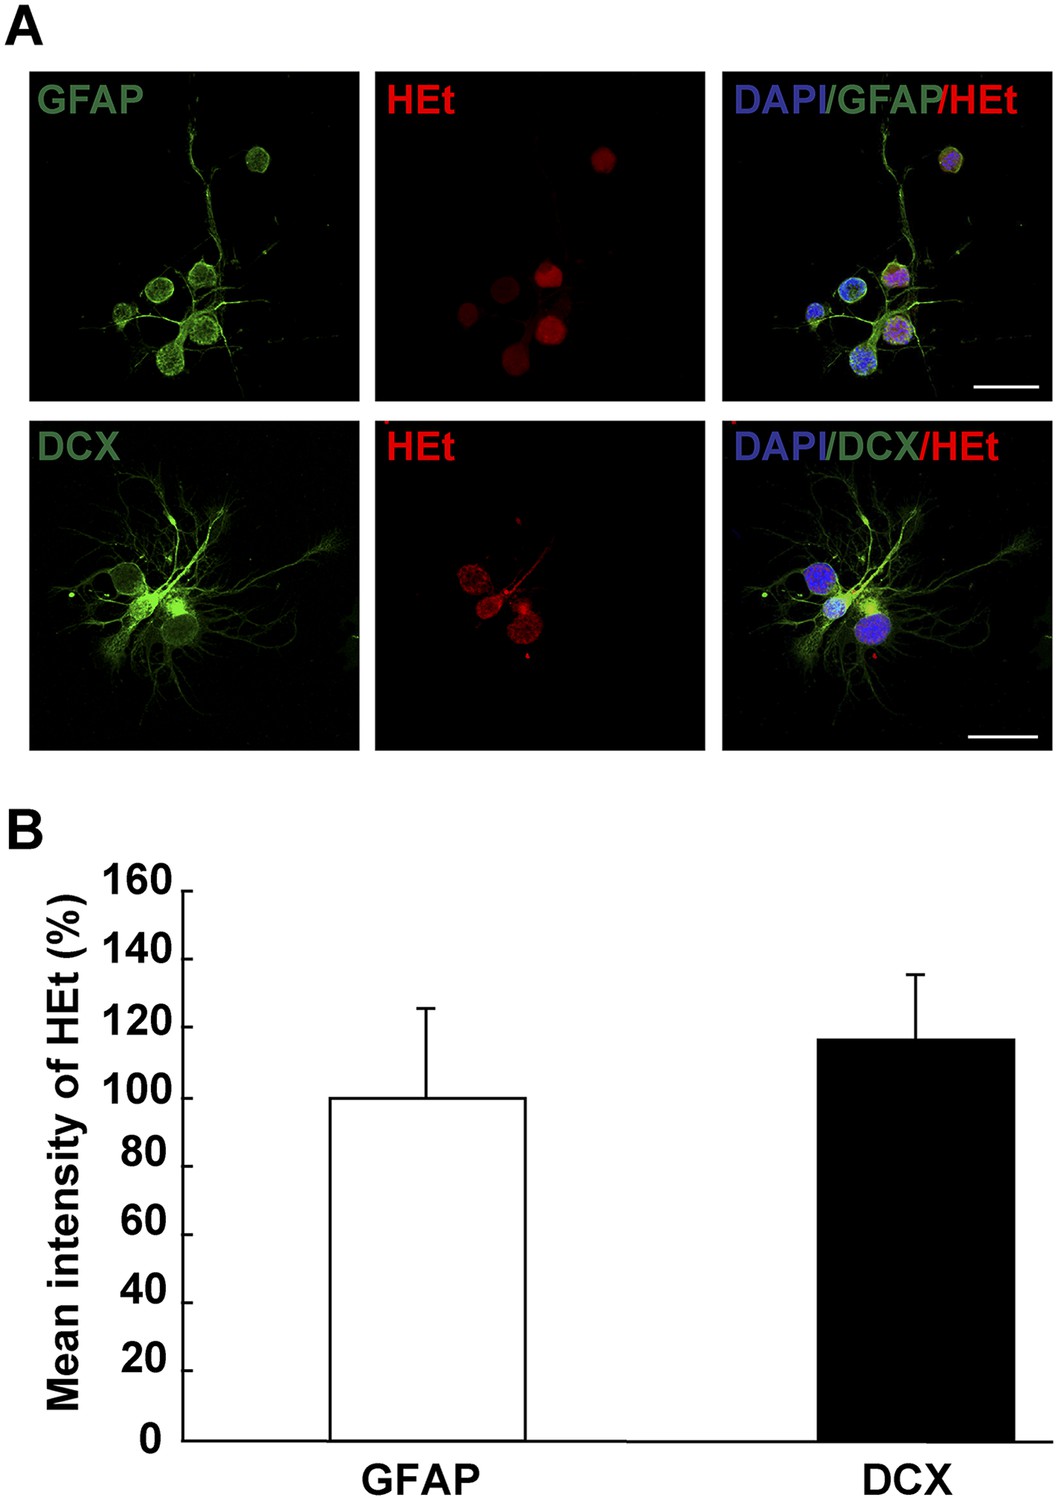
ROS detection in differentiating neurons in vitro.
(A) Images illustrating HEt signal in GFAP+ and DCX+ cells. (B) Quantification of HEt signal intensity shows no difference in signal intensity. n = 3. (Mann–Whitney test). Scale bar: 20 μm.
Figure 4 with 1 supplement
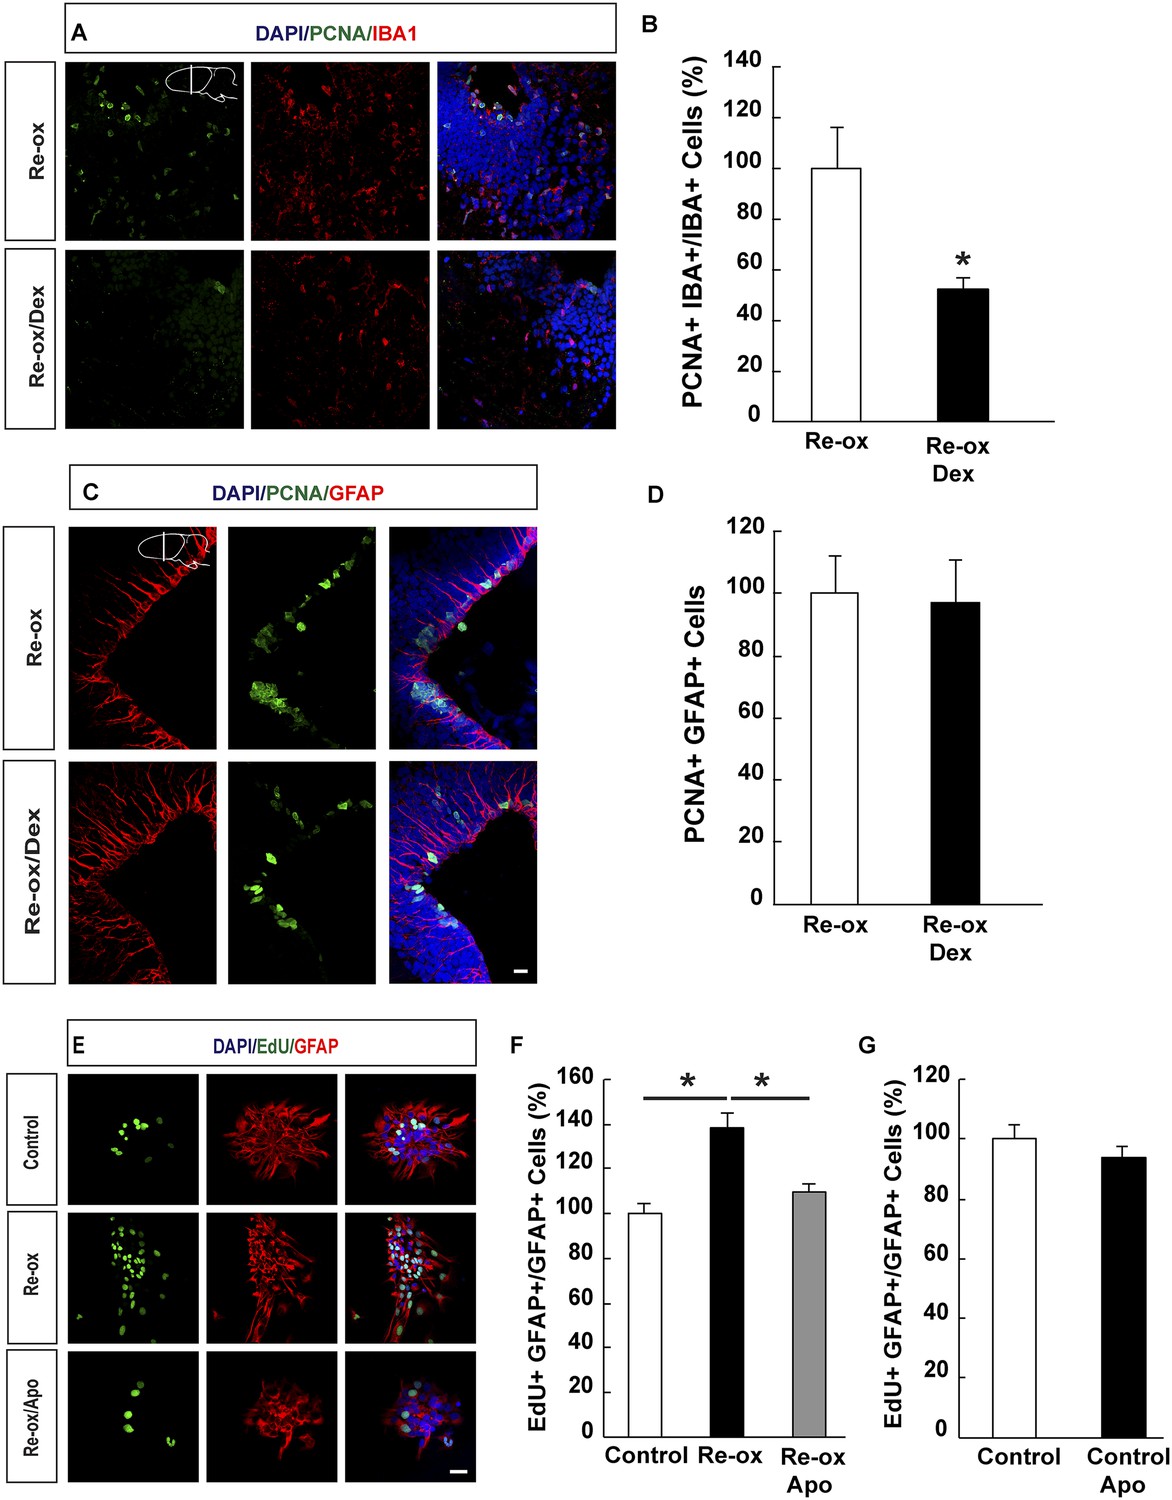
Suppression of microglia activation does not inhibit hypoxia/re-oxygenation–induced ependymoglia proliferation.
(A, B) Dexamethasone inhibits microglia activation indicated by decreased number of IBA1+/PCNA+ cells. Low-magnification images illustrate that dexamethasone decreases microglia proliferation in A and quantification is shown in B. n = 6, *p < 0.05. (Unpaired t-test). (C, D) Dexamethasone does not inhibit ependymoglia activation, indicated by unchanged number of ventricular GFAP+/PCNA+ cells. Low-magnification images illustrate that dexamethasone does not decrease ependymoglia proliferation in C and quantification is shown in D. n = 6. (Unpaired t-test). (E–G) Hypoxia/re-oxygenation increases proliferation of GFAP+ cells in neurospheres in a ROS dependent manner. Images illustrating proliferation of GFAP+ cells in control and experimental neurosphere cultures are shown in E. Quantifications of PCNA+/GFAP+ cells are shown in F, G. n = 3, *p < 0.05. (Unpaired t-test). Scale bar = 20 μm.
-
Figure 4—source data 1
Suppression of microglia activation does not inhibit hypoxia/re-oxygenation-induced ependymoglia proliferation.
- https://doi.org/10.7554/eLife.08422.015
-
Figure 4—source data 2
Apocynin does not inhibit microglia proliferation in vivo but abrogates neurosphere-formation after hypoxia/re-oxygenation.
- https://doi.org/10.7554/eLife.08422.016
Figure 4—figure supplement 1

Apocynin does not inhibit microglia proliferation in vivo but abrogates neurosphere-formation after hypoxia/re-oxygenation.
(A) The number of proliferating microglia cells assessed by PCNA+/IBA1+ cells is not affected by apocynin treatment. n = 4. (Unpaired t-test). (B) Apocynin does not inhibit neurosphere formation in normoxic conditions. n = 4. (Unpaired t-test). (C) Apocynin abrogates hypoxia/re-oxygenation-induced increase in neurosphere formation. n = 6, *p < 0.05 (Unpaired t-test).
Figure 5

ROS dependent regeneration of midbrain dopamine neurons during normoxia.
(A) HEt staining illustrating increased ROS levels in ependymoglia cells following ablation of dopamine neurons with 6-OHDA compared to sham-injured brains. Apocynin treatment abrogates lesion-induced increase of ROS levels. (B) Images illustrating that cell cycle reentry by quiescent midbrain ependymoglia after 6-OHDA-injection is inhibited by apocynin. (C) Quantification of cell cycle reentry by quiescent midbrain ependymoglia in the presence and absence of apocynin after 6-OHDA-injection. n = 4, *p < 0.05. (Unpaired t-test). (D) Images illustrating that apocynin inhibits regeneration of midbrain dopamine neuron 21 days post ablation. (E) Quantification of TH+ cells 21 days post ablation of dopamine neurons in the presence or absence of apocynin. n = 4–5, *p < 0.05. (Unpaired t-test). (F) Apocynin on its own does not change the number of TH+ cells in the midbrain in sham-ablated animals. n = 4. (Unpaired t-test). Scale bar = 20 μm.
-
Figure 5—source data 1
ROS-dependent regeneration of midbrain dopamine neurons during normoxia.
- https://doi.org/10.7554/eLife.08422.019
Download links
A two-part list of links to download the article, or parts of the article, in various formats.
Downloads (link to download the article as PDF)
Open citations (links to open the citations from this article in various online reference manager services)
Cite this article (links to download the citations from this article in formats compatible with various reference manager tools)
Environmental changes in oxygen tension reveal ROS-dependent neurogenesis and regeneration in the adult newt brain
eLife 4:e08422.
https://doi.org/10.7554/eLife.08422


