Compromising the 19S proteasome complex protects cells from reduced flux through the proteasome
- Whitehead Institute for Biomedical Research, United States
- Howard Hughes Medical Institute, Massachusetts Institute of Technology, United States
- Department of Cell Biology, Harvard Medical School, United States
- Stanford University School of Medicine, United States
- Harvard Medical School, United States
- Institute of Molecular Biotechnology of the Austrian Academy of Sciences, Austria
- Netherlands Cancer Institute, Netherlands
- Brigham and Women's Hospital, United States
Figures
Figure 1 with 1 supplement
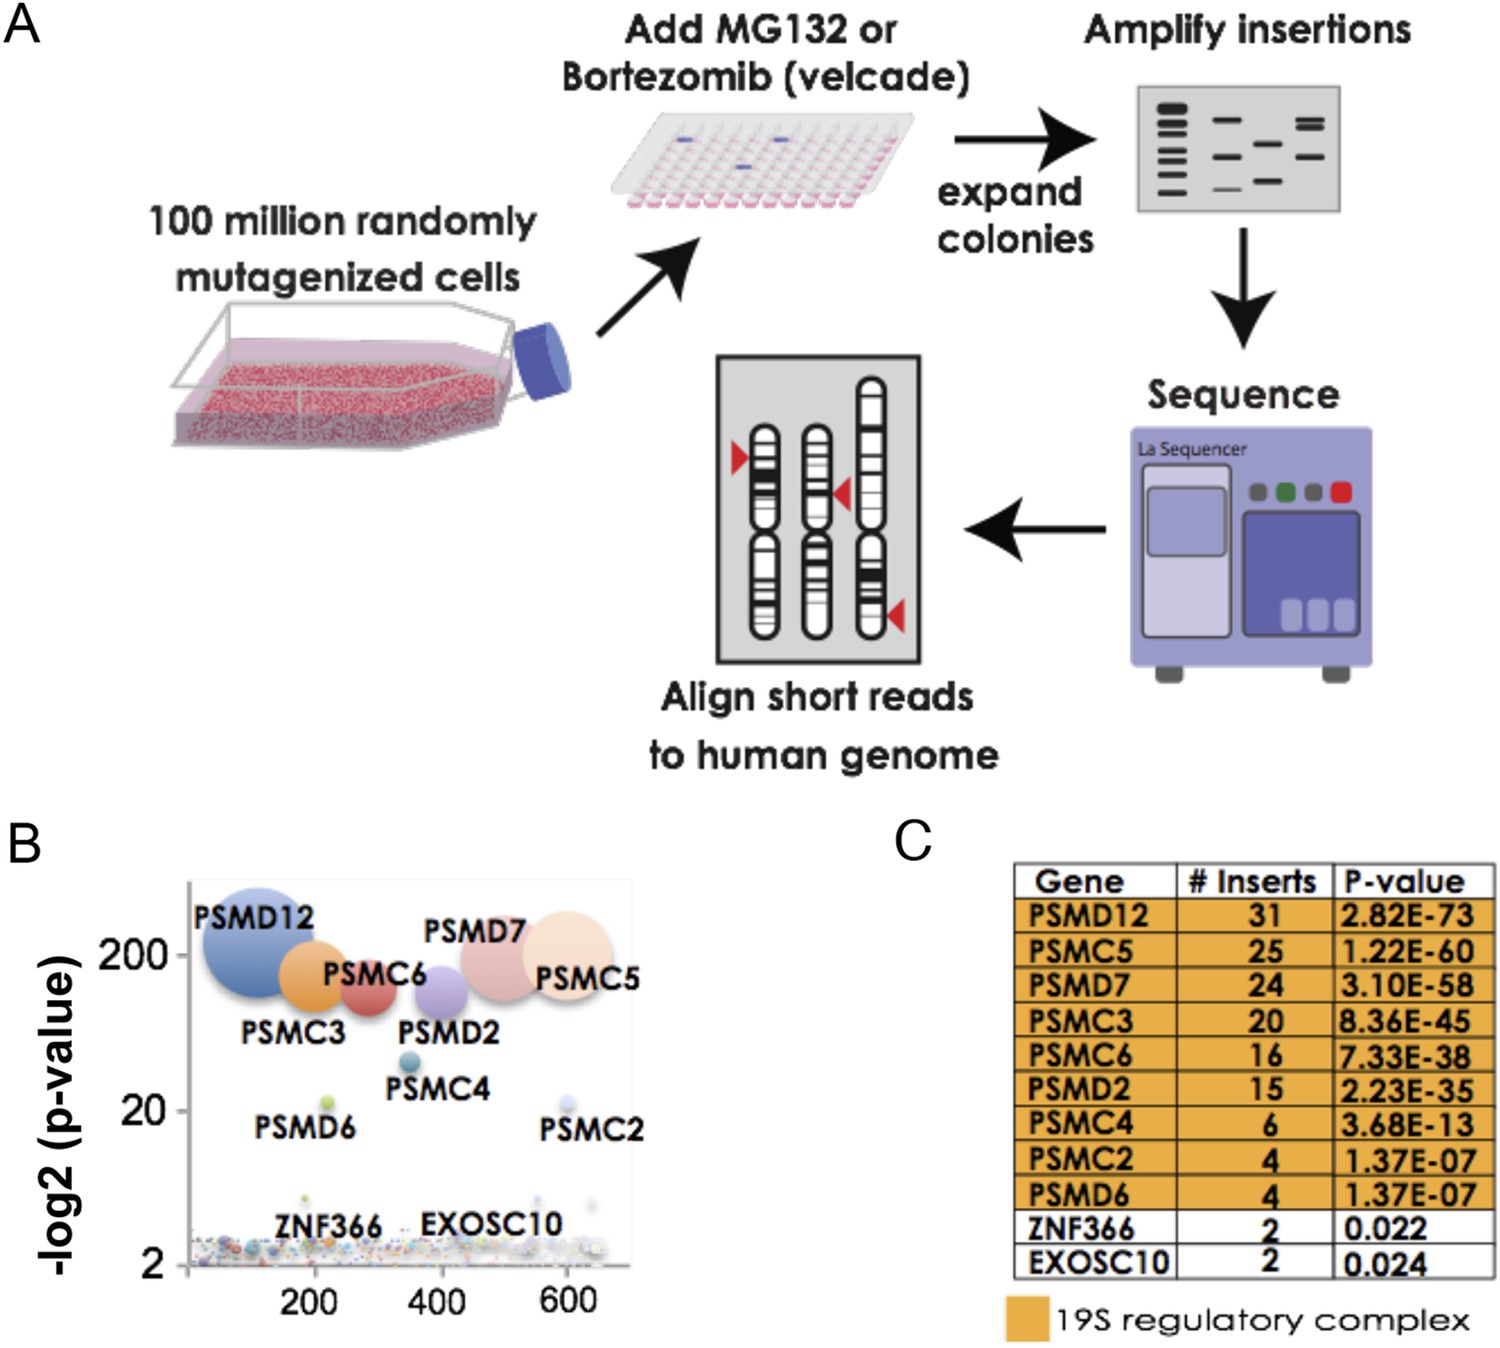
The 19S regulatory subunits of the proteasome are the most significant mediators of resistance to proteasome inhibitor toxicity.
(A) Schematic representation of the screen. One hundred million KBM7 cells subjected to random gene deletion using retroviral gene-trap insertions were exposed to either MG132 (700 nM) or bortezomib (18 nM) for 4 weeks. Surviving cells were expanded and insertions identified by sequencing. (B) The p-values of the recovered insertions from the MG132 screen are plotted (log2). Bubble sizes represent the number of insertions. (C) Compilation of the most significant gene deletions conferring resistance to MG132 with the gene name, number of inserts, and p-value. The subunits of the 19S regulatory complex are highlighted with orange.
Figure 1—figure supplement 1
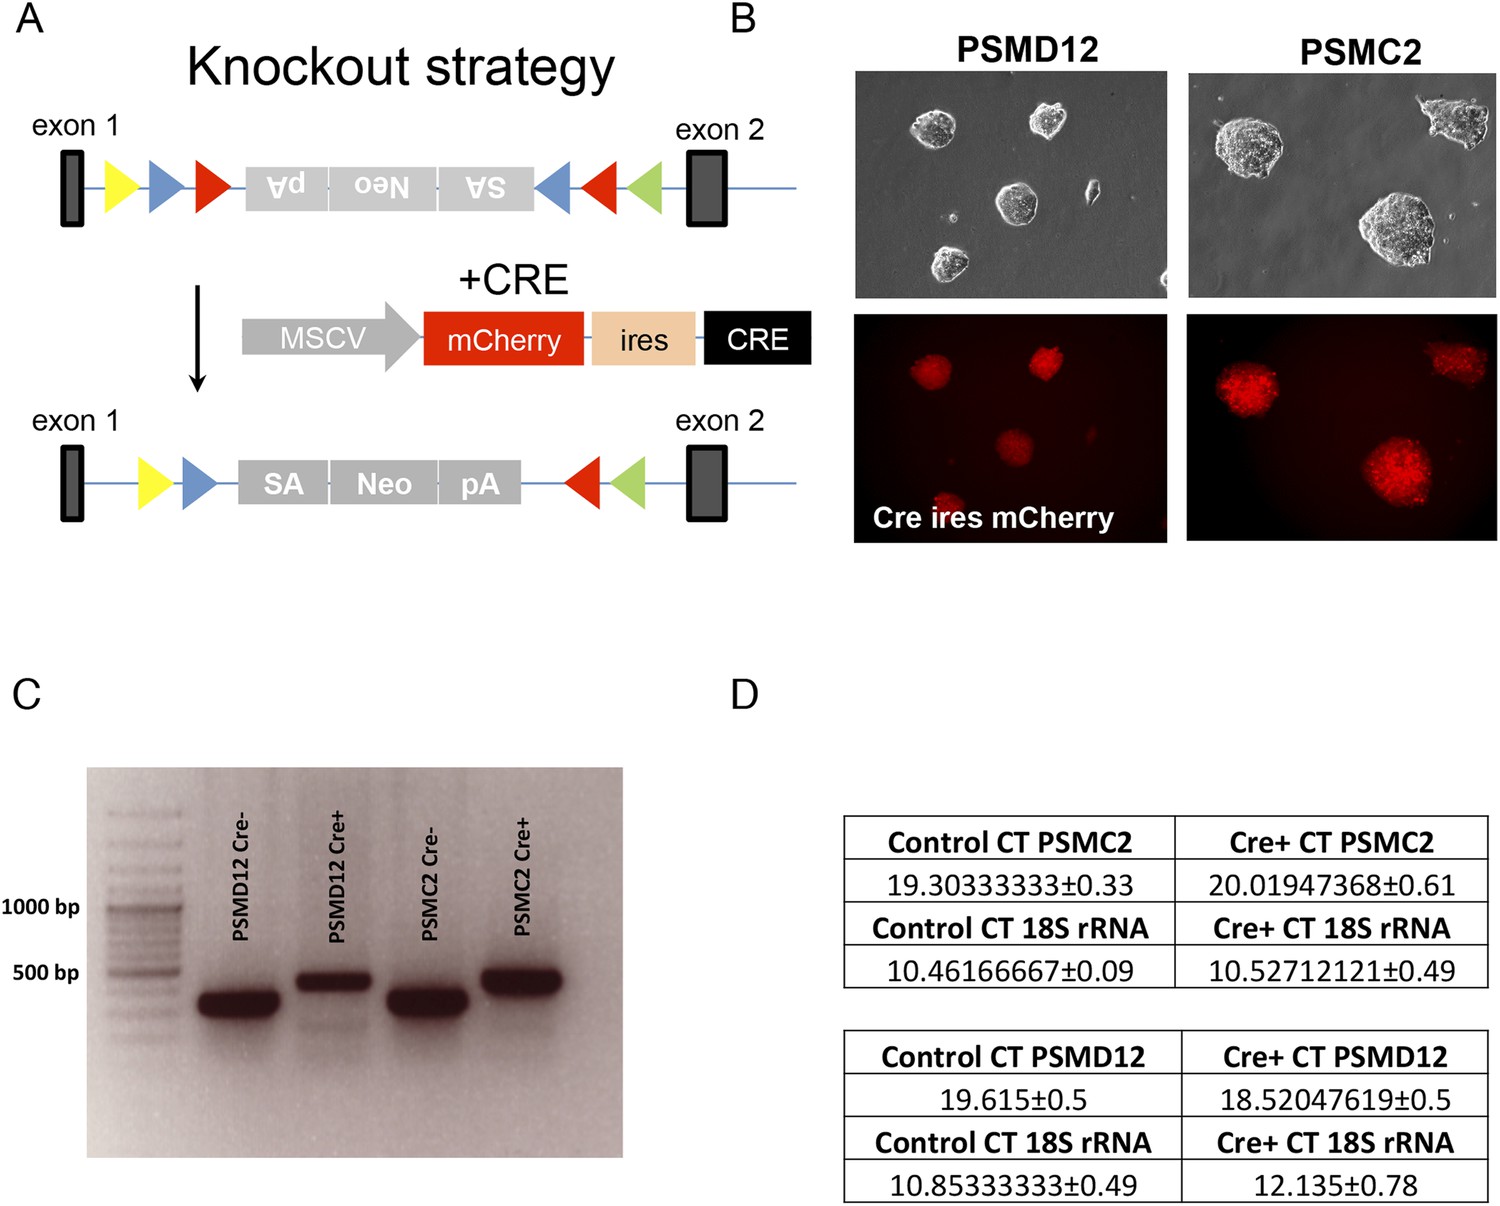
(A) Schematic representation of the knockout strategy to generate the mutant PSMD12 and PSMC2 ES cells.
Genetraps are in antisense (top), and sense (bottom) orientation. (B) Brightfield (top panels) and fluorescence (lower panels) microscopic imaging of FACS sorted PSMD12 and PSMC2 clones, stably expressing Cre IRES mCherry fusion transcripts (40× mag). (C) Genotyping of the ES clones by PCR before and after Cre-mediated inversion. (D) Relative gene expression of PSMD12 and PSMC2 in control and mutants as quantified by RT PCR (n = 16–18 for each gene).
Figure 2 with 1 supplement

Reducing expression of 19S subunits increases the levels of active 20S proteasomes and protects cancer cells from proteasome inhibition.
(A) HepG2 cells were infected with 80 shRNAs targeting 20 different subunits of the proteasome and 10 control shRNAs. Infected cells were then exposed to 12 nM bortezomib and cell number was examined 4 days later. The plot represents the average (± SEM) of four different hairpins targeting the indicated proteasome subunits and their relative cell number following bortezomib treatment. 19S subunits are depicted with orange bars, the control with a blue bar, and 20S subunits with green bars. (B) HepG2 cells harboring either a control shGFP or shRNAs targeting two proteasome subunits (shPSMC5, shPSMD2) displayed significant growth differences in the presence of 12 nM bortezomib. (C) Proteasome complex content in the shGFP-, shPSMC5-, and shPSMD2-expressing HepG2 cells was analyzed by native gel electrophoresis after 24 hr of treatment with or without 12 nM bortezomib revealing an increase in 20S proteasome levels and activity in cells knocked down for PSMC5 or PSMD2. (D) The relative cell number of cells harboring a control shLacZ or each of 4 individual shRNAs targeting shPSMD2 was analyzed 4 days after addition of the indicated concentrations of bortezomib. (E) HepG2 cells stably expressing four different shRNAs targeting the PSMD2 subunit and a control shRNA (lacZ) were analyzed by Western blot for the indicated proteins 24 hr with or without bortezomib treatment. (F) Proteasome complex levels and activity in a control HepG2 cells and 4 cell lines with reduced PSMD2 levels with and without a 24 hr incubation with bortezomib (12 nM). Proteasome complex levels were detected by immunoblot analysis and 20S proteasome activity by measuring the hydrolysis of Suc-LLVY-AMC by substrate overlay assays. In B and C, the graph represents the average of four replicas and their SEM. The p-values were obtained by conducting a two-tailed unpaired t-test. *p < 0.05 **p < 0.01 Bortz- Bortezomib (E).
Figure 2—figure supplement 1
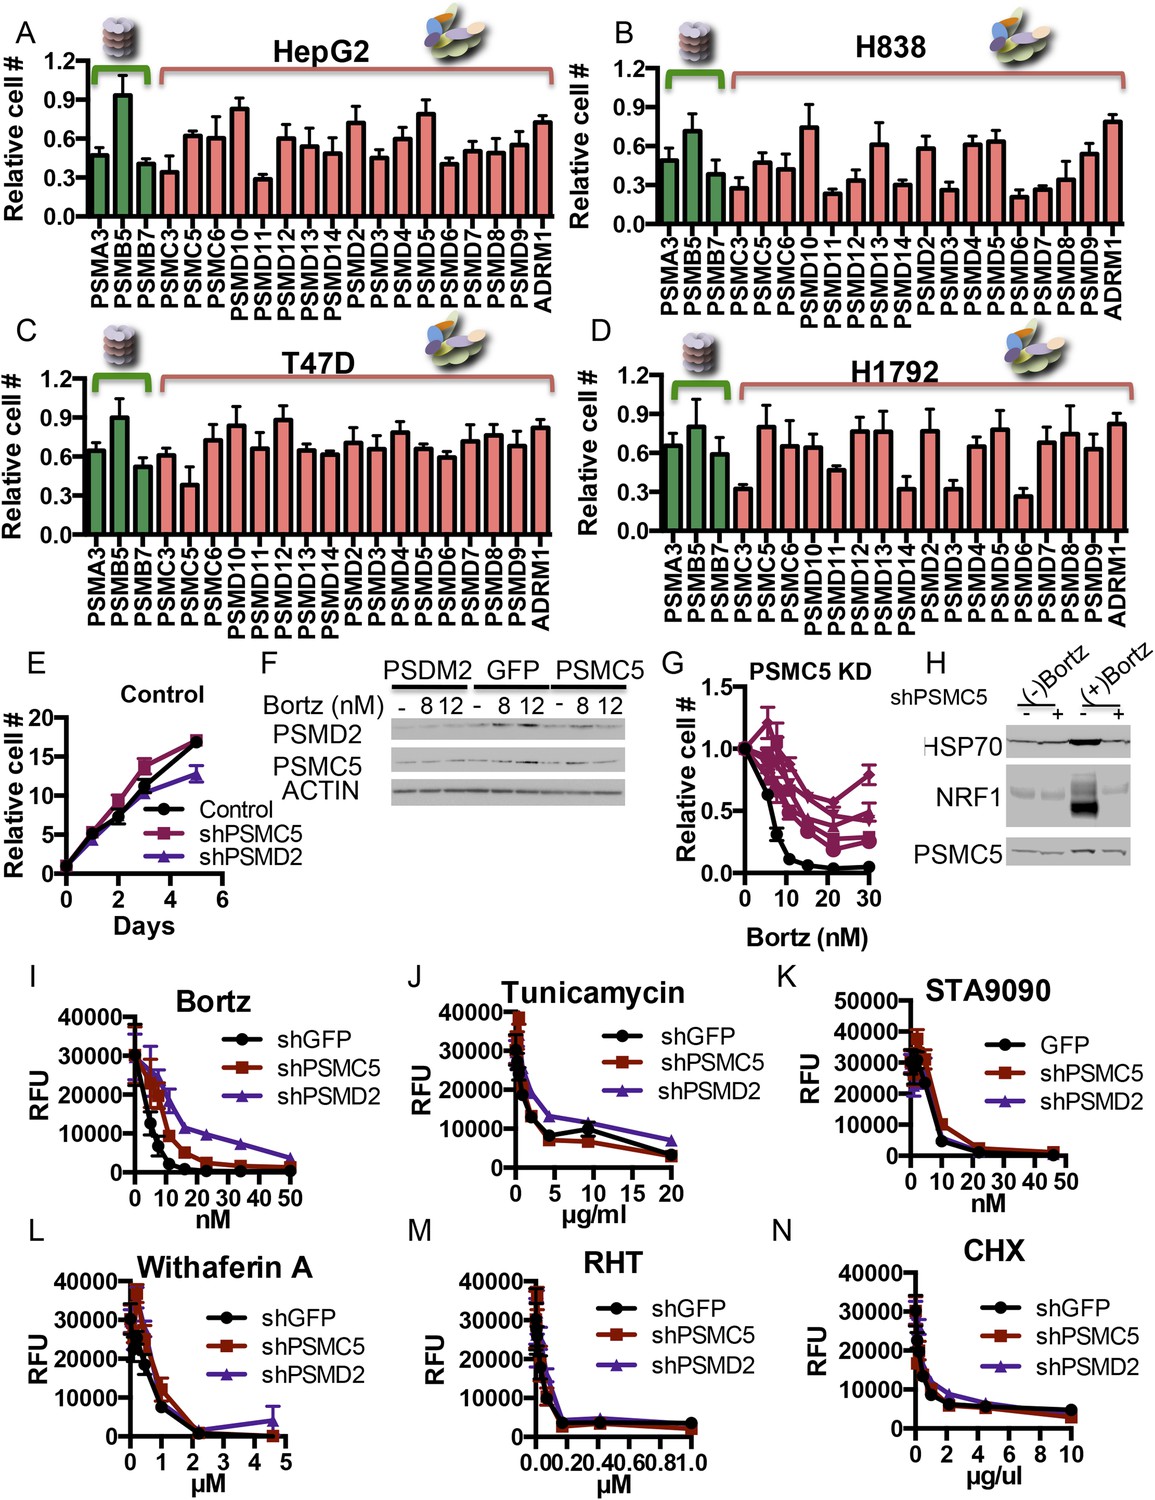
(A–D) Examining the effect of proteasome subunit knockdown in different cell lines.
80 shRNAs targeting 20 different proteasome subunits and control hairpins were expressed in HepG2 (A), H838 (B), T47D (C), and H1792 (D) cells by viral transduction. Each subunit was targeted by 4 different shRNAs and the cell viability was measured as the relative cell number compared to the average of non-targeting shRNAs 5 days after the initial introduction of the shRNAs. (E, F) HepG2 cells with shRNAs targeting PSMC5, PSMD2, and green fluorescent protein (GFP) were grown out. Their relative growth was analyzed in the absence of bortezomib (E) and their protein content was analyzed 24 hr after the addition of either 8 or 12 nM of bortezomib (F). (G) The relative cell number of cells harboring a control shLacZ (black) or each of 5 individual shRNAs targeting shPSMC5 (Cayenne) was analyzed 4 days after addition of the indicated concentrations of bortezomib. (H) HepG2 cells stably expressing shRNAs targeting the PSMC5 subunit and a control shRNA (lacZ) were analyzed by Western blot for the indicated proteins 24 hr with or without bortezomib treatment. (I–N) The HepG2 cells with shRNAs targeting PSMC5, PSMD2, and GFP (described above) were further exposed to a short panel of stress inducers including bortezomib (I), tunicamycin (J), rohinitib-RHT (K), Hsp90 inhibition (L), withaferin A (M), and cyclohexamide (N) at indicated concentrations and the relative cell number (RFU) was examined after 4 days. The graphs represent the average of at least 4 different measurements and the SEM.
Figure 3 with 1 supplement
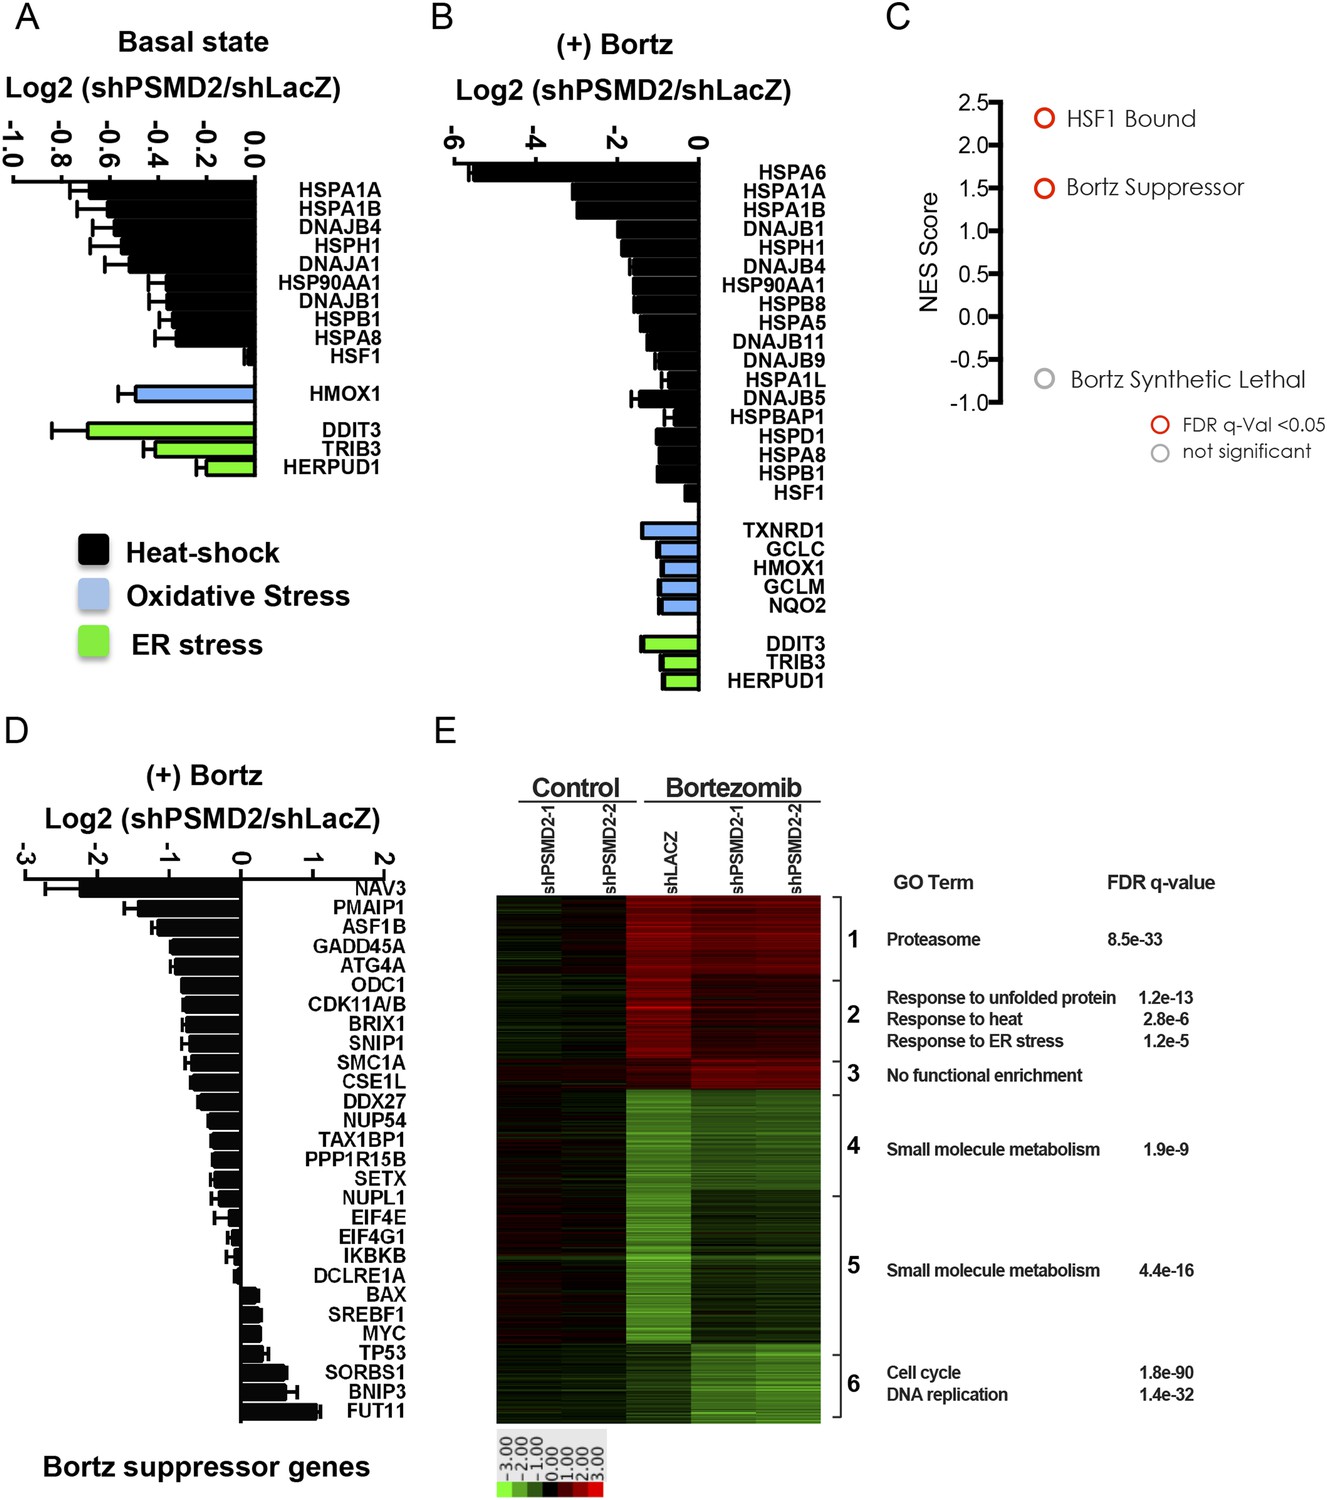
Inhibition of bortezomib-mediated transcriptional responses in PSMD2 knockdown cells.
RNA-seq gene expression profiling was conducted on HepG2 cells that harbor two different shRNAs targeting PSMD2 (PSMD2-1, PSMD2-2; same cells used in Figure 2F) and on control cells (shLacZ). The effects of reducing PSMD2 levels on gene expression were highly correlated in both basal conditions (Pearson's r = 0.99) and following bortezomib treatment (Pearson's r = 0.94). (A, B) Heat-shock- (black), oxidative stress- (blue), and ER stress- (green) related gene expression were all lower in the PSMD2 knockdown cells vs control cells under both basal conditions (A) and upon introduction of 12 nM bortezomib for 24 hr (B). (C) Gene set enrichment analysis of genes upregulated in control but not in PSMD2 shRNA cells following bortezomib treatment. Enrichment was calculated for the indicated gene sets and is presented as a normalized enrichment score (NES). Statistically significant enrichment (false discovery rate [FDR] q-value < 0.05) is shown in red; non-significant enrichment is shown in gray. (D) Expression levels of genes previously characterized as suppressors of bortezomib-induced toxicity (Chen et al., 2010) are down-regulated in the PSMD2 knockdown cells following the addition of bortezomib. (E) Heat map depicting fold change in mRNA levels of genes differentially expressed in cells harboring control shRNA or PSMD2 shRNAs in the presence or absence of 12 nM bortezomib. Gene ontology enrichment is shown to the right of the panel.
Figure 3—figure supplement 1
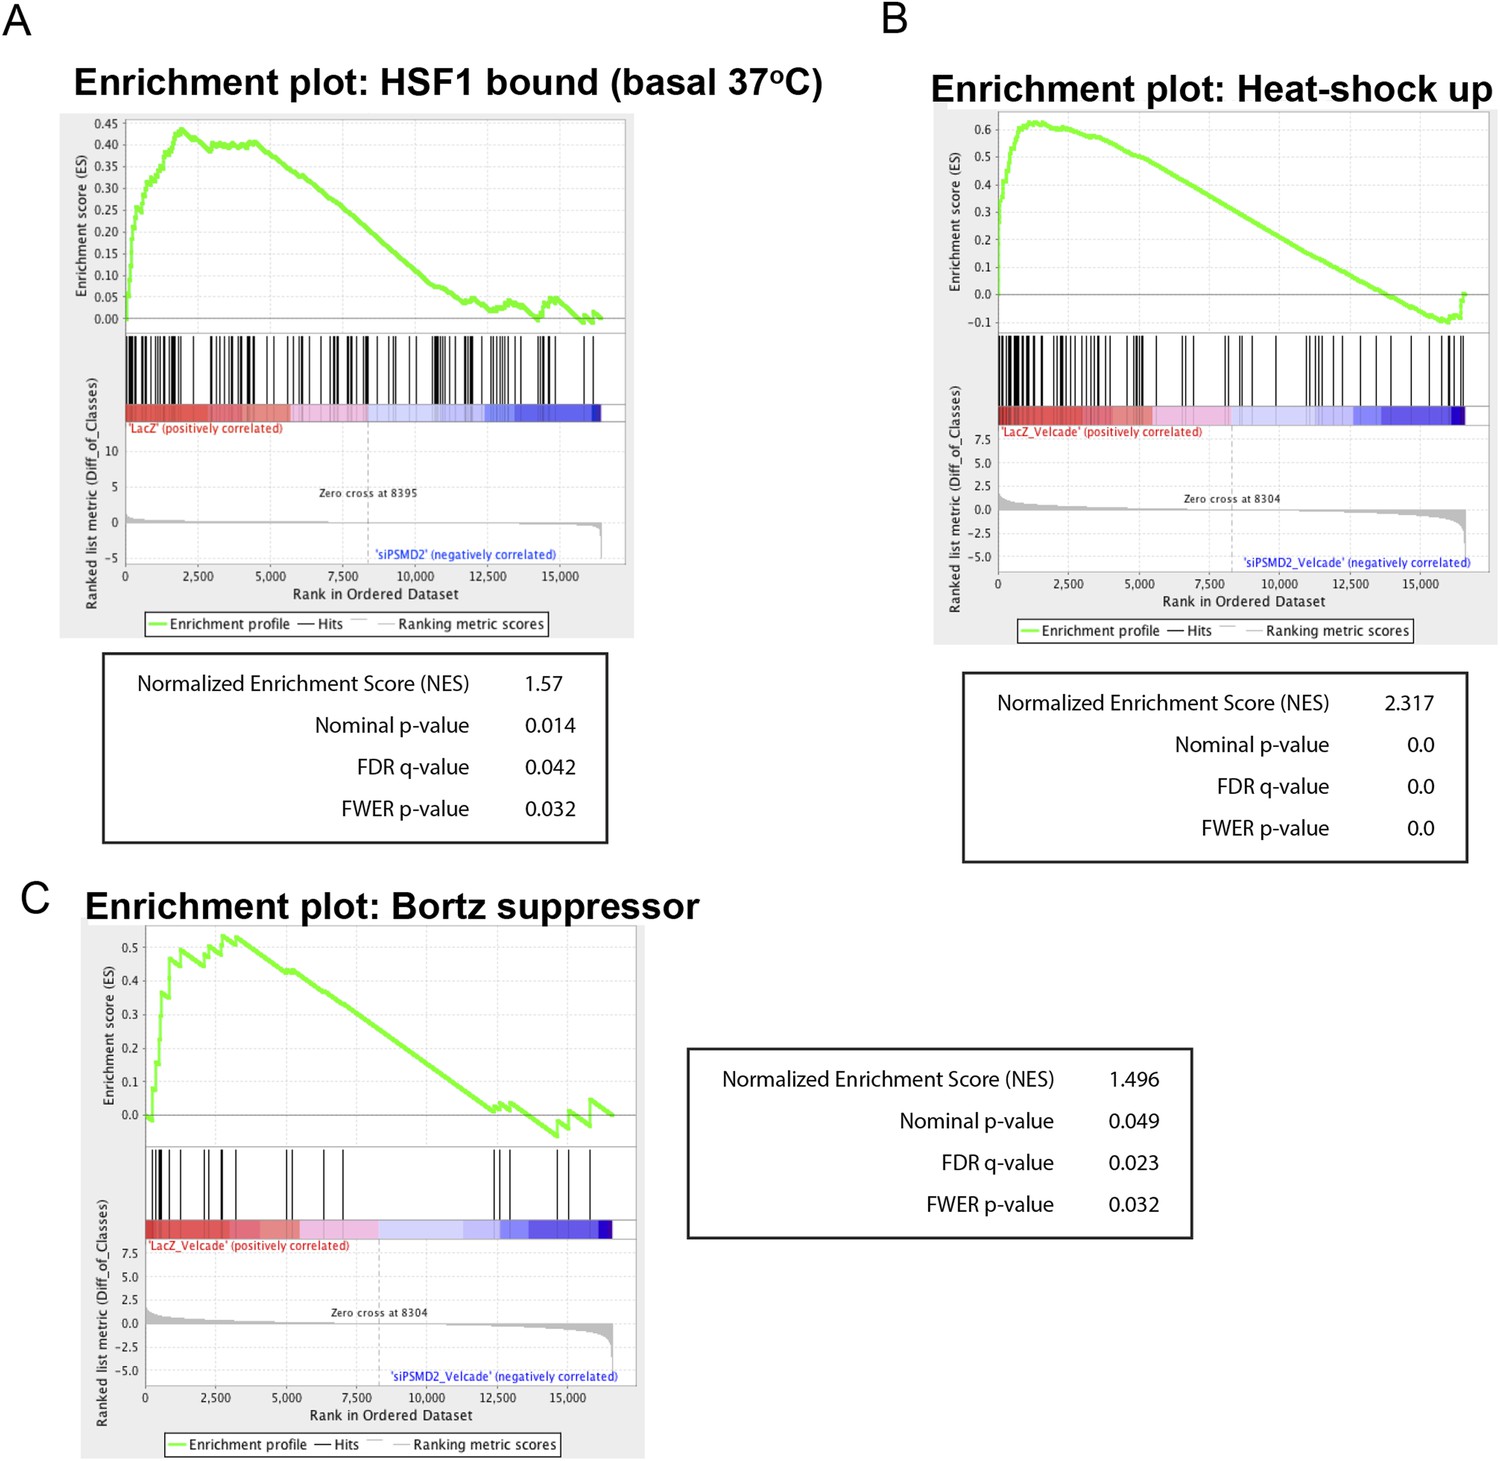
(A) Gene set enrichment analysis using the set of genes that are bound by HSF1 in MCF7 cancer cells under 37° basal conditions (Mendillo et al., 2012) was performed on genes negatively regulated in PSMD2 knockdown cells (siPSMD2) vs control cells (LacZ).
(B, C) Gene set enrichment analysis using the set of genes that are induced following heat shock (B), or genes that when knocked down confer resistance to bortezomib (C) was performed on genes negatively regulated in PSMD2 knockdown cells treated with bortezomib (siPSMD2_Velcade) vs control cells treated with bortezomib (LacZ_Velcade). Enrichment plot and statistics are displayed.
Figure 4 with 1 supplement

Transient induction of PSMD2 shRNA is sufficient to promote resistance to proteasome inhibition.
(A) Schematic representation of the experimental design. (B) T47D cells harboring a doxycycline-inducible PSMD2 shRNA were grown in the presence or absence of 1 μg/ml doxycycline for 48 hr. Cells were then collected, washed, and plated in the absence of doxycycline for 24 hr prior to exposure to increasing concentrations of bortezomib. Relative cell numbers were measured 3 days later. (C) Protein content analysis by immunoblot for the indicated proteins on lysates from control or cells pre-treated for 48 hr with doxycycline (Dox), followed by a recovery of 24 hr and then incubation with 10 nM bortezomib for an additional 24 hr. (D) Native gel analysis of proteasome complexes in cells pre-treated as in (C). The proteasome complex levels and activity of the 20S proteasome were assessed by native gel electrophoresis. Loading controls were analyzed by immunoblot for PSMD2 and tubulin following SDS-PAGE. (E) Glycerol gradient fractionation (10–40%) was conducted on cells pre-treated for 48 hr with doxycycline (Dox), followed by a recovery of 24 hr and then incubation with 15 nM bortezomib for an additional 24 hr. Proteasome activity in the fractions collected was assessed with proteasome-Glo and proteasome content was analyzed by immunoblotting with PSMD1 and 20S subunits specific antibodies. (F) The rate of degradation was analyzed in cells with reduced levels of PSMD2 (green bars) vs control (red bars) in the presence or absence of 10 nM bortezomib (treatment for 20 hr) by monitoring the release of H3-Phe in pre-labeled cells. (G) Rate of total protein synthesis was determined in cells with reduced levels of PSMD2 (green bars) vs control (red bars) in the presence or absence of 10 nM bortezomib (treatment for 20 hr) by measuring the rate of incorporation of 3H-phenylalanine for 1 hr. The p-values were obtained by conducting a two-tailed unpaired t-test. **p < 0.01, ***p < 0.001.
Figure 4—figure supplement 1
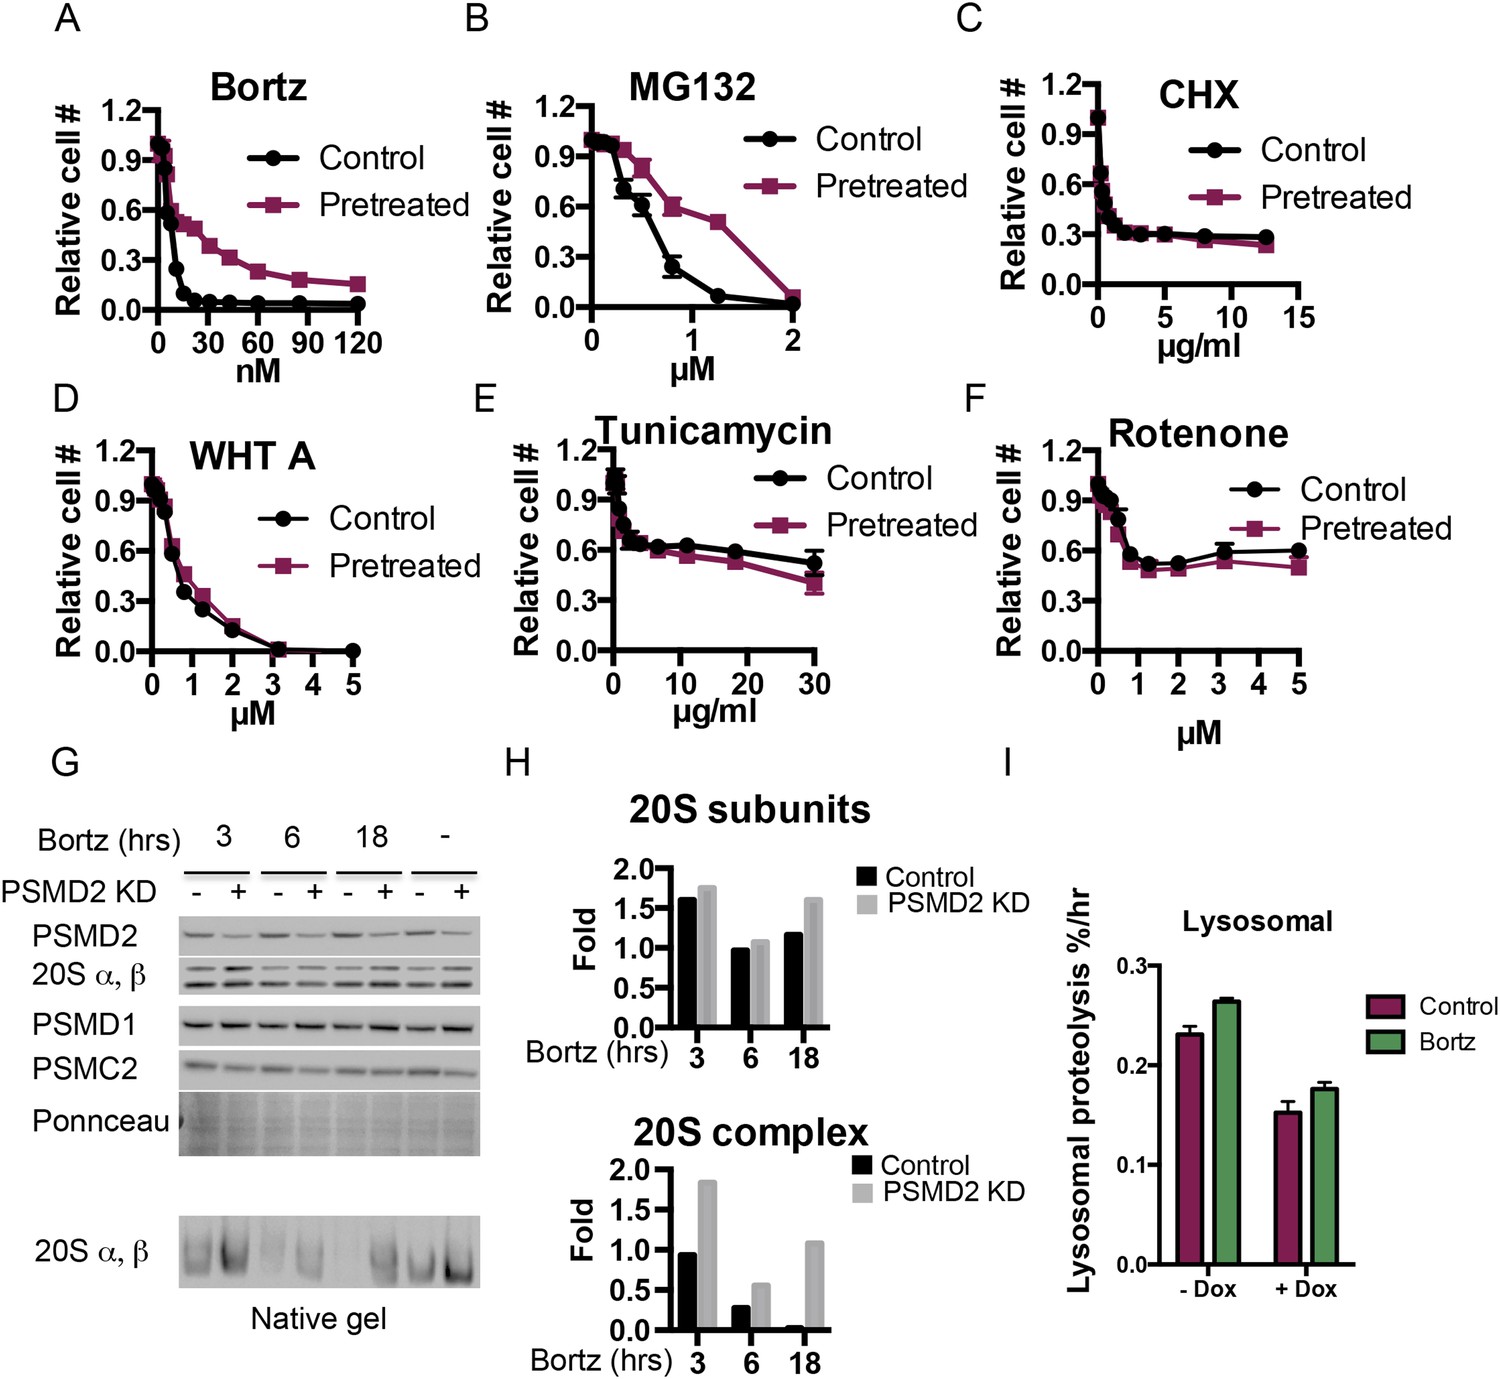
(A–F) PSMD2 shRNA was induced for 48 hr with 1 μg/ml doxycycline.
Cells were then collected, washed, and plated in the absence of doxycycline 24 hr prior to exposure to increasing concentration of bortezomib (A), MG132 (B), cyclohexamide (C), withaferin A (D), tunicamycin (E), and rotenone (F). (G–I) PSMD2 KD was induced as described above and then cells were grown in the presence or absence of 15 nM bortezomib for the indicated time points (3, 6, 24 hr). (G) Immunoblot analysis of the total proteasome subunits following SDS-PAGE (upper panels) and the 20S proteasome complex levels after native gel electrophoresis. These results were quantified by Imagelab software and plotted (H). (I) Lysosomal degradation rate was measured in control and PSMD2 knock down (Dox) cells in the presence or absence of 10 nM Bortezomib treatment for 20 hr.
Figure 5 with 1 supplement
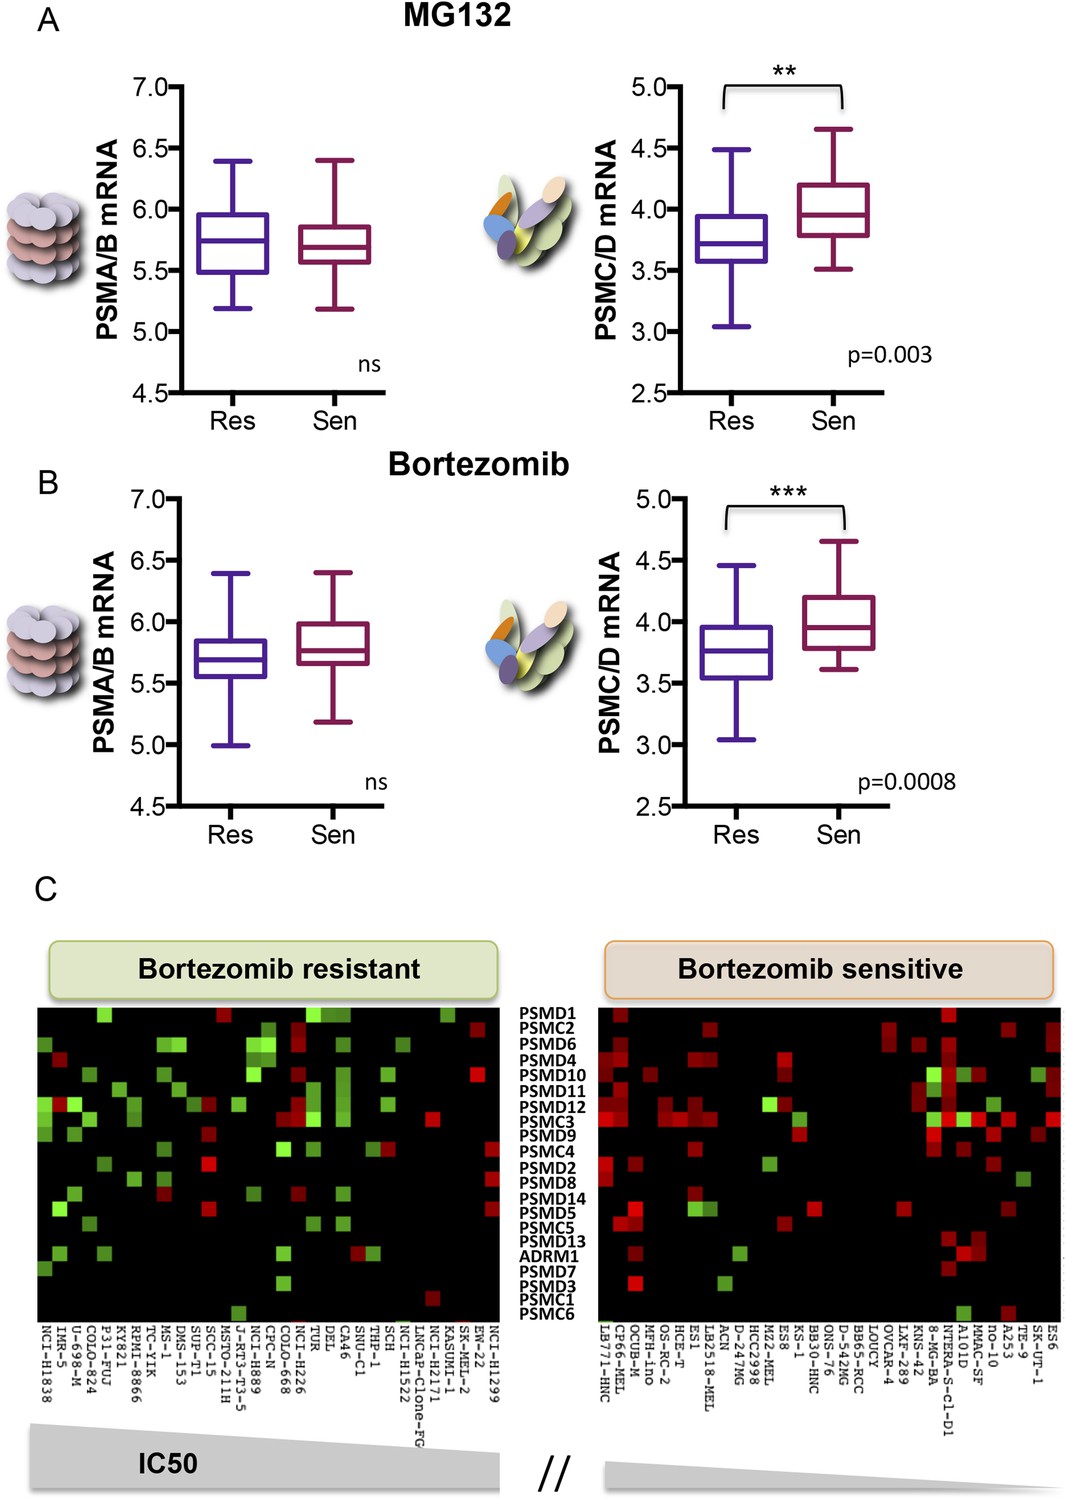
Reduced expression of 19S subunits correlates with resistance to proteasome inhibitors.
(A, B) Analysis of expression data from 315 cell lines in the Genomics of Drug Sensitivity in Cancer (GDSC) database (Garnett et al., 2012). The levels of 20S proteasome subunit (PSMAs and PSMBs) gene expression (A and B left panels) and 19S subunit (PSMCs and PSMDs) gene expression (A and B right panels) were analyzed in the cell lines that are the 10% most sensitive or the 10% most resistant to either MG132 (A) or bortezomib (B). (C) The relative expression level of each 19S complex subunit was analyzed in the bortezomib resistant and sensitive groups. Expression levels with deviation of more than twofold from the average were color-coded (red-up, green-down). The p-values were obtained by conducting a two-tailed unpaired t-test. **p < 0.01, ***p < 0.001.
Figure 5—figure supplement 1
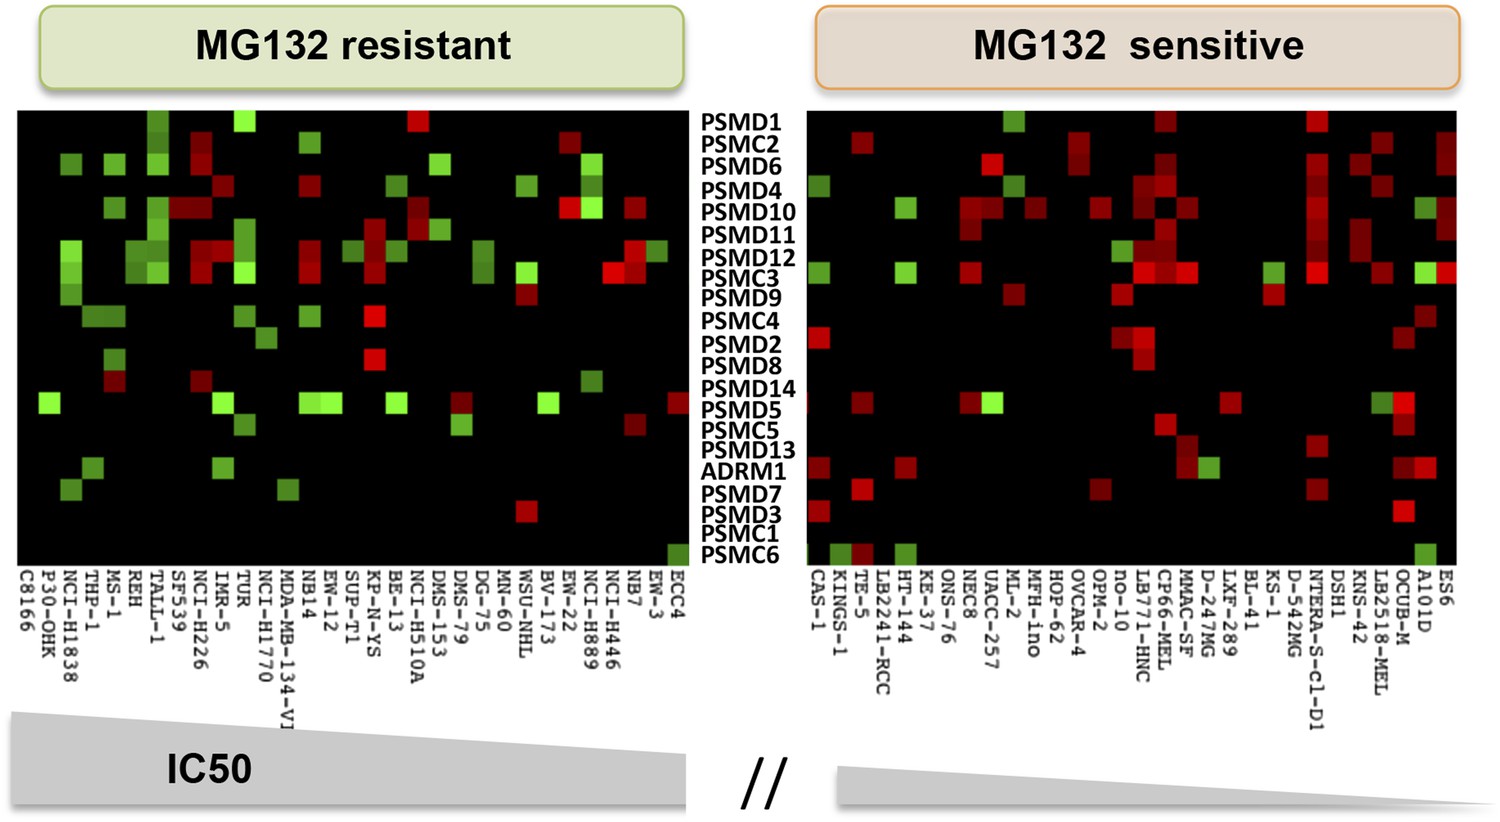
The relative expression level of each 19S complex subunit was analyzed in the MG132 resistant and sensitive groups.
Expression levels with deviation of more than twofold from the average were color-coded (red-up, green-down).
Figure 6
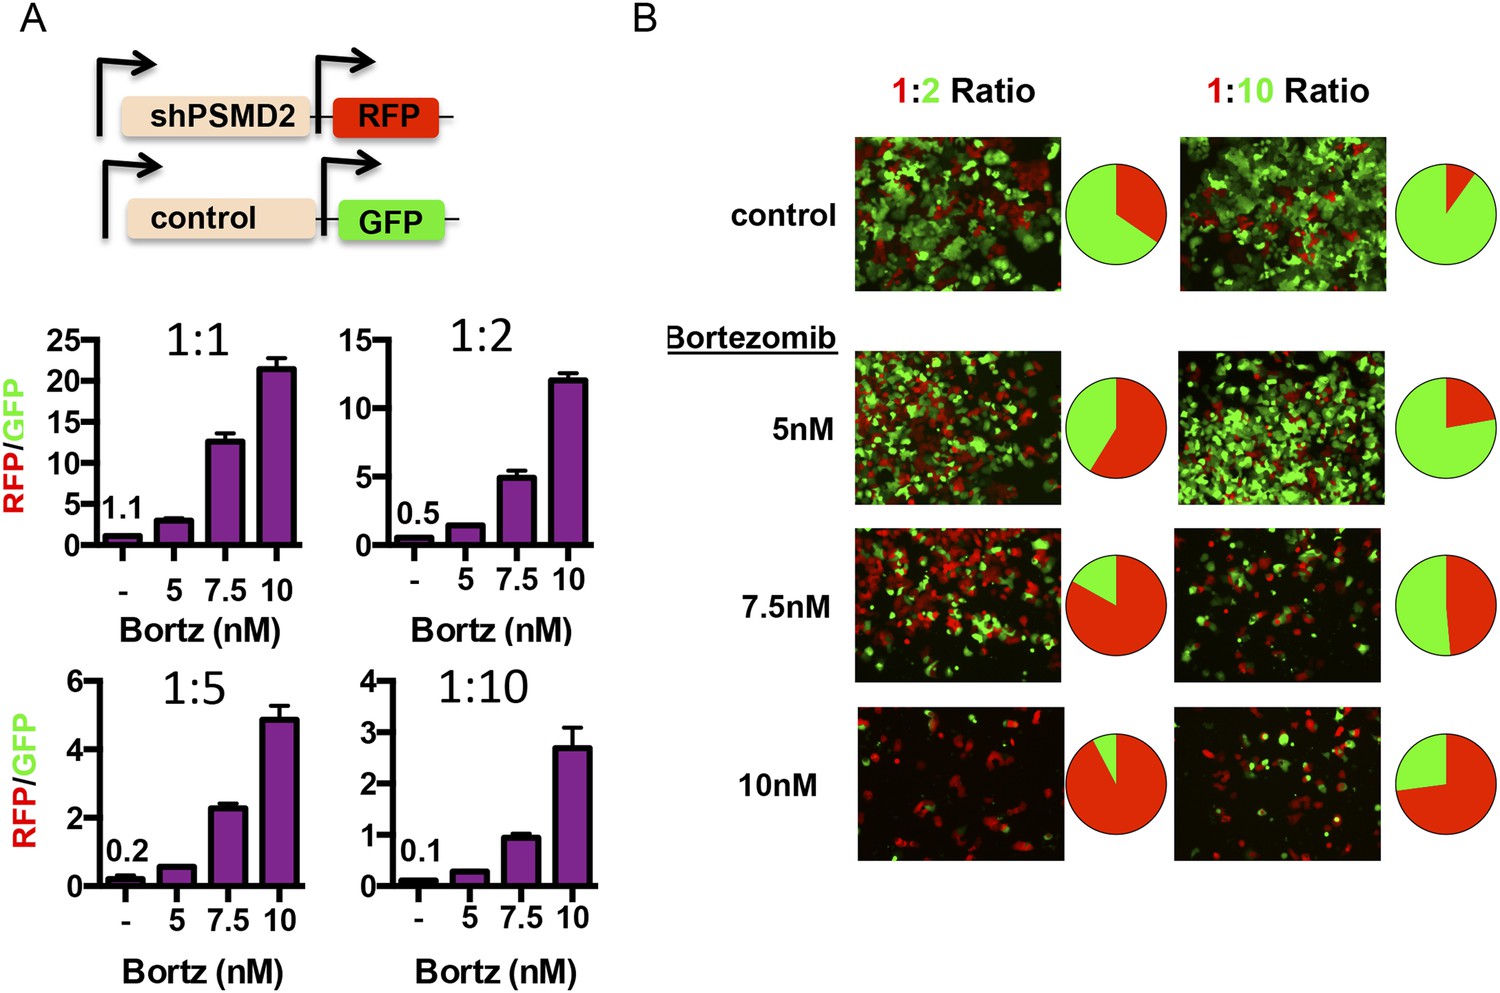
Transient 19S subunit reduction confers a competitive survival advantage in the presence proteasome inhibitors.
(A, B) T47D cells that harbor a doxycycline-inducible control shRNA (GFP) or a doxycycline-inducible PSMD2 shRNA (TurboRFP) were incubated with doxycycline for 48 hr. Cells were collected, counted, and plated at the indicated ratios of TurboRFP-expressing PSMD2 shRNAs/GFP expression control shRNAs (1:1, 1:2, 1:5, and 1:10). 24 hr later, bortezomib was added at the specified concentrations and incubation continued for 48 hr. Cells were allowed to recover in the absence of bortezomib for another 48 hr and then visualized by microscopy (B) or analyzed by FACS after 6 days of recovery (A, and pie charts in B). The green and red images were overlaid using ImageJ.
Figure 7 with 1 supplement
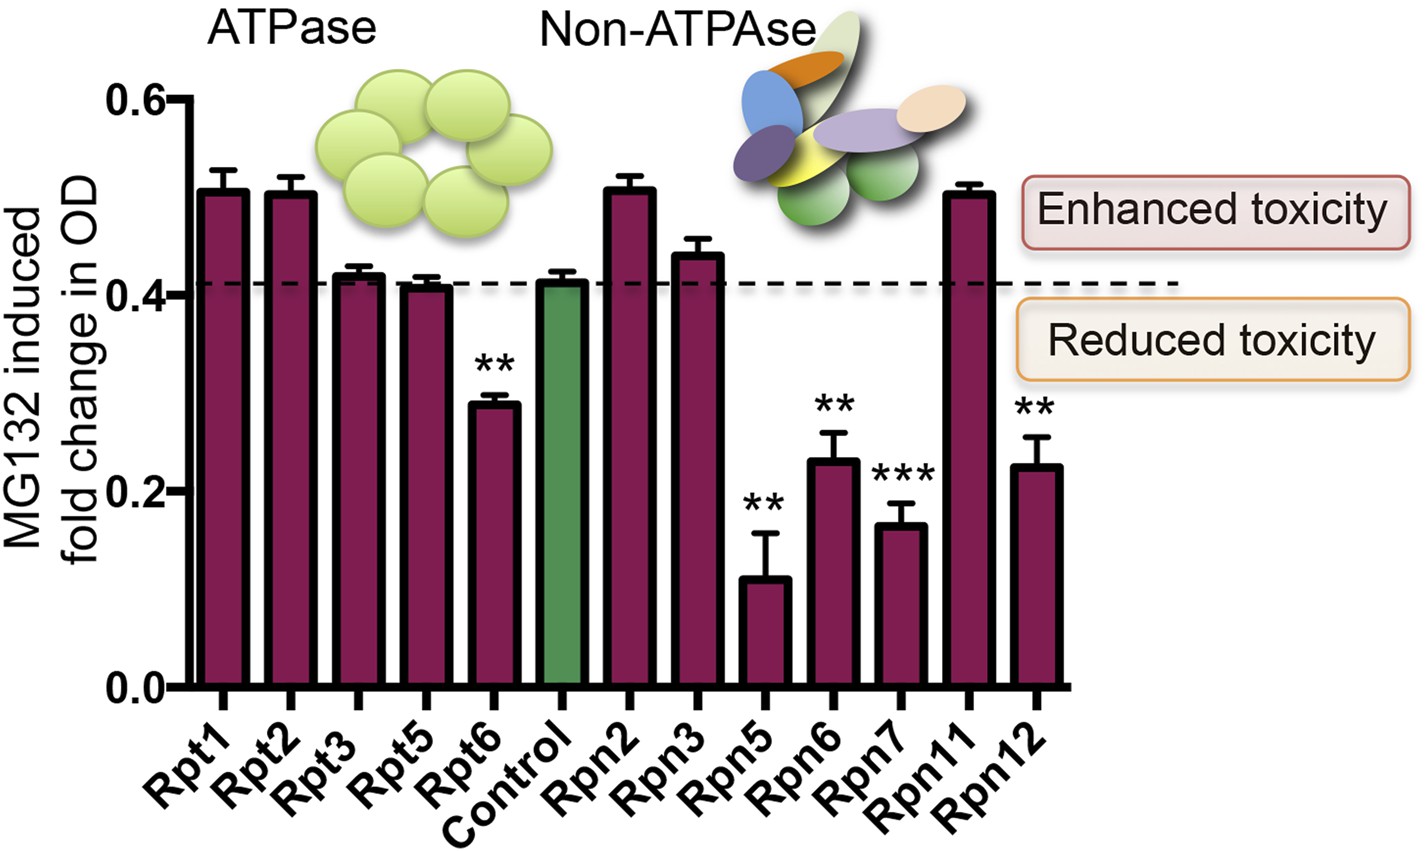
Reducing the levels of 19S subunits is an evolutionarily conserved mechanism to acquire resistance to proteasome inhibition.
Proteasome subunit DAmP strains and the BY4741 control strain were grown in the presence or absence of 50 μM MG132 for 48 hr. The relative change in OD induced by MG132 is plotted. Five proteasome subunit DAmP strains exhibited significantly reduced toxicity in the presence of MG132. **p < 0.01, ***p < 0.001.
Figure 7—figure supplement 1
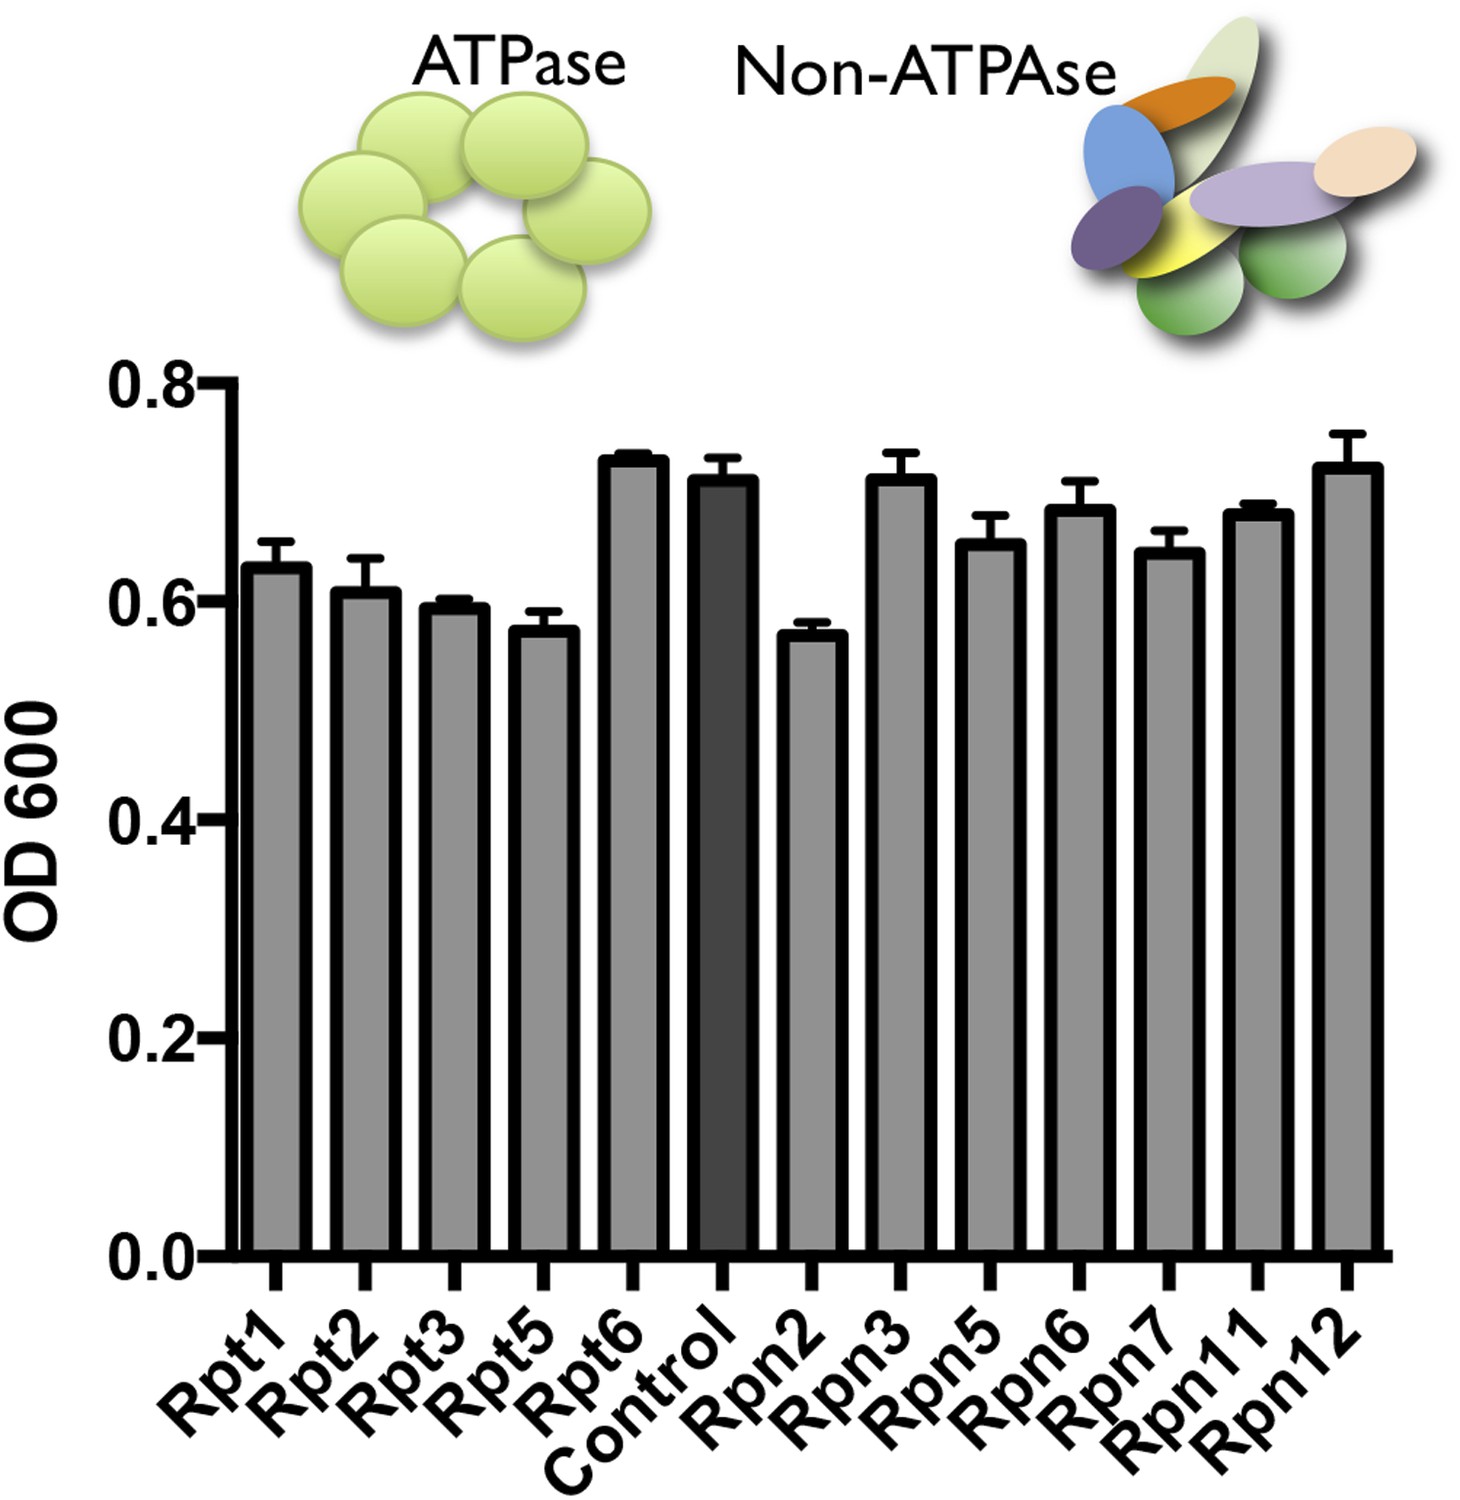
Proteasome subunit DAmP strains and the BY4741 control strain were grown in YPD media and OD600 was measured after 48 hr.
https://doi.org/10.7554/eLife.08467.015Additional files
-
Supplementary file 1
KBM7 screening hits for MG132 and bortezomib, insertions and p-values.
- https://doi.org/10.7554/eLife.08467.016
-
Supplementary file 2
Validation reagents: lentivirus clones, selected shRNAs, antibodies.
- https://doi.org/10.7554/eLife.08467.017
-
Supplementary file 3
RNA-seq analysis.
- https://doi.org/10.7554/eLife.08467.018
-
Supplementary file 4
Genomics of drug sensitivity in cancer analysis.
- https://doi.org/10.7554/eLife.08467.019
Download links
A two-part list of links to download the article, or parts of the article, in various formats.
Downloads (link to download the article as PDF)
Open citations (links to open the citations from this article in various online reference manager services)
Cite this article (links to download the citations from this article in formats compatible with various reference manager tools)
Compromising the 19S proteasome complex protects cells from reduced flux through the proteasome
eLife 4:e08467.
https://doi.org/10.7554/eLife.08467


