CarD uses a minor groove wedge mechanism to stabilize the RNA polymerase open promoter complex
- The Rockefeller University, United States
Figures
Figure 1 with 6 supplements
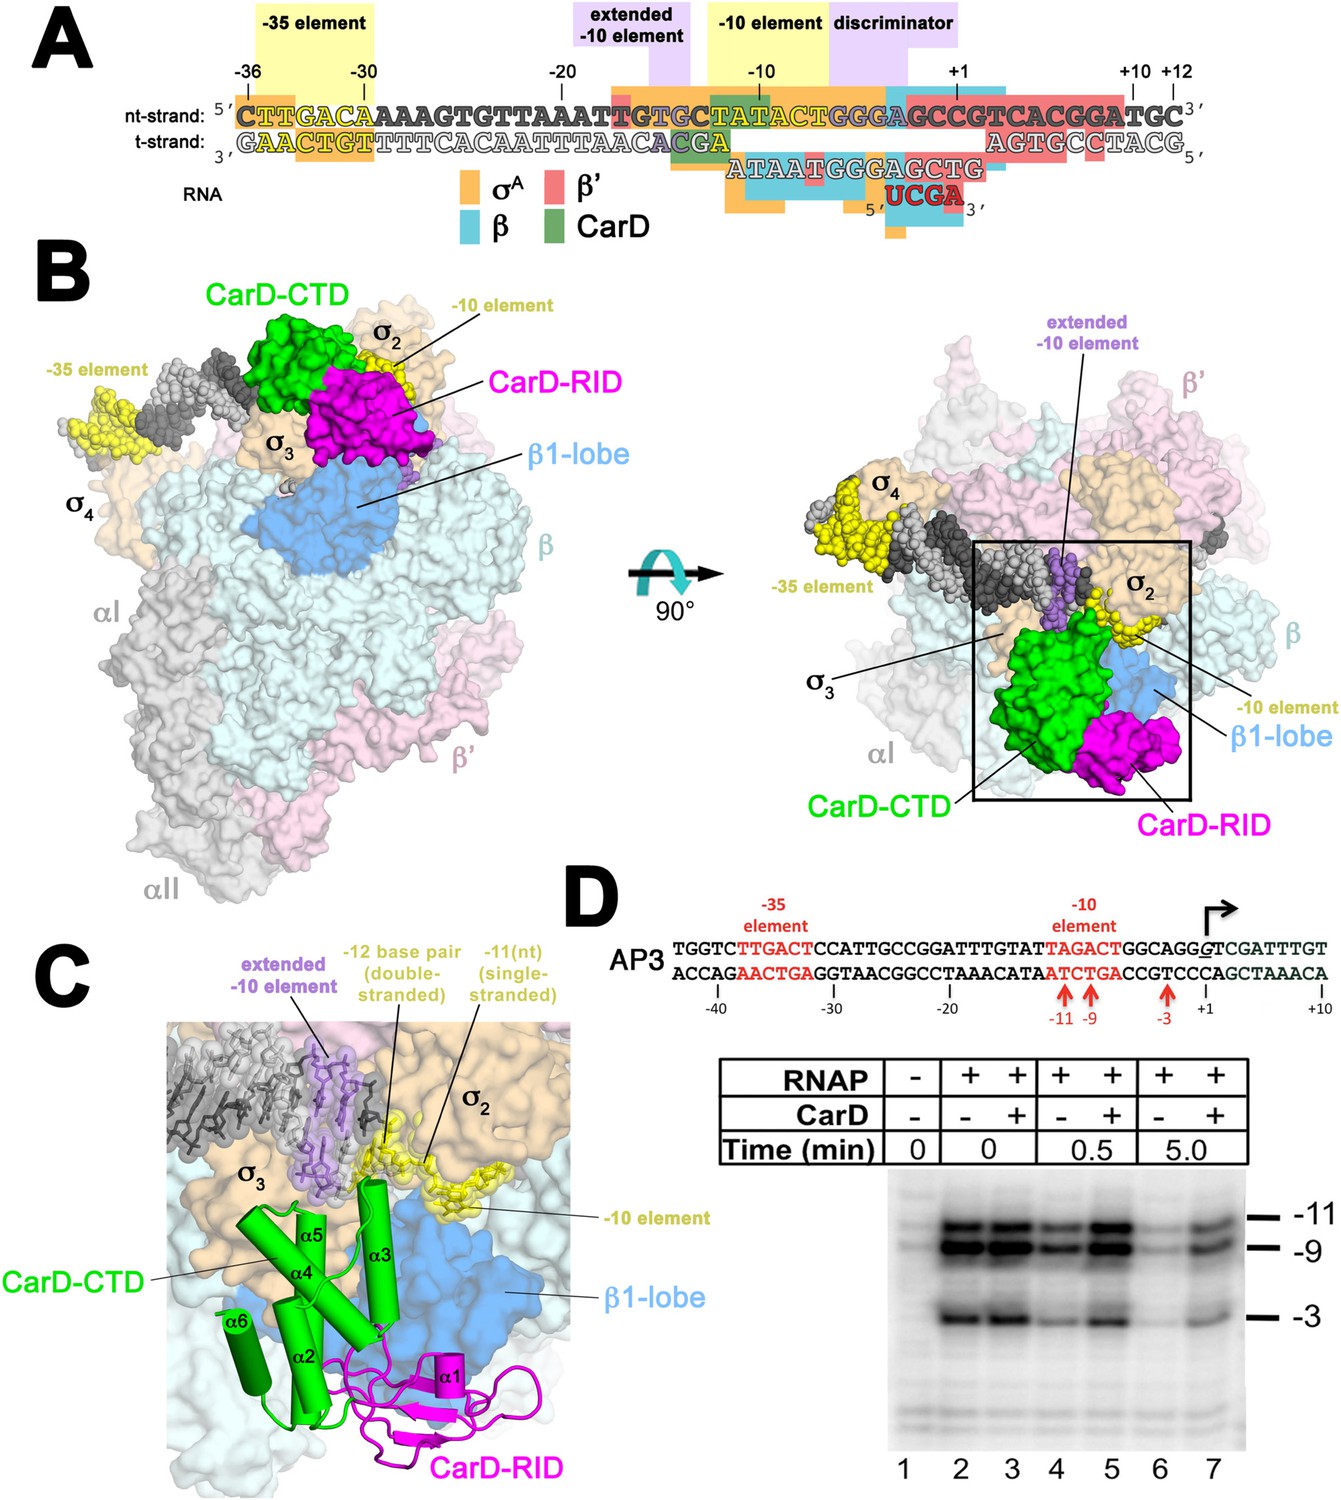
Structure of the Thermus CarD/RPo complex.
(A) Synthetic oligonucleotides used for CarD/RPo crystallization. The numbers above denote the DNA position with respect to the transcription start site (+1). The DNA sequence is derived from the full con promoter (Gaal et al., 2001). The −35 and −10 (Pribnow box) elements are shaded yellow, the extended −10 (Keilty and Rosenberg, 1987) and discriminator (Feklistov et al., 2006; Haugen et al., 2006) elements purple. The nt-strand DNA (top strand) is colored dark grey; the t-strand DNA (bottom strand), light grey; the RNA transcript, red. The colored blocks denote protein/nucleic acid interactions: σA, orange; β, cyan; β′, pink; CarD, green. CarD interacts exclusively at the upstream junction of the transcription bubble. (B) Overall structure of CarD/RPo—two orthogonal views. The nucleic acids are shown as CPK atoms and color-coded as above. Proteins are shown as molecular surfaces. The RNA polymerase (RNAP) holoenzyme is color coded as follows: αI, αII, ω, grey; β′, light pink; Δ1.1σA, light orange; β is light cyan except the β1-lobe (interacting with the CarD-RID, corresponding to RNAP β subunit residues 18–138 and 333–392) is light blue. The CarD-RID is magenta, CarD-CTD green. In the right view, the boxed region is magnified in (C). (C) Magnified view illustrating the CarD-RID/β1-lobe protein/protein interaction and CarD-CTD (α3 and α5)/DNA interactions at the upstream ds(−12)/ss(−11) junction of the transcription bubble. (D) CarD does not alter the transcription bubble. KMnO4 footprints (t-strand) of Thermus RNAP holoenzyme on the Mtb AP3 promoter. (Top) Sequence of the AP3 promoter (Hartmann et al., 1987). T-strand thymidines rendered KmnO4 reactive by RNAP are denoted (red arrows). (Bottom) KMnO4 footprints. Lane 1, no protein added; lanes 2–3, RNAP holoenzyme − or + CarD (respectively); lanes 4–7, the effect of incubating with a competitor promoter trap for the indicated amounts of time.
Figure 1—figure supplement 1
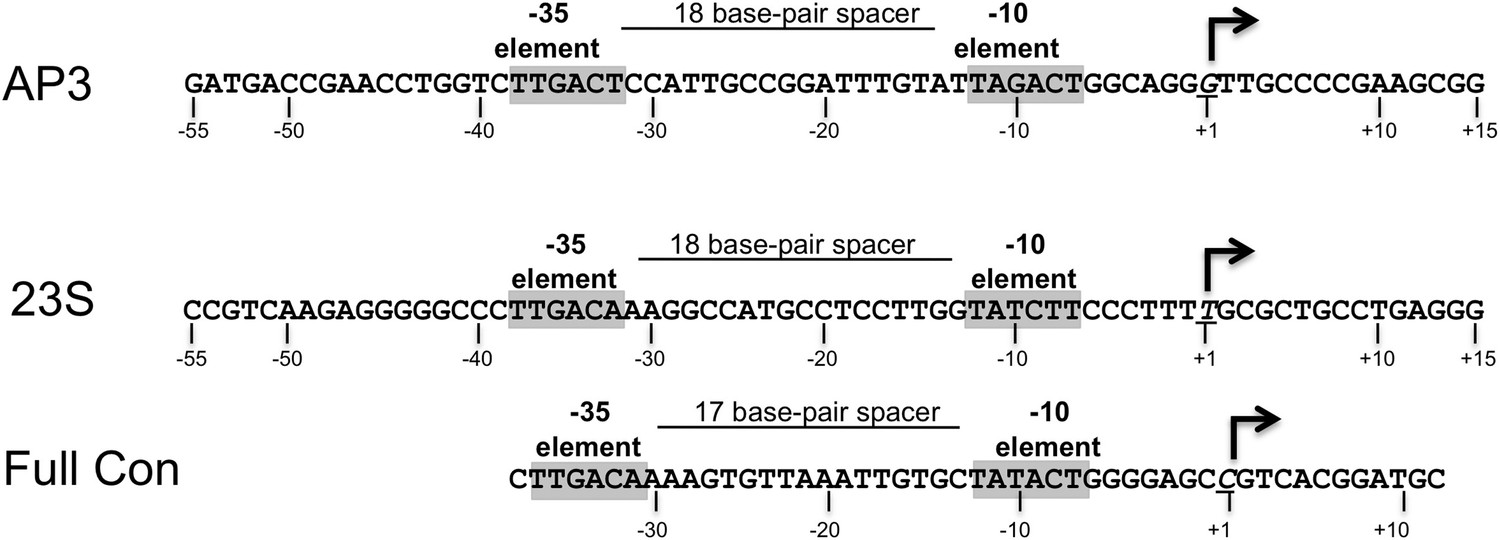
Sequences of Mtb rrnAAP3 (Gonzalez-y-Merchand et al., 1996) and Tth 23S ribosomal RNA (rRNA) (Hartmann et al., 1987), promoters used in in vitro assays, and full con (Gaal et al., 2001) used for structural studies.
https://doi.org/10.7554/eLife.08505.005
Figure 1—figure supplement 2
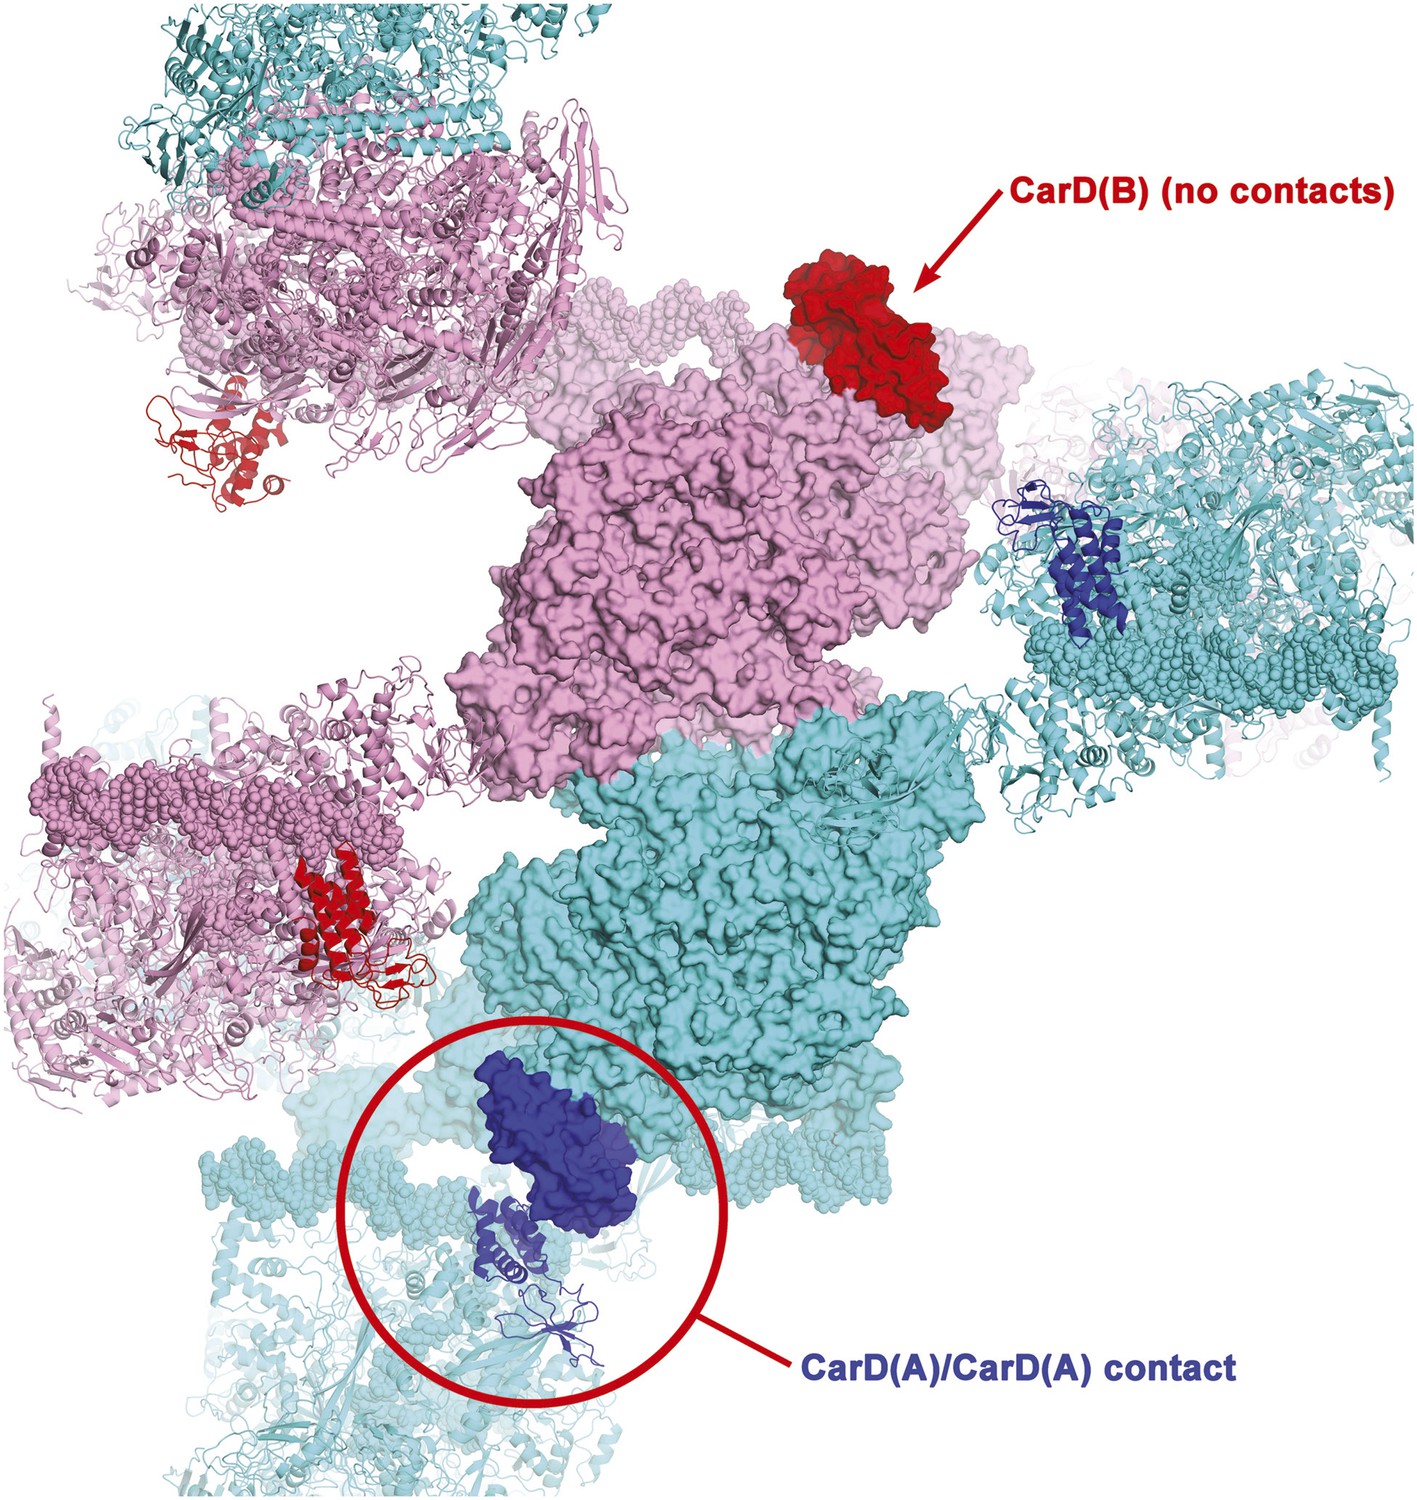
Crystal packing interactions in CarD/RPo P43212 crystals.
One asymmetric unit of the crystals contains two CarD/RPo complexes, complex A [RNAP(A), cyan; CarD(A), blue] and complex B [RNAP(B), pink; CarD(B), red]. One central asymmetric unit is shown (proteins as molecular surfaces), with neighboring symmetry-related complexes shown as ribbons; only symmetry-related complexes that make crystal packing contacts with the central asymmetric unit are shown. CarD(A) makes a crystal packing contact with a symmetry-related CarD(A) (circled in red), but CarD(B) is not involved in any crystal packing interactions. Nevertheless, the protein/protein and protein/DNA contacts in complex(A) and complex(B) are essentially identical.
Figure 1—figure supplement 3
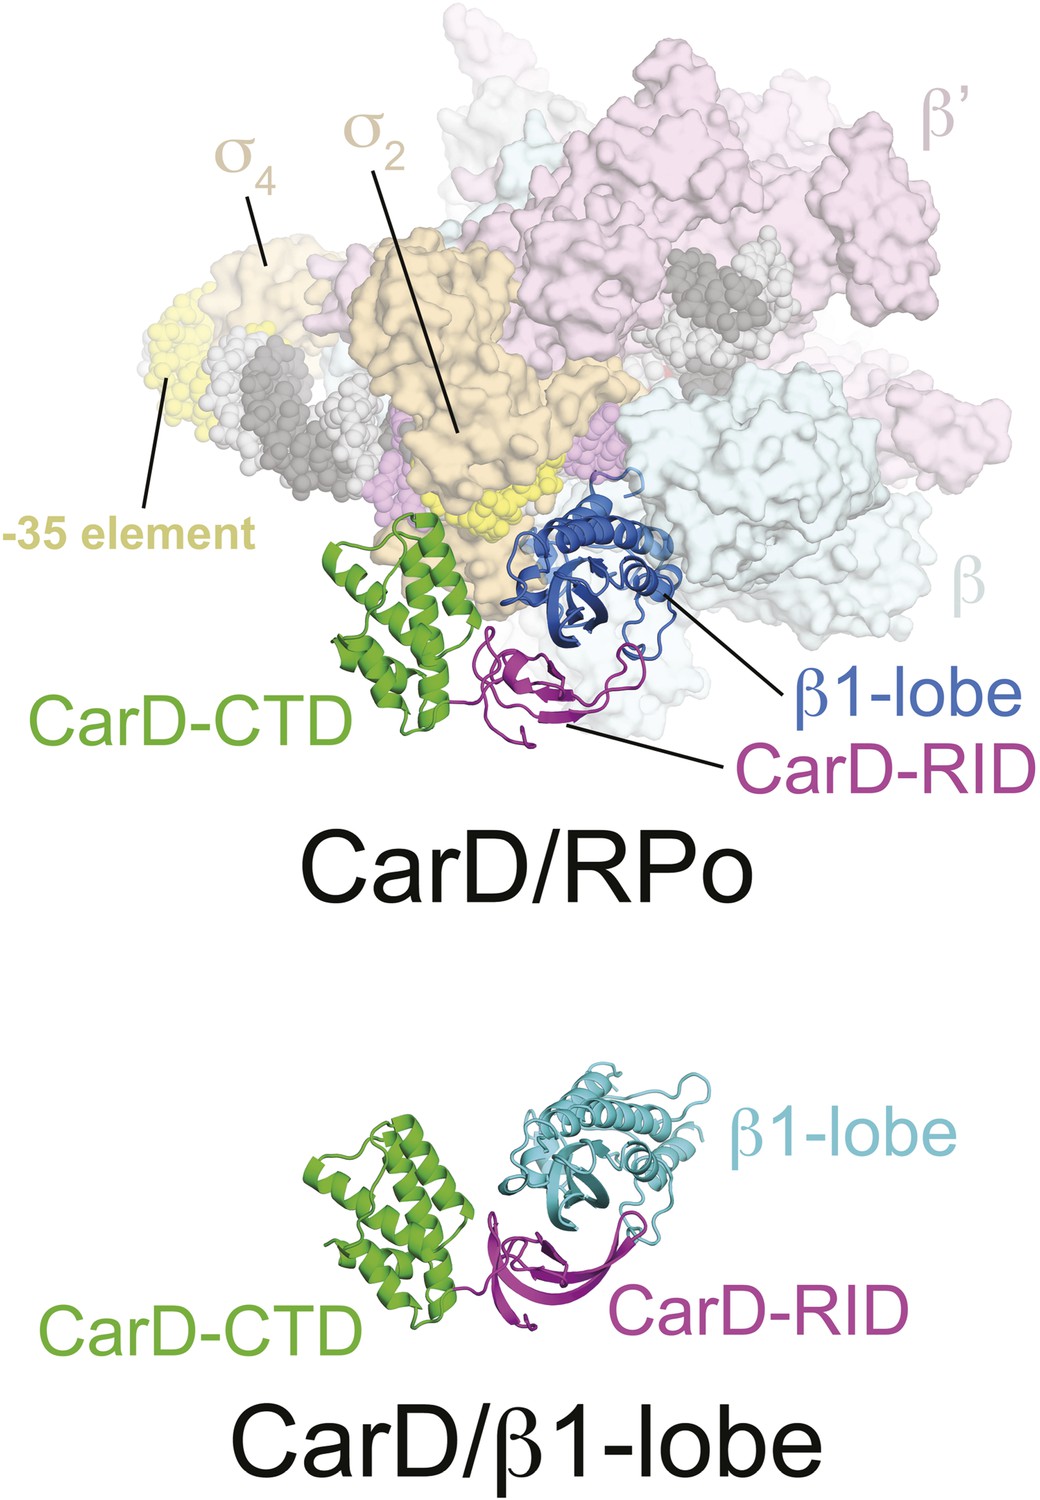
CarD/β1-lobe structure.
(Top) View of the CarD/RPo structure, similar to Figure 1B (Right) except the RNAP β1-lobe and CarD are shown as backbone ribbons without surfaces. (Bottom) The CarD/β1-lobe structure (2.4 Å-resolution, Table 1) shown in the orientation corresponding to the top view.
Figure 1—figure supplement 4
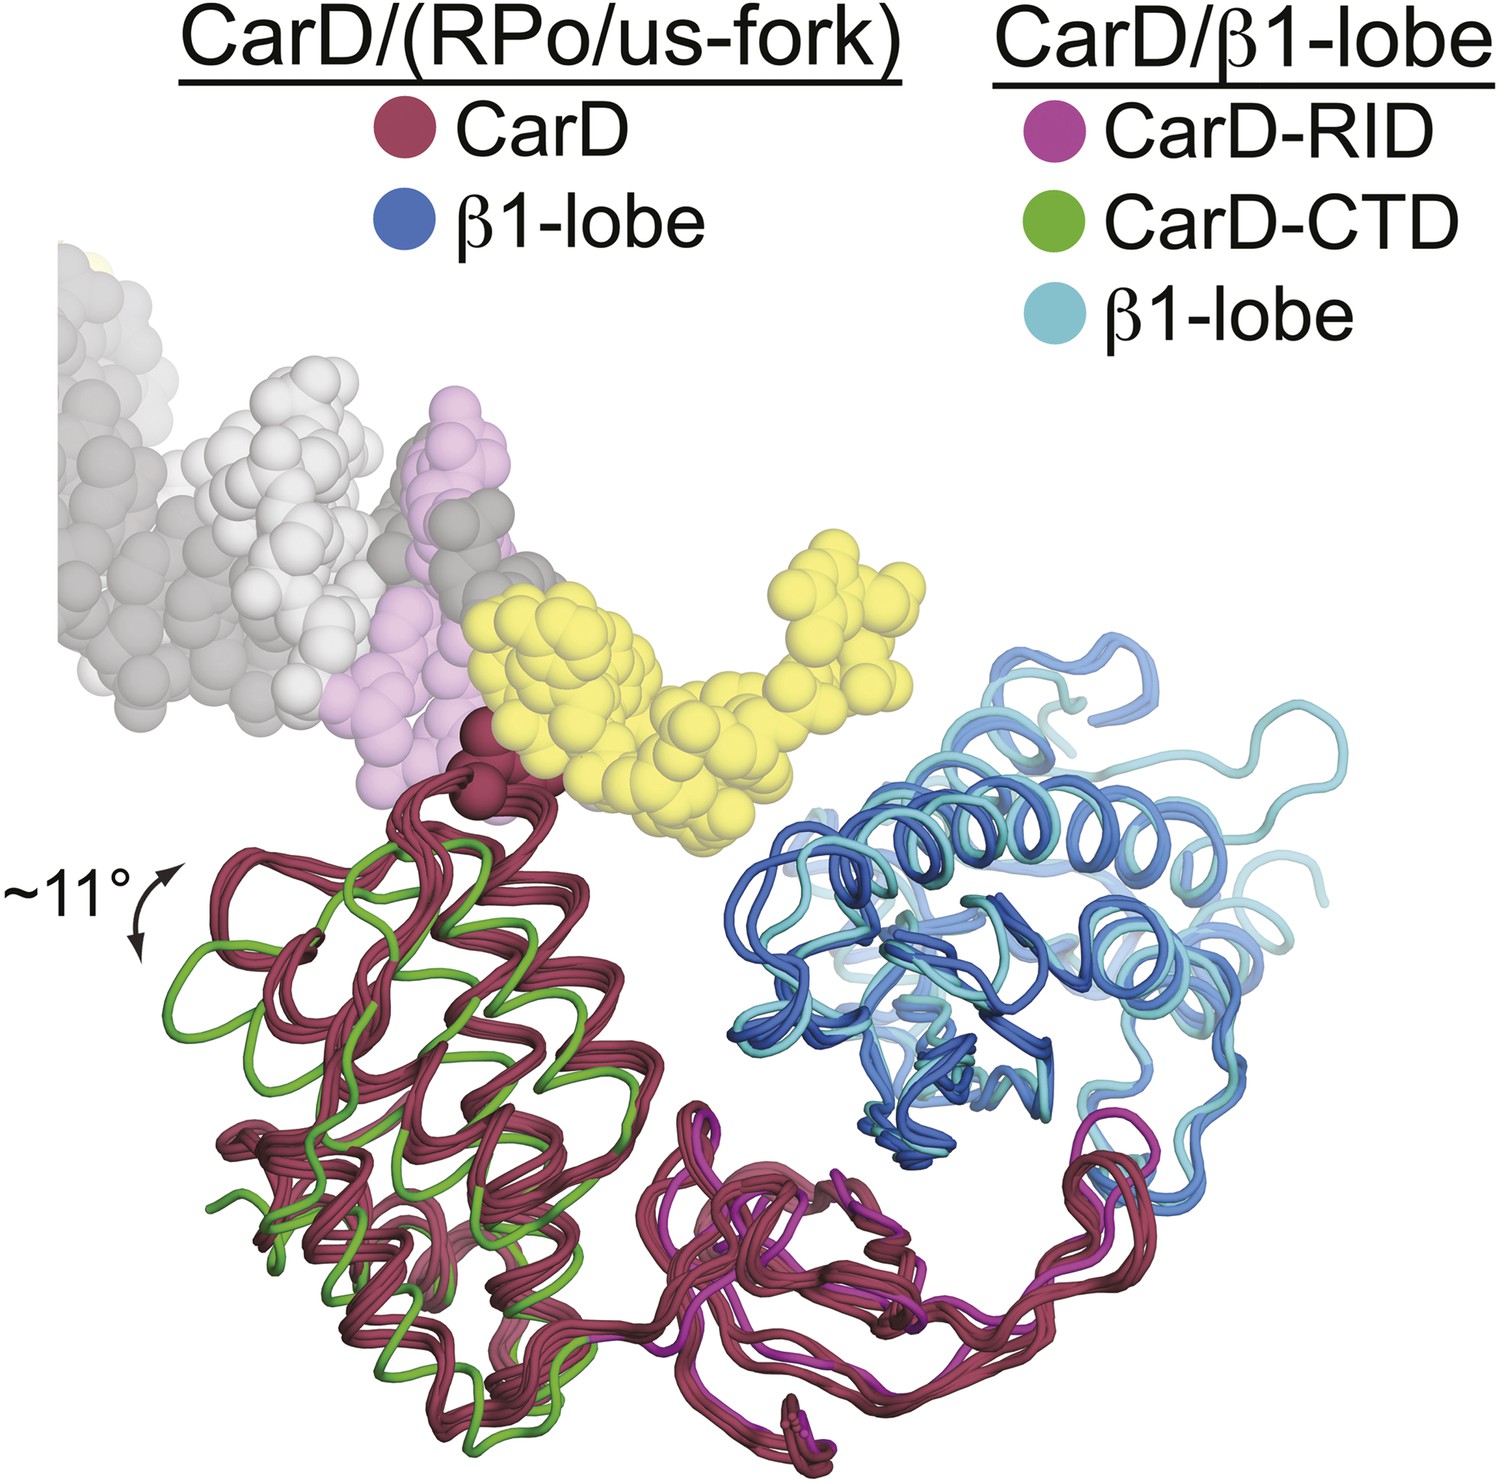
Slight movement of CarD-CTD towards DNA when DNA is present.
CarD/us-fork and CarD/RPo structures (four copies, two crystallographically independent copies from each structure) are shown superimposed by the Cα positions in the β1-lobe. In all these structures in the presence of promoter DNA, the β1-lobe is colored cyan, CarD is colored dark red, and CarD-W86 is shown in CPK format. The CarD/β1-lobe structure is also superimposed by the Cα positions of the β1-lobe (slate blue), with the CarD-RID magenta and the CarD-CTD green. Viewing the structures superimposed this way reveals a rotation of the CarD-CTD of ∼11° towards the DNA (when promoter DNA is present).
Figure 1—figure supplement 5
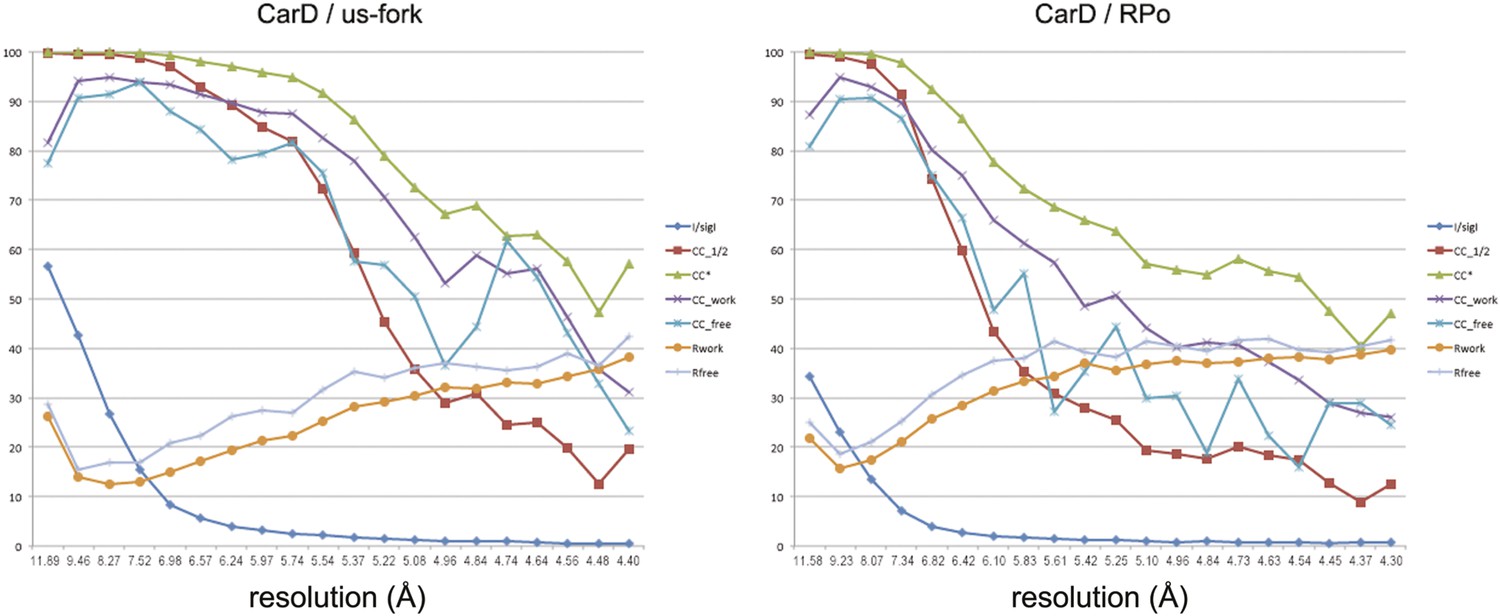
Data and model quality.
Plots relating data quality with model quality using the Pearson correlation coefficient (CC) analysis described by Karplus and Diederichs (2012). CC1/2 (red squares) was determined from the unmerged diffraction data randomly divided in half. Since CC1/2 underestimates the information content of the data (since it's calculated by dividing the dataset in half), CC* was calculated from an analytical relation to estimate the information content of the full data (Karplus and Diederichs, 2012). CC* provides a statistic that assesses data quality as well and also allows direct comparison of crystallographic model quality and data quality on the same scale through CCwork and CCfree, the standard and cross-validated correlations of the experimental intensities with the intensities calculated from the refined model. A CCwork/CCfree smaller than CC* indicates that the model does not account for all of the signal in the data, meaning it is not overfit. Plotted also are the standard <I>/σI for the diffraction data, as well as the Rwork/Rfree for the refined models. (Left) Data for Tth CarD/Taq EΔ1.1σA/us-fork (−12 bp) at 4.4 Å-resolution. (Right) Data for Tth CarD/Taq EΔ1.1σA RPo (with 4-nt RNA primer) at 4.3 Å-resolution.
Figure 1—figure supplement 6
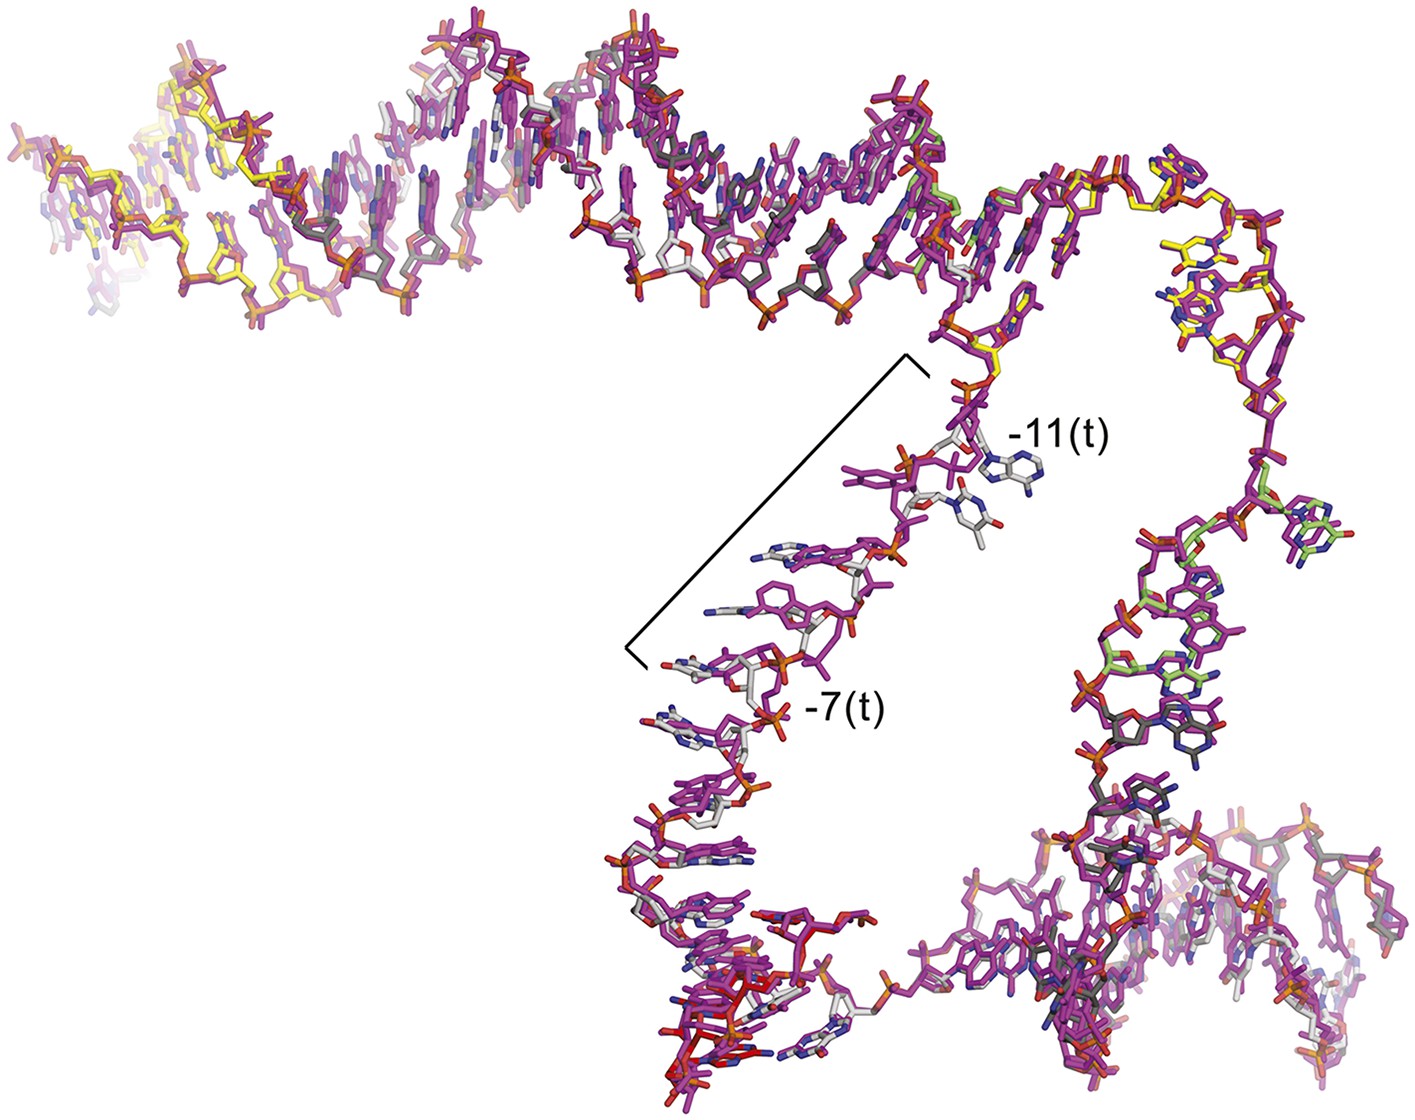
CarD does not alter the structure of the transcription bubble.
Superimposition of the nucleic acids from the CarD/RPo (colored as in Figure 1A) and RPo (magenta) (Bae et al., 2015) structures. The only significant differences occur in the single-stranded t-strand from −11 to −7; this part of the DNA is relatively unconstrained by protein/DNA interactions and has very high B-factors.
Figure 2 with 1 supplement
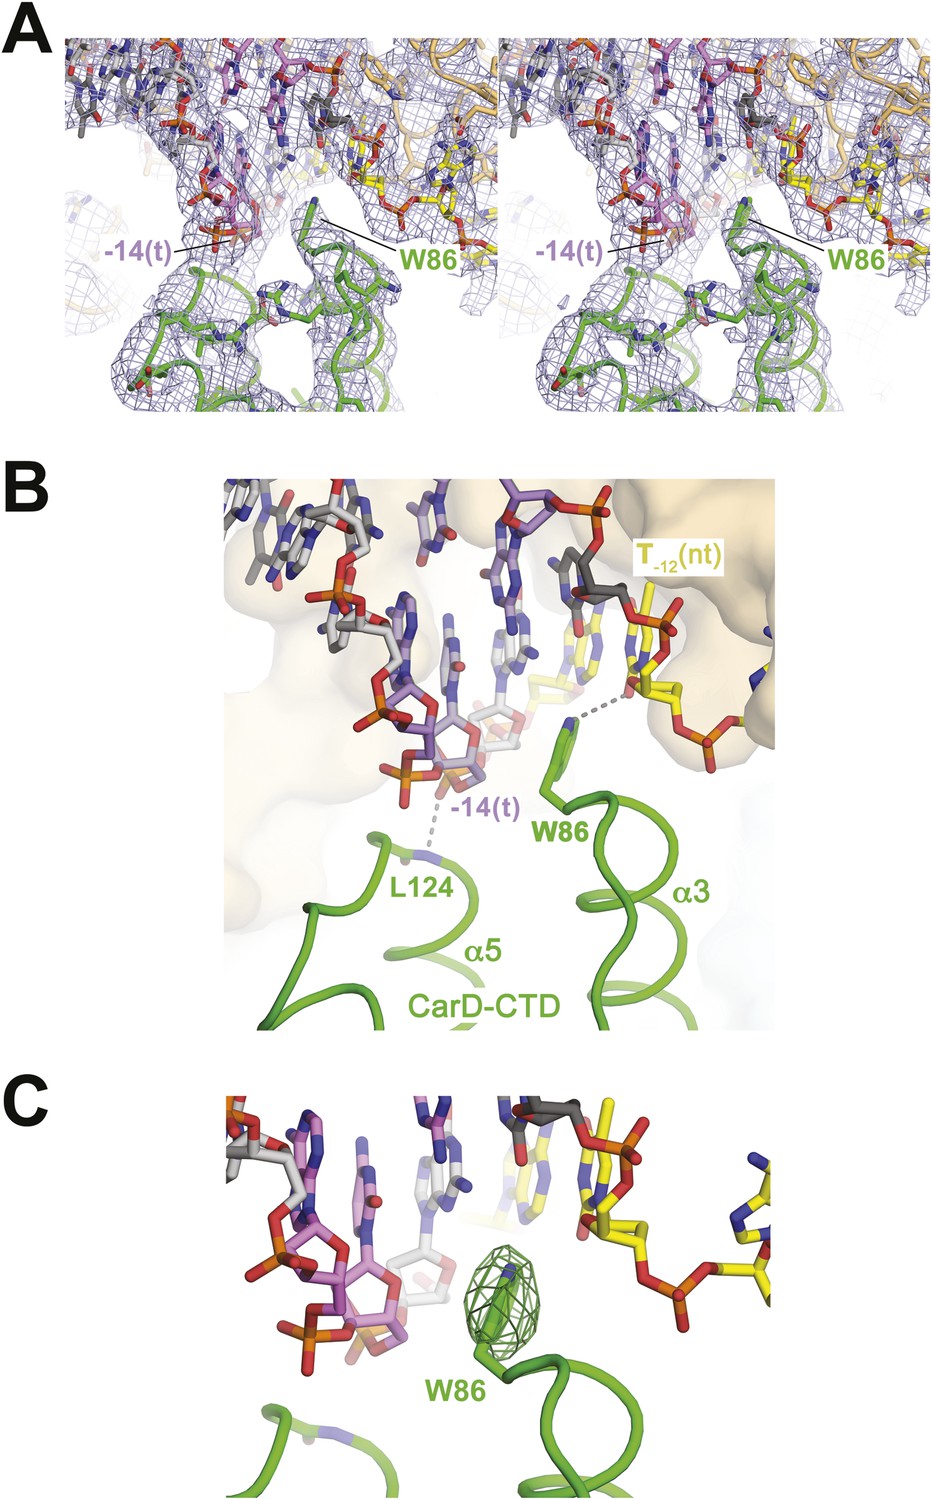
CarD-CTD/promoter DNA interactions.
(A) Stereo view of the refined, B-factor sharpened (−80 Å2) 2Fo − Fc map (grey mesh, contoured at 1σ), with superimposed DNA and CarD. Density for the close approach of the CarD peptide backbone to the −14(t) DNA phosphate backbone and for CarD-W86 are clearly resolved. (B) Close up view showing interactions between the N-terminal ends of α3 and α5 of the CarD-CTD with promoter DNA at the upstream ds(−12)/ss(−11) junction of the transcription bubble. Grey dashed lines indicate potential polar interactions between the peptide backbone nitrogen of L124 and the −14(t) phosphate oxygen, and W86 Nε and O2 of T−12(nt). (C) Same view as Figure 2B. Superimposed is the simulated annealing omit map (dark green mesh, Fo − Fc, contoured at 3σ), calculated from a model where CarD-W86 was mutated to Ala. The unbiased difference Fourier density shows that the side chain position is specified in the data.
Figure 2—figure supplement 1
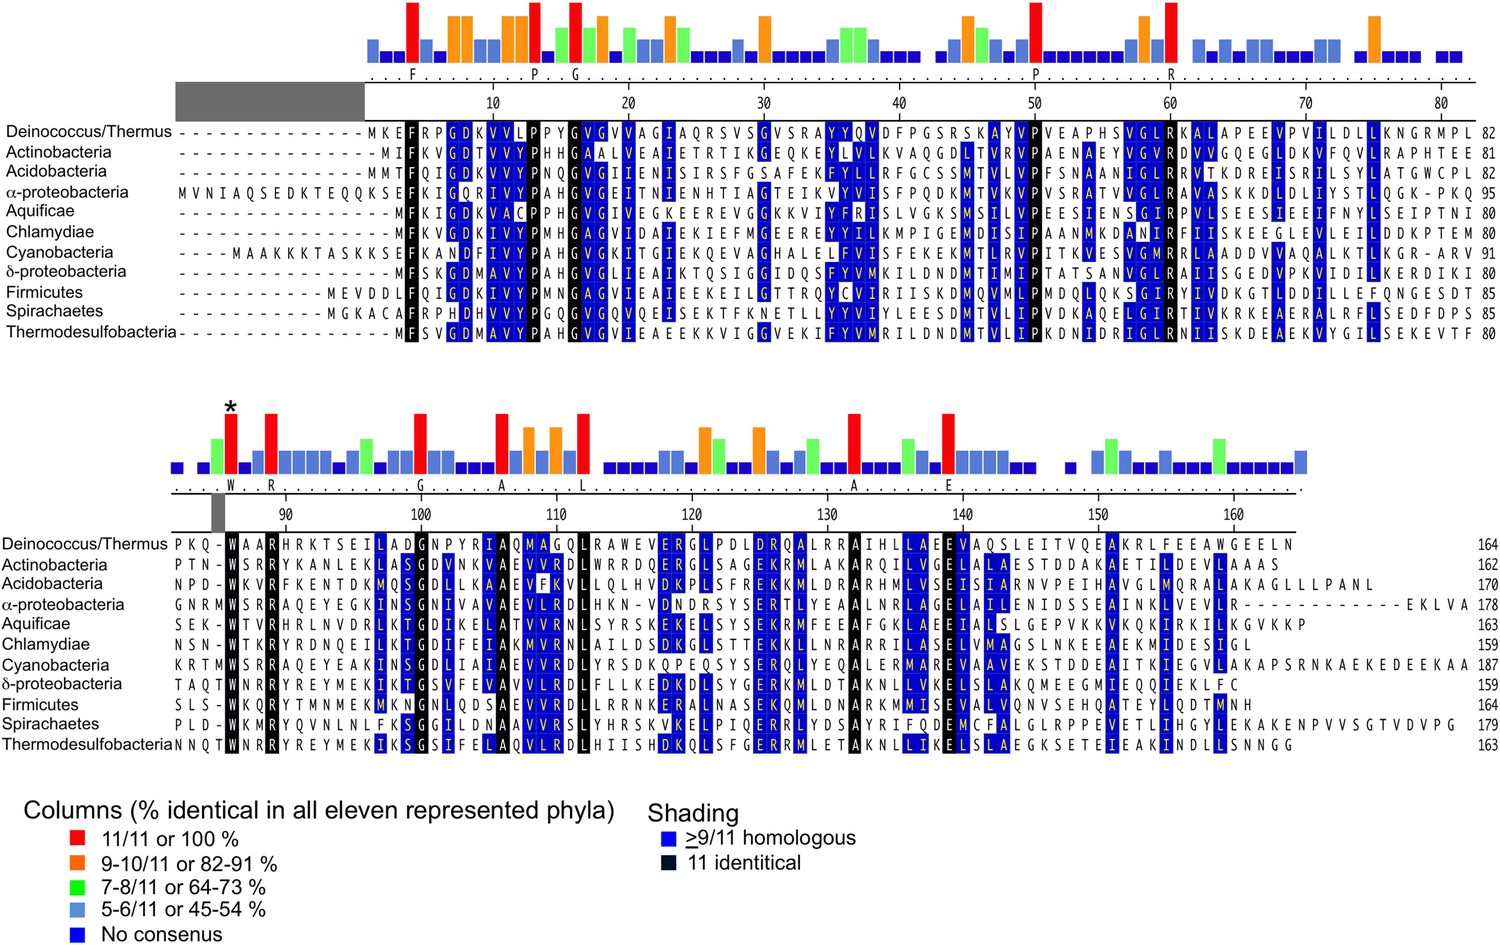
Alignment of CarD homologs found in bacteria from 11 diverse phyla/groups.
The CarD sequences shown are from the following organisms chosen to represent the preceding phylum/group: Deinococcus–Thermus-Tth HB8, Actinobacteria–Mtb, Acidobacteria–Candidatus Solibacter usitatus, α-Proteobacteria–Rickettsia belli, Aquificae–Desulfurobacterium thermolithotrophum, Chlamydae–Chlamydae trachomatis, Cyanobacteria–Mastigocoleus testarum, δ-Proteobacteria–Desulfobulbus propionicus, Firmicutes–Bacillus cereus, Spirochaetes–Treponema pallidum and Thermodesulfobacteria–Thermodesulfatator atlanticus. Alignments were performed using the ClustalW algorithm in MegAlign (DNASTAR). Groups of residues considered homologous (DE), (HKR), (ALMIV), (NQ), (ST), (C), (G) and (P) are shaded blue when occurring in greater than 9/11 sequences. Identical residues occurring in all 11 sequences are shaded black. Histograms above the alignment graphically illustrate residues that are absolutely conserved within each of the 11 sequences and W86 is asterisked. The 100% identical residue is listed immediately below the histogram. A larger alignment of 831 CarD sequences is included (Source code 1).
Figure 3 with 1 supplement
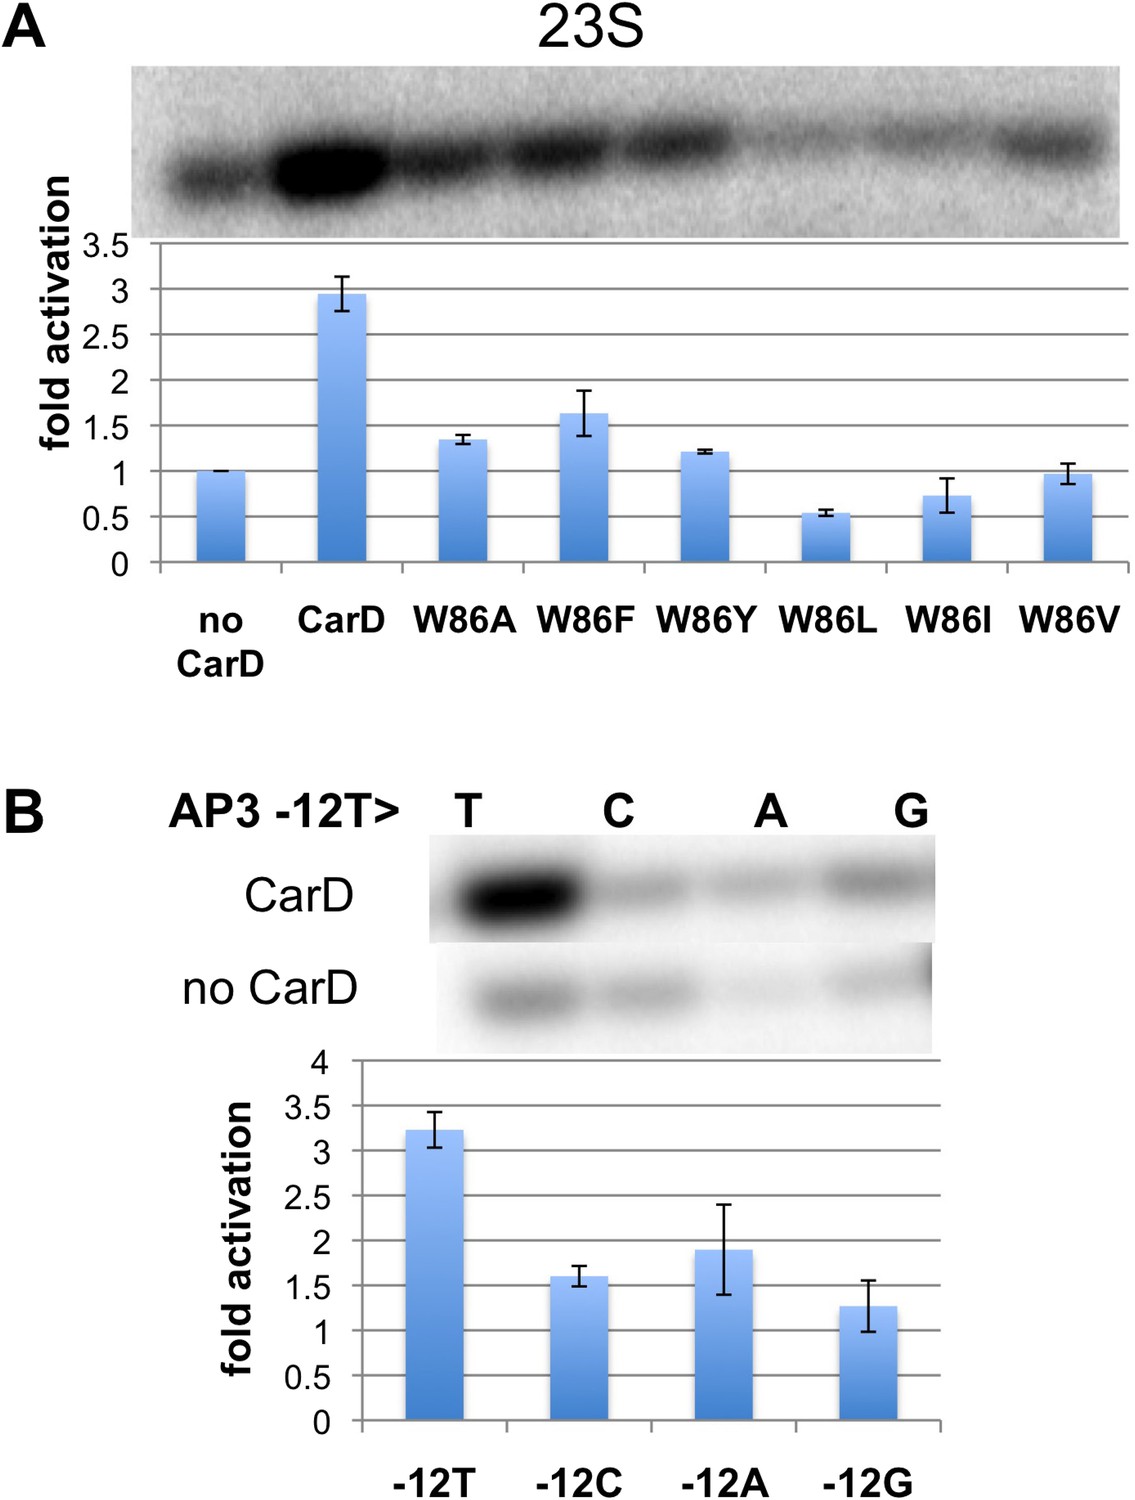
Function of CarD-W86.
(A) The effect of CarD-W86 substitutions on activation of abortive initiation (UpG dinucleotide + α-32P-CTP) on the Tth rrnA-23S promoter (normalized with respect to no CarD). Error bars denote the standard error from a minimum of three experiments. (B) The effect of promoter −12 base pair substitutions on activation of abortive initiation (GpU dinucleotide + α-32P-UTP) by CarD on the Mtb rrnA-AP3 promoter. Error bars denote standard errors.
Figure 3—figure supplement 1
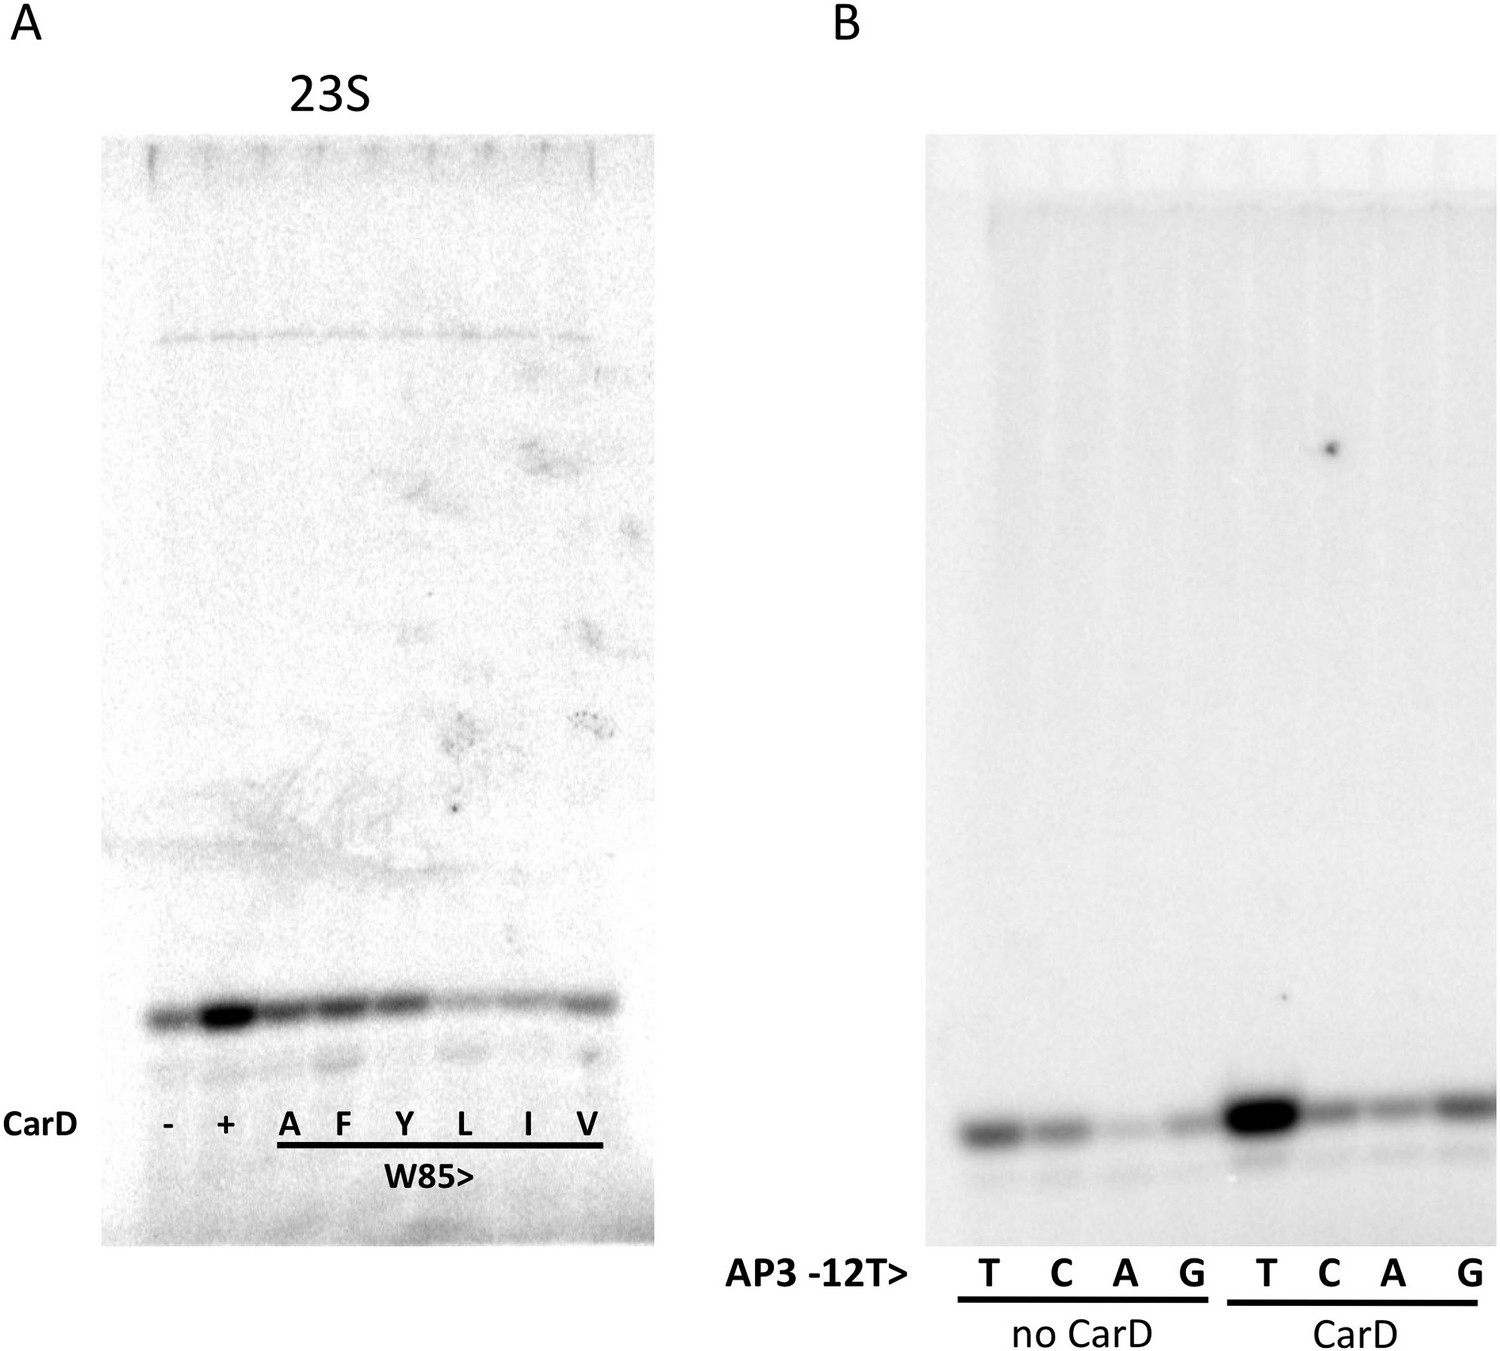
Complete gels for the abortive initiation assays shown in (A) Figure 3A and (B) Figure 3B.
https://doi.org/10.7554/eLife.08505.015
Figure 4 with 1 supplement
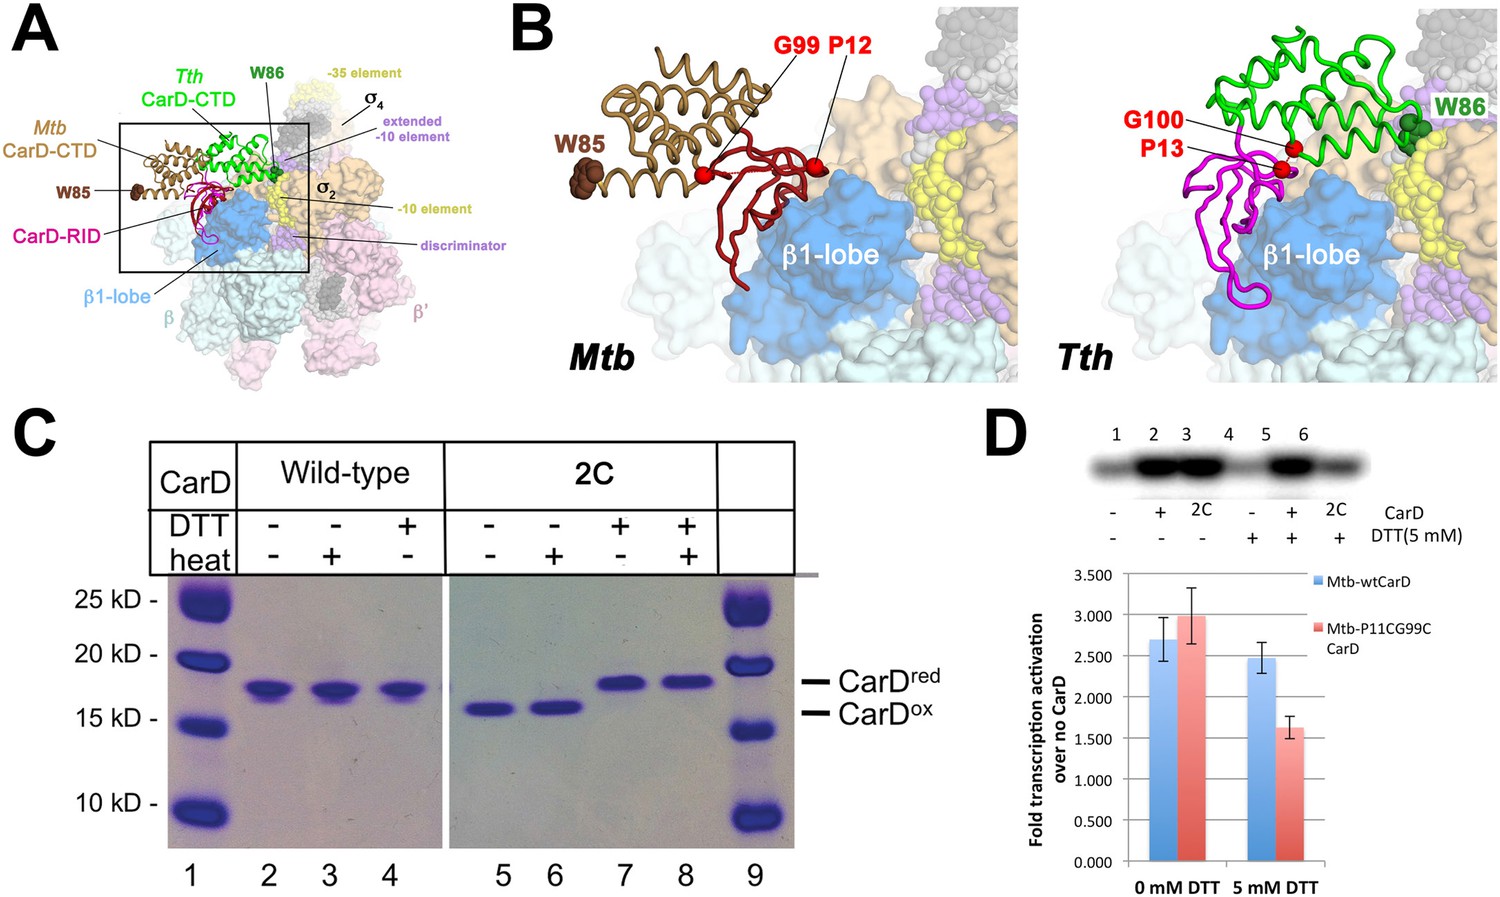
Inter-domain crosslinking confirms the functional conformation of CarD.
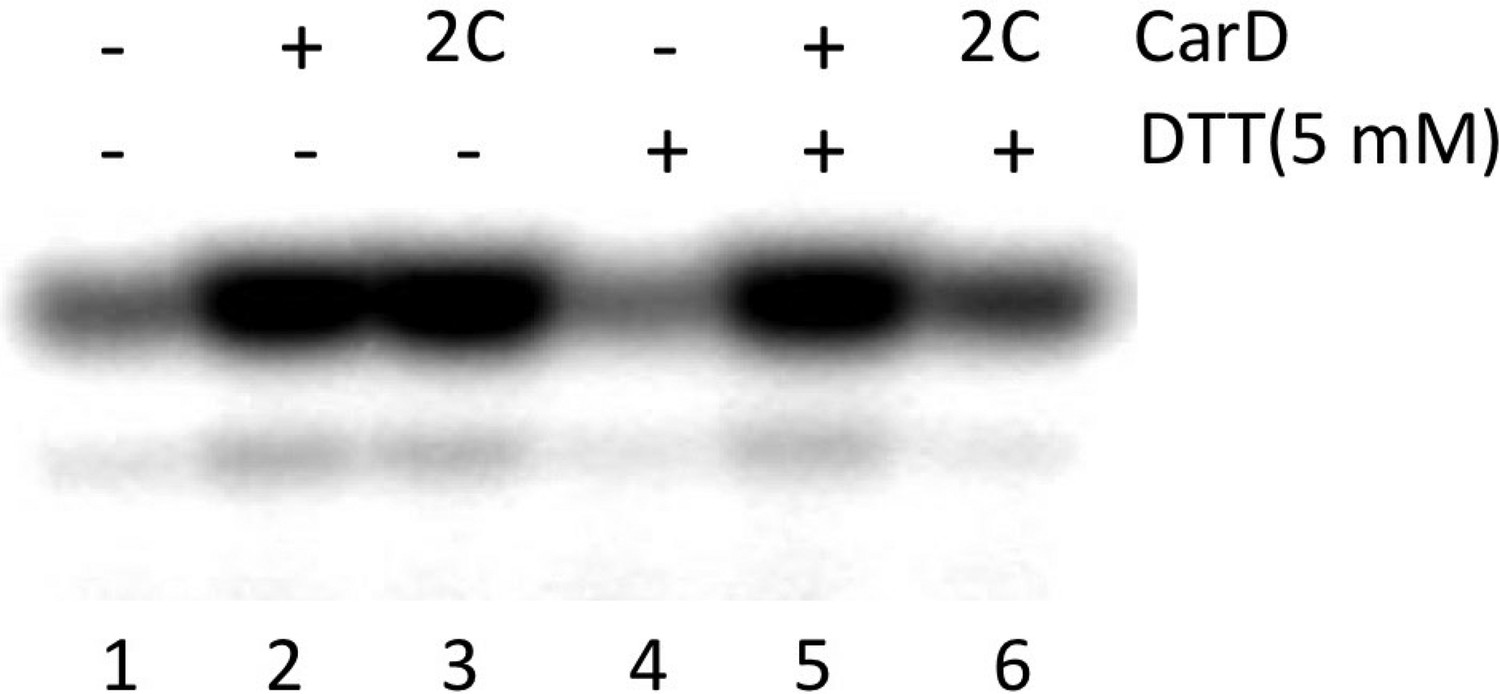
(A) View of the Thermus CarD/RPo complex. RNAP holoenzyme and nucleic acids are shown as in Figure 1B; Tth CarD is shown as an α-carbon ribbon (Tth CarD-RID, magenta; Tth CarD-CTD, green) but with W86 shown in CPK format and colored dark green. Also shown is Mtb CarD from the Mtb CarD/β1-β2-lobe structure (4KBM; Mtb CarD-RID, dark red; Mtb CarD-CTD, brown, but with W85 colored dark brown), superimposed by alignment of 145 Cα atoms from the β1-lobe (1.39 Å rmsd). The boxed region is magnified in (B). (B) (Left) Magnified view showing the modeled Mtb CarD in the context of RPo. The α-carbons of CarD-RID-P12 and CarD-CTD-G99, shown as red spheres, are ∼24 Å apart (red dashed line). A disulfide bond between these two positions in Mtb CarD2C (P12C/G99C substitutions) would disallow this conformation of CarD. (Right) Magnified view of the Thermus CarD/RPo complex. CarD-RID-P13 and CarD-CTD-G100 are ∼5.2 Å apart (red dashed line). A disulfide bond between the corresponding two positions in Mtb CarD2C would lock this DNA-interacting conformation of CarD. (C) Purification of disulfide crosslinked (lanes 5, 6) and reduced (lanes 7, 8) CarD2C. Non-reducing SDS-PAGE illustrates that CarD2C is oxidized (crosslinked) in the absence of reducing agent dithiothreitol (DTT) and is reduced (uncrosslinked) in the presence of DTT. Samples were excised from gels and LC-MS was used to confirm oxidation states. (D) Effect of oxidation state on Mtb CarD2C activation of abortive transcription on the Mtb AP3 promoter (GpU dinucleotide + α-32P-UTP). Conformationally locked (no DTT) Mtb CarD2C exhibits wild type activation activity.
Figure 4—figure supplement 1
Complete gel for the abortive initiation assay shown in Figure 4D.
https://doi.org/10.7554/eLife.08505.017
Figure 5 with 2 supplements
CarD increases the lifetime of Thermus RPo.
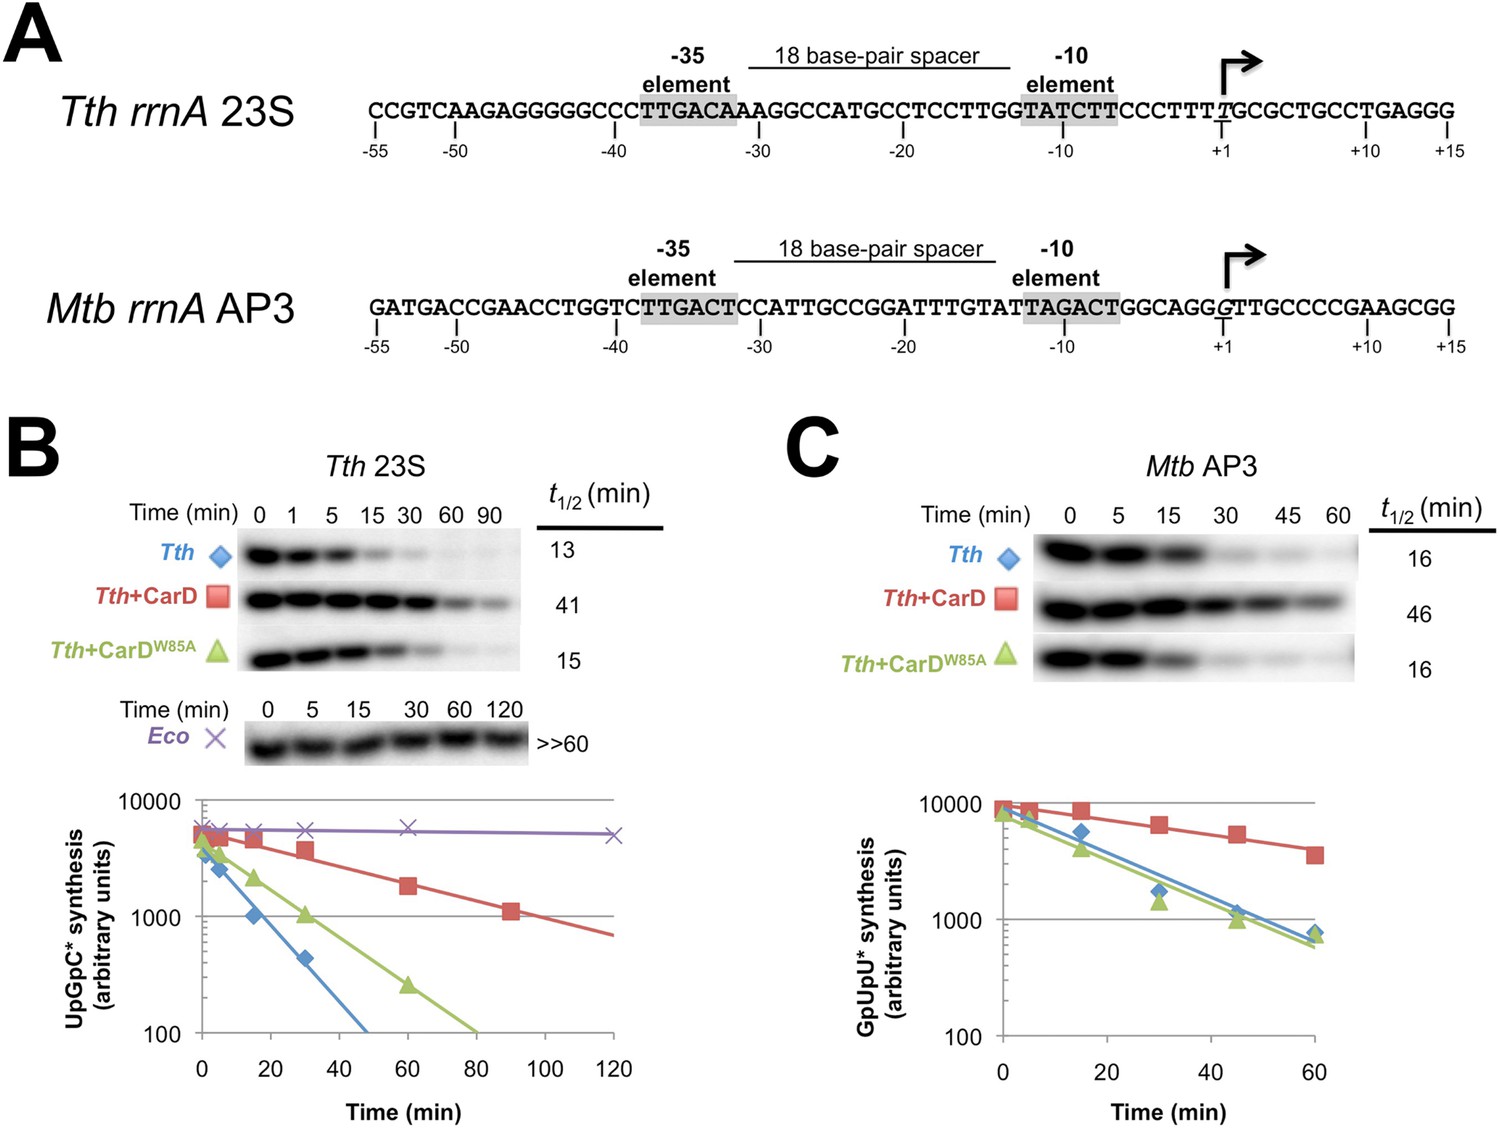
(A) Sequences of Mtb rrnAAP3 (Gonzalez-y-Merchand et al., 1996) and Tth 23S rRNA (Hartmann et al., 1987) promoters used in in vitro assays. (B, C) Lifetimes of promoter complexes measured by abortive transcription. At the top of each panel, [32P]-labeled abortive transcript production at times after addition of a large excess of competitor promoter DNA trap was monitored by polyacrylamide gel electrophoresis and autoradiography. On the bottom, transcript production was quantified by phosphorimagery and plotted. The lines indicate single-exponential decay curves fit to the data points. The calculated decay half-lives (t1/2) are shown to the right of the gel images. Assays were performed on the following templates: (B) Tth rrnA-23S promoter (UpG dinucleotide + α-32P-CTP). (C) Mtb rrnA-AP3 promoter (GpU dinucleotide + α-32P-UTP).
Figure 5—figure supplement 1
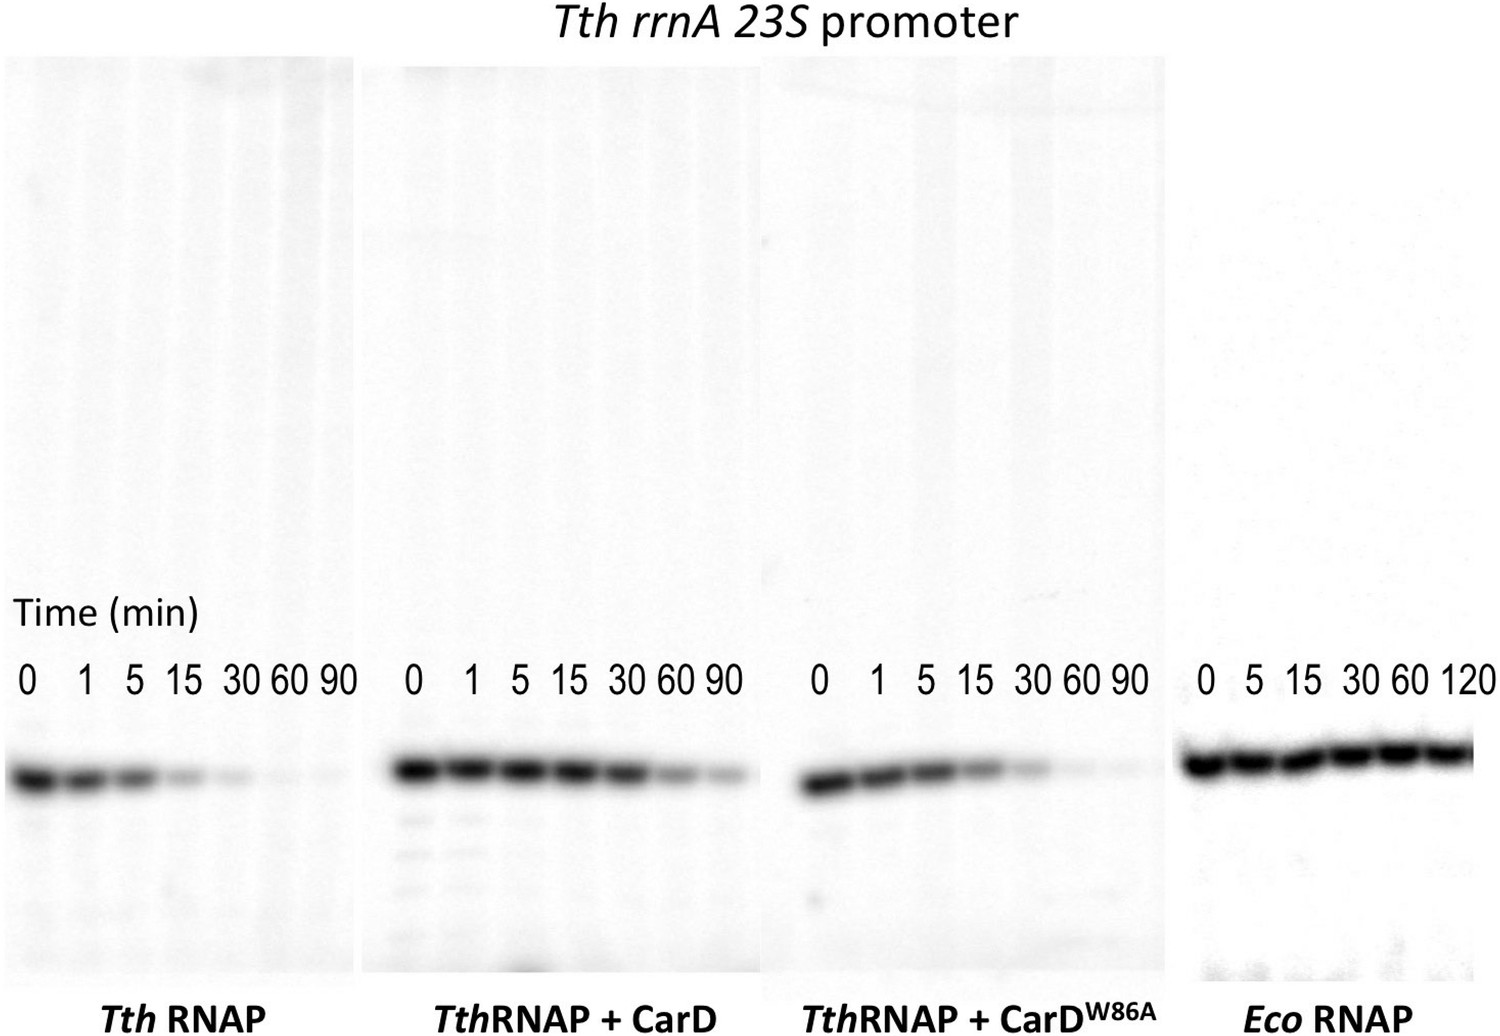
Complete gels for the abortive initiation assays shown in Figure 5B.
https://doi.org/10.7554/eLife.08505.019
Figure 5—figure supplement 2
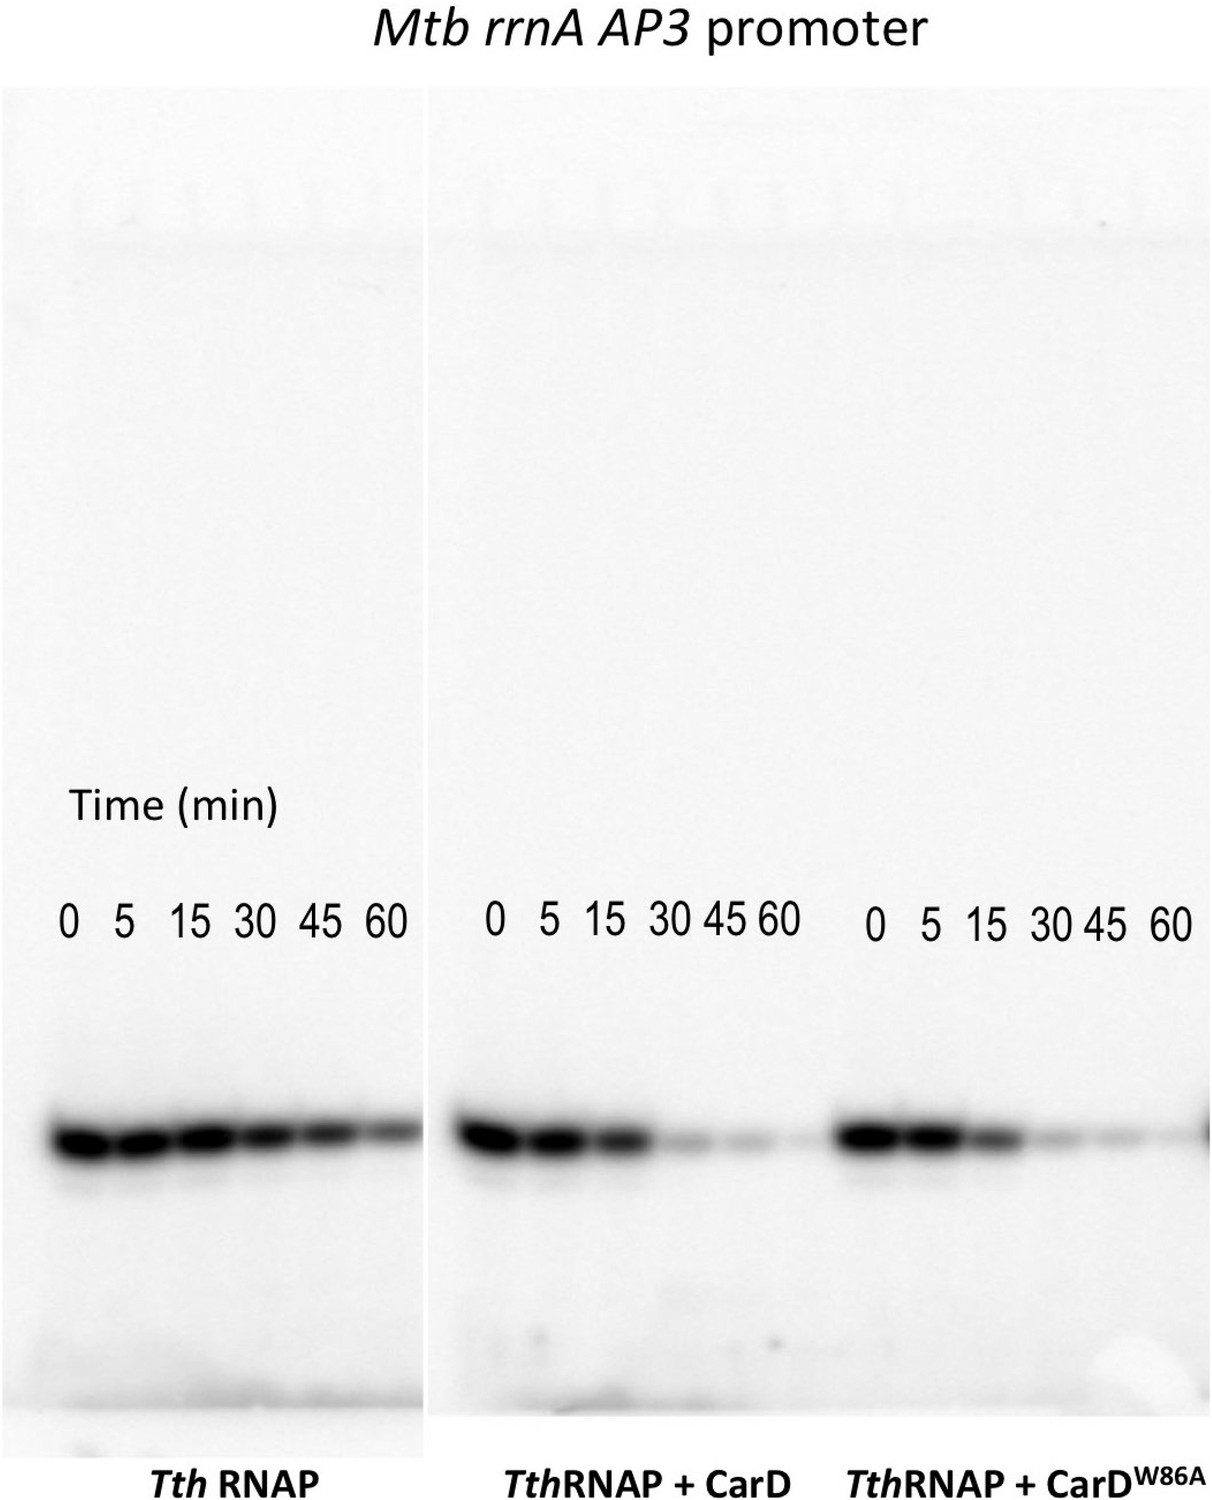
Complete gels for the abortive initiation assays shown in Figure 5C.
https://doi.org/10.7554/eLife.08505.020
Figure 6 with 1 supplement

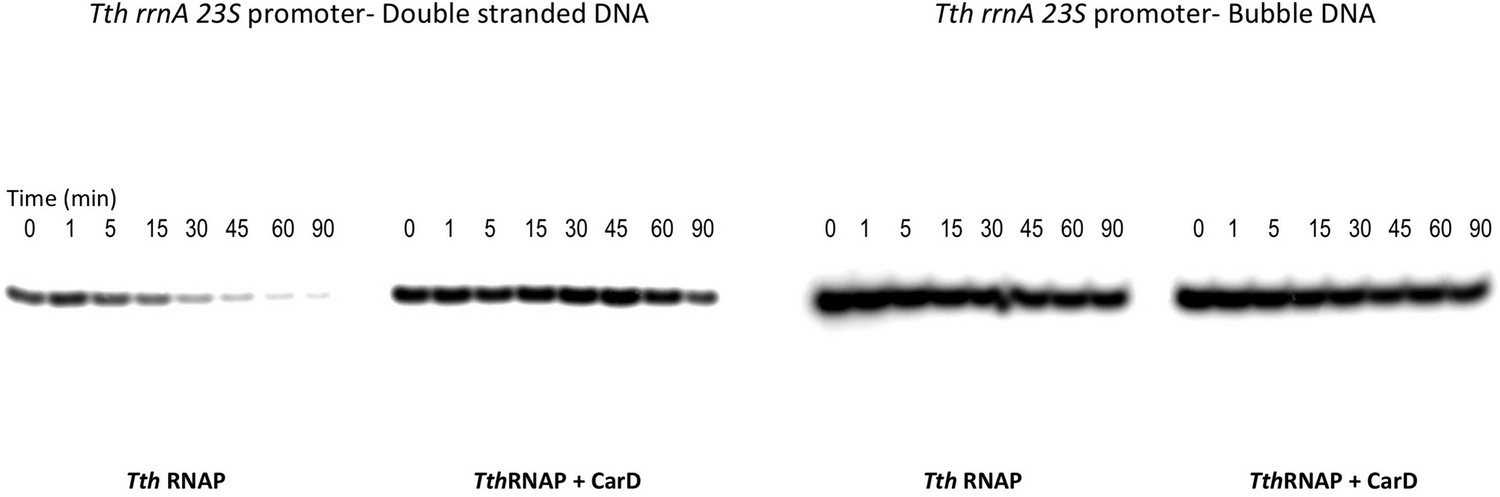
CarD increases the lifetime of Thermus RPo by preventing transcription bubble collapse.
(A) Synthetic duplex (23S_DS) and artificial bubble (23S_Bub) promoters used in in vitro assays. (B) Lifetimes of promoter complexes formed on synthetic templates measured by abortive transcription (UpG dinucleotide + α-32P-UTP). (Left) [32P]-labeled abortive transcript production at times after addition of a large excess of competitor promoter DNA trap was monitored by polyacrylamide gel electrophoresis and autoradiography. (Right) transcript production was quantified by phosphorimagery and plotted. The lines indicate single-exponential decay curves fit to the data points. The calculated decay half-lives (t1/2) are shown to the right of the gel images. Assays were performed on the synthetic double-stranded (23S_DS) and bubble (23S_Bub) templates.
Figure 6—figure supplement 1
Complete gels for the abortive initiation assays shown in Figure 6B.
https://doi.org/10.7554/eLife.08505.022Tables
Table 1
Distribution of CarD in bacterial phyla
| Phyla* | Clades and colloquial names noted. Select genera within some phyla are also listed | CarD presence in phyla | # of completed genomes and draft assemblies† |
|---|---|---|---|
| Acidobacteria/Fibrobacter | diderm Gram− | Yes (only Acidobacteria) | 24 |
| Actinobacteria | monoderm, high G + C Gram+: Streptomyces, Mycobacteria | Yes | 932 |
| Aquificae | diderm Gram−: glidobacteria | Yes | 16 |
| Bacteroidetes | diderm Gram−: Green sulfur bacteria | No | 468 |
| Caldiserica | diderm Gram− | No | 2 |
| Chlamydiae | diderm Gram− Planctobacteria: Chlamydia trachomatis | Yes | 21 |
| Chlorobi | diderm Gram− | No | 12 |
| Chloroflexi | diderm Gram−: glydobacteria | No | 32 |
| Chrysiogenetes | diderm Gram−: Desulfurispirillum | No | 2 |
| Cyanobacteria‡ | diderm Gram−: glydobacteria | Yes | 103 |
| Deferribacteres | diderm Gram− | No | 6 |
| Deinococcus–Thermus | diderm Gram−: glydobacteria | Yes | 43 |
| Dictyoglomi | diderm Gram− | No | 2 |
| Elusimicrobia | diderm Gram− | No | 3 |
| Firmicutes | monoderm low G + C Gram+: Bacillus, Clostridium | Yes | 1149 |
| Fusobacteria | diderm Gram− | No | 25 |
| Gemmatimonadetes | diderm Gram− | No | 5 |
| Lentisphaerae | diderm Gram− | No | 2 |
| Nitrospirae | diderm Gram− | No | 10 |
| Planctomycetes | diderm Gram−: planctobacteria | No | 22 |
| Proteobacteria-α | diderm Gram−: Rickettsia, Rhizobium | Yes | 678 |
| Proteobacteria-β | diderm Gram−: Bordetella, Neisseria | No | 350 |
| Proteobacteria-γ | diderm Gram−: Escherichia, Pseudomonas | No | 982 |
| Proteobacteria-δ | diderm Gram−: Desulfovibrio, Geobacter | Yes | 142 |
| Proteobacteria-ε | diderm Gram−: Helicobacter | No | 78 |
| Spirochaetes | di-derm Gram−: Borrelia, Treponema | Yes | 81 |
| Synergistetes | diderm Gram− | No | 18 |
| Tenericutes | Monoderm: Mycoplasma | No | 132 |
| Thermodesulfobacteria | diderm Gram−: glidobacteria | Yes | 3 |
| Thermotogae | diderm Gram− | No | 26 |
| Verrucomicrobia | diderm Gram− | No | 37 |
-
*
Phyla list based on the list of prokaryotic names with standing in nomenclature (LPSN) (http://www.bacterio.net/-classifphyla.html) and the NCBI taxonomy list (http://www.ncbi.nlm.nih.gov/Taxonomy/Browser/wwwtax.cgi). The diverse phylum proteobacteria are divided into subgroups of α, β, γ, δ and ε.
-
†
Genomes and draft assemblies sequenced list are shown to illustrate representation of each phylum in the Blast database and gathered from http://www.ncbi.nlm.nih.gov/genomes/MICROBES/microbial_taxtree.html.
-
‡
Phyla containing CarD are highlighted in bold.
-
Method: Using the Blast database search engine (http://blast.ncbi.nlm.nih.gov/Blast.cgi?PROGRAM=blastp&PAGE_TYPE=BlastSearch&LINK_LOC=blasthome) we searched for sequences similar to Tth CarD with restrictions of amino acid length of 120:200 amino acids within each phylum.
Table 2
Crystallographic statistics
| Holo-bubble-CarD | Holo-fork-CarD | CarD/β1-lobe | ||
|---|---|---|---|---|
| Data collection | ||||
| Space group | P43212 | P43212 | I4 | |
| Combined datasets | 4 | 6 | 1 | |
| Cell dimensions | ||||
| a (Å) | 289.84 | 293.15 | 149.32 | |
| b (Å) | 289.84 | 293.15 | 149.32 | |
| c (Å) | 536.34 | 539.13 | 52.26 | |
| Wavelength (Å) | 1.075 | 1.075 | 1.1 | |
| Resolution (Å) | 39.56–4.3 (4.45–4.3)† | 49.61–4.40 (4.56–4.40)† | 49.32–2.40 (2.49–2.40)† | |
| Total reflections | 1,204,932 (93,381) | 2,004,840 (73,134) | 138,950 (13,077) | |
| Unique reflections | 153,939 (12,740) | 148,420 (10,172) | 22,705 (2257) | |
| Multiplicity | 7.8 (6.2) | 13.5 (5.0) | 6.1 (5.8) | |
| Completeness (%) | 99.6 (99.2) | 99.9 (99.6) | 100% (100%) | |
| <I>/σI | 5.06 (0.65) | 9.10 (0.41) | 19.13 (1.66) | |
| Wilson B-factor | 165.15 | 151.33 | 49.38 | |
| Rpim‡ | 0.295 (1.61) | 0.138 (2.03) | 0.033 (0.44) | |
| CC1/2§ | 0.948 (0.114) | 0.971 (0.166) | 0.998 (0.49) | |
| CC*§ | 0.987 (0.453) | 0.993 (0.534) | 1.00 (0.811) | |
| Twinning | ||||
| operator | – | – | −k, −h, −l | |
| fraction | – | – | 0.42 | |
| Anisotropic scaling B-factors# | ||||
| a*, b* (Å2) | 16.95 | 16.01 | – | |
| c* (Å2) | −33.90 | −32.03 | – | |
| Refinement | ||||
| Rwork/Rfree | 0.2748/0.3094 (0.3916/0.4100) | 0.2198/0.2639 (0.3660/0.3920) | 0.1629/0.1863 (0.2582/0.3036) | |
| CCwork/CCfree§ | 0.928/0.890 (0.261/0.267) | 0.921/0.891 (0.318/0.262) | 0.870/0.498 (0.498/0.437) | |
| No. atoms | 60,878 | 58,990 | 2753 | |
| Protein/DNA | 60,872 | 58,984 | 2657 | |
| Ligand/ion | 6 | 6 | 20 | |
| Water | 0 | 0 | 76 | |
| Protein residues | 7197 | 7195 | 342 | |
| B-factors | ||||
| Protein | 179.52 | 194.66 | 60.35 | |
| Ligand/ion | 158.99 | 139.48 | 49.77 | |
| Water | – | – | 52.81 | |
| R.m.s deviations | ||||
| Bond lengths (Å) | 0.005 | 0.004 | 0.010 | |
| Bond angles (°) | 0.96 | 1.01 | 1.35 | |
| Clashscore | 19.58 | 14.83 | 19.72 | |
| Ramachandran favored (%) | 88 | 89 | 91 | |
| Ramachandran outliers (%) | 0.48 | 0.57 | 0.89 | |
-
†
Values in parentheses are for highest-resolution shell.
-
‡
-
§
-
#
As determined by the UCLA MBI Diffraction Anisotropy Server (http://services.mbi.ucla.edu/anisoscale/).
Additional files
-
Source code 1
Sequence alignment (.fas format) of 831 CarD sequences.
- https://doi.org/10.7554/eLife.08505.025
Download links
A two-part list of links to download the article, or parts of the article, in various formats.
Downloads (link to download the article as PDF)
Open citations (links to open the citations from this article in various online reference manager services)
Cite this article (links to download the citations from this article in formats compatible with various reference manager tools)
CarD uses a minor groove wedge mechanism to stabilize the RNA polymerase open promoter complex
eLife 4:e08505.
https://doi.org/10.7554/eLife.08505


