A specific E3 ligase/deubiquitinase pair modulates TBP protein levels during muscle differentiation
- Janelia Research Campus, Howard Hughes Medical Institute, United States
- University of California, Berkeley, United States
- Howard Hughes Medical Institute, Janelia Research Campus, United States
Figures
Figure 1 with 1 supplement

The ubiquitin-proteasome system regulates TBP protein levels.
(A) Treatment of differentiated C2C12 myotubes with the proteasome inhibitor MG132 rescues TBP protein levels. Western blot analysis of cytoplasmic and nuclear extracts from C2C12 myoblasts and myotubes was done using antibodies against TBP and myogenin. Loading control was done by Ponceau S staining. Myotubes were treated as indicated on differentiation day 6. MG132 was used at a final concentration of 10 μM for 4 hr *, a modified version of myogenin was detected upon MG132 treatment. (B) TBP is ubiquitinated in vivo. 293T cells were transfected with indicated plasmids. Ubiquitin conjugates were purified using Ni-NTA resin under denatured conditions from MG132 treated cells, then subjected to western blot analysis using anti-TBP antibody. (C) TBP can be ubiquitinated by both C2C12 myoblast and myotube whole cell extracts in vitro. In vitro transcribed and translated HA-TBP was incubated with whole cell extracts from C2C12 myoblasts or myotubes for in vitro ubiquitination assays. After the reaction, immunopurified HA-TBP (purified using an antibody against HA-tag) was analyzed by western blot using an antibody against ubiquitin.
Figure 1—figure supplement 1
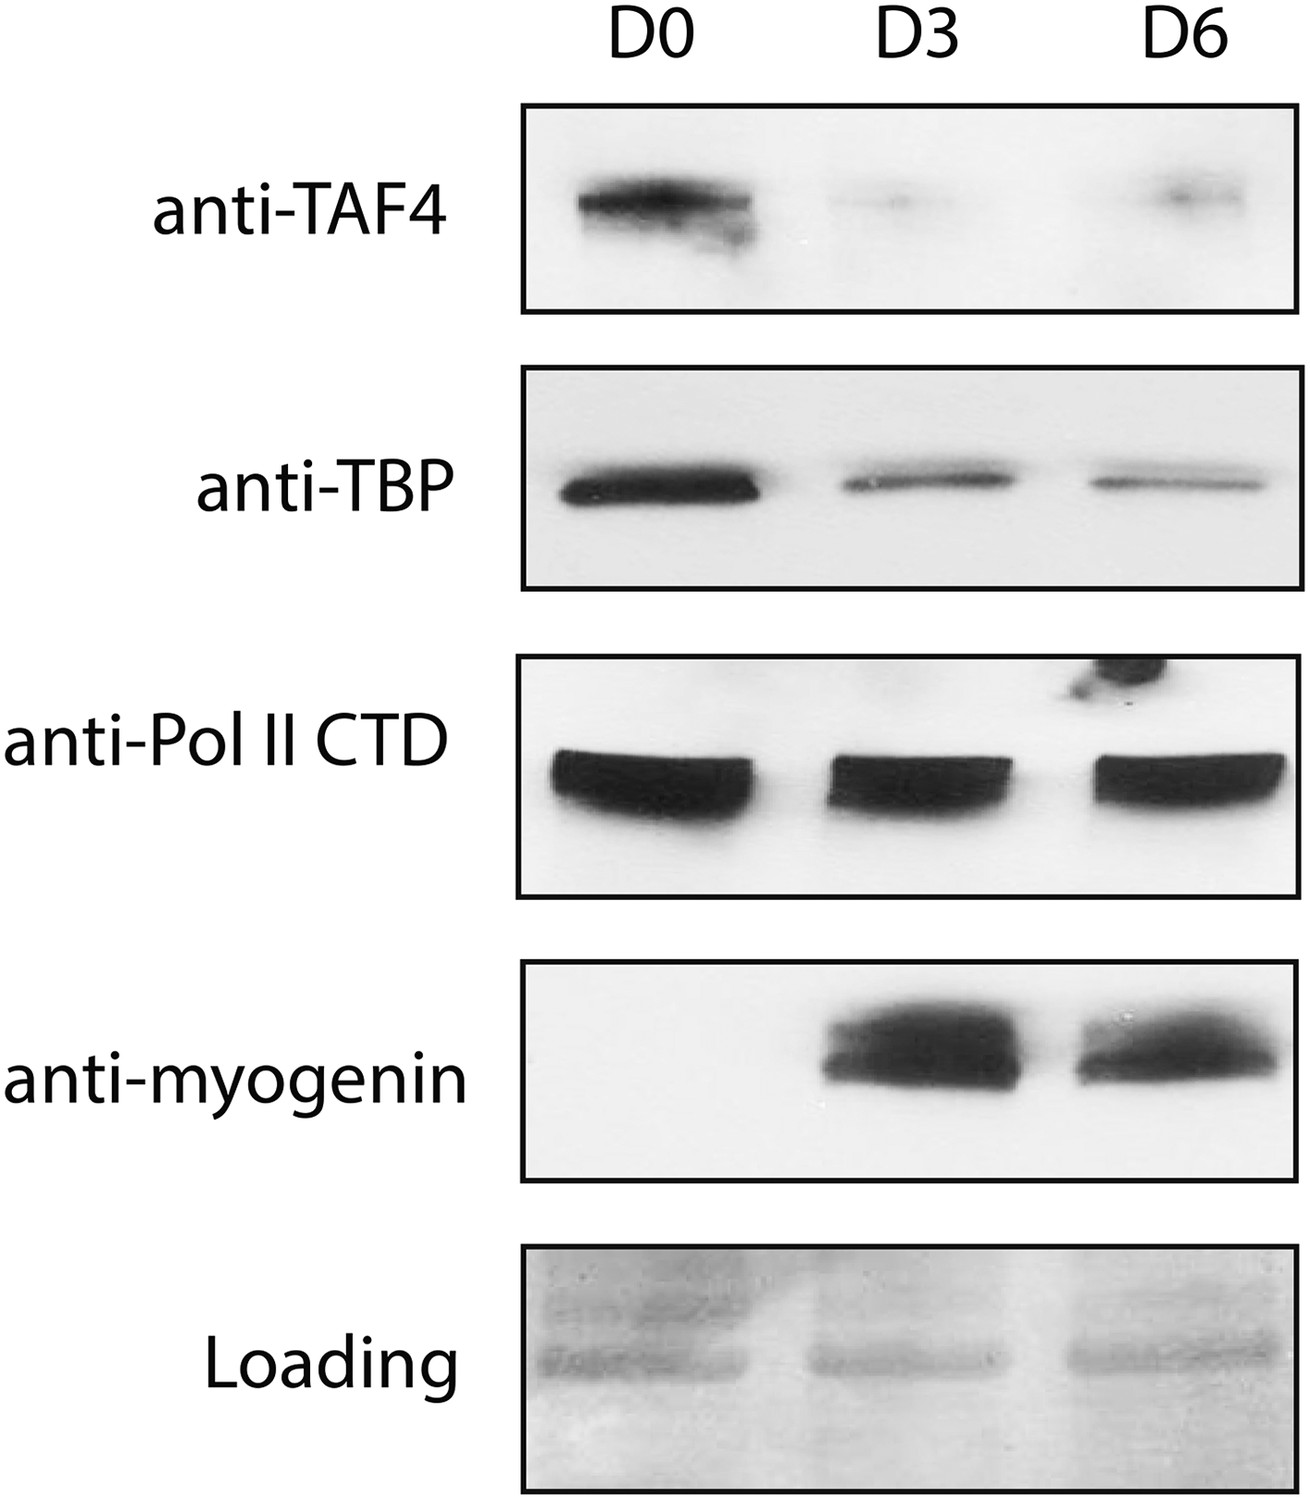
Protein levels of TBP and TAF4 but not RNA polymerase II significantly decrease during C2C12 differentiation.
Western blot analysis of whole-cell extracts prepared from C2C12 myoblasts (D0) and myotubes collected on day 3 (D3) and day 6 (D6) post-differentiation was done using antibodies against TAF4, TBP, myogenin and the carboxy terminal domain (CTD) of the large RNA polymerase II (Pol II) subunit RPB1. Signals in Ponceau S staining were used as loading controls.
Figure 2 with 1 supplement
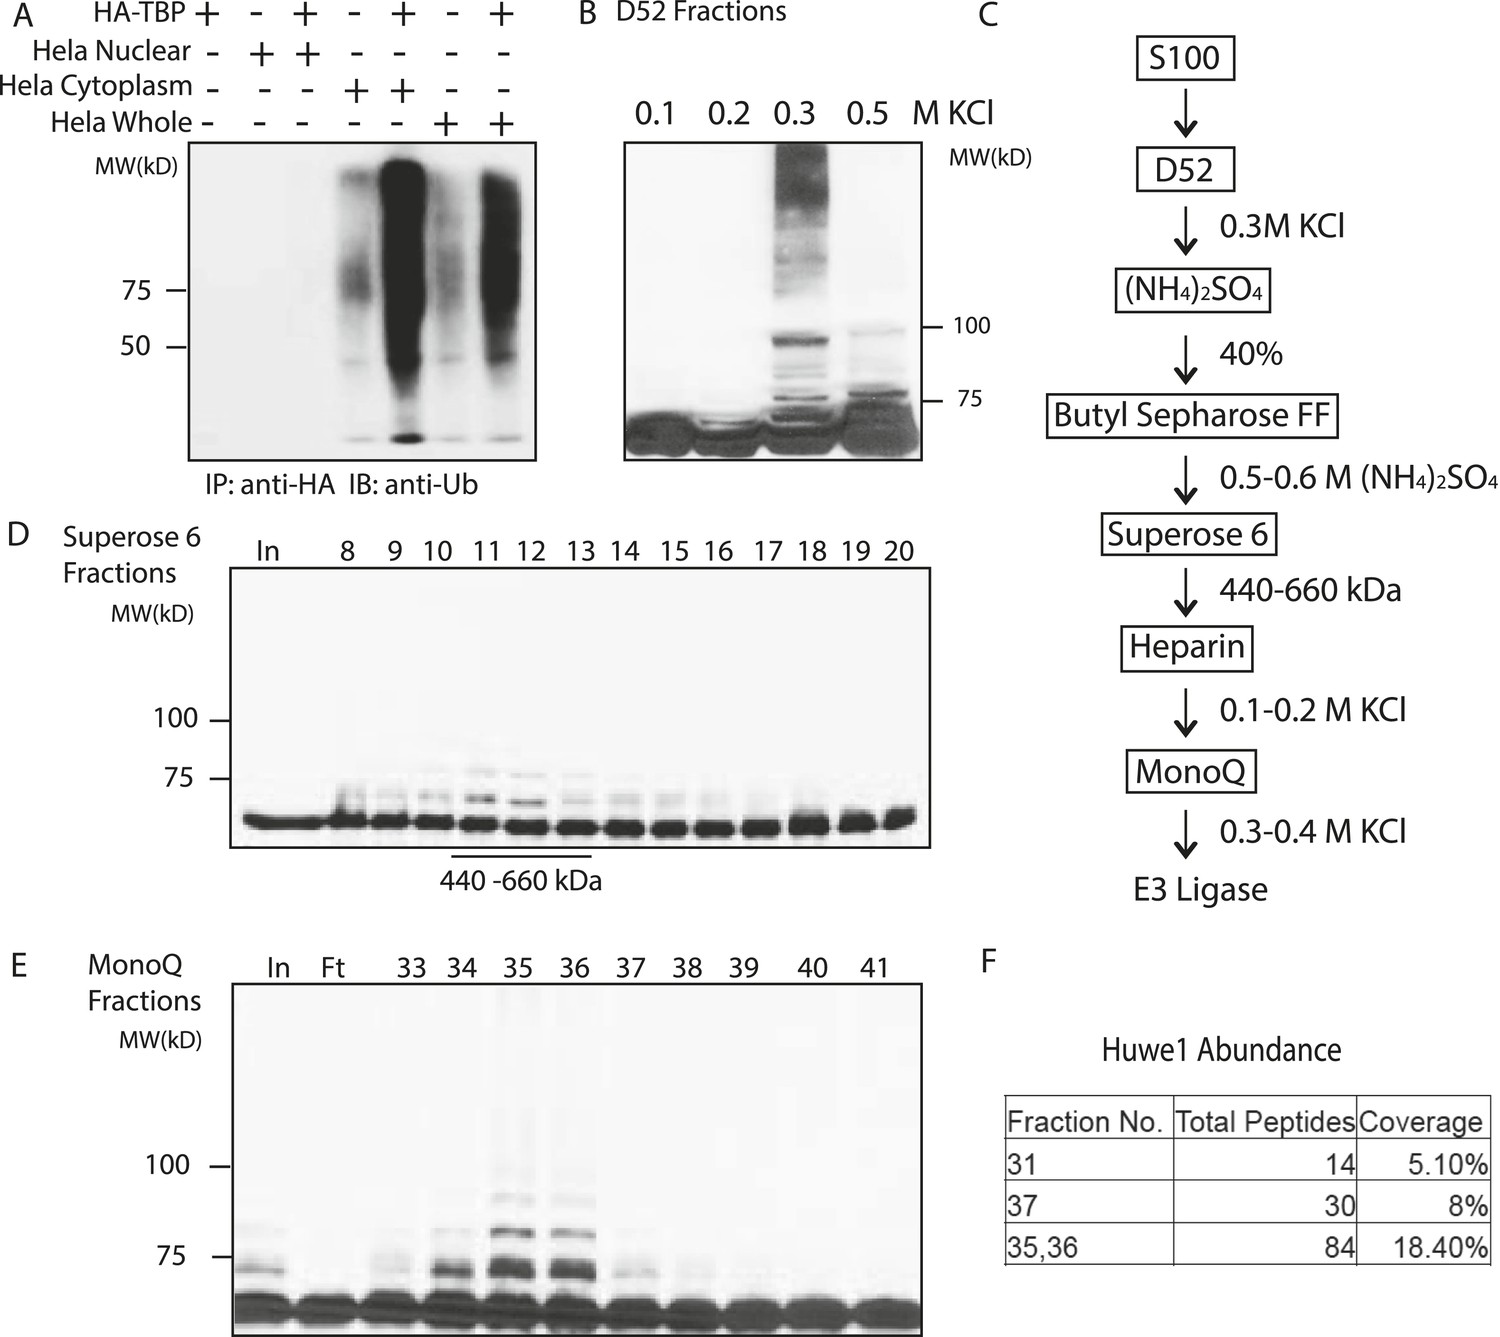
Purification of TBP E3 ligase from HeLa cytoplasmic fraction (S100).
(A) In vitro ubiquitination of TBP by HeLa cell lysates. In vitro transcribed and translated HA-TBP was incubated with indicated HeLa cellular fractions for ubiquitination assays. After the reaction, immunopurified HA-TBP was analyzed western blot using an antibody against ubiquitin. (B) Fractions eluted from the ion exchange (D52) column were assayed in the presence of E1 (UBE1), E2 (UbcH5b), ubiquitin, ubiquitin aldehyde (deubiquitinase inhibitor) and MG132 (proteasome inhibitor). TBP ubiquitination was analyzed by western blots using anti-TBP antibody. (C) Chromatography scheme of purification of TBP E3 ligase. Hela cytoplasmic fraction (S100) was subjected to a series of chromatographic fractionation as indicated. (D) TBP E3 ligase migrates at a size around 440–660 kDa. Input (In) and Superose 6 fractions were assayed as in (B). Motilities of the peak activity (440–660 kDa) are shown (bottom). (E) TBP E3 ligase activity after the final Mono Q chromatography step. Reactions containing Input (In) and Mono Q fractions were performed as in (B). (F) The abundance of Huwe1 protein positively correlates with levels of TBP E3 ligase activity within selected MonoQ fractions. Protein compositions of selected MonoQ fractions were determined by Mudpit (Multidimensional Protein Identification Technology). Shown are numbers of detected peptides and percentage of coverage for Huwe1 protein in indicated fractions.
Figure 2—figure supplement 1
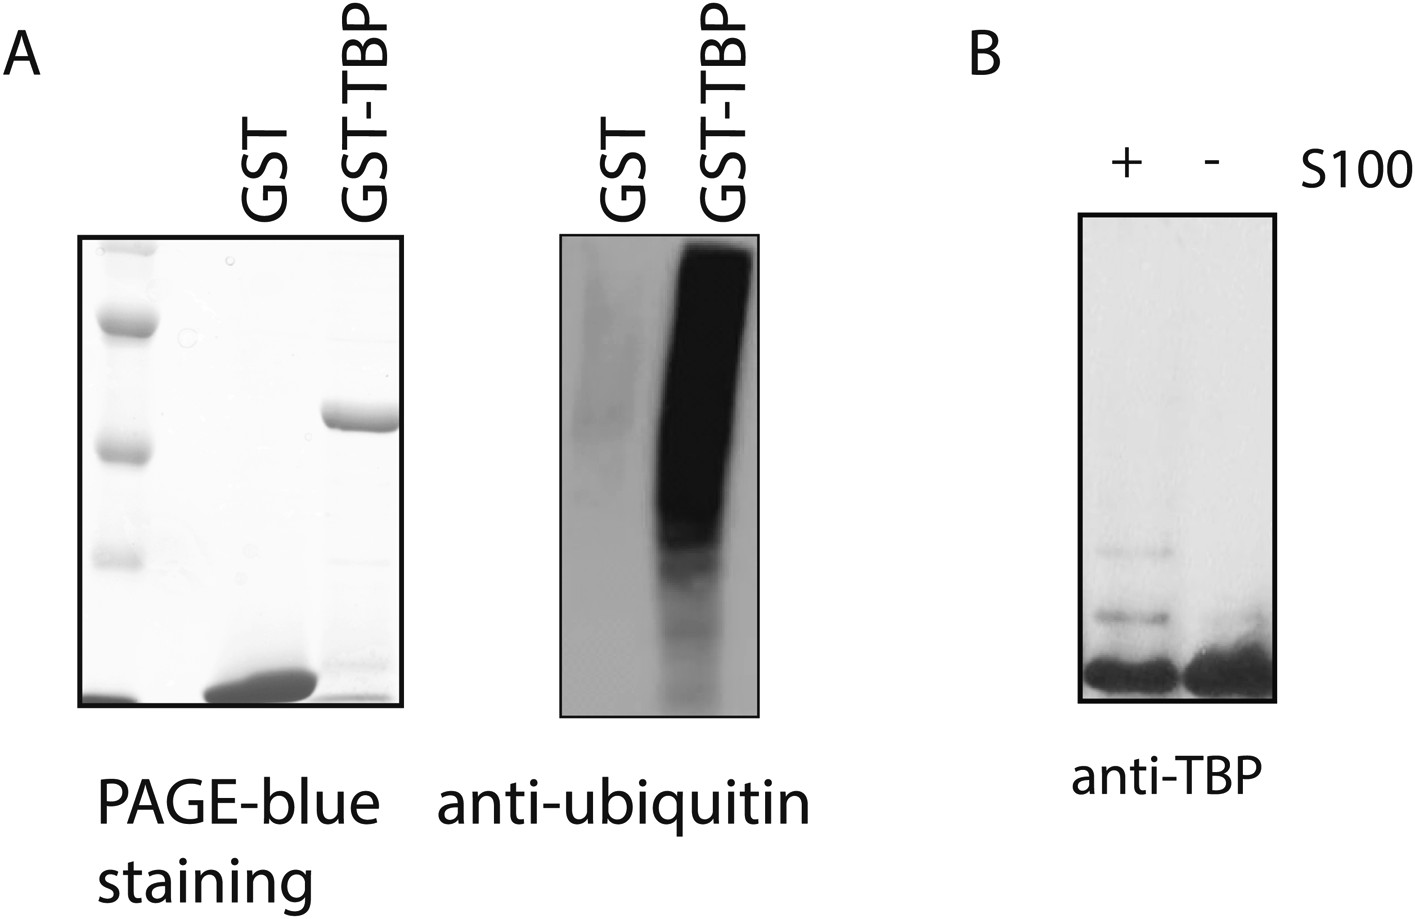
GST-TBP can be used as a substrate for in vitro ubiquitination assays.
(A) GST-TBP but not GST is ubiquitinated by HeLa S100 cytoplasmic fraction in vitro. Recombinant GST-TBP and GST proteins (right) were incubated with Hela S100 fraction for in vitro ubiquitination assay. After the reaction, proteins were purified using GST beads and analyzed by western blot using an antibody against ubiquitin (left). (B) Ubiquitinated species of TBP can be detected by anti-TBP antibody as slow-migrating bands in western blot analysis. GST-TBP was incubated with in vitro ubiquitination reaction mixture in the presence (+) and absence (−) of S100. After the reaction, purified GST-TBP protein was analyzed by western blot using an anti-TBP antibody.
Figure 3 with 2 supplements
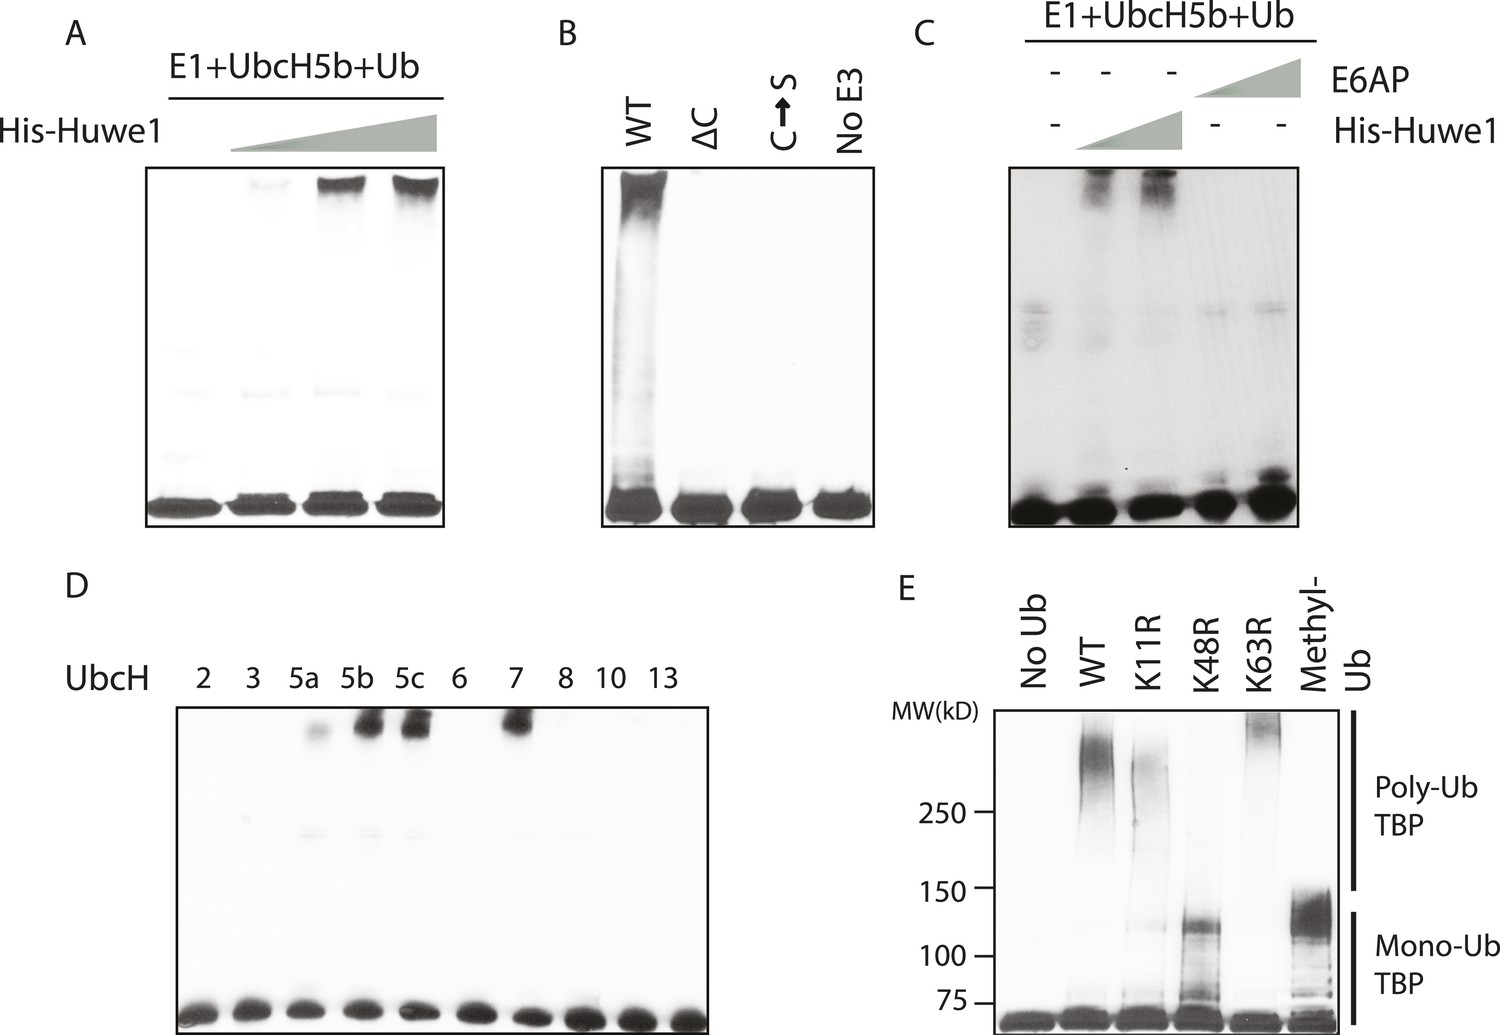
In vitro ubiquitination of TBP using recombinant Huwe1 protein.
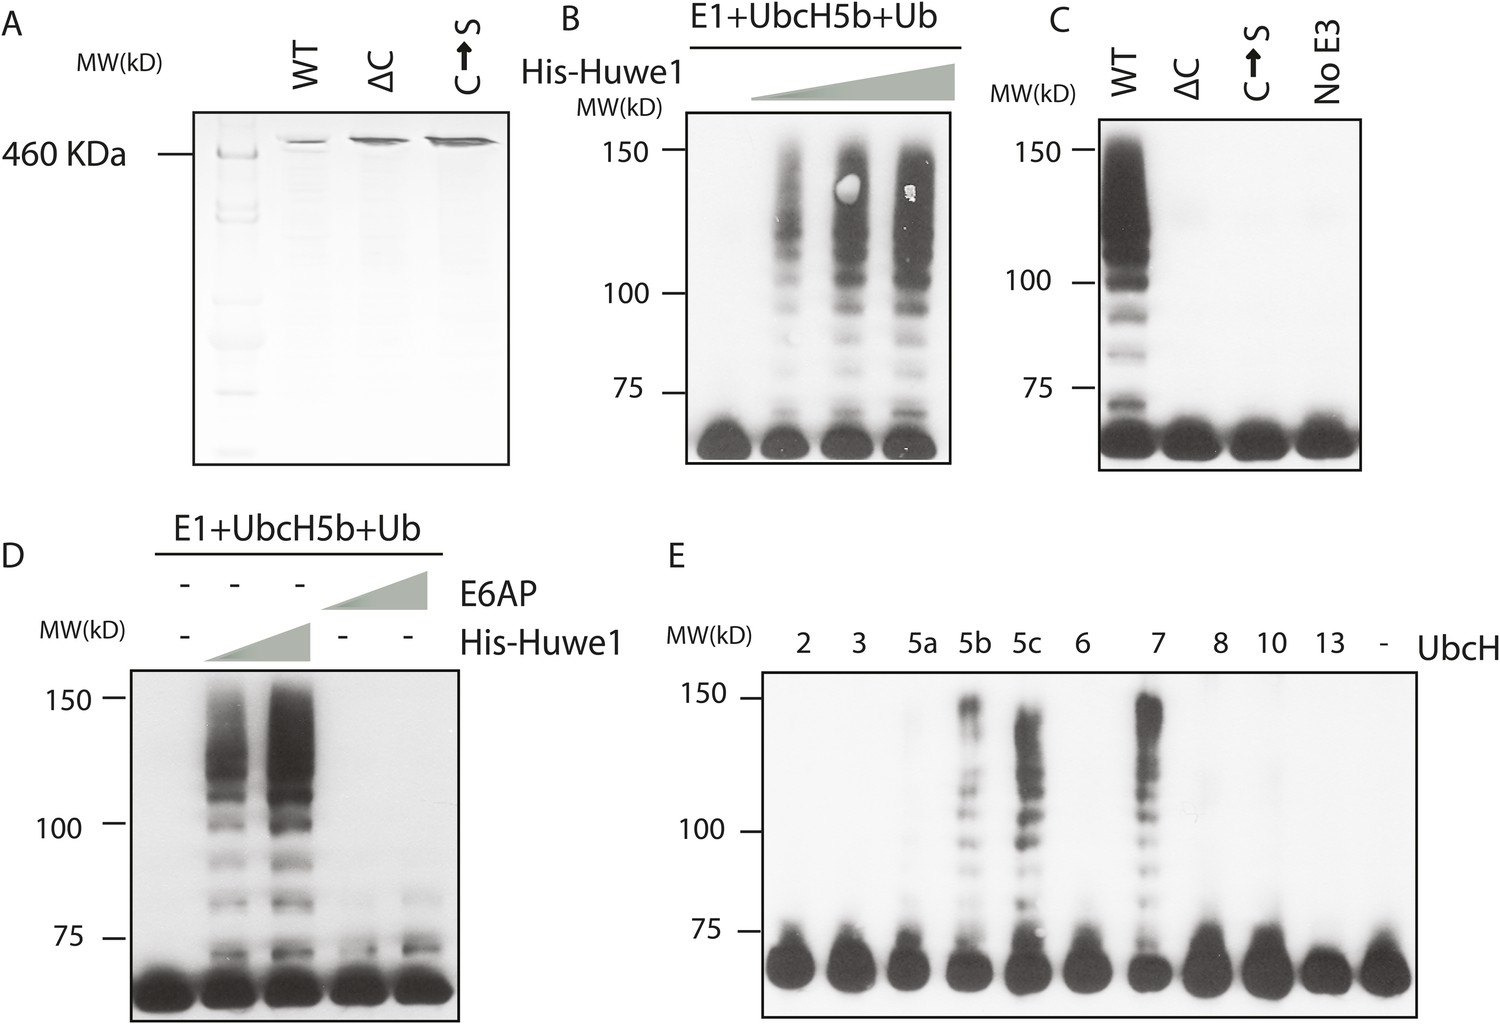
(A) Recombinant Huwe1 protein ubiquitinates TBP in vitro. Titrations (twofold concentration range) of recombinant His-tag Huwe1 protein are incubated with GST-TBP supplemented with E1, UbcH5b, wild-type ubiquitin and ATP regenerating mix, ubiquitin aldehyde in in vitro ubiquitination assays. After the reaction, TBP ubiquitination was analyzed through western blot using the anti-TBP antibody. (B) Hect domain of Huwe1 is required for its TBP ubiquitination activity. Wildtype (WT), Hect domain truncation (ΔC) and catalytic site mutant (C → S) Huwe1 were assayed as in (A) to test their activities to ubiquitinate TBP. (C) Hect domain alone is insufficient for Huwe1's TBP ubiquitination activity. Two different doses of His-tag Huwe1 (twofold range) and recombinant E6AP protein (twofold range) are used in the ubiquitination assay as in (A). (D) Huwe1 E3 activity can be supported by UbcH5 family E2s and UbcH7. A panel of different E2 conjugating enzymes is used in the in vitro ubiquitination assays. (E) Huwe1 mediated the K48-linked ubiquitination of TBP. Wild-type ubiquitin (WT), lysine 11 to arginine mutant (K11R), lysine48 to arginine mutant (K48R), lysine63 to arginine mutant (K63R) and lysine-methylated ubiquitin (Methyl-Ub) are used in the ubiquitination assays.
Figure 3—figure supplement 1
Huwe1 mediates TBP ubiquitination at multiple sites.
(A) PageBlue SDS-PAGE Gel of purified recombinant wild-type (WT), catalytic domain truncation (ΔC) and catalytic site C4341S mutant (C → S) Huwe1 proteins are shown. HiMark pre-stained protein marker (Invitrogen, highest molecular weight 460 kDa) was used to ensure the purification of full-length proteins. (B) Huwe1 ubiquitinates TBP in a dose-dependent manner. Titrations (twofold concentration range) of recombinant His-tag Huwe1 protein were incubated with GST-TBP supplemented with E1, UbcH5b, methyl-ubiquitin, ATP regenerating mix, and ubiquitin aldehyde. After the reaction, TBP ubiquitination was analyzed through western blot using an anti-TBP antibody. (C) Hect domain of Huwe1 is required for the TBP ubiquitination activity. Wildtype (WT), Hect domain truncated (ΔC) and catalytic site C4341S (C → S) Huwe1 mutants were used in the ubiquitination assay as in (B). (D) Hect domain alone is insufficient for Huwe1's TBP ubiquitination activity. Two different doses of His-tag Huwe1 (over twofold range) and Hect-domain containing E3 E6AP (over twofold range) were used in the ubiquitination assay. (E) Huwe1 E3 activity can be activated by UbcH5 family E2s and UbcH7. A panel of different E2 conjugating enzymes were tested by the in vitro ubiquitination assays.
Figure 3—figure supplement 2
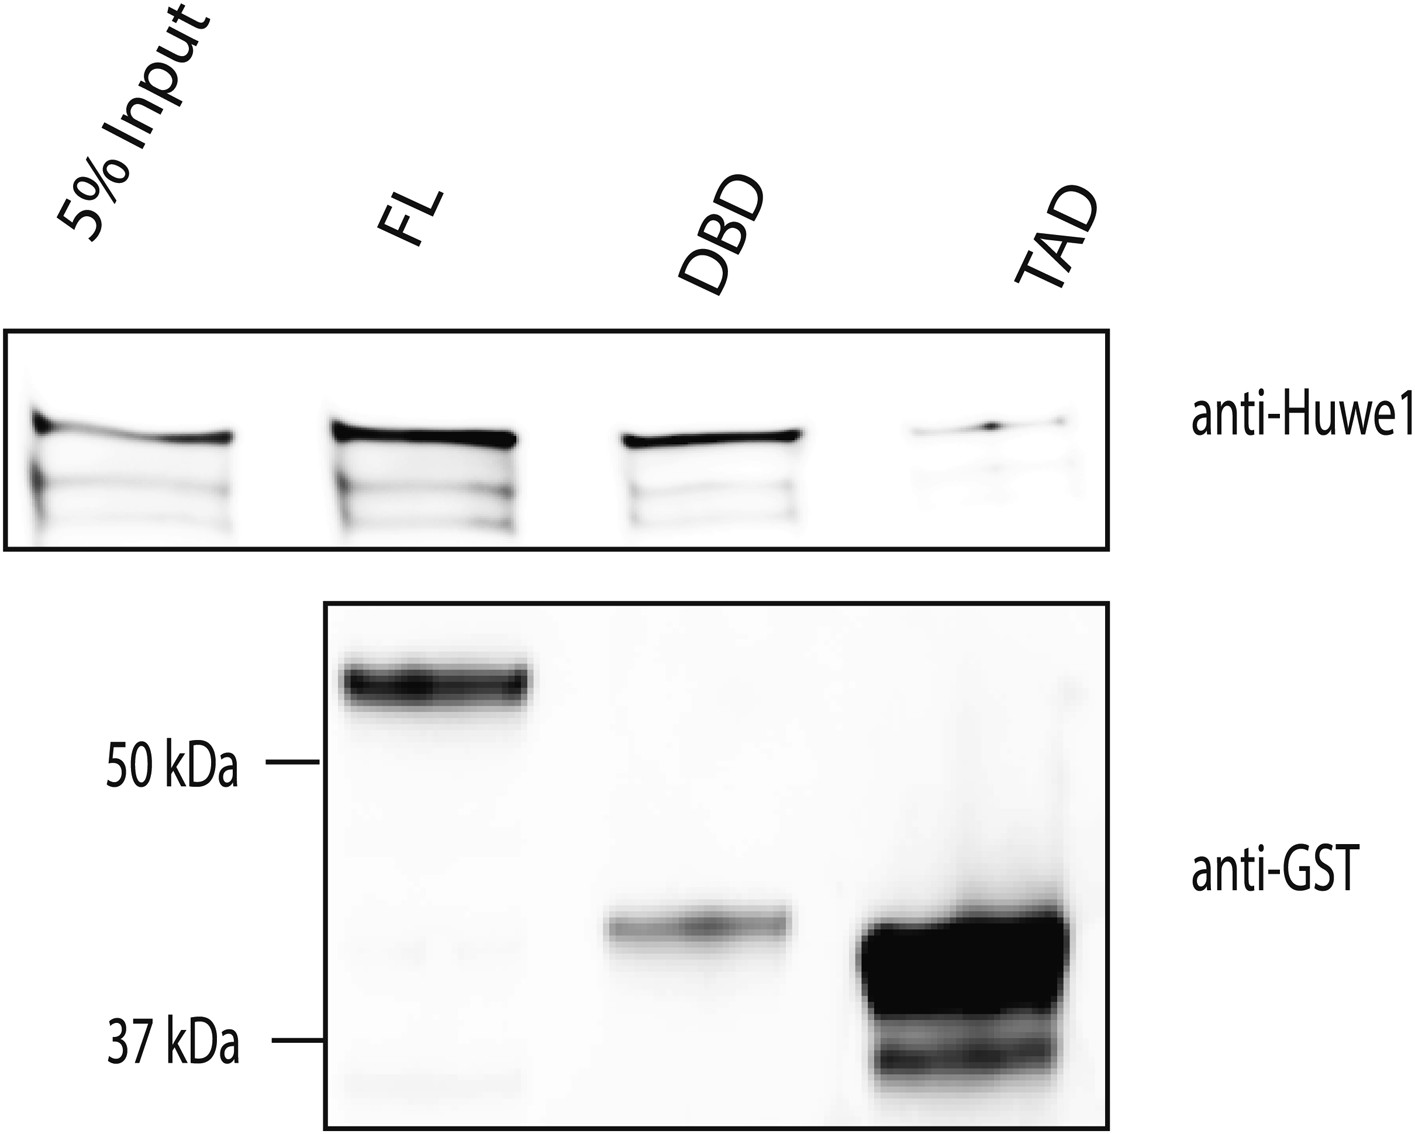
Huwe1 directly interacts with TBP in vitro.
GST-tagged full length (FL) TBP, TBP C-terminal DNA binding domain (DBD) and N-terminal transactivation domain (TAD) were used to pull-down purified recombinant Huwe1 protein. Pull down materials were analyzed by western blot using anti-Huwe1 (upper panel) and anti-GST (lower panel) antibodies.
Figure 4 with 1 supplement
Huwe1 regulates TBP protein levels in proliferating cells.
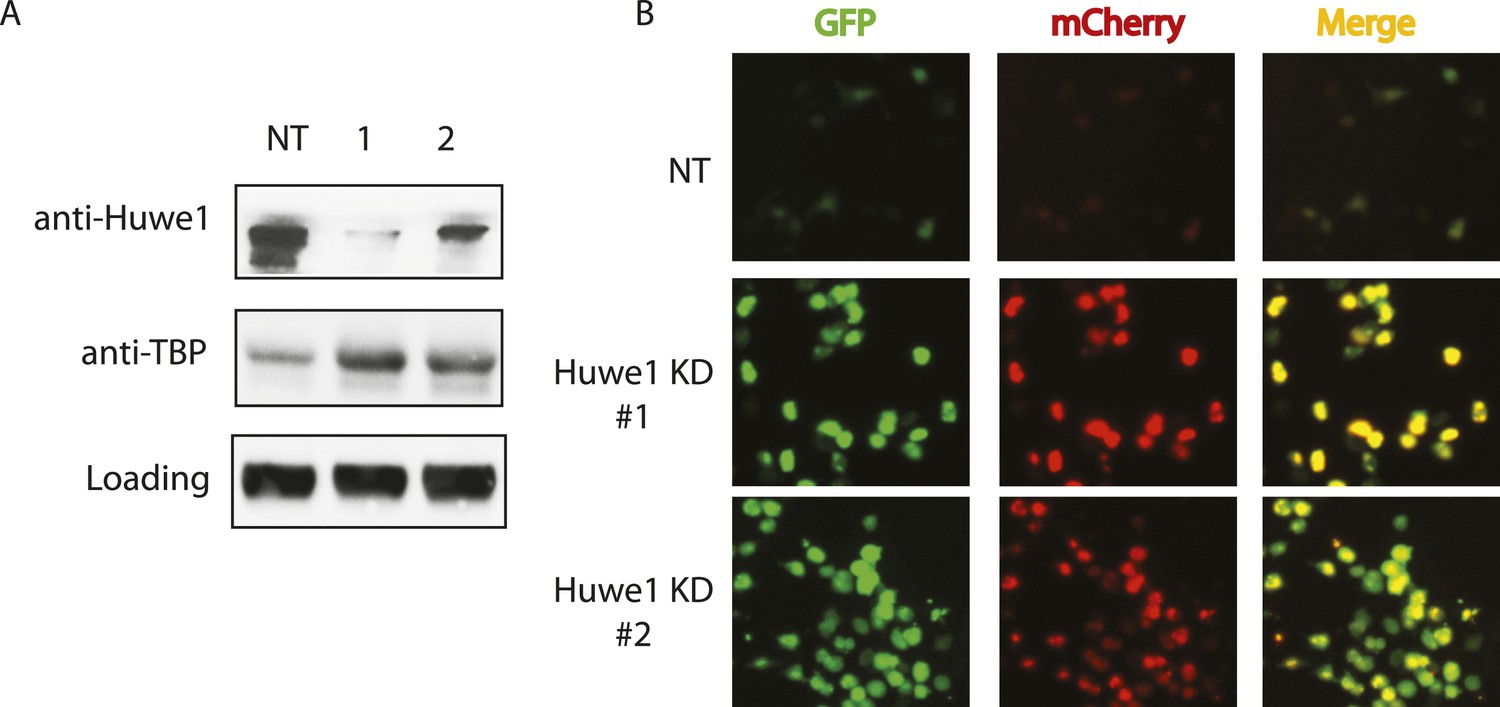
(A) Huwe1 knockdown increases TBP protein levels in 293T cells. Western blot analysis of whole cell extracts from control (NT) and Huwe1 knockdown 293T cells was done using antibodies against Huwe1 and TBP. In this assay, Tubulin signals were used as loading controls. (B) Huwe1 knockdown increases protein half-life of TBP-fluorescent-timer fusion protein. Fluorescent images of 293T cells cotransfected with a plasmid expressing the TBP-fluorescent-timer fusion protein and control pLKO.1 (NT) or two different pLKO.1 plasmids expressing shRNA against Huwe1 (Huwe1 KD#1 and Huwe1 KD#2) are taken using the same exposure time, then processed in parallel with ImageJ.
Figure 4—figure supplement 1
Huwe1 knockdown prolongs half-life of fluorescent-timer TBP fusion protein in 273T cells as measured by fluoresent-timer assays.
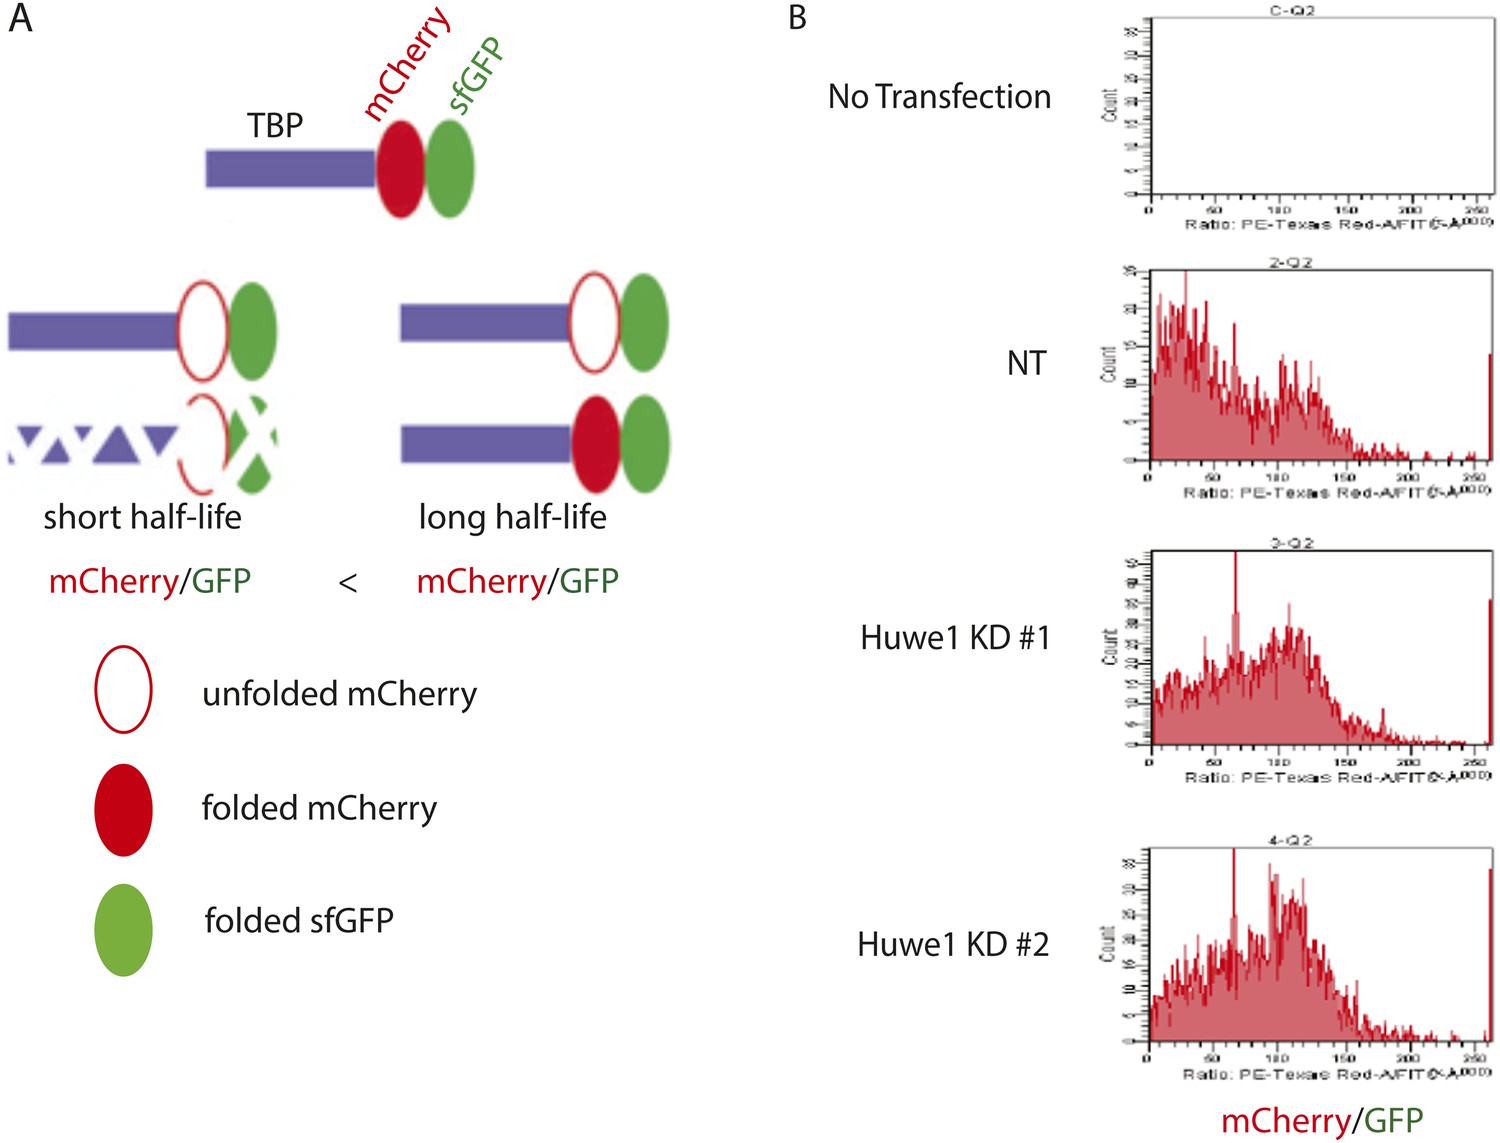
(A) Schematic representation of the principle for fluorescent timer assay. (B) Fluorescent-timer TBP fusion protein exhibits higher mCherry/GFP ratio in Huwe1 knockdown 293T cells. 293T cells were cotransfected with a plasmid expressing the TBP-fluorescent-timer fusion protein and control pLKO.1 (NT) or pLKO.1 plasmid expressing shRNA against Huwe1 (Huwe1 KD#1 or Huwe1 KD#2). mCherry/GFP signal ratios in single cells were measured using DB FACSAria III Cell Sorter.
Figure 5 with 1 supplement
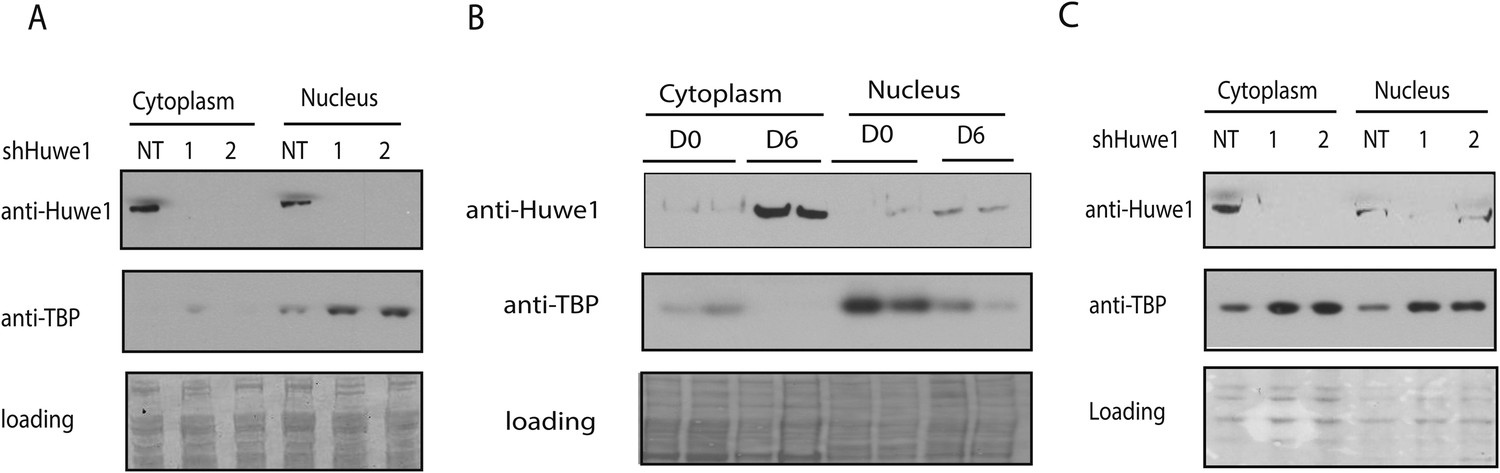
Huwe1 regulates TBP protein level in myoblasts and myotubes.
(A) Lentivirus-mediated depletion of Huwe1 elevates TBP protein level in C2C12 myotubes. Cytoplasmic and nuclear extracts of C2C12 myoblasts infected with control (NT) lentiviruses or two different lentiviruses targeting Huwe1 (1, 2) were analyzed by western blots using antibodies against Huwe1 and TBP. Signals in Ponceus S staining were used as loading controls. (B) Up-regulation of Huwe1 protein levels during C2C12 differentiation. Cytoplasm and nuclear extracts of proliferating C2C12 myoblasts (D0) and differentiated C2C12 myotubes (D6) were analyzed by western blots using antibodies against Huwe1 and TBP. Signals in Ponceus S staining were used as loading controls. Results from two biological replicates are shown. (C) Huwe1 knockdown in differentiated myotubes partly rescues TBP protein levels. Cytoplasmic and nuclear extracts of differentiation day 8 myotubes infected with either control lentiviruses (NT) or two different lentiviruses targeting Huwe1 (1,2) were analyzed by western blots using antibodies against Huwe1 and TBP. Signals in Ponceus S staining were used as loading controls.
Figure 5—figure supplement 1
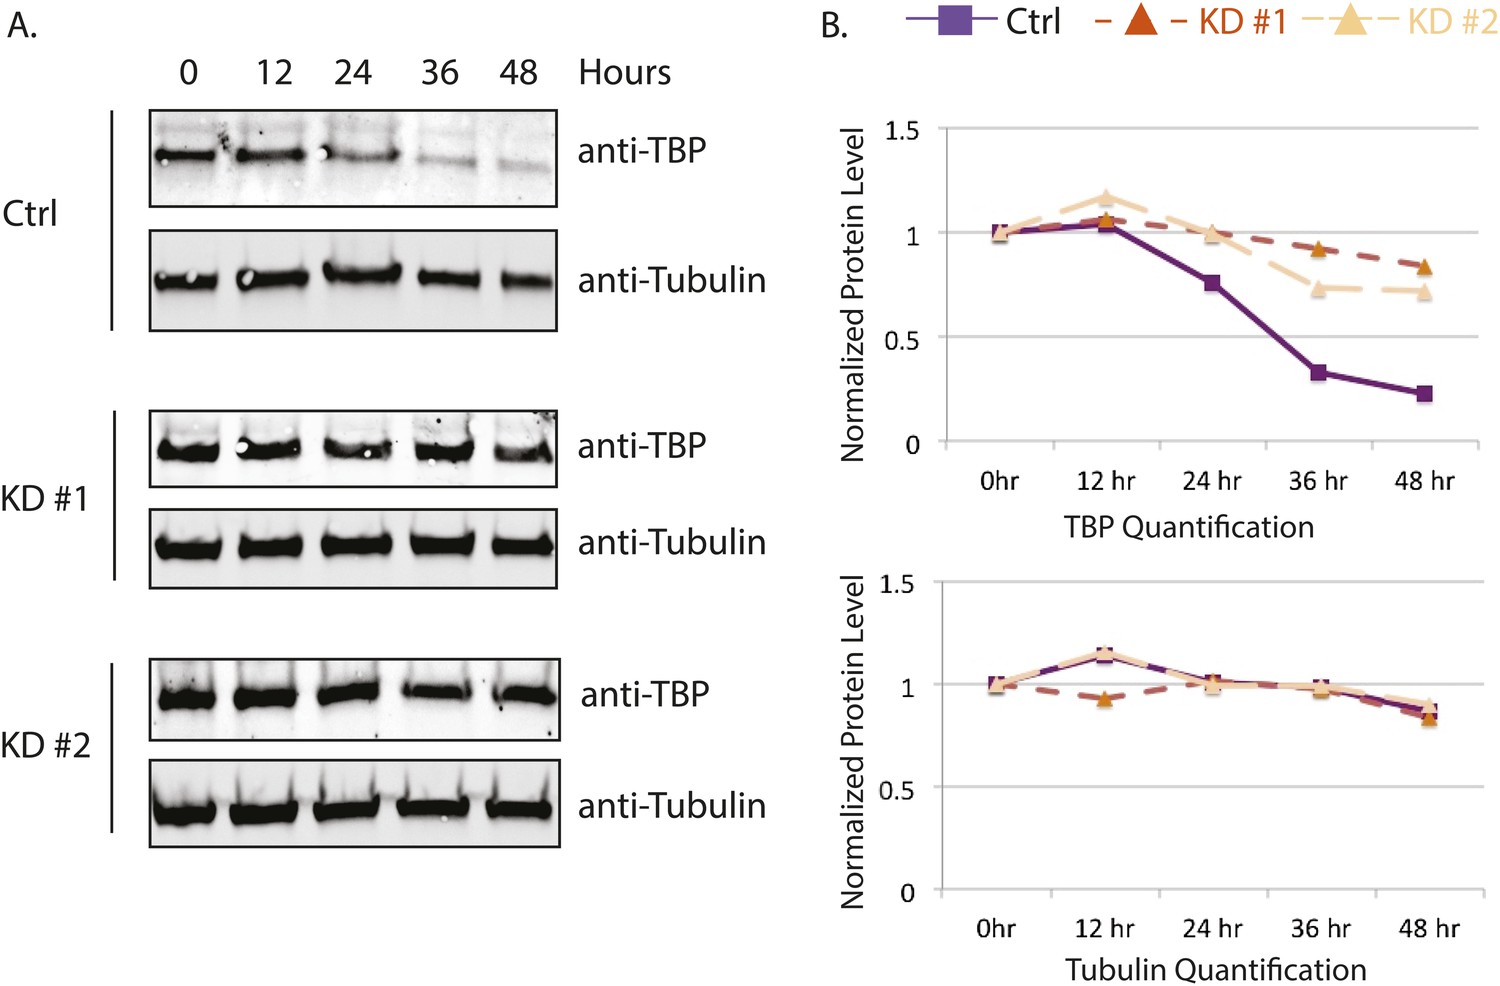
Huwe1 knockdown increases TBP protein half-life in C2C12 myoblasts.
(A) Control and Huwe1 knockdown C2C12 myoblasts were treated with 50 μg/ml cycloheximide. Cells were collected at indicated time points and analyzed by western blot using anti-TBP and anti-Tubulin (control) antibody. (B) Quantification of western blots in (A) using ImageJ. Signal intensities were normalized to 0 time point in each blots.
Figure 6 with 2 supplements
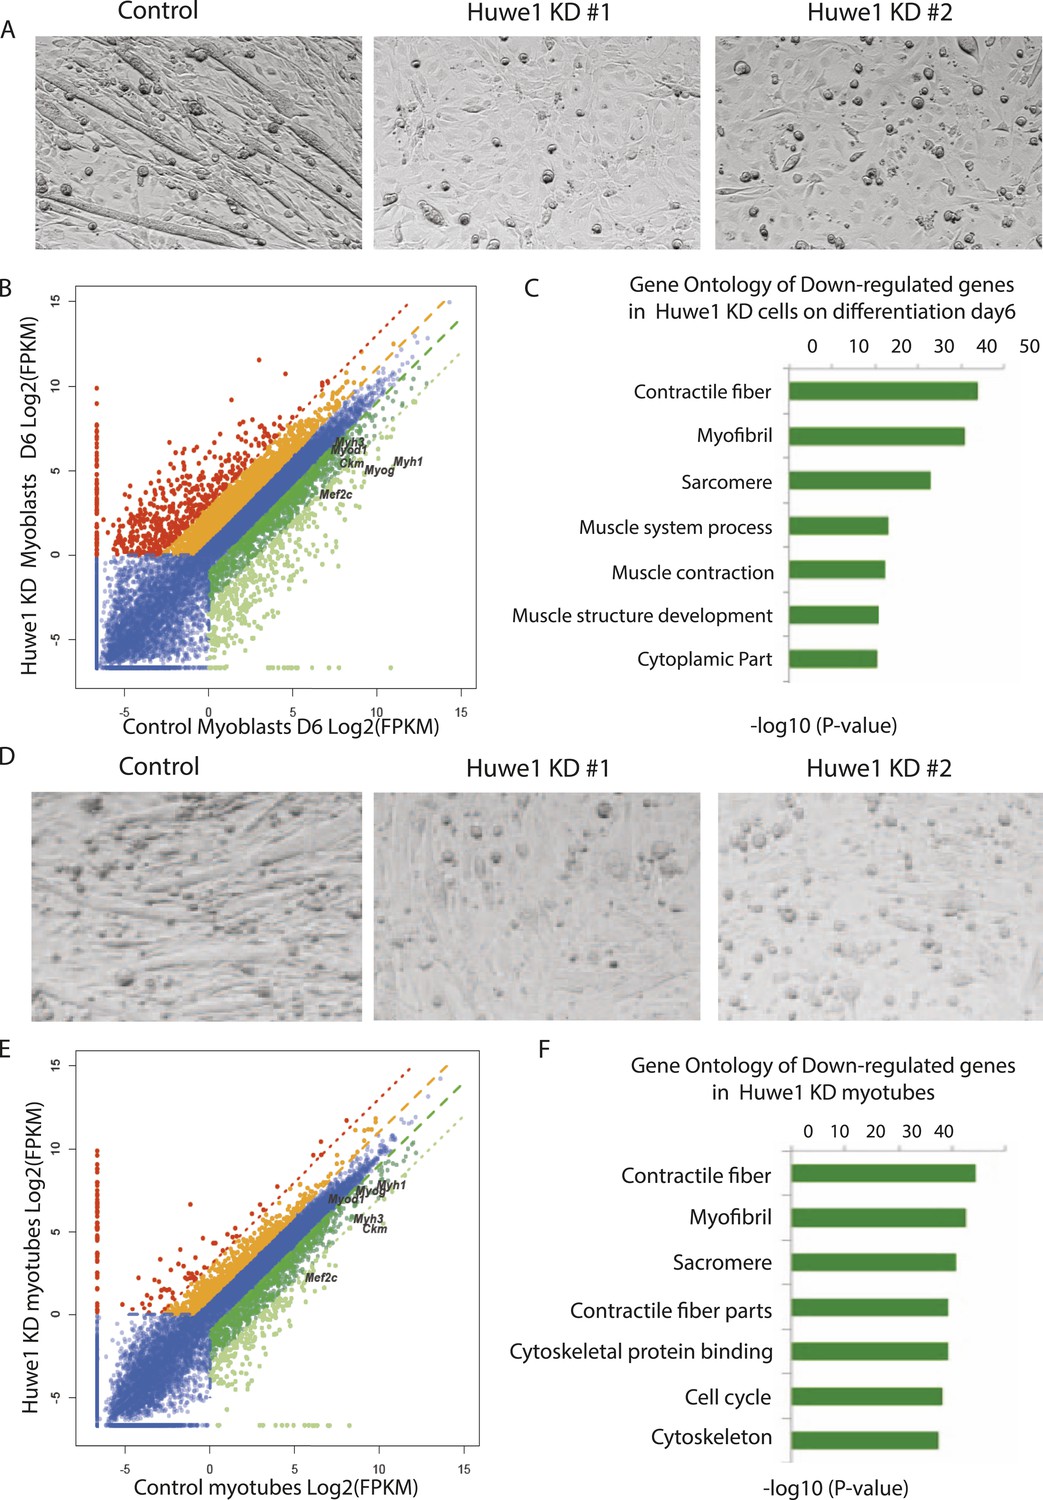
Huwe1 is required for muscle differentiation and maintenance of normal muscle morphologies.
(A) Huwe1 knockdown impaired C2C12 differentiation efficiency. Shown are phase contrast images of control and Huwe1 knockdown C2C12 myoblasts after 6 days of differentiation in 2% horse serum. (B) Muscle marker genes were not efficiently induced in Huwe1 knockdown C2C12 cells after 6 days of differentiation. Differential gene expression analysis was used to characterize the effects of Huwe1 knockdown on muscle differentiation using mRNA-seq data. The log2 scale values of fragments per kilobase per million (FPKM) for genes in both control and Huwe1 knockdown samples are plotted in the graph. Dark green, twofold down; light green, eightfold down; orange, twofold up; red, eightfold up. (C) Goseq gene ontology analysis of genes down-regulated in Huwe1 knockdown samples. The list shows top categories ranked by p-value. (D) Knockdown of Huwe1 in differentiated muscle cells affected normal muscle morphology. Shown are phase contrast images of control and Huwe1 knockdown C2C12 myotubes. (E) Huwe1 knockdown in terminally differentiated myotubes reduced transcription levels of muscle marker genes. Differential gene expression analysis to characterize the effects of Huwe1 knockdown in terminally differentiated muscle cells using mRNA-seq data. Figure was labelled the same way as (B). (F) Goseq gene ontology analysis of genes down regulated by Huwe1 knockdown in myotubes. List showes top categories ranked by p-value.
-
Figure 6—source data 1
Differentiation gene expression analysis of control and Huwe1 knockdown C2C12 cells on differentiation Day 6 by RNA-seq.
- https://doi.org/10.7554/eLife.08536.015
-
Figure 6—source data 2
Differentiation gene expression analysis of control and Huwe1 knockdown myotubes on differentiation Day 8 by RNA-seq.
- https://doi.org/10.7554/eLife.08536.016
-
Figure 6—source data 3
Differentiation gene expression analysis of control and Huwe1 knockdown C2C12 cells on differentiation Day 0 by RNA-seq.
- https://doi.org/10.7554/eLife.08536.017
Figure 6—figure supplement 1
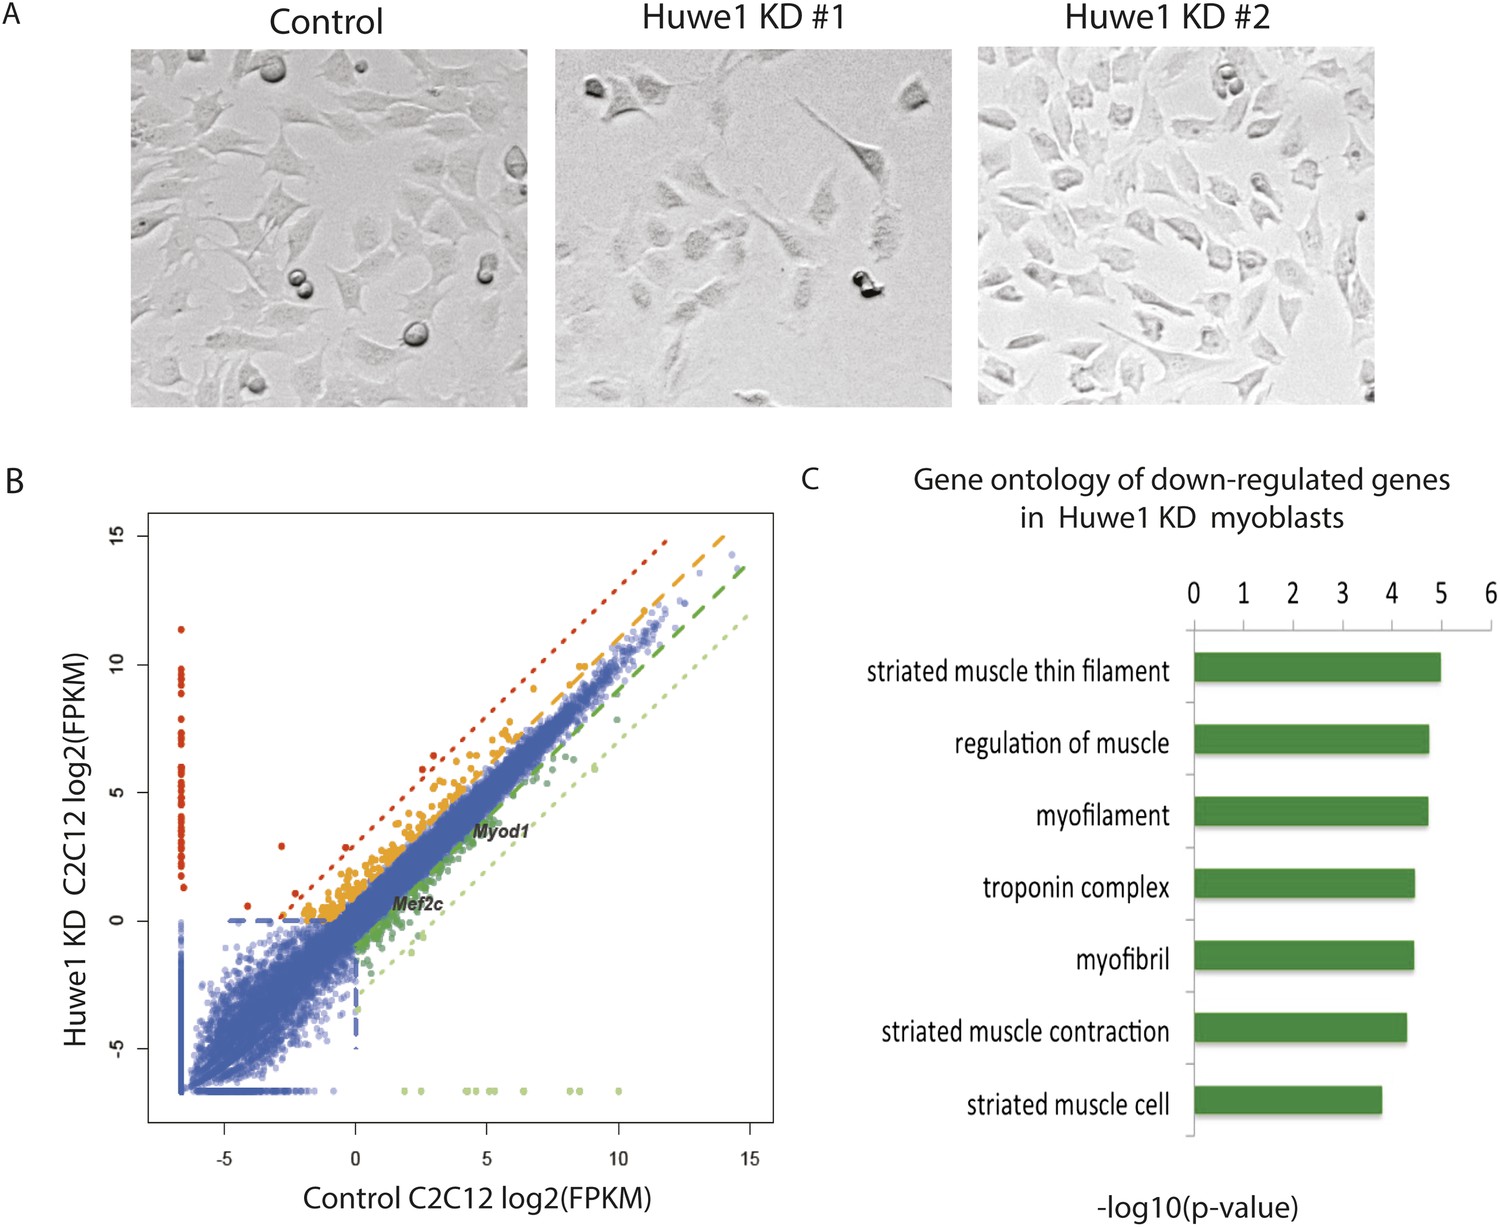
Huwe1 knockdown causes modest changes in the transcriptional program of C2C12 myoblasts.
(A) Huwe1 knockdown C2C12 myoblasts did not exhibit significant morphological differences compared to control C2C12 s when cultured in proliferation medium (10% FBS). (B) Huwe1 knockdown results in modest changes in the transcriptional program of C2C12 myoblasts. Differential gene expression analysis was used to characterize the effects of Huwe1 knockdown in proliferating myoblasts using mRNA-seq data. The log2 scale values of fragments per kilobase per million (FPKM) for genes in both WT and Huwe1 knockdown samples are plotted in the graph. Dark gene, twofold down; light green, eightfold down; orange, twofold up; red, eightfold up. (C) Goseq gene ontology analysis of genes affected by knockdown of Huwe1 using RNA-seq data. Enriched gene categories obtained are ranked by p-value.
Figure 6—figure supplement 2
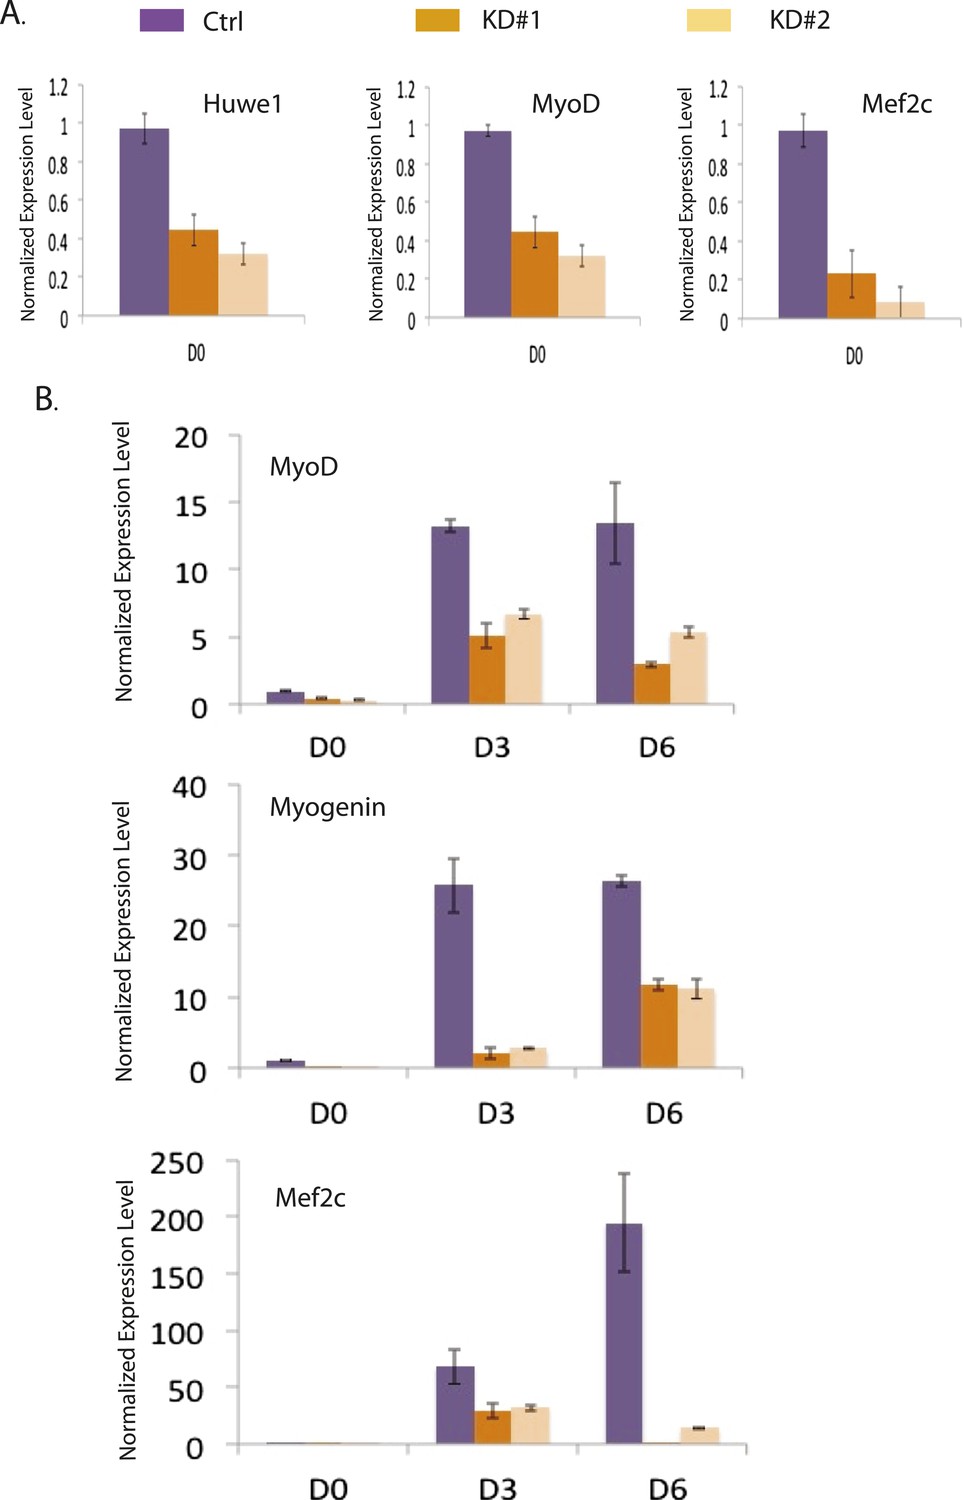
Huwe1 knockdown inhibits the induction of master myogenic factors during C2C12 differentiation.
(A) Huwe1, Myod1 and Mef2c mRNA levels in control and two different Huwe1 knockdown C2C12 myoblast lines were analyzed by RT-qPCR and normalized to Gapdh. Shown are values relative to control cells and from representative experiments; error bars represent standard deviation (n = 3). (B) Myod1, Myogenin and Mef2c mRNA levels in control and two different Huwe1 knockdown C2C12 lines during differentiation were analyzed by RT-qPCR and normalized to Gapdh. Shown are values relative to control cells on differentiation Day 0 (D0) and from representative experiments; error bars represent standard deviation (n = 3).
Figure 7 with 2 supplements
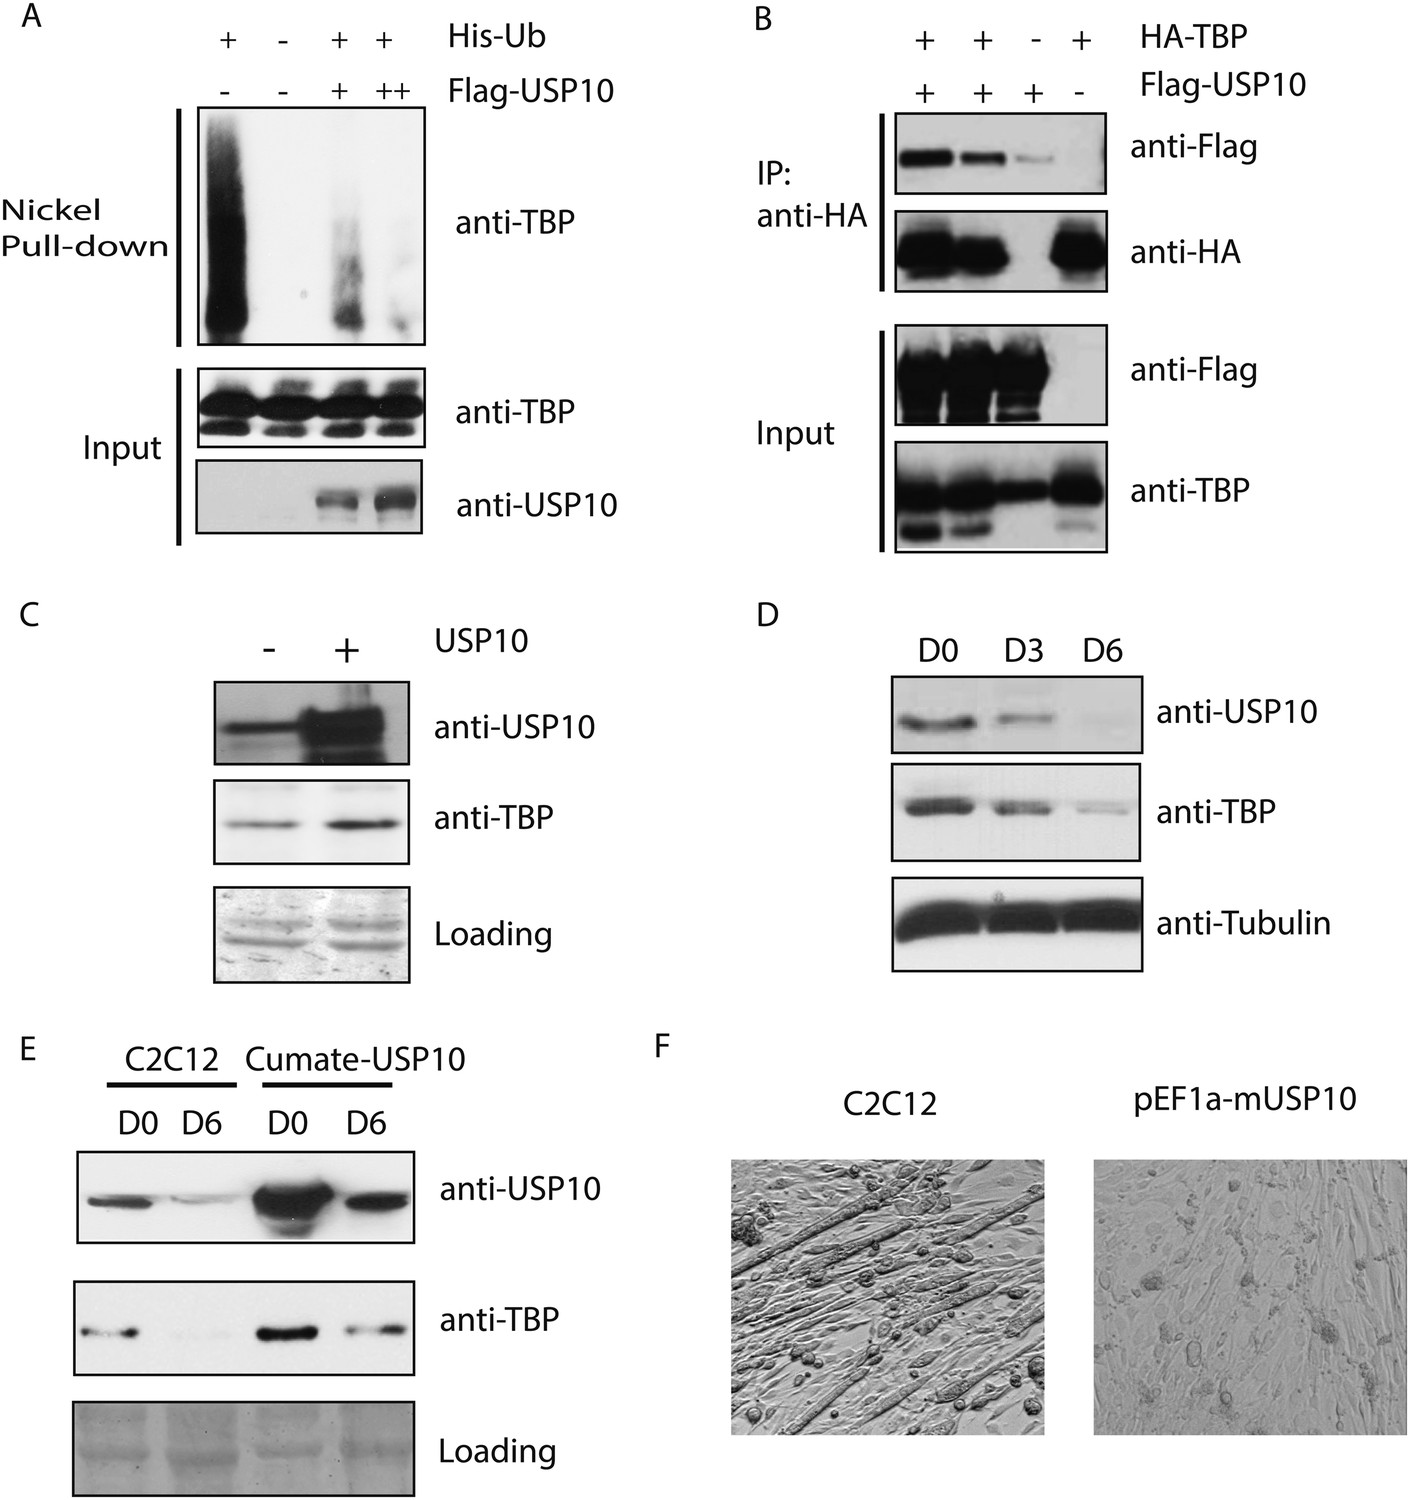
Ubiquitin-specific protease 10 (USP10) regulates TBP protein level during myogenesis.
(A) USP10 overexpression inhibits TBP ubiquitination in vivo. 293T cells were transfected with indicated plasmids as well as a plasmid expressing HA-TBP. Ubiquitin conjugates were purified using Ni-NTA resin under denatured conditions from MG132 treated cells, then subjected to western blot analysis using anti-TBP antibody. Input lysates (1%) are analyzed using antibodies against TBP and USP10. (B) USP10 interacts with TBP. Coimmunoprecipitation using antibodies against HA epitope was performed in 293T cell lysates transfected with indicated plasmids. Input (5%) and precipitated proteins were analyzed using antibodies as indicated. (C) USP10 overexpression results in modest increases of TBP protein levels in C2C12 myoblasts. Western blot analysis of whole cell extracts from control or USP10 overexpressing C2C12 myoblasts (stable cell line) were done using antibodies against USP10 and TBP. Signals in Ponceau S staining were used as loading controls. (D) USP10 protein level decreases during C2C12 differentiation. Whole cell extracts of myoblasts (D0) and myotubes on differentiation Day 3 (D3) and Day 6 (D6) were analyzed by western blots using antibodies against USP10, TBP and tubulin. (E) Induction of USP10 rescues TBP protein levels in differentiated myotubes. Whole cell extracts from myoblasts (D0) and myotubes (D6) of control and Usp10 inducible (Cumate-USP10) C2C12 cells incubated with 10X cumate solution were analyzed by western blot using antibodies against USP10 and TBP. Signals in Ponceau S staining were used as loading controls. (F) USP10 overexpression inhibits C2C12 myoblasts differentiation. Shown are phase contrast images of control and USP10 overexpressing C2C12 myoblasts after 6 days of differentiation.
-
Figure 7—source data 1
- https://doi.org/10.7554/eLife.08536.021
Figure 7—figure supplement 1
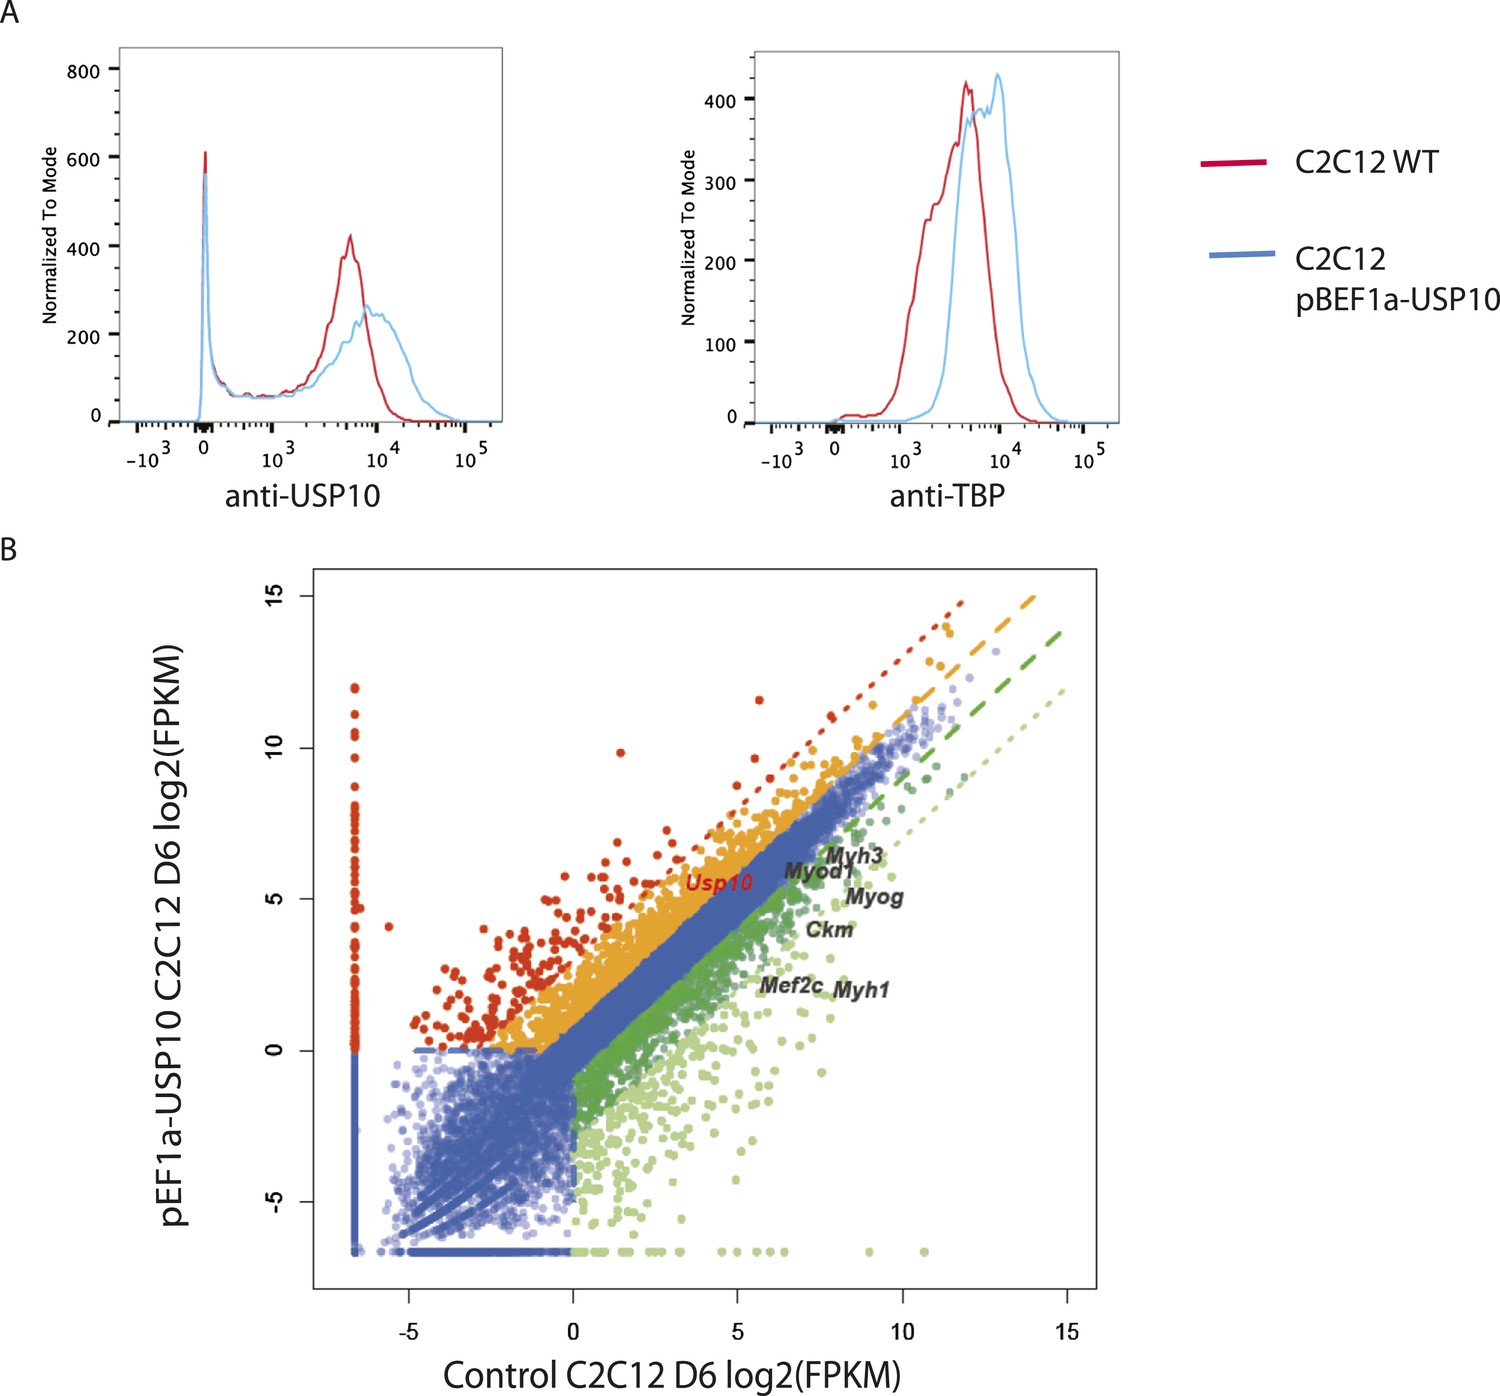
USP10 overexpression elevates TBP protein levels and impairs differentiation capacity.
(A) USP10 overexpression increases TBP protein level. Wild type and USP10 overexpressing C2C12 (stable cell line) were double-stained using rabbit anti-USP10 and mouse anti-TBP primary antibodies, followed by incubation with Dylight594 goat-anti-rabbit and Dylight488 goat-anti-mouse secondary antibodies. Fluorescent intensities were then analyzed by DB FACSAria III Cell Sorter. (B) Muscle marker genes were not efficiently induced in USP10 overexpressing C2C12 cells after 6 days of differentiation. Differential mRNA-seq gene expression analysis was used to characterize the effects of USP10 overexpression upon C2C12 differentiation. The log2 scale values of fragments per kilobase per million (FPKM) for genes in both WT and USP10 overexpressed differentiation Day 6 samples are plotted in the graph. Dark gene, twofold down; light green, eightfold down; orange, twofold up; red, eightfold up.
Figure 7—figure supplement 2
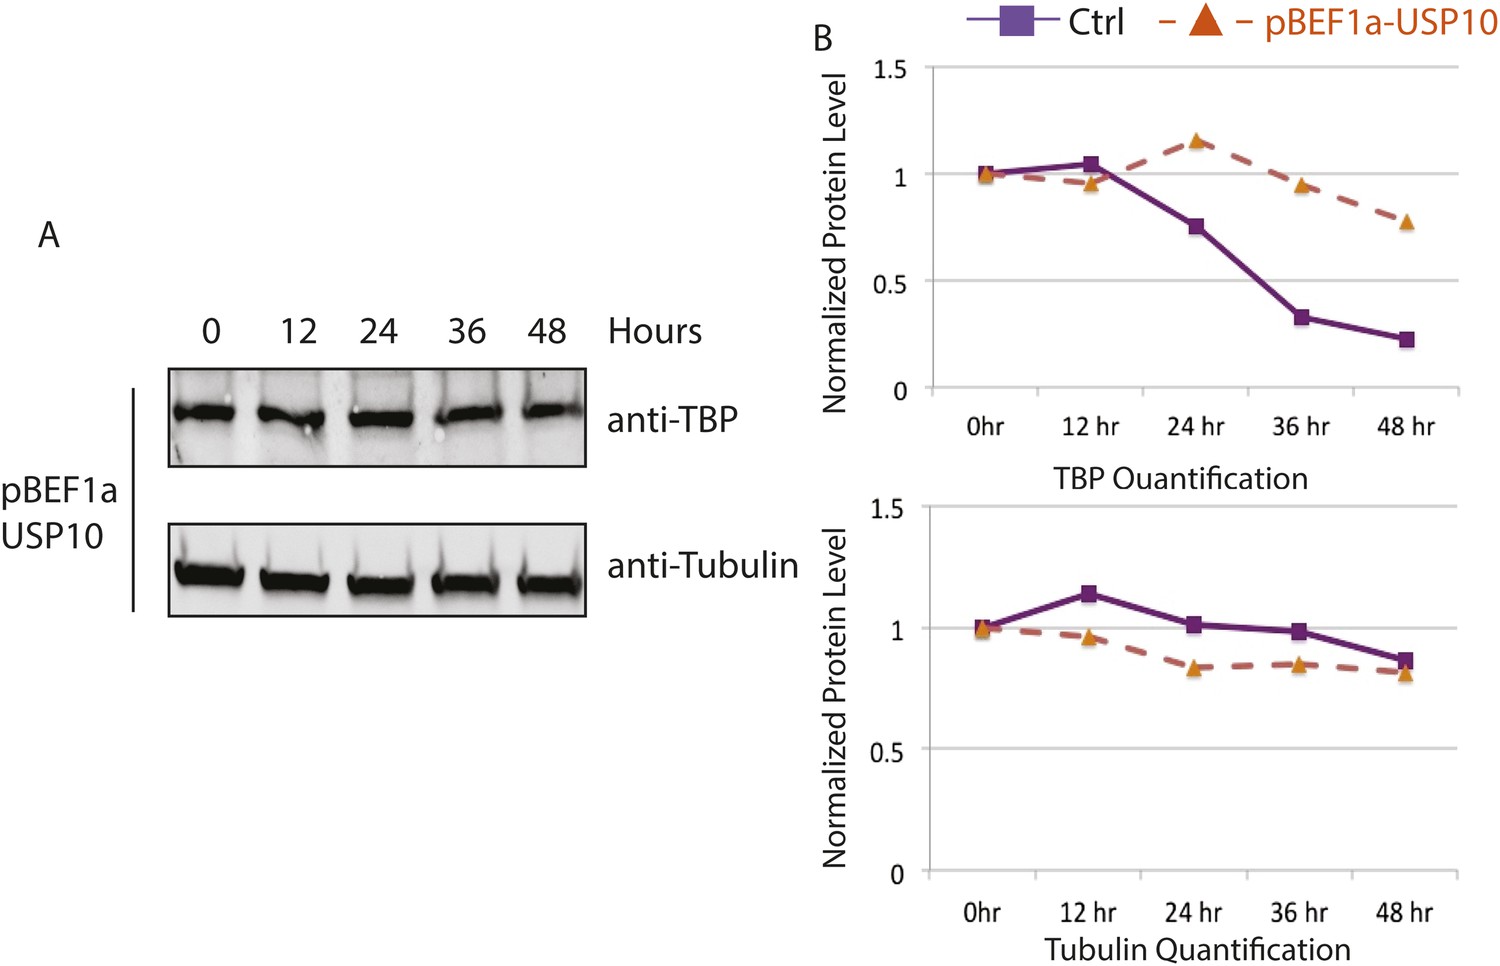
USP10 overexpression increases TBP protein half-life in C2C12 myoblasts.
(A) USP10 overexpressing C2C12 myoblasts were treated with 50 μg/ml cycloheximide. Cells were collected at indicated time points and analyzed by western blot using anti-TBP and anti-Tubulin (control) antibodies. (B) Quantification of western blots in (A) using ImageJ. Signal intensities were normalized to 0 time point in each blots. Control values from Figure 5—figure supplement 1 were plotted as comparison.
Figure 8
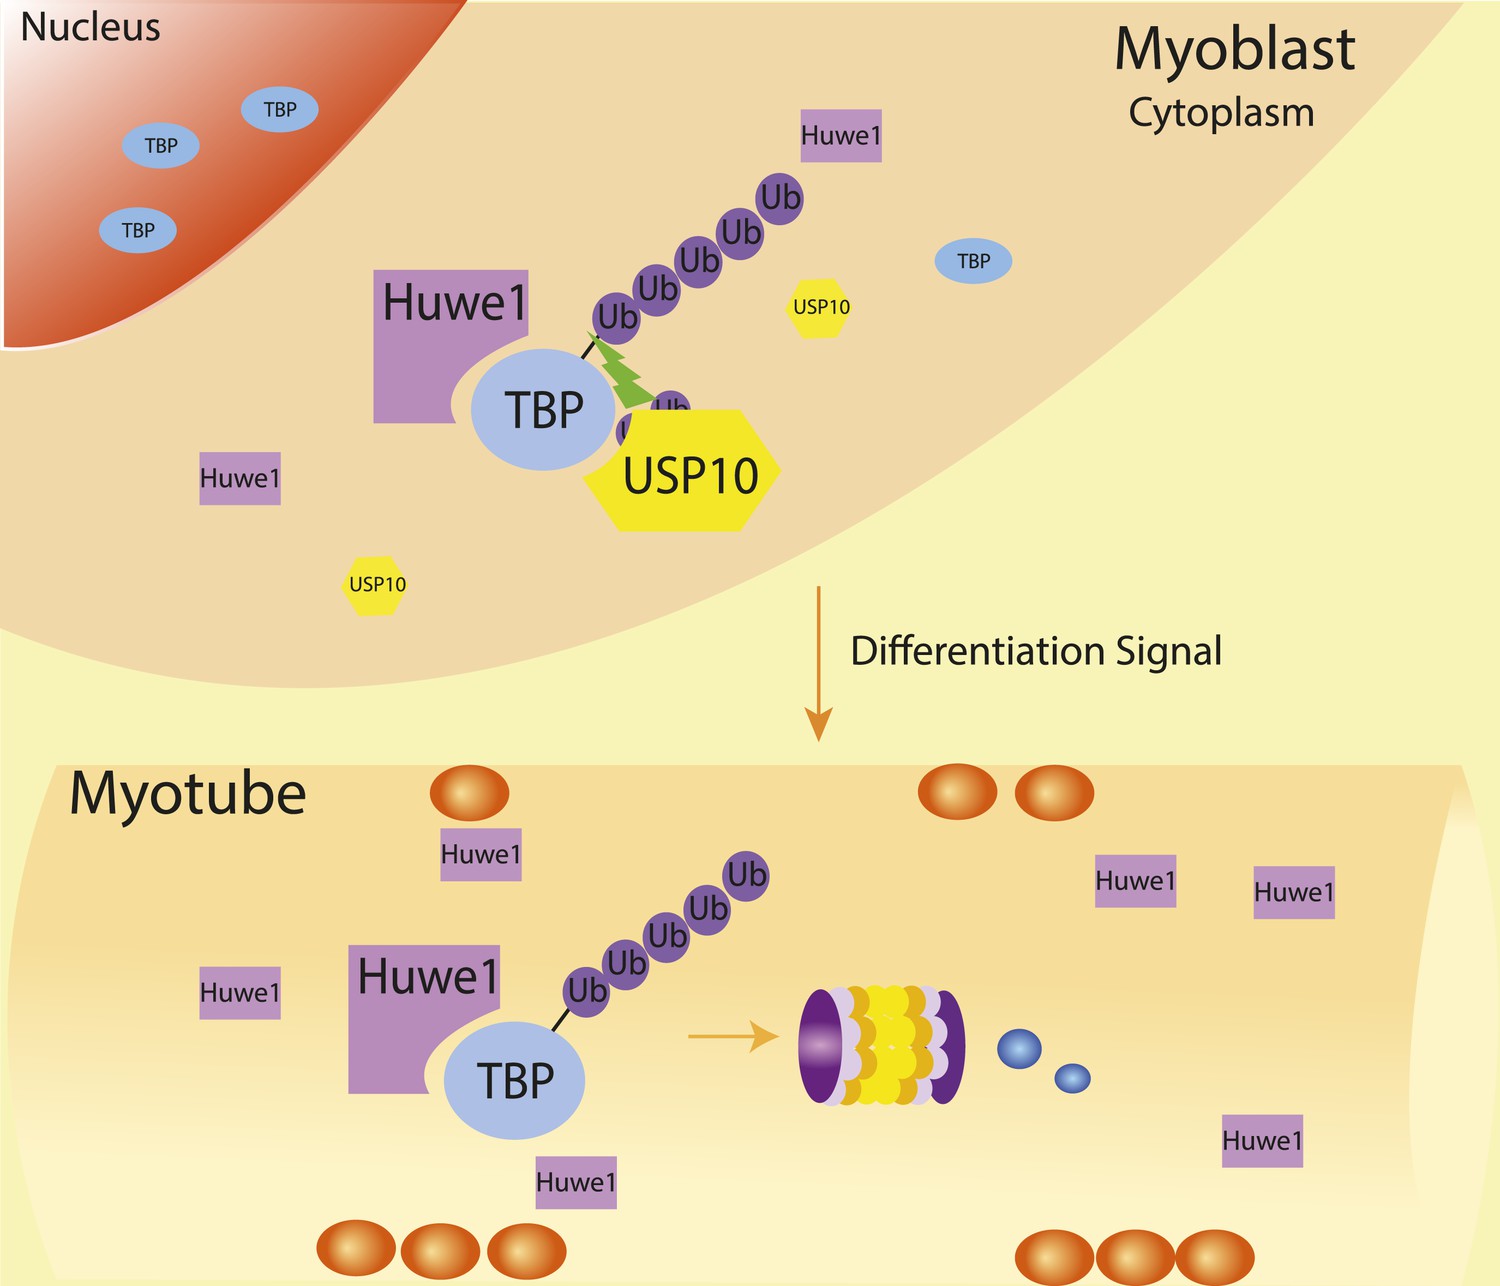
Schematic representation of coordinated regulation of TBP protein level in proliferating and differentiated cells by E3 ligase Huwe1 and deubiquitinase USP10.
Both Huwe1 E3 ligase and USP10 deubiquitinase are present in proliferating myoblasts to maintain steady state TBP protein levels. Upon stimulation by differentiation signals, Huwe1 protein levels increase while USP10 protein levels decrease, resulting in increased TBP ubiquitination and degradation by the proteasome.
Download links
A two-part list of links to download the article, or parts of the article, in various formats.
Downloads (link to download the article as PDF)
Open citations (links to open the citations from this article in various online reference manager services)
Cite this article (links to download the citations from this article in formats compatible with various reference manager tools)
A specific E3 ligase/deubiquitinase pair modulates TBP protein levels during muscle differentiation
eLife 4:e08536.
https://doi.org/10.7554/eLife.08536


