Imaging and energetics of single SSB-ssDNA molecules reveal intramolecular condensation and insight into RecOR function
- University of California, Davis, United States
- Graduate Group in Biophysics, United States
Figures
Figure 1 with 1 supplement
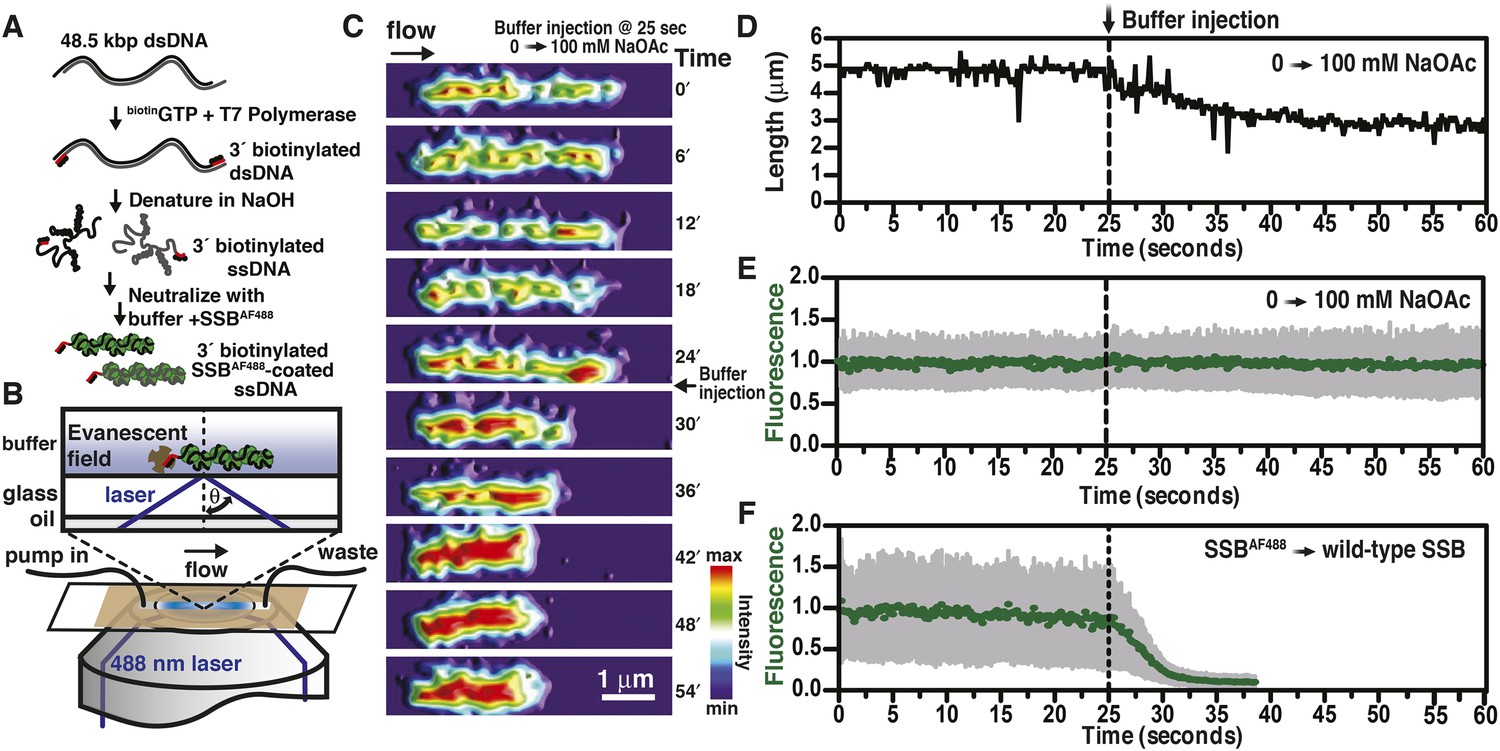
Visualization of salt-induced intramolecular condensation of single molecules of SSBAF488-ssDNA complexes.
(A) Bacteriophage λ dsDNA (48.5 kbp) was biotinylated, denatured, coated with SSBAF488, and then (B) attached to a streptavidin-coated glass coverslip of a microfluidic chamber where it was extended by buffer flow for direct imaging using total internal reflection fluorescence (TIRF) microscopy. (C) A montage of frames from a video recording the change in length of a single molecule of SSBAF488-coated single-stranded DNA (ssDNA) upon increasing [NaOAc] from 0 to 100 mM. The frames were rendered into a topographical intensity map. Time zero corresponds to the time at which the pump was turned on. The dead time of the experiment was ∼25 s due to the liquid volume in the lines between the syringe valve and the microfluidic chamber. (D) The length of the molecule in panel C during the change in salt from 0 mM to 100 mM NaOAc was measured for each frame and is plotted as a function of time. The dotted line represents the injection of the buffer into the microfluidic flow chamber. (E) The fluorescence intensity of the molecule in panel C was also measured for each frame and is plotted as a function of time. (F) The fluorescence intensity of a single molecule of SSBAF488-coated ssDNA is plotted as function of time during a similar experiment where SSBAF488 was exchanged for wild-type, unlabeled SSB. The decrease in fluorescence intensity corresponds to the displacement by wild-type SSB, which has higher affinity for ssDNA than SSBAF488. The fluorescence intensity (green circles) was determined by the mean pixel intensity of region of interest (ROI), and the gray error bars are the standard deviation of the pixels within the ROI.
Figure 1—figure supplement 1
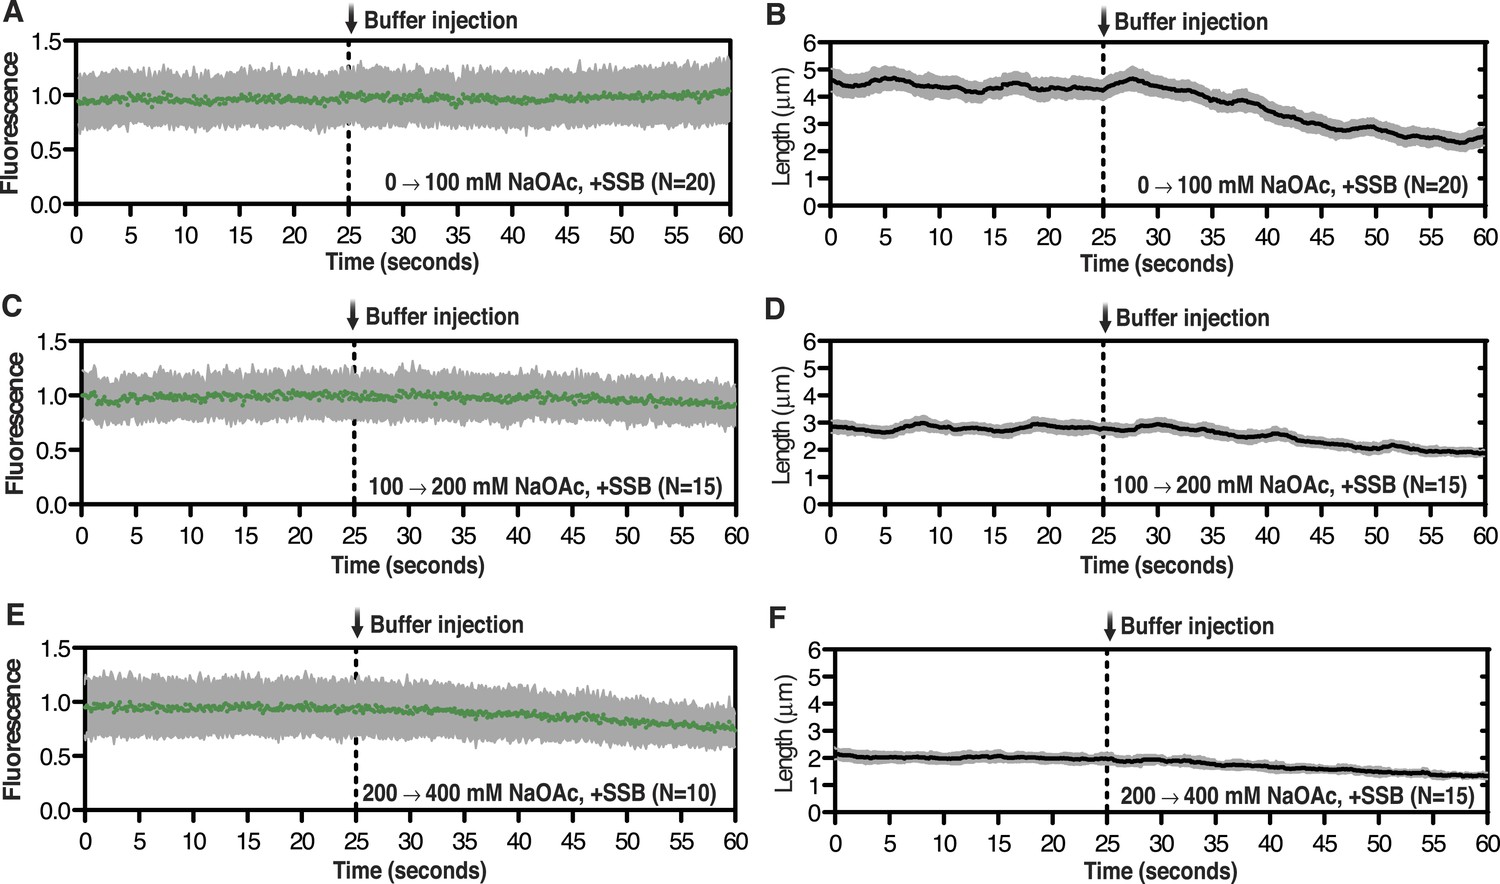
Intensity and length measurements during salt-induced intramolecular condensation.
Representative plots showing the change in intensity (leftmost panels) or length (rightmost panels) of SSBAF488-coated ssDNA molecules for the condition where [NaOAc] was increased from (A, B) 0 to 100 mM, (C, D) 100 to 200 mM, and (E, F) from 200 to 400 mM. Then number of molecules analyzed for each trace is designated in the bottom right corner. Error bars represent standard deviation between molecules.
Figure 2 with 1 supplement
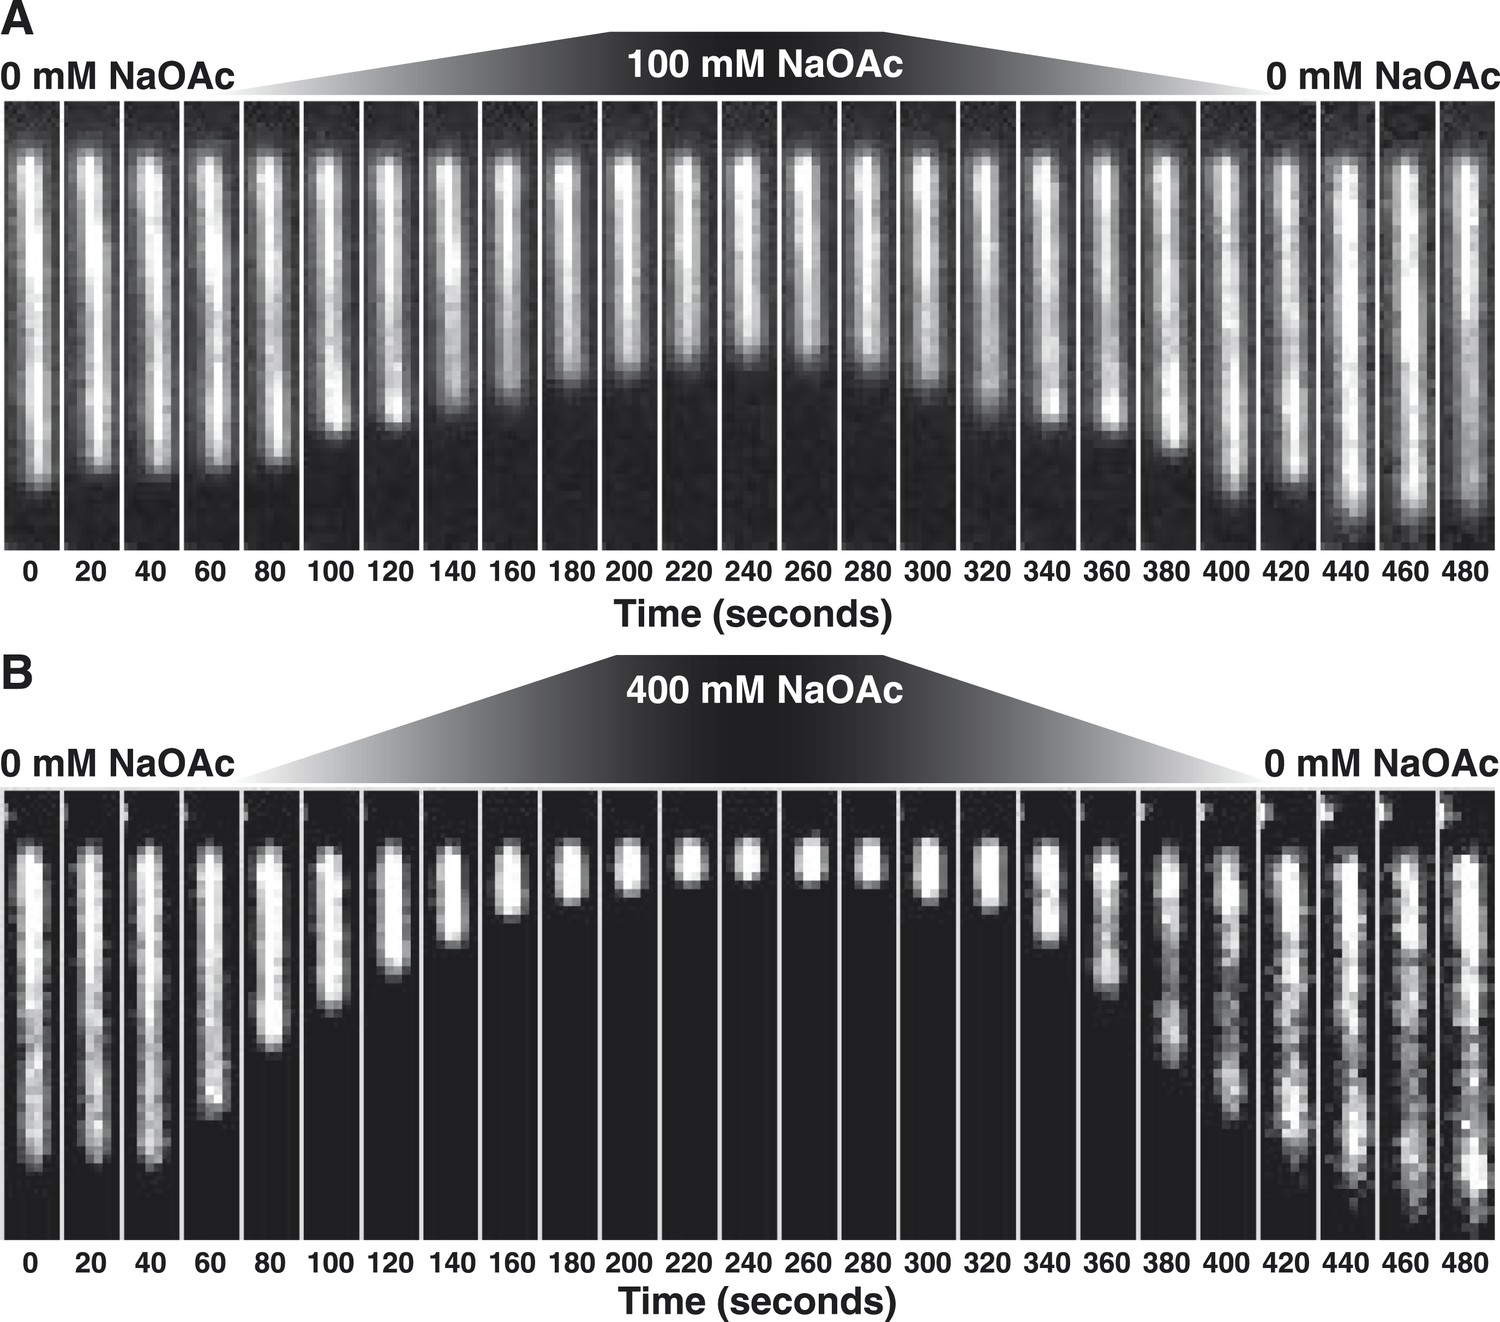
The length change upon salt-induced condensation of SSBAF488-coated ssDNA is nearly reversible in the absence of free SSB protein.
(A) A montage of frames from a video recording of a single molecule of SSBAF488-coated ssDNA contracting in length as the salt concentration is increased from 0 to 100 mM NaOAc, and then subsequently reduced back to zero, conducted in the absence of free SSBAF488. The flow cell was extensively washed with buffer to remove free SSB protein from the flow cell before beginning the experiment. Video recording began when the pump was turned on, requiring ∼40-50 s for the dead volume to be flushed from the lines to the flow chamber. (B) Same as in (A), except the salt concentration was increased from 0 mM NaOAc to 400 mM NaOAc and then back to zero. Each frame of the montages is one micron wide. SSBAF488 was omitted from both of the high salt washes and from the 0 mM wash. Flow is from top to bottom in each image.
Figure 2—figure supplement 1
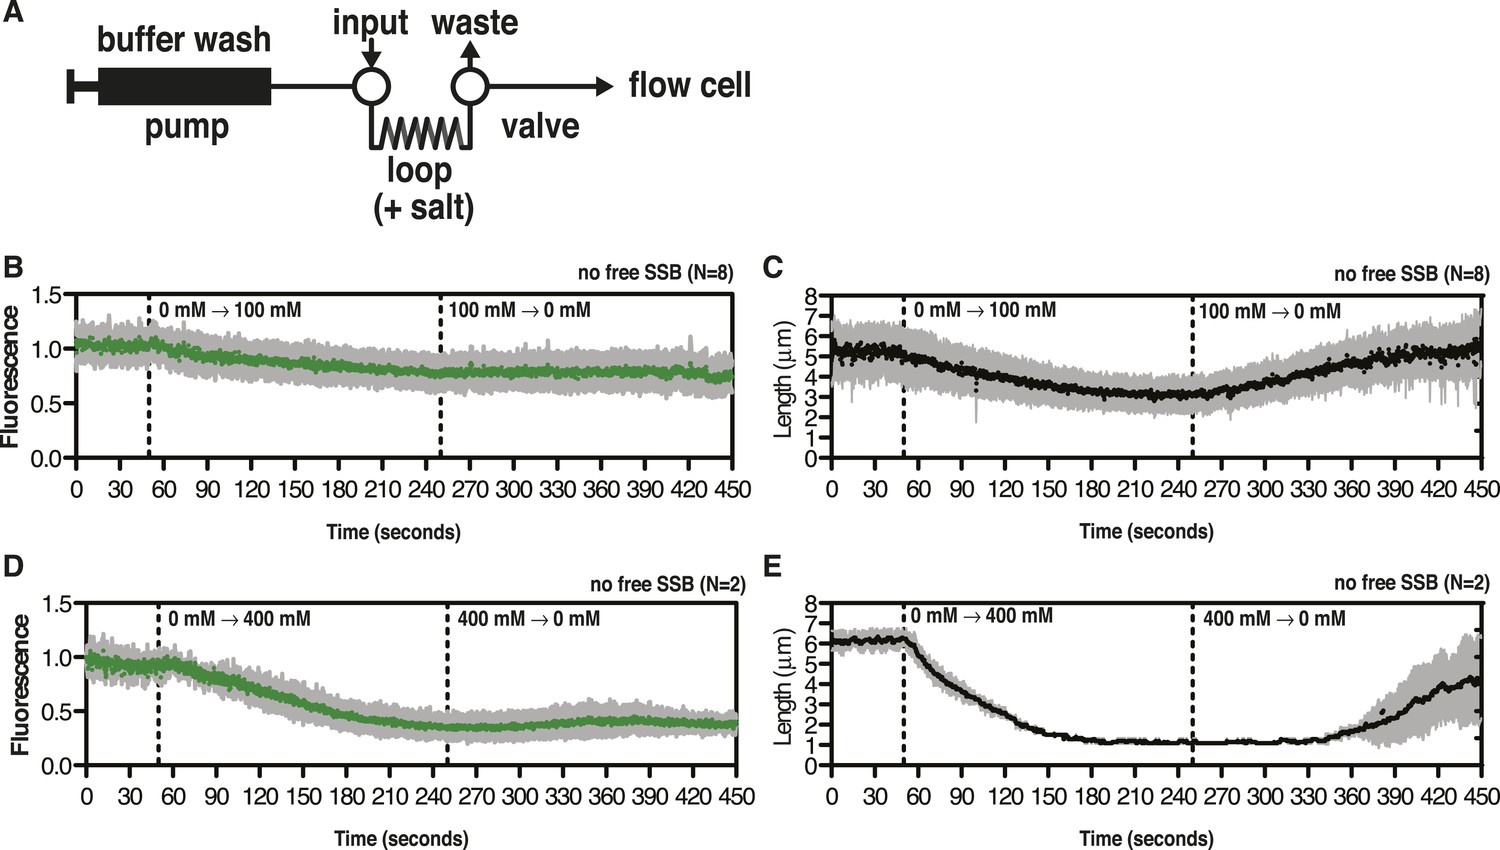
SSBAF488 partially dissociates from ssDNA during salt transitions in the absence of free protein.
(A) Schematic showing the injection system used to transiently increase the salt concentration. (B–E) Representative plots showing the change in intensity (leftmost panels) or length (rightmost panels) of SSBAF488-coated ssDNA molecules from the experiments presented in Figure 2. (B, C) for Figure 2A (top panel, 0 to 100 mM–0 mM NaOAc) and (D, E) for Figure 2B (bottom panel, 0 mM–400 mM to 0 mM NaOAc), where the salt concentration was transiently increased during continuous flow in the absence of free SSBAF488 followed by washing molecules with no salt buffer. Dashed lines indicate the time at which the high salt and low salt buffers reached the flow chamber. SSBAF488 was omitted from both of the high salt washes and from the 0 mM wash.
Figure 3 with 6 supplements
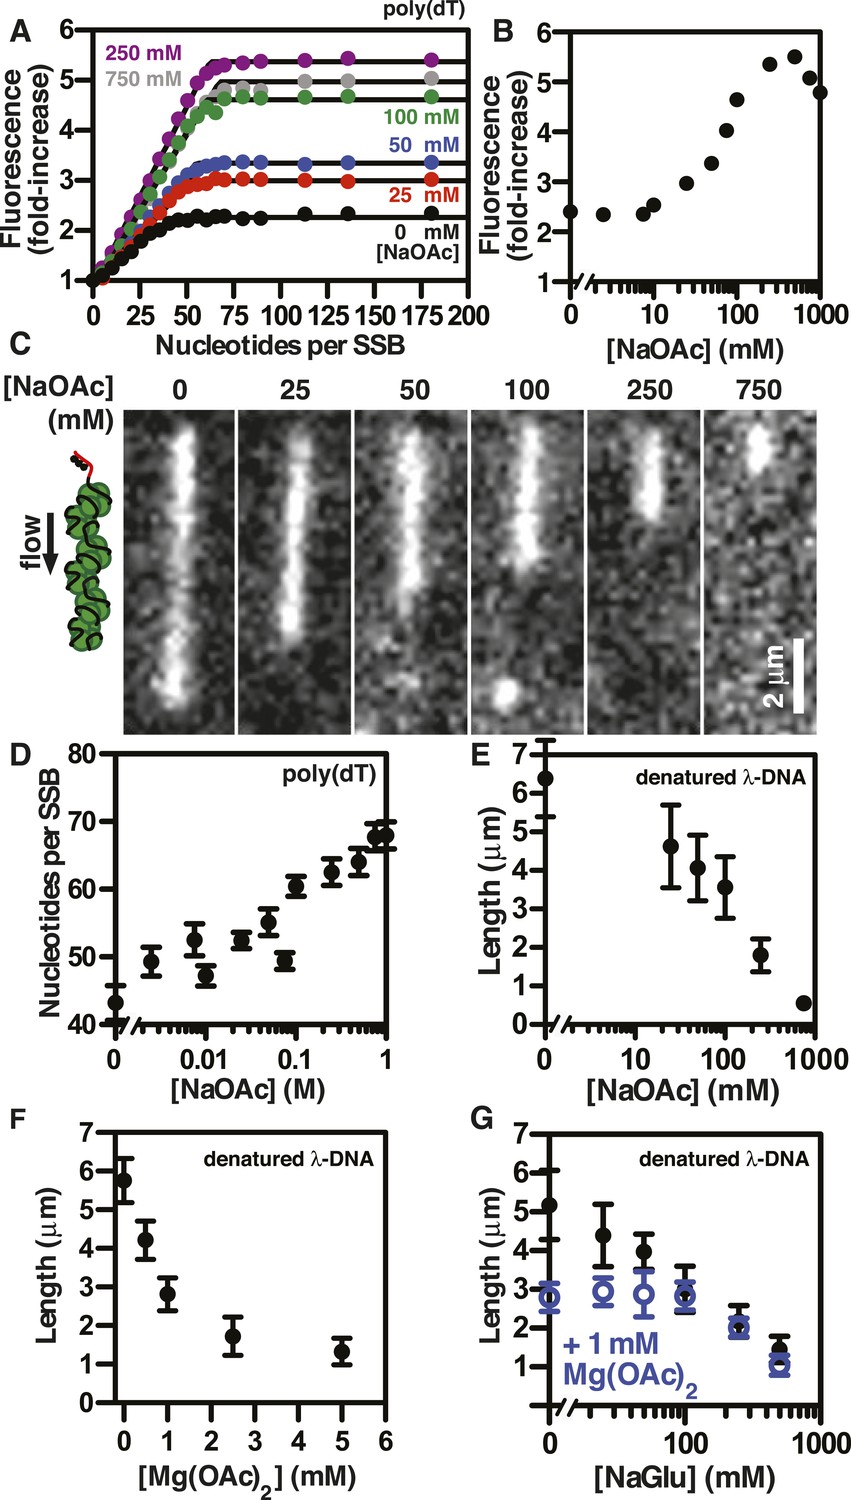
The extent of SSB-ssDNA condensation is greater than anticipated based on known ssDNA-wrapping transitions.
(A) Poly(dT) was titrated into 100 nM SSBf (tetramer) and the average fluorescence enhancement of SSBf from three titrations was plotted as a function of ratio of poly(dT) to SSB tetramer. The data were fit to a two-segment line, where the breakpoint is the stoichiometric endpoint of the titration corresponding to the site size of SSBf. (B) The amplitude of the fluorescence enhancement from the titrations performed in Figure 3A was plotted as a function of [NaOAc]. The error is smaller than the symbols. A larger number of titrations are shown here than in panel A to prevent panel A from being overcrowded; each fold-increase was determined by a full stoichiometric titration where each titration was completely and fully saturated. (C) Representative images of single molecules of SSBf-coated ssDNA at increasing [NaOAc] indicated. (D) The apparent binding site size (black circles, ± error of the fits from panel A determined from the titrations performed in panel A were plotted as a function of salt concentration. (E) Length of SSBf-coated ssDNA molecules plotted as a function [NaOAc] (N = 213). (F) Length of SSBf-coated ssDNA plotted as a function of [Mg(OAc)2] (N = 156) and (G) as a function of [NaGlu] in the absence (black, closed circles, N = 205) and presence (blue, open circles, N = 214) of 1 mM Mg(OAc)2. Unless otherwise indicated, all error bars represent standard deviation and when not visible were smaller than the symbols.
Figure 3—figure supplement 1

Salt back-titrations to determine the concentration at which SSBf dissociates from ssDNA.
Plot of the fluorescence enhancement of pre-formed SSBf-poly(dT) complexes as a function of NaOAc concentration, normalized relative to the fluorescence of SSBf in the absence of ssDNA. NaOAc was titrated in the absence (black circles) or presence (blue circles) of 5 mM Mg(OAc)2. The concentration of SSBf and poly(dT) were constant during the titration.
Figure 3—figure supplement 2
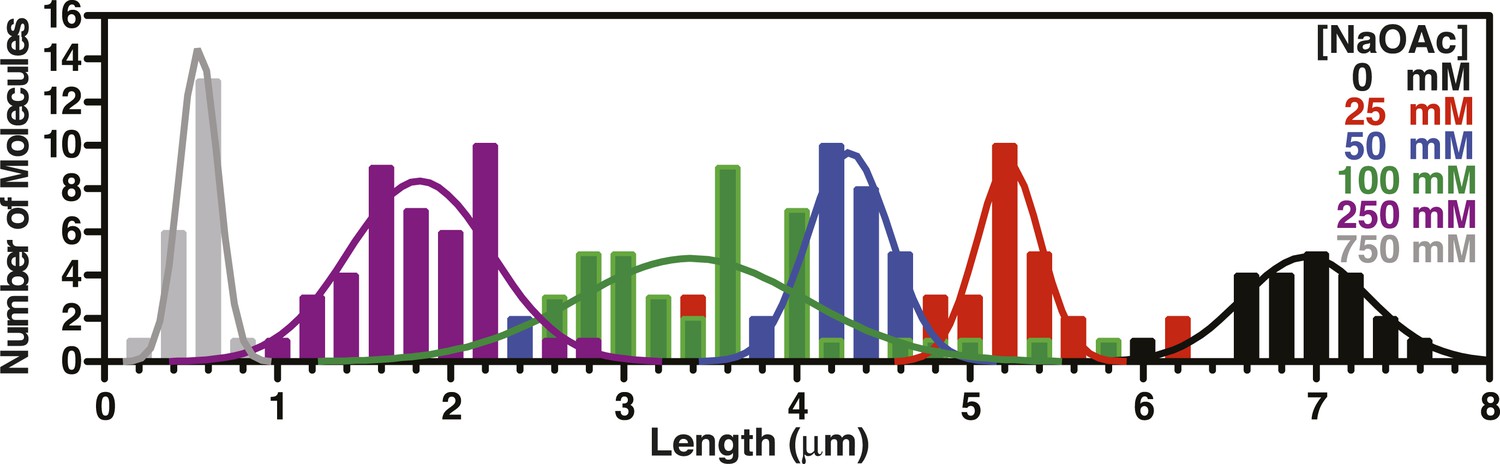
Length distributions of single molecules of SSBf-coated ssDNA as a function of [NaOAc].
Distribution of lengths of SSBf-coated ssDNA at increasing concentrations of NaOAc (N = 216). The data were fit to a Gaussian distribution, and the mean and standard deviation from the fits were plotted in Figure 3E (NaOAc).
Figure 3—figure supplement 3
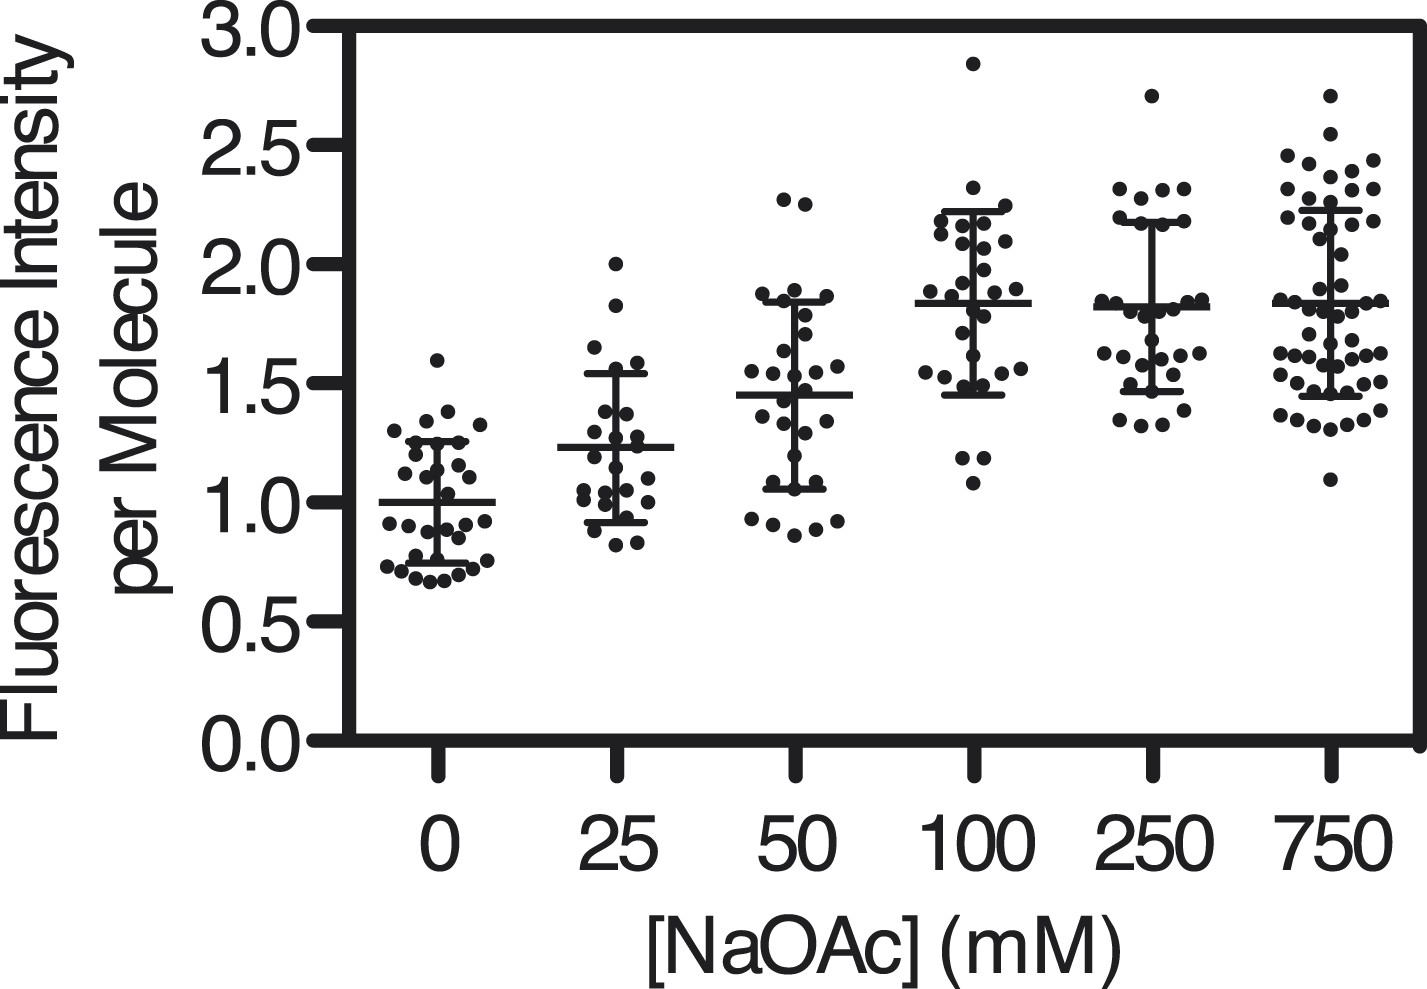
Intensity of SSBf-ssDNA molecules as a function of [NaOAc].
Scatter-plot showing the intensity of individual SSBf-ssDNA complexes imaged at each concentration of NaOAc. The intensity of each molecule was normalized to the average intensity of the molecules at 0 mM NaOAc (N = 200, ±s.d.).
Figure 3—figure supplement 4
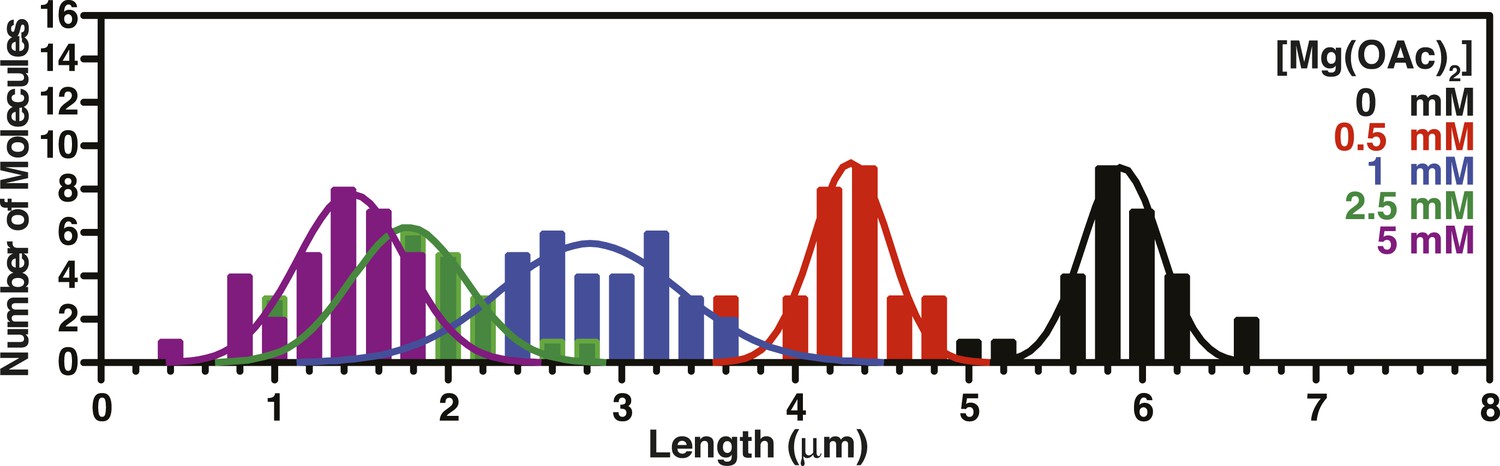
Length distributions of single molecules of SSBf--coated ssDNA as a function of [Mg(OAc)2].
Distribution of lengths of SSBf-coated ssDNA at increasing concentrations of Mg(OAc)2 (N = 156). The data were fit to a Gaussian distribution and the mean and standard deviation from the fits were plotted in Figure 3F.
Figure 3—figure supplement 5
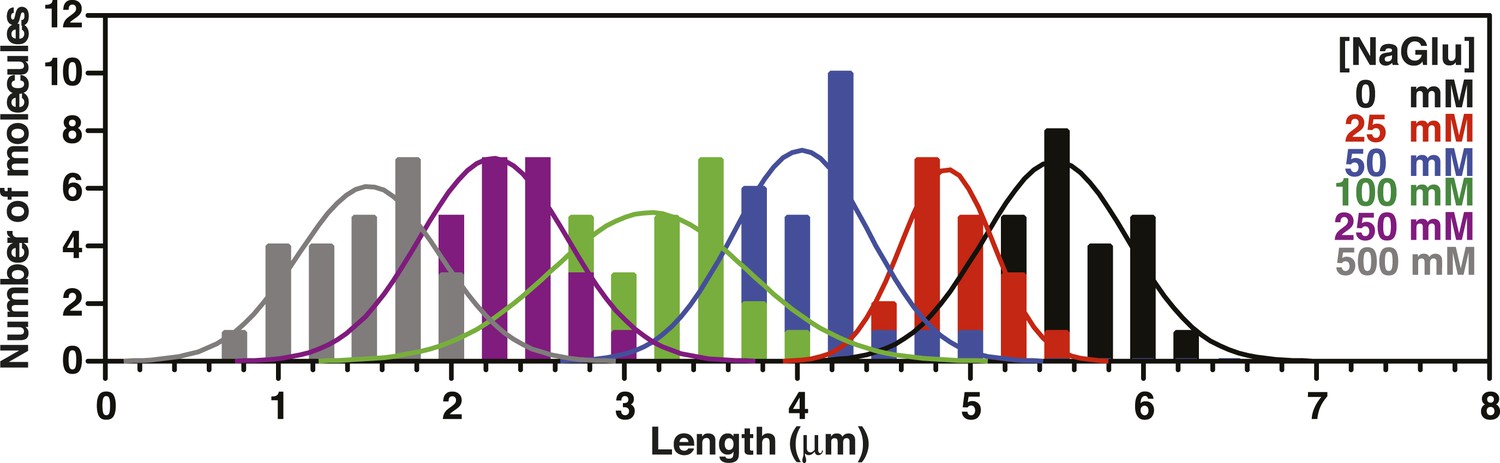
Length distributions of single molecules of SSBf-coated ssDNA as a function of [NaGlu].
Distribution of lengths of SSBf-coated ssDNA at increasing concentrations of NaGlu (N = 205). The data were fit to a Gaussian distribution, and the mean and standard deviation from the fits were plotted in Figure 3G (black circles).
Figure 3—figure supplement 6
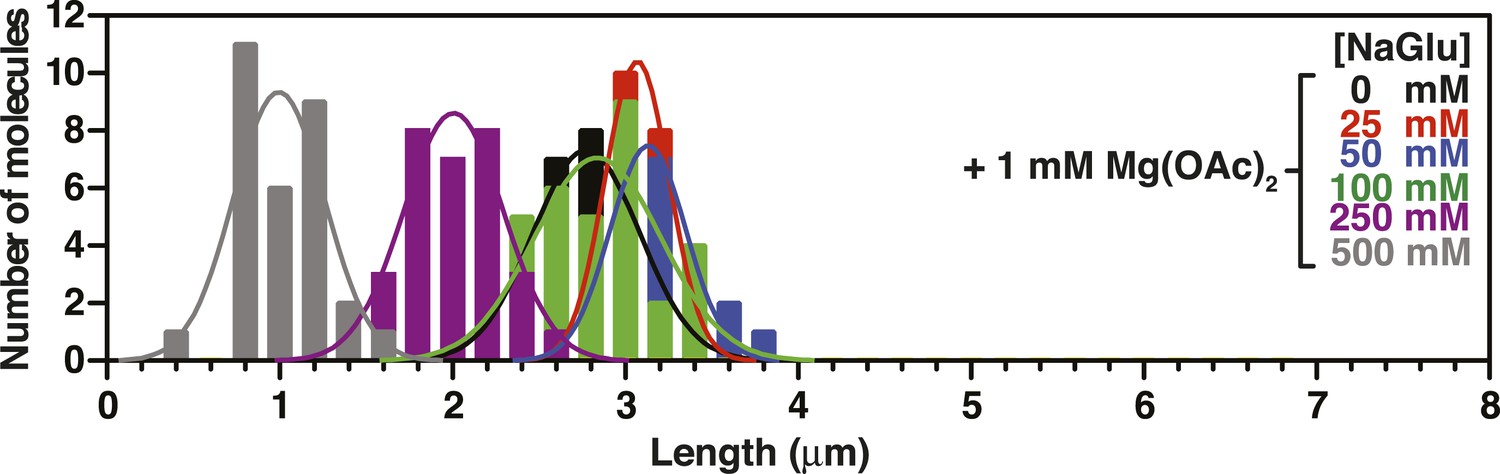
Length distributions of single molecules of SSBf-coated ssDNA as a function of [NaGlu] in the presence of 1 mM Mg(OAc)2.
Distribution of lengths of SSBf-coated ssDNA at increasing concentrations of NaGlu in the presence of 1 mM Mg(OAc)2 (N = 214). The data were fit to a Gaussian distribution, and the mean and standard deviation from the fits were plotted in Figure 3G (blue, open circles).
Figure 4 with 1 supplement
The binding of SSB eliminates hysteresis from the force-extension behavior of ssDNA measured by single-molecule magnetic tweezer force spectroscopy
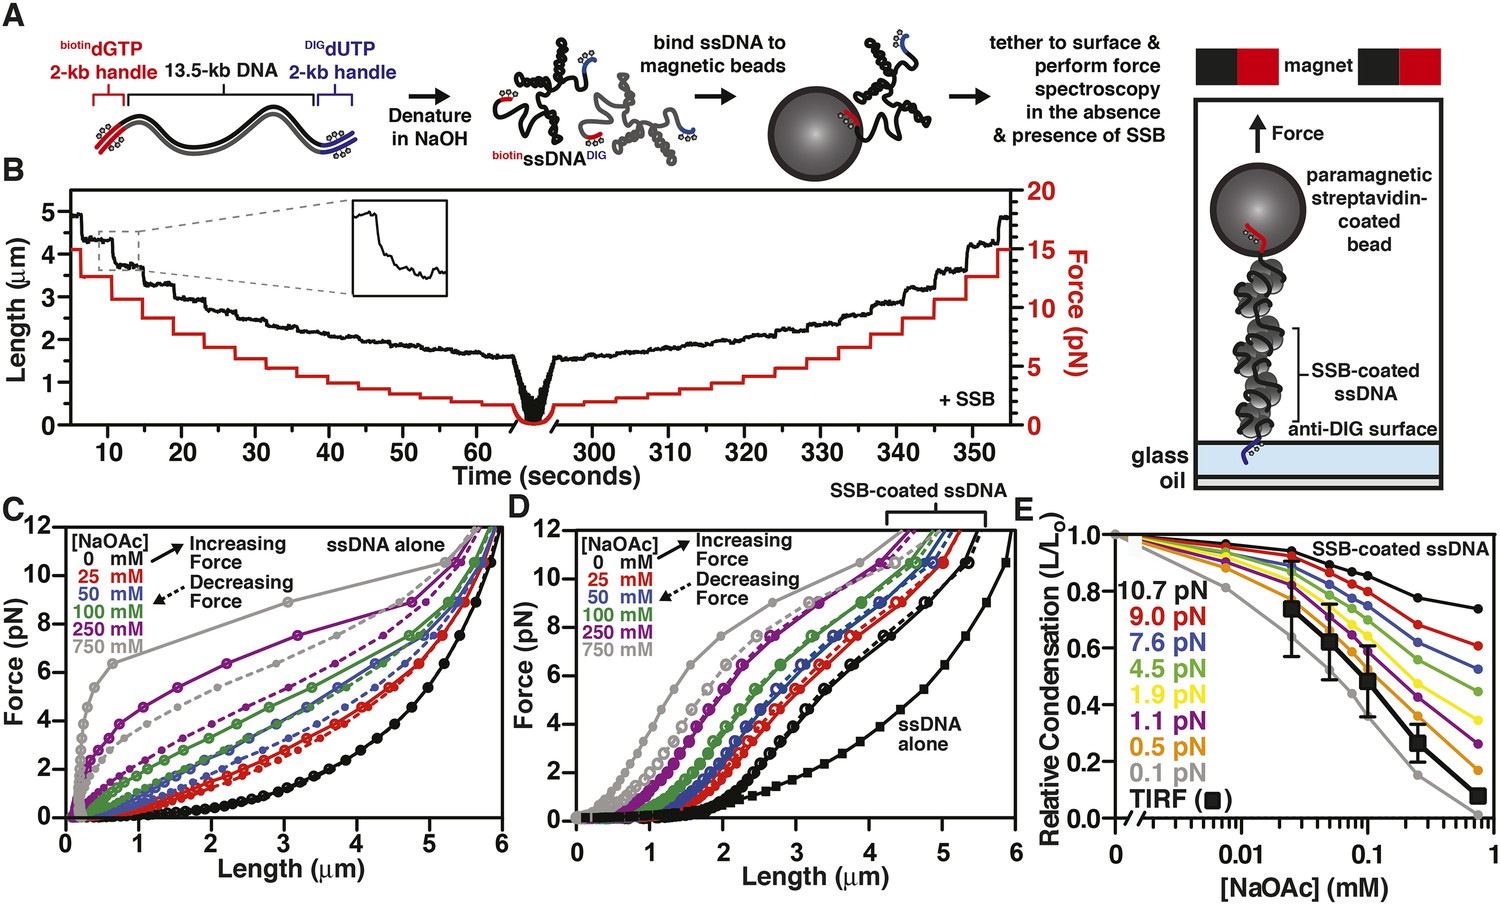
(A) A DNA substrate was made by ligating biotin- and DIG-containing ‘handles’ (i.e. ∼2-kb products from PCR containing biotin-dGTP or DIG-dUTP) to the flanking ends of a 13.5-kb DNA substrate. The ligated product was then alkali denatured, attached to magnetic streptavidin-coated beads, and then tethered to a glass surface coated with anti-DIG antibodies within a flow chamber. When present, SSB was added to the flow chamber and bound to the ssDNA in situ. (B) A typical time trace of a single molecule of SSB-coated ssDNA during a force-extension experiment. The length was determined at each force applied after the molecule had reached equilibrium (inset). (C) The force-extension and relaxation relationship of a single ssDNA molecule is shown in the absence of SSB at increasing concentrations of NaOAc. The plot shows length measurements made while both decreasing (dashed lines) and increasing force (solid). (D) The force-extension relationship of ssDNA in the presence of 200 nM SSB at increasing concentrations of NaOAc. (E) The relative condensation (L/L0, where L0 is the length of SSB-coated ssDNA in the absence of salt) of the molecules measured in panel D were plotted as a function of salt concentration for each applied force and compared to the relative condensation of molecules measured in direct visualization (TIRF) experiments from Figure 3C,E.
Figure 4—figure supplement 1
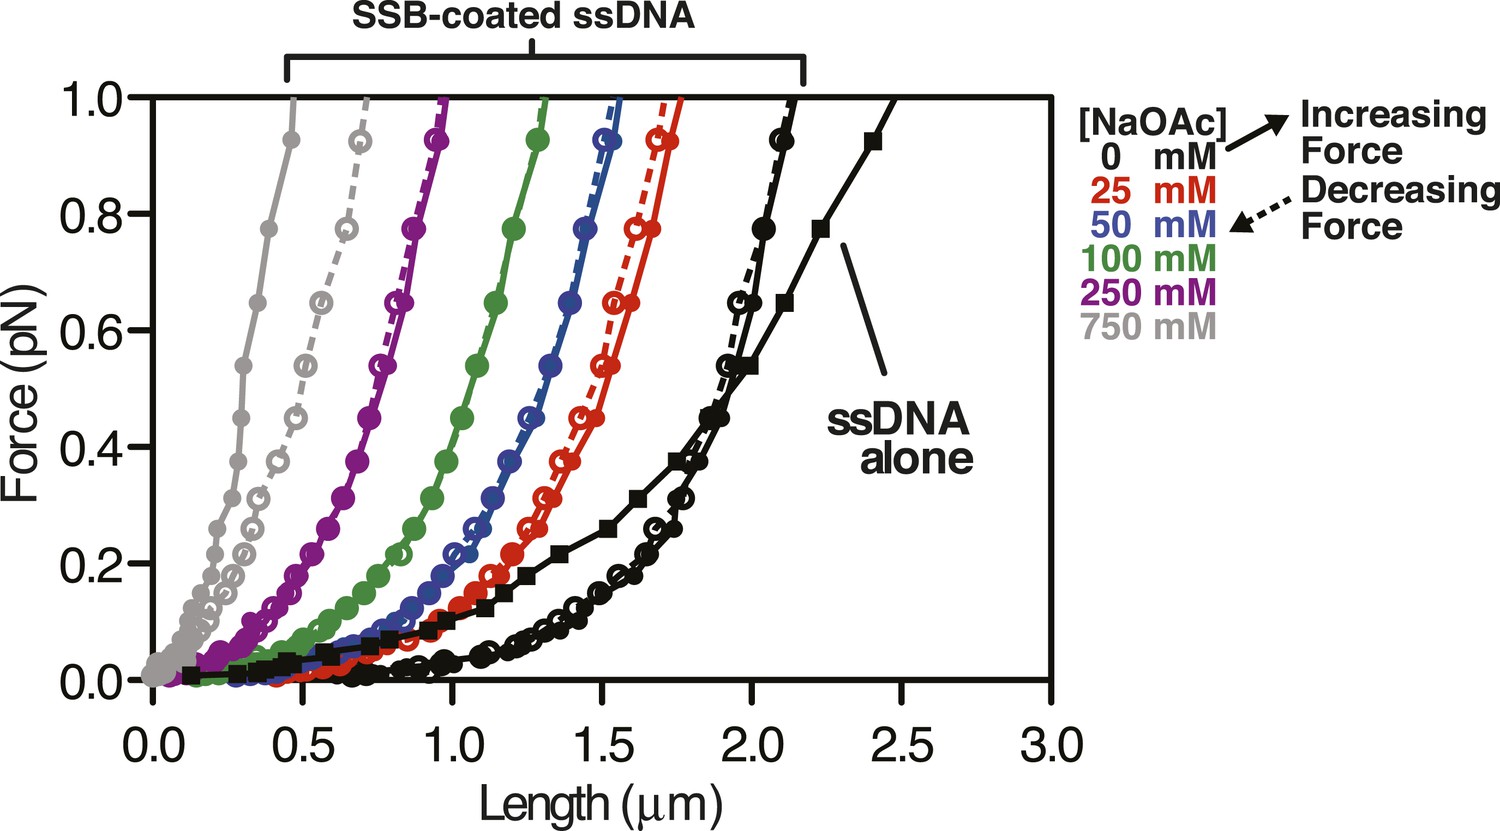
Force extension curve of SSB-coated ssDNA at low force.
Data from Figure 4B,C,D re-scaled and plotted from 0 to 1 pN on the y-axis. Black squares are ssDNA alone in 0 mM NaOAc. Circles represented measurements made with SSB-coated ssDNA at the concentration of NaOAc indicated by the color used in the legend. Solid connecting lines represent increasing force; dashed lines represent decreasing force.
Figure 5 with 2 supplements
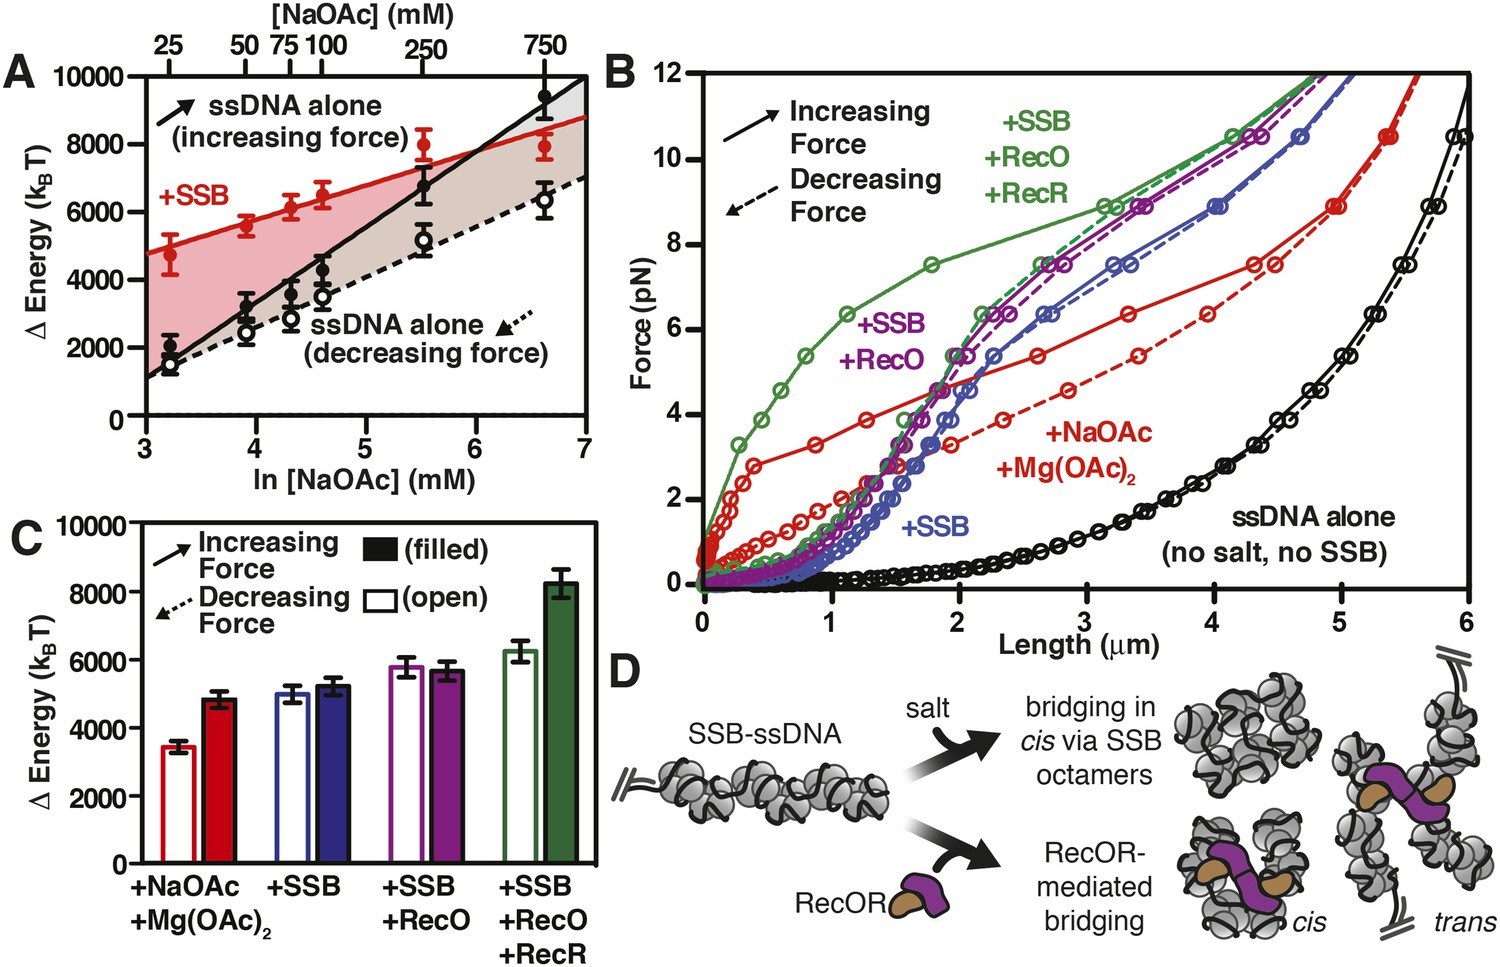
RecO and RecOR alter SSB-ssDNA wrapping to induce nucleoprotein fiber condensation
(A) The work (i.e. ΔE) stored in the ssDNA or SSB-coated ssDNA molecules was determined from the area under the curves from the data in Figure 4C,D, as shown in Figures 5—figure supplements 1, 2, and plotted as a function of the natural logarithm (bottom x-axis) of NaOAc concentration (top x-axis) for ssDNA (black-filled circles, increasing force; black open circles, decreasing force) and for SSB-coated ssDNA (red filled circles). The lines are linear fits where the slope, δkBT/δln[NaOAc], is 1000 (±200) for SSB (red line), 1500 (±200) for ssDNA when decreasing force (black dashed line), and 2200 (±150) for ssDNA when increasing force (black solid line). (B) The force–extension relationship of a single molecule of ssDNA was measured in the absence of salt (black), then again after sequentially adding each of the following: 100 mM NaOAc and 1 mM Mg(OAc)2 (red), 200 nM SSB (blue), 100 nM RecO (purple), and 1 μM RecR (green). The extension in the presence of RecO results in approximately a 10% condensation at each force measured. In the presence of both RecO and RecR, significant hysteresis is observed (compare solid and dashed green lines). (C) The change in energy was determined by integrating the area under the curves in panel B relative to the ssDNA alone curve (black), and are plotted for both increasing (filled bars) and decreasing force (open bars). (D) A cartoon depicting our model for salt-induced intramolecular bridging mediated in cis by oligomers of SSB (either tetramers or octamers). RecOR may mediate bridging either in cis, along the same molecule of SSB-coated ssDNA, or in trans to promote annealing of complementary ssDNA.
Figure 5—figure supplement 1
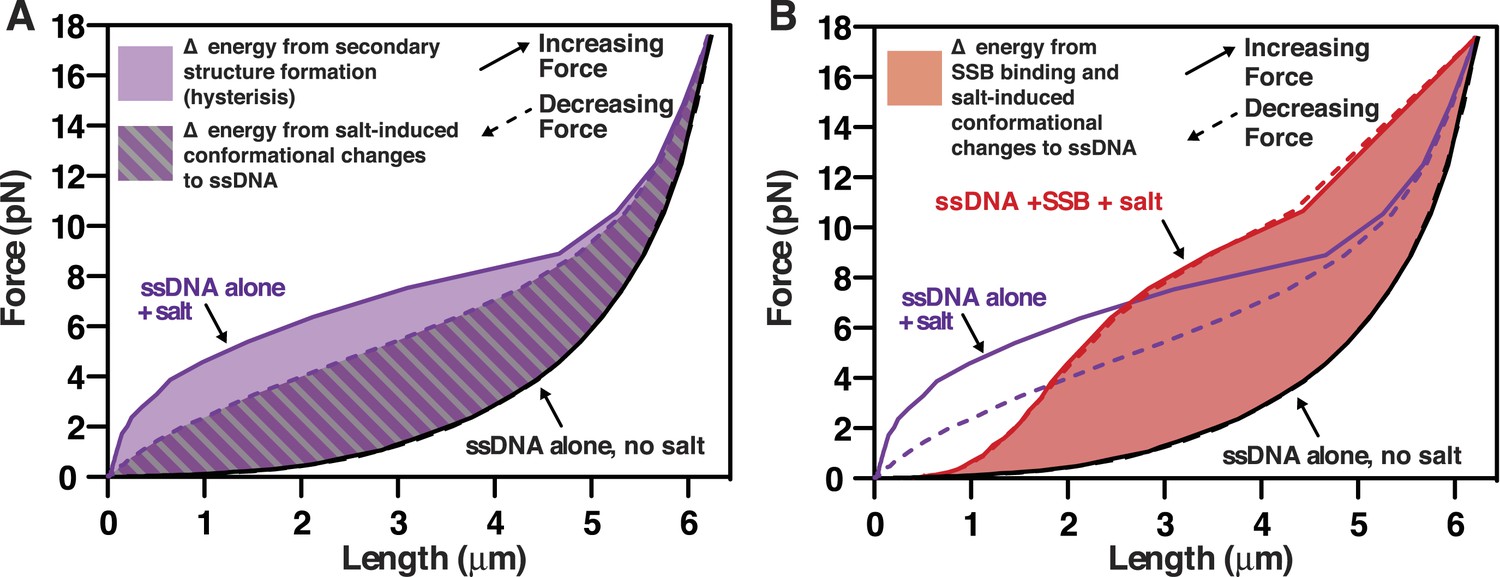
Diagram of the area under the force-extension curves used to calculate the changes in energy in the absence and presence of SSB.
(A) The work (i.e. energy) stored in the ssDNA was determined from the area under the curves from Figures 4C,D (250 mM NaOAc is used here as the example) and plotted relative to ssDNA alone in the absence of salt (black lines, solid and dashed, nearly superimposable). The light purple area between the curves generated by pulling (purple solid line) and relaxing (purple dashed line) was interpreted to be the energy from intramolecular secondary structure formation, which is nil in the absence of salt (black lines). The purple and gray striped area between the curve generated by relaxing ssDNA in the presence of salt (purple dashed line, purple text) and either of the curves generated by pulling or relaxing ssDNA without salt (black curves) was interpreted as resulting from the salt-induced changes in the conformational state of the ssDNA polyelectrolyte. (B) The area between the curve obtained in the presence of SSB and 250 mM NaOAc (red lines and text) and the curve obtained for ssDNA alone in the absence of salt (black lines and text) was used to calculate the change in energy due to SSB-binding to ssDNA plus the salt-induced change to the ssDNA. The curves from panel A (ssDNA alone at 250 mM NaOAc) are shown in purple for comparison to the SSB.
Figure 5—figure supplement 2
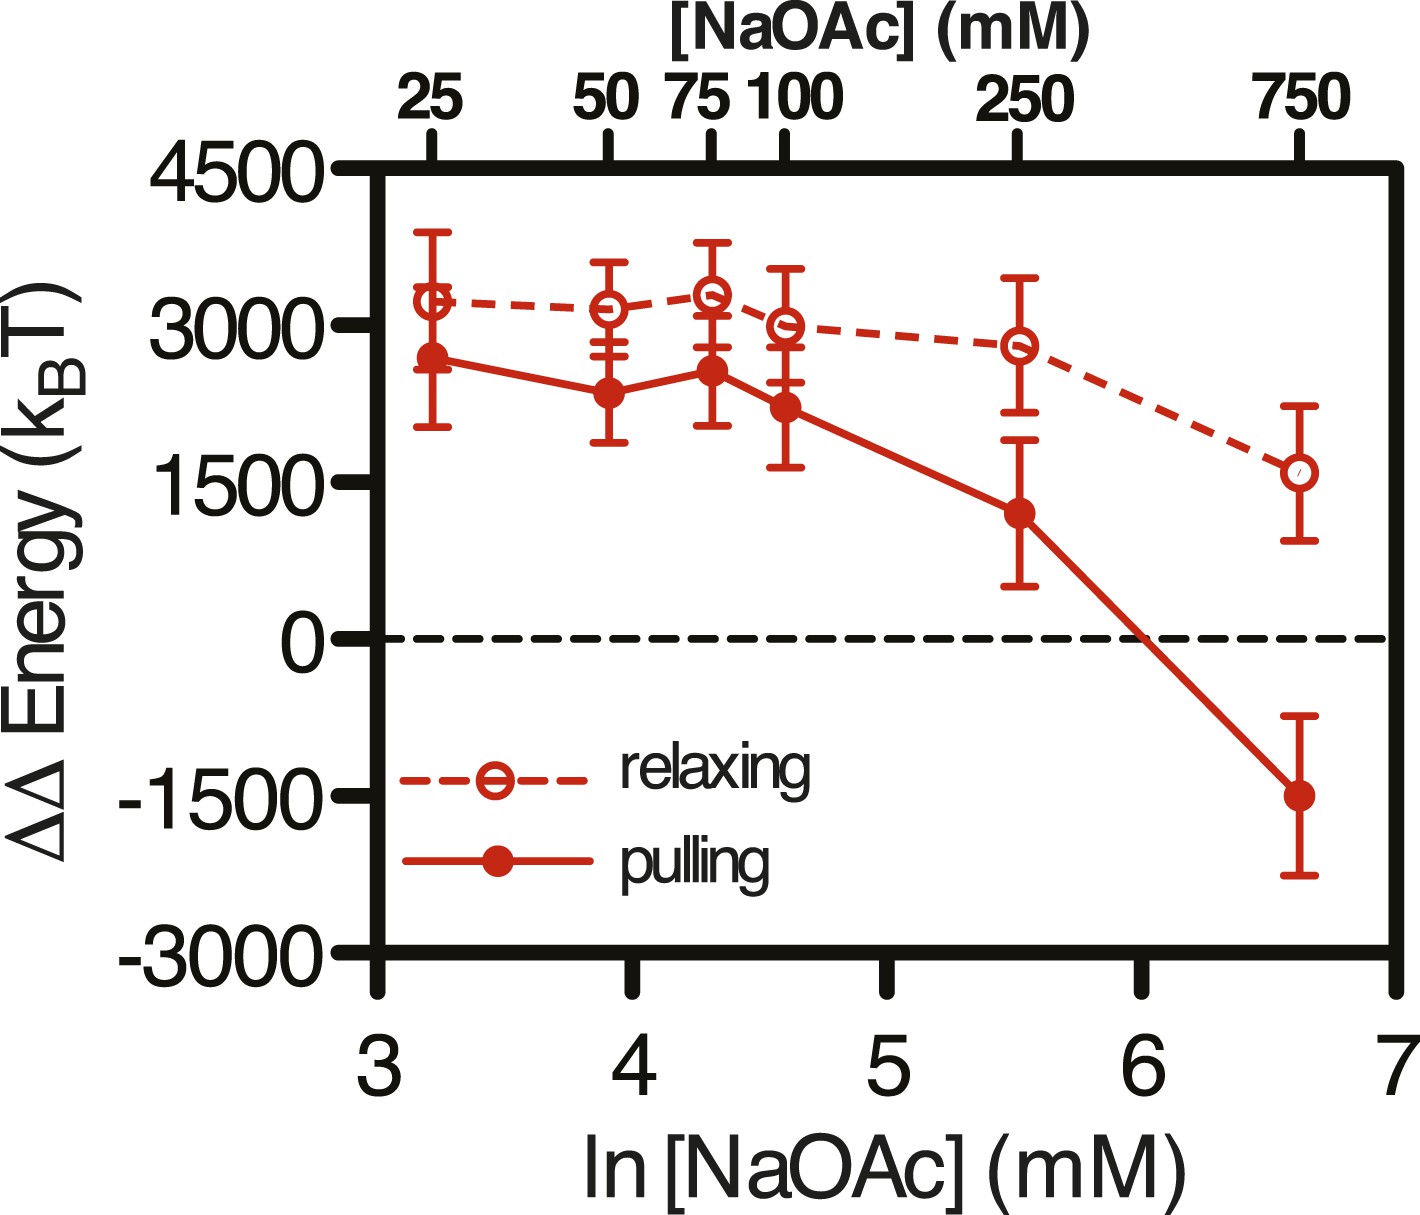
Difference in the change in energy contributed from SSB binding at increasing salt concentrations.
The difference in the work (i.e. ΔΔE) stored in the SSB-coated ssDNA molecule, determined by subtracting the ΔE measured for relaxing ssDNA (open red circles, dashed line) and pulling ssDNA (closed red circles, solid line) from the ΔE measured for SSB-coated ssDNA at increasing concentrations of NaOAc.
Author response image 1
Videos
Video 1
Salt-induced intramolecular condensation of SSBAF488-ssDNA.
Video recording of a single molecule of SSBAF488-coated ssDNA, imaged using TIRF microscopy, upon increasing [NaOAc] from 0 to 100 mM. The video frames were rendered into a topological intensity map. Time zero corresponds to the time at which the pump was turned on. The dead time of the experiment was approximately 25 s due to the volume in the lines between the syringe valve and the microfluidic chamber. The molecule in the video corresponds to the molecule presented in Figure 1, panels C–E
Video 2
Condensation of SSBAF488 in the absence of free protein during a transient increase from 0 to 100 mM NaOAc.
Video recording of a single molecule of SSBAF488-coated ssDNA contracting in length as the salt concentration is increased from 0 to 100 mM NaOAc, and then subsequently reduced back to zero mM, conducted in the absence of free SSBAF488. The flow cell was extensively washed with buffer to remove free SSB protein before beginning the experiment. Video recording began when the pump was turned on, requiring ∼40-50 s for the dead volume to be flushed from the lines to the flow chamber. SSBAF488 was omitted from both of the high-salt washes and from the 0 mM wash. The video corresponds to the molecule presented in Figure 2A and Figure 2—figure supplement 1, panels B, C.
Video 3
Condensation of SSBAF488 in the absence of free protein during a transient increase from 0 to 400 mM NaOAc.
Video recording of a single molecule of SSBAF488-coated ssDNA contracting in length as the salt concentration is increased from 0 to 400 mM NaOAc, and then subsequently reduced back to zero mM, conducted in the absence of free SSBAF488. The flow cell was extensively washed with buffer to remove free SSB protein before beginning the experiment. Video recording began when the pump was turned on, requiring ∼40-50 s for the dead volume to be flushed from the lines to the flow chamber. SSBAF488 was omitted from both of the high-salt washes and from the 0 mM wash. The video corresponds to the molecule presented in Figure 2B and Figure 2—figure supplement 1, panels D, E.
Download links
A two-part list of links to download the article, or parts of the article, in various formats.
Downloads (link to download the article as PDF)
Open citations (links to open the citations from this article in various online reference manager services)
Cite this article (links to download the citations from this article in formats compatible with various reference manager tools)
Imaging and energetics of single SSB-ssDNA molecules reveal intramolecular condensation and insight into RecOR function
eLife 4:e08646.
https://doi.org/10.7554/eLife.08646


