Regulation of multispanning membrane protein topology via post-translational annealing
- California Institute of Technology, United States
Figures
Figure 1 with 2 supplements
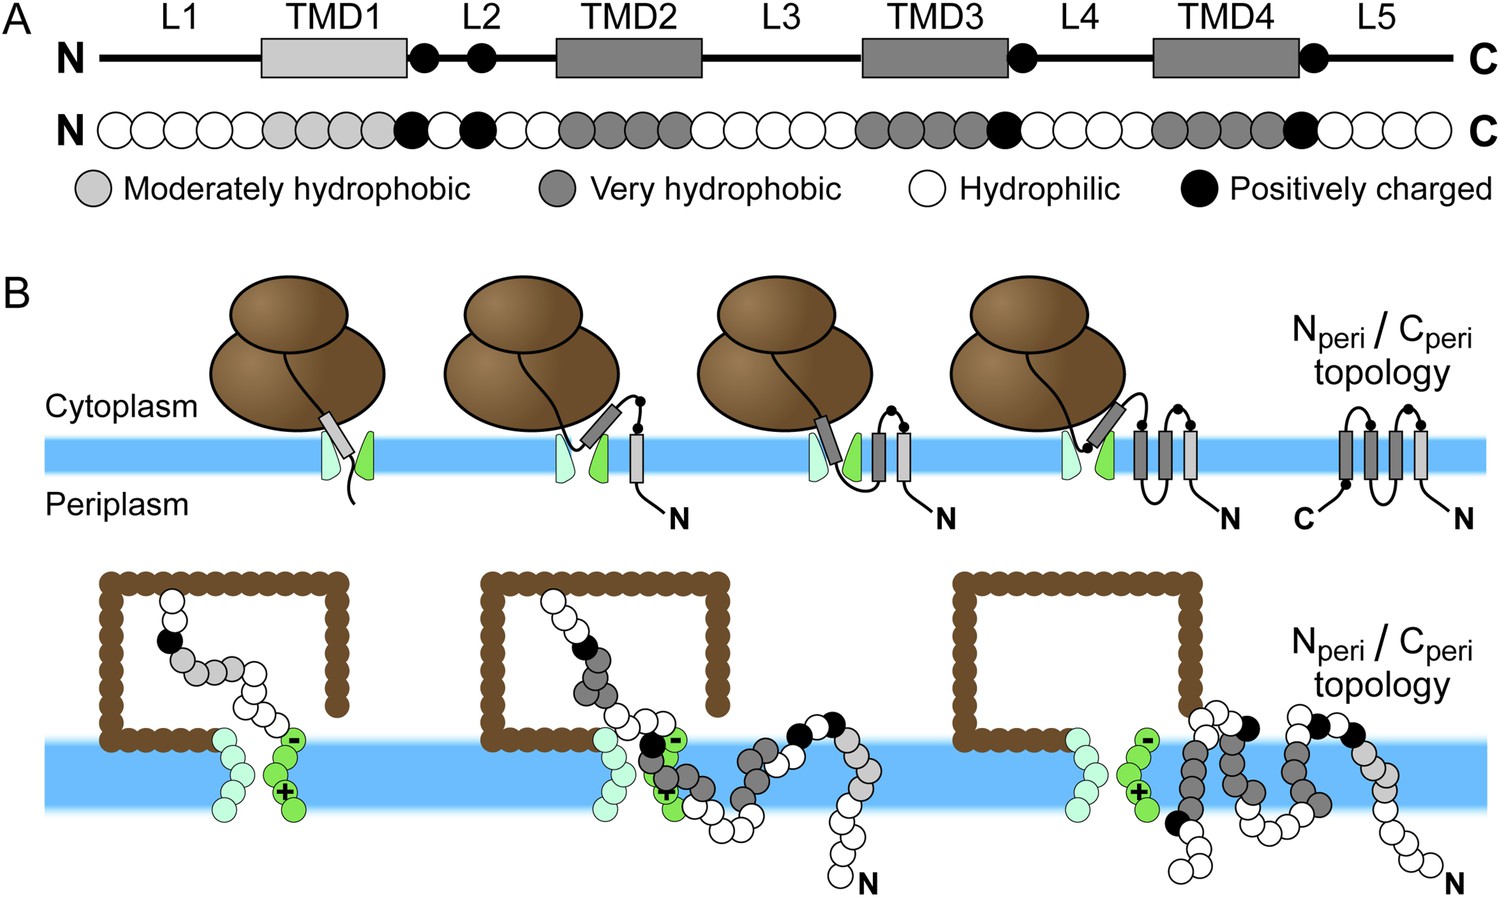
Schematic of Sec-mediated cotranslational integration of EmrE and corresponding simulation representation.
(A) At top, an illustration of the structural motifs in EmrE, including indication of the charged residues in the soluble loops with black circles and the transmembrane domain (TMD)/loop numbering scheme that is employed in the text; below, the corresponding sequence of coarse-grained (CG) beads that represent the EmrE amino-acid sequence. TMDs and loops are assigned based on the hydropathy plot and consensus topology prediction shown in Figure 1—figure supplement 1. (B) At top, a schematic illustration of the sequential integration of TMDs to obtain a multispanning Nperi/Cperi topology, in which both the N- and C-terminal loops are positioned in the periplasm, according to the cotranslational model; below, representative simulation snapshots of EmrE as the nascent protein grows during translation, integrates into the membrane, and exits the channel in the Nperi/Cperi multispanning topology. The nascent protein is colored according to the legend at top, the ribosome is brown, and the translocon is green with translocon charges labeled explicitly.
Figure 1—figure supplement 1
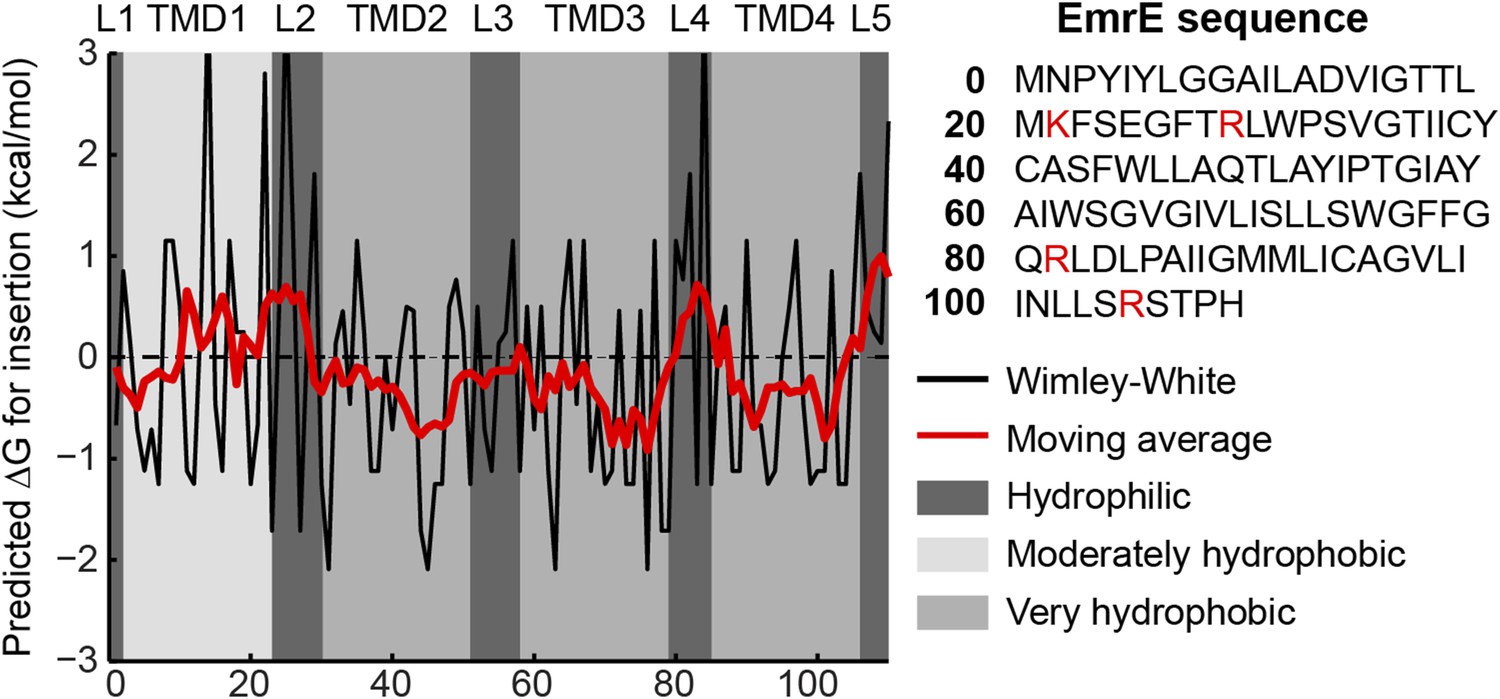
Hydropathy plot for EmrE.
The amino-acid sequence is shown on the right with positive charges highlighted in red. The transfer free energy according to the Wimley-White scale (Wimley et al., 1996) is plotted as a black line with a 7-residue moving average overlaid as a red line. Regions predicted by TOPCONS to correspond to loops (L1-L5) or TMDs (TMD1-TMD4) are shaded according to the legend at right.
Figure 1—figure supplement 2

Simulation snapshot illustrating the initial configuration comprised of 9 CG beads.
Positions of several beads in the ribosome (brown) and translocon (green) are labeled, with each labeled bead indicated by a black dot. Positions are labeled in units of σ.
Figure 2 with 2 supplements
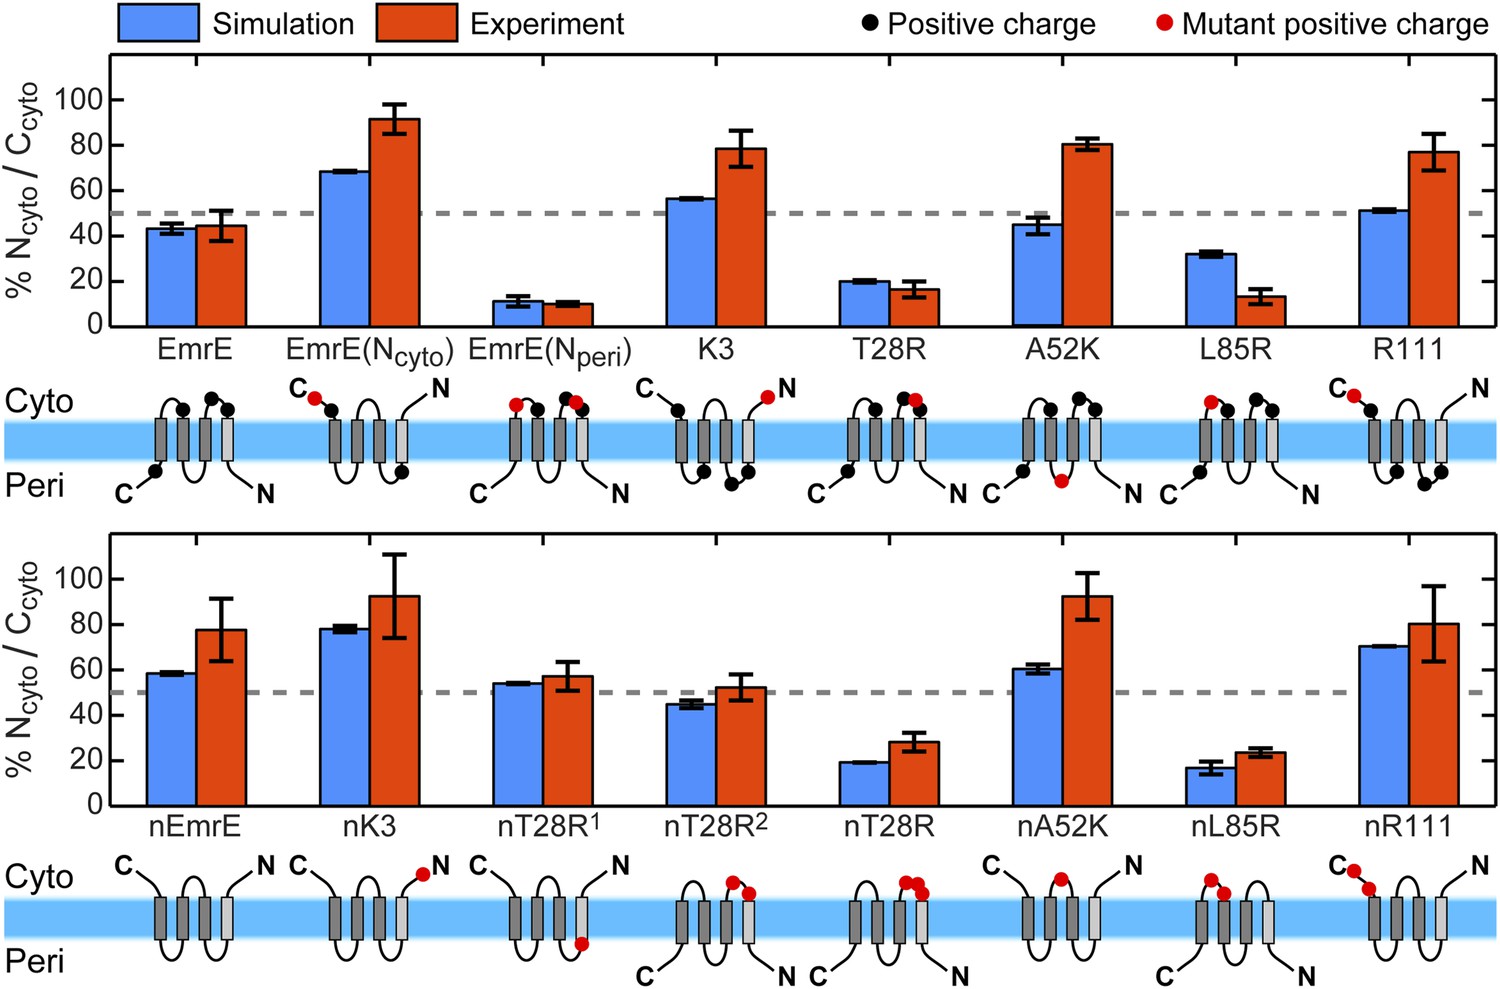
Topologies determined from simulations (blue) and compared to the experiments of Seppälä et al. (2010) (red), reporting the fraction of fully integrated integral membrane protein (IMP) configurations in the Ncyto/Ccyto topology.
Error bars indicate the standard error measured from independent blocks of simulations or taken from Seppälä et al. (2010). The dominant topology for each mutant is indicated schematically with additional positive charges relative to EmrE (top) or nEmrE (bottom) drawn as red dots.
Figure 2—figure supplement 1

Robustness of the distribution of topologies to the trajectory termination criteria.
The distribution of topologies for the EmrE, K3, nK3, and T28R mutants are computed using alternative trajectory termination criteria and compared to the distribution of topologies using the original protocol (shown in Figure 2). At left, the plot illustrates the effect of extending each original CG trajectory by 50 s. At right, the plot illustrates the effect of terminating trajectories at a distance of 20σ, rather than 4.5σ, from the origin. The dashed line indicates perfect correlation. Additional details on these calculations are included in the Robustness checks for the trajectory termination criteria section of the ‘Materials and methods’.
Figure 2—figure supplement 2
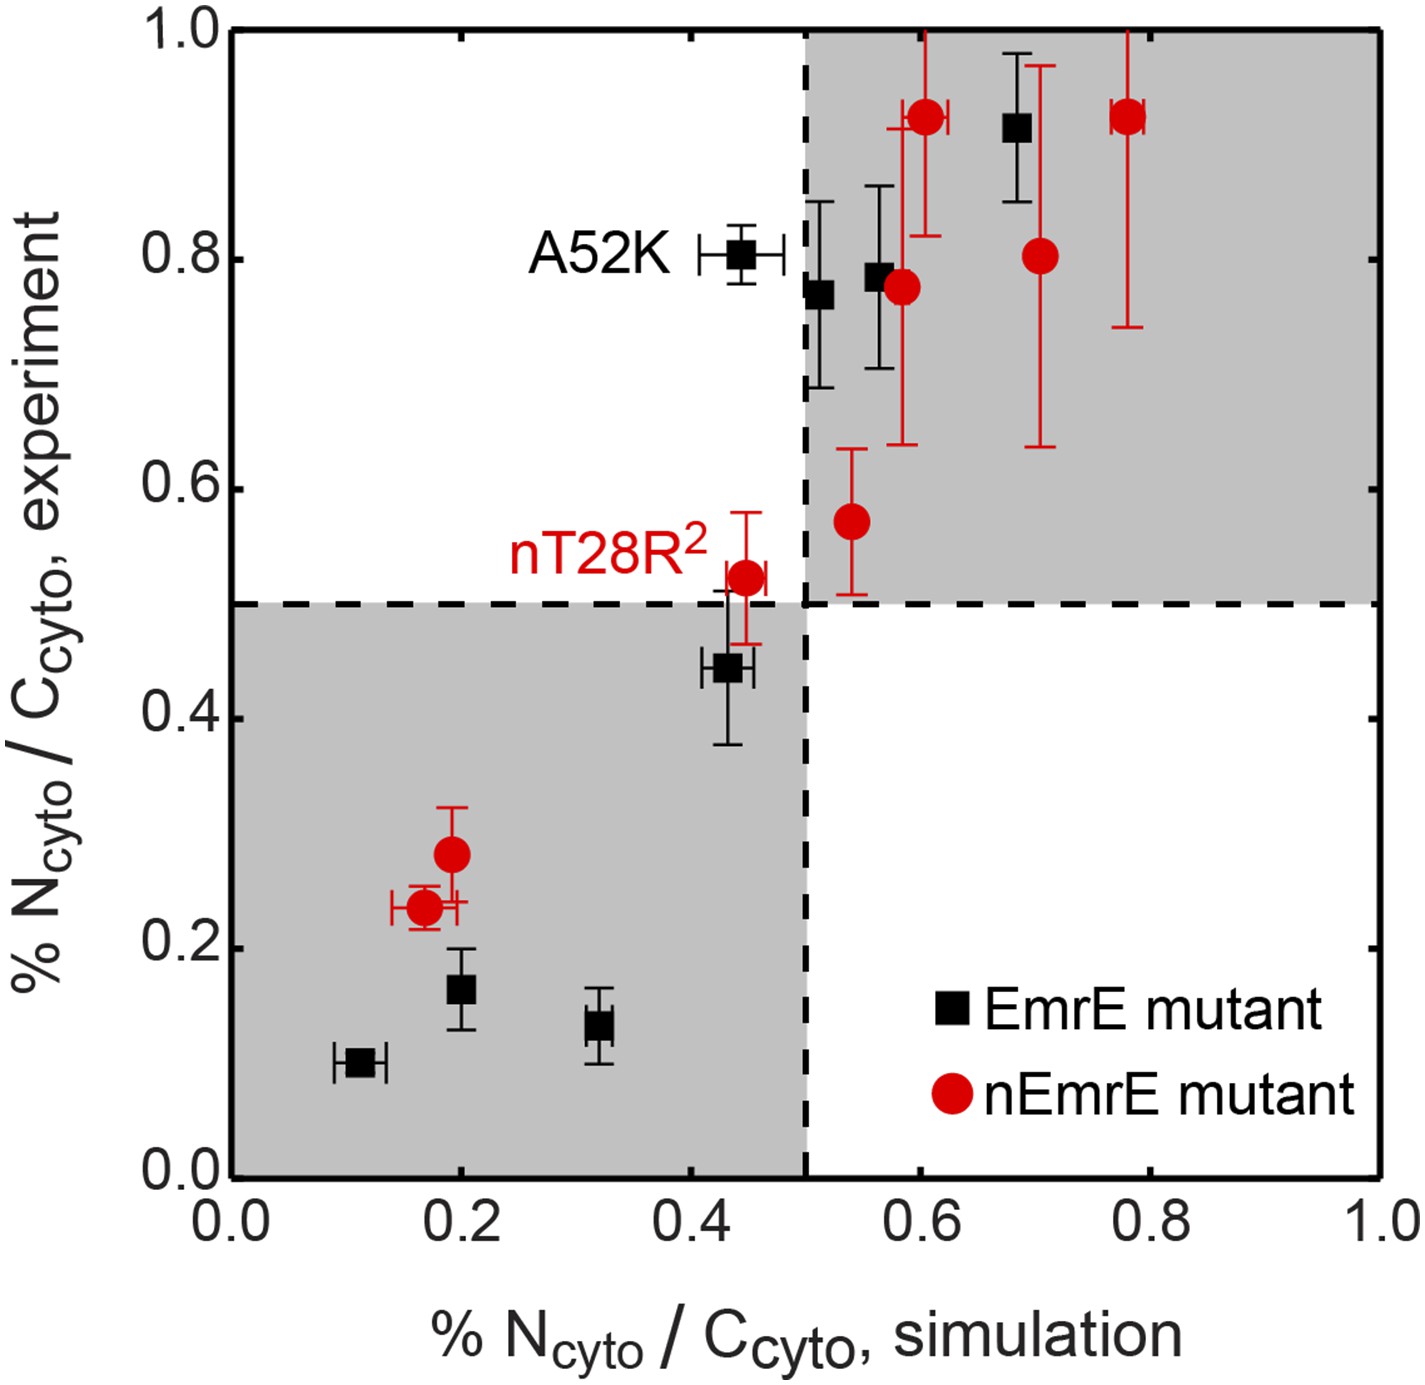
Correlation between the topologies determined from simulations (x-axis) and compared to the experiments of Seppälä et al. (2010) (y-axis), reporting the fraction of fully integrated IMP configurations in the Ncyto/Ccyto topology.
Mutants lying in the shaded quadrants have the same dominant topology in both the experiments and simulations. The experimental and simulation measurements are linearly correlated with a Pearson correlation coefficient of r = 0.92.
Figure 3 with 3 supplements
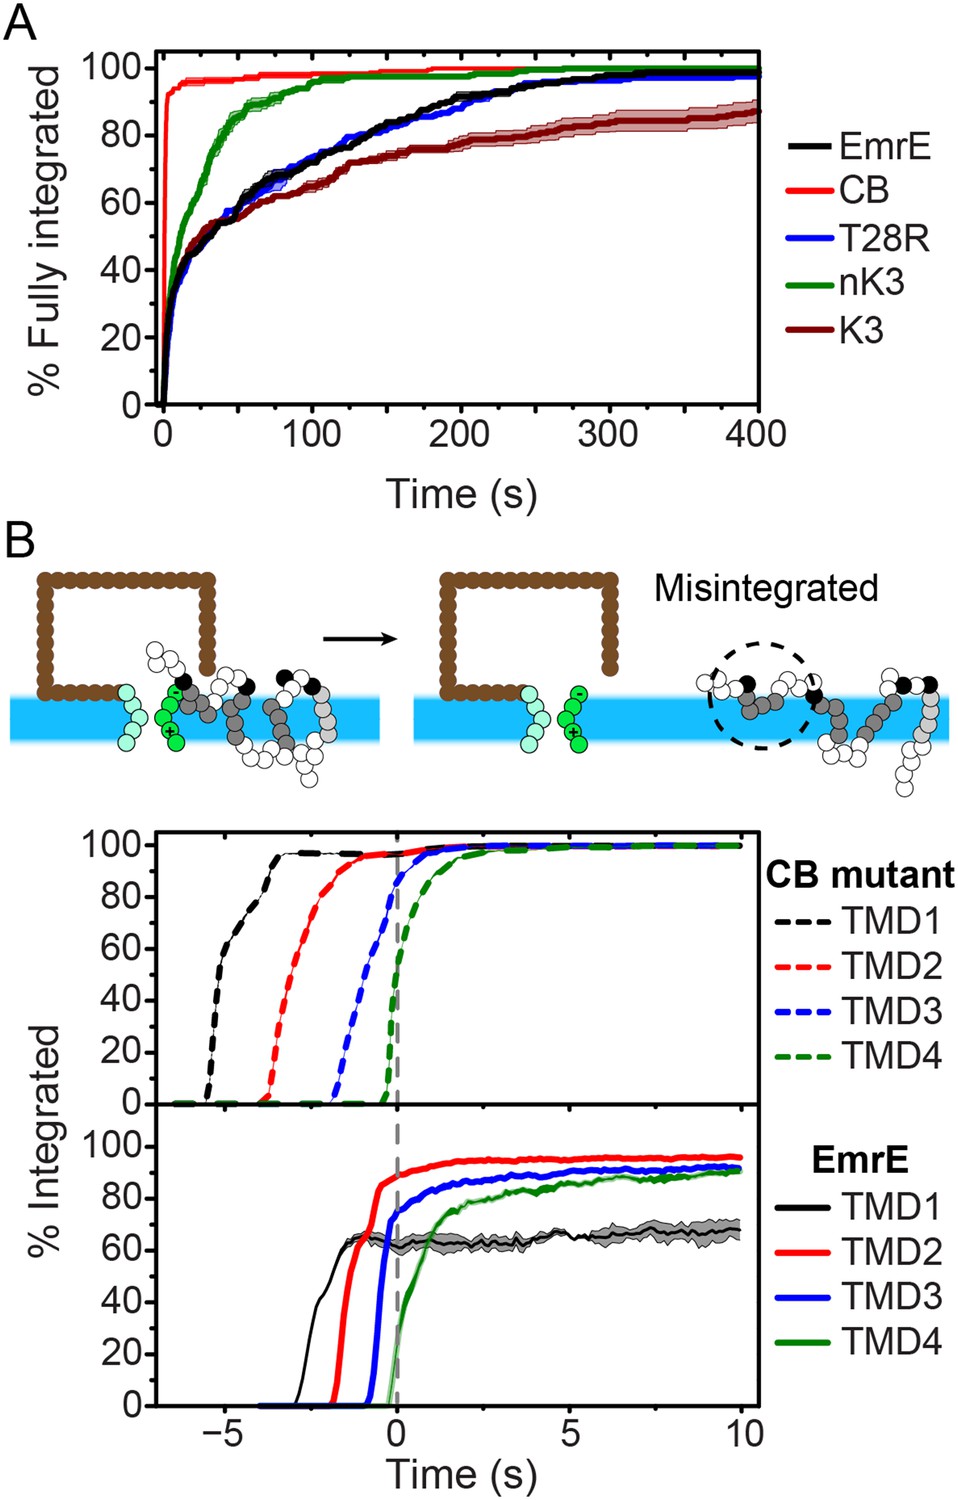
Kinetics of EmrE topogenesis.
(A) Fraction of CG trajectories in which all TMDs are fully integrated in a multispanning topology, plotted as a function of time for several mutants. (B) Fraction of CG trajectories in which each TMD is integrated, plotted as a function of time for the cotranslationally-biased (CB) mutant (top) and EmrE (bottom). The snapshots show an example of a simulation in which TMD4 of EmrE does not integrate during translation. In both panels, 0 s corresponds to the end of translation and negative values of time correspond to the period that precedes the end of ribosomal translation.
Figure 3—figure supplement 1

Pathways for the cotranslational integration of TMDs into the membrane.
At left, three distinct integration pathways are illustrated; the definition of each pathway is described in the Cotranslational integration pathways section of the ‘Materials and methods’. In the ‘channel-sliding’ pathway, the TMD partially enters the channel, then crosses the lateral gate (LG), then fully integrates into the membrane. In the ‘interface-sliding’ pathway, the TMD enters the cytoplasm through the gap between the translocon and ribosome, prior to undergoing membrane integration. In the ‘in-out’ pathway, the TMD fully spans the channel prior to membrane integration. At right, the fraction of cotranslational TMD integration events that exhibit each of these three pathways is presented for all four TMDs and for both the EmrE and nEmrE mutants. The dominant cotranslational integration pathway is the ‘channel-sliding’ pathway for all TMDs in both mutants.
Figure 3—figure supplement 2
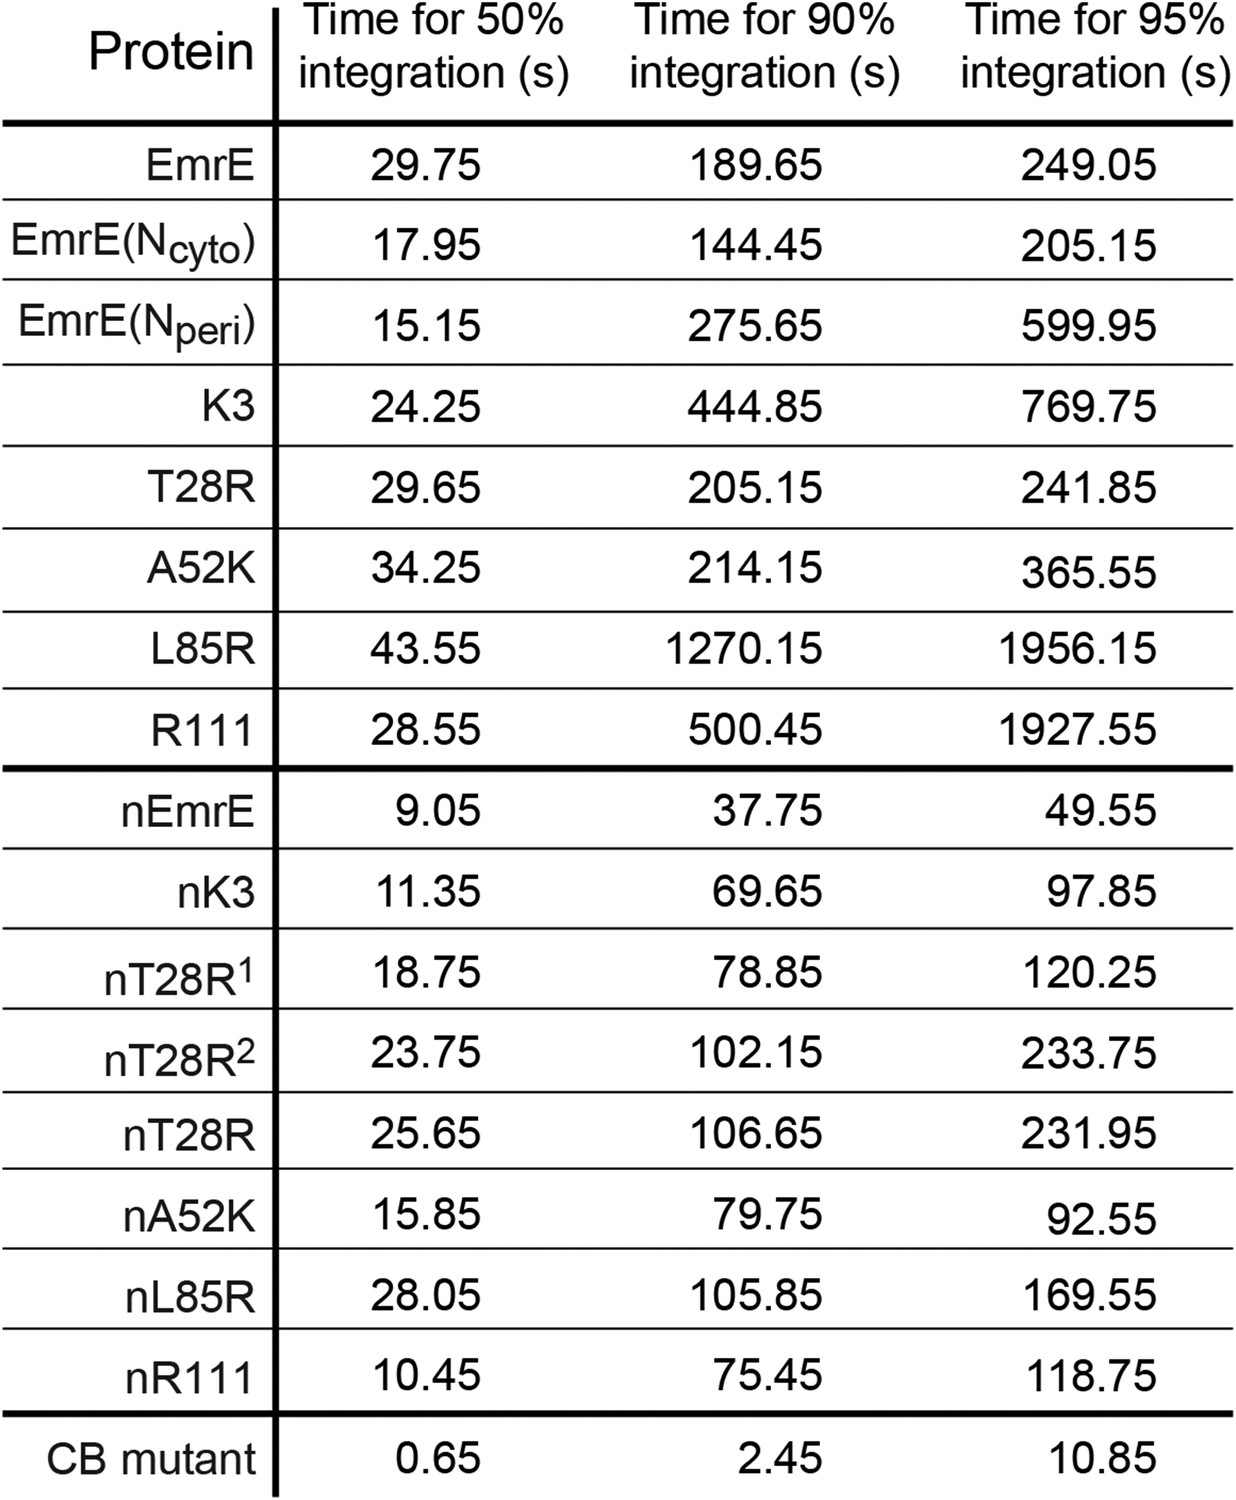
Simulation time necessary for 50%, 90%, and 95% of the CG trajectories to reach fully integrated topologies for each mutant.
https://doi.org/10.7554/eLife.08697.011
Figure 3—figure supplement 3
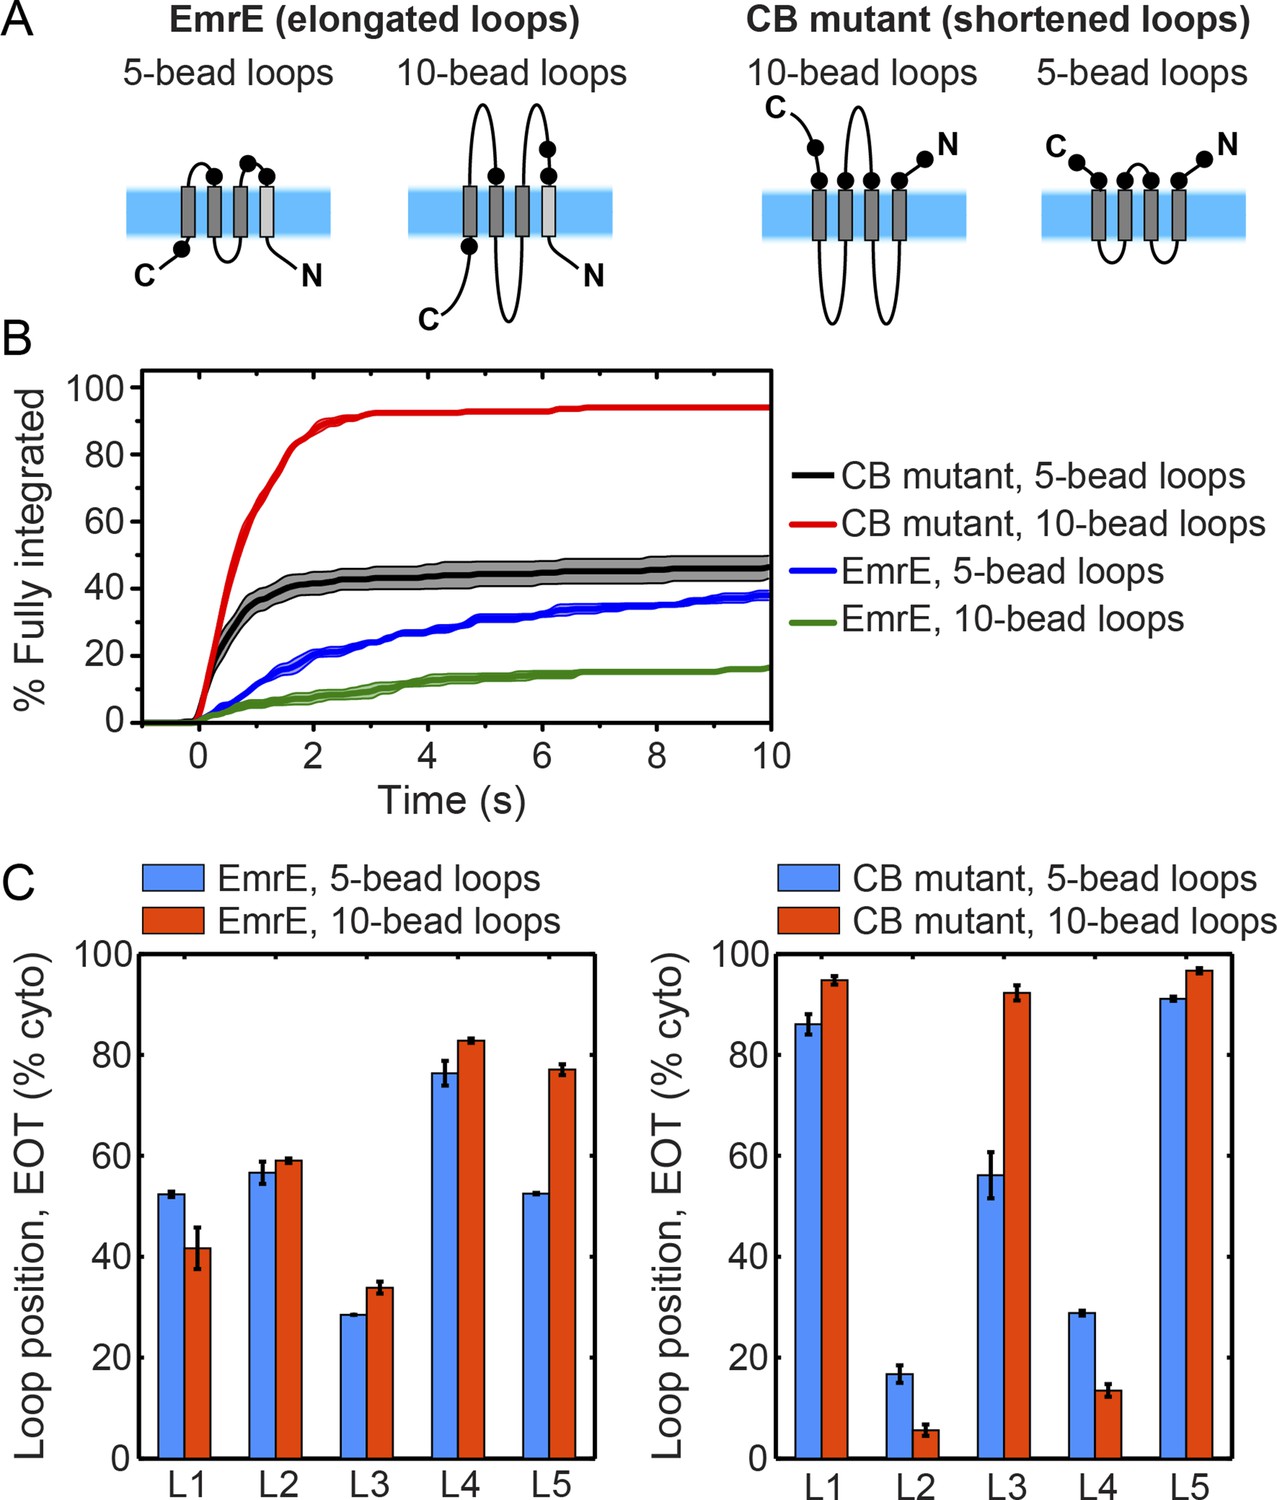
Effect of loop length on integration trajectories.
(A) Schematic illustrations of a new EmrE mutant with elongated, 10-bead loops, and a new CB mutant with shortened, 5-bead loops. (B) Fraction of CG trajectories that reach fully integrated topologies as a function of time for the EmrE and CB mutants with both loop lengths. The integration kinetics for the EmrE mutants clearly show that longer loops increase the timescale of post-translational annealing, due to the reduction of the loop-flipping frequency for the longer soluble loops. The corresponding effect is less clear for the two CB mutants, since the timescale for the loop-flipping frequency is dominated by the large positive charges on these loops, masking the effect of changing the loop length. (C) Average loop positions in the end-of-translation (EOT) ensemble for both the EmrE and CB mutants, presented in terms of the fraction of configurations for which each loop occupies the cytoplasm. For the EmrE mutants, changing the loop length leads to relatively small shifts in the EOT ensemble; however, for the CB mutants, the effect of loop length on the EOT ensemble is much larger, with the new short-loop CB mutant exhibiting a much weaker bias towards the Ncyto/Ccyto topology in the EOT ensemble.
Figure 4

The proposed mechanism of kinetic annealing of the EOT ensemble.
(A) Representative configurations visited by EmrE, T28R, and nR111 mutants within 1 s of simulation time following the end of ribosomal translation; this set of configurations for each mutant is called the EOT ensemble. The most-charged loop is indicated in red to highlight its position relative to the membrane. (B) The average loop positions from the EOT ensemble of each mutant is presented in terms of the fraction of configurations for which each loop occupies the cytoplasm. Adding charge to a loop biases towards a cytoplasmic position. (C) Post-translational annealing of representative EOT configurations for each mutant. Horizontal arrows indicate possible transitions as loops stochastically flip across the membrane to correct misintegrated TMDs. In each case, the position of the slowest-flipping loop (loop in red) determines the fully integrated topology by retaining its initial EOT position.
Figure 5 with 1 supplement
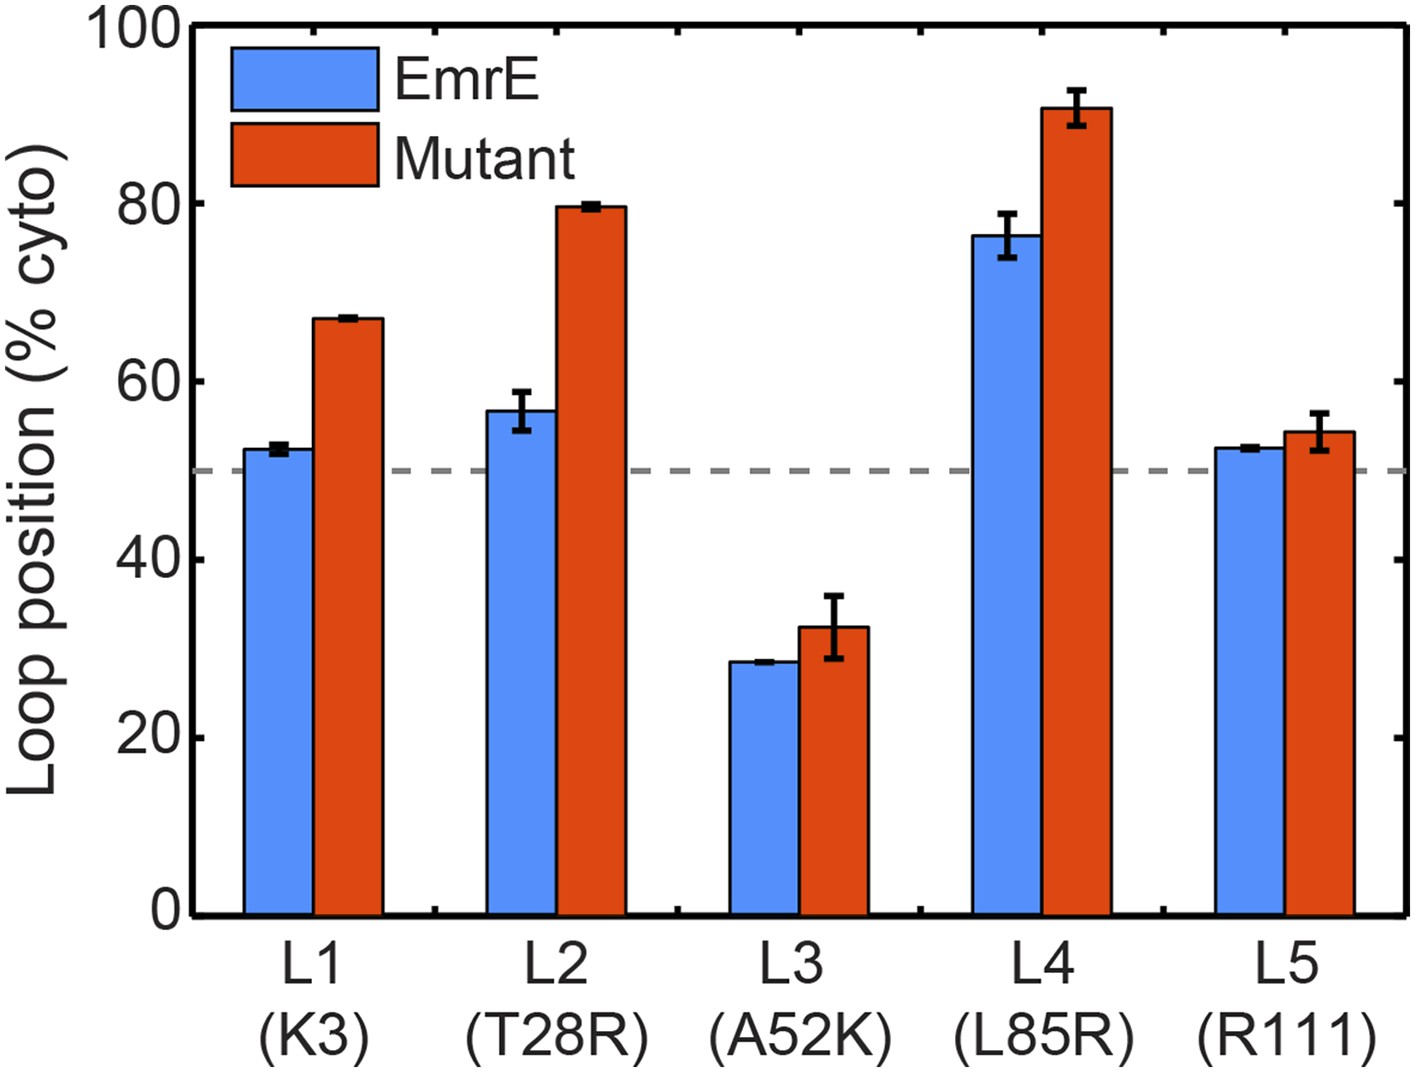
In blue, the average loop positions from the EOT ensemble of EmrE is presented in terms of the fraction of configurations for which each loop occupies the cytoplasm.
In red, the corresponding average loop position from the EOT ensemble of EmrE mutants; for each loop, the presented result is for the charge mutation associated with that loop.
Figure 5—figure supplement 1
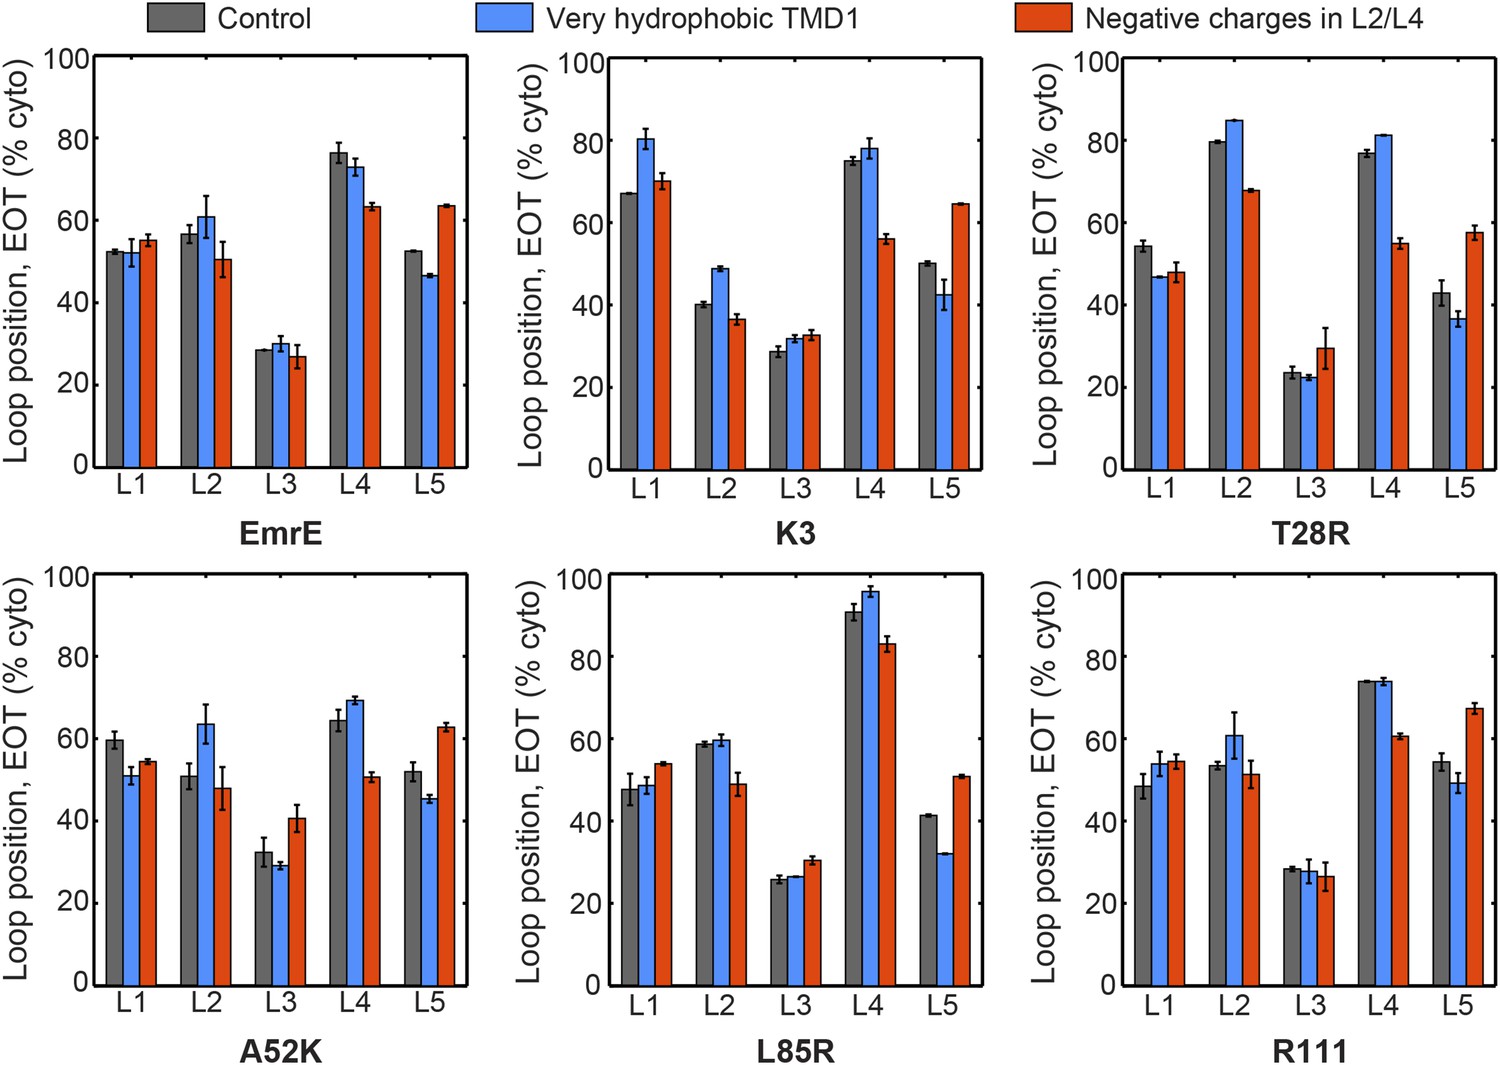
The average loop positions from the EOT ensemble of six EmrE mutants is presented in terms of the fraction of configurations for which each loop occupies the cytoplasm.
The first column (dark gray) shows loop positions from the control simulation protocol. To test the effect of the hydrophobicity of TMD1, the second column (blue) presents results in which all four beads in TMD1 are modeled with the very hydrophobic L CG bead-type. This modification is seen to have a very minor effect on the EOT ensemble. To test the effect of negatively charged EmrE residues in the simulation, the third column (red) presents results in which a charge of −2 is assigned to bead 4 in loop L2 and bead 3 in loop L4, thus matching the profile of negative charges in the EmrE sequence (Figure 1—figure supplement 1). The figure shows that including negative charges consistently shifts the positions of loop L4 toward the periplasm and L5 toward the cytoplasm. The small magnitude of these shifts and their uniformity across all mutants suggests that the negative charges in EmrE play a small role in understanding the shifts in topology of the mutants studied here.
Figure 6
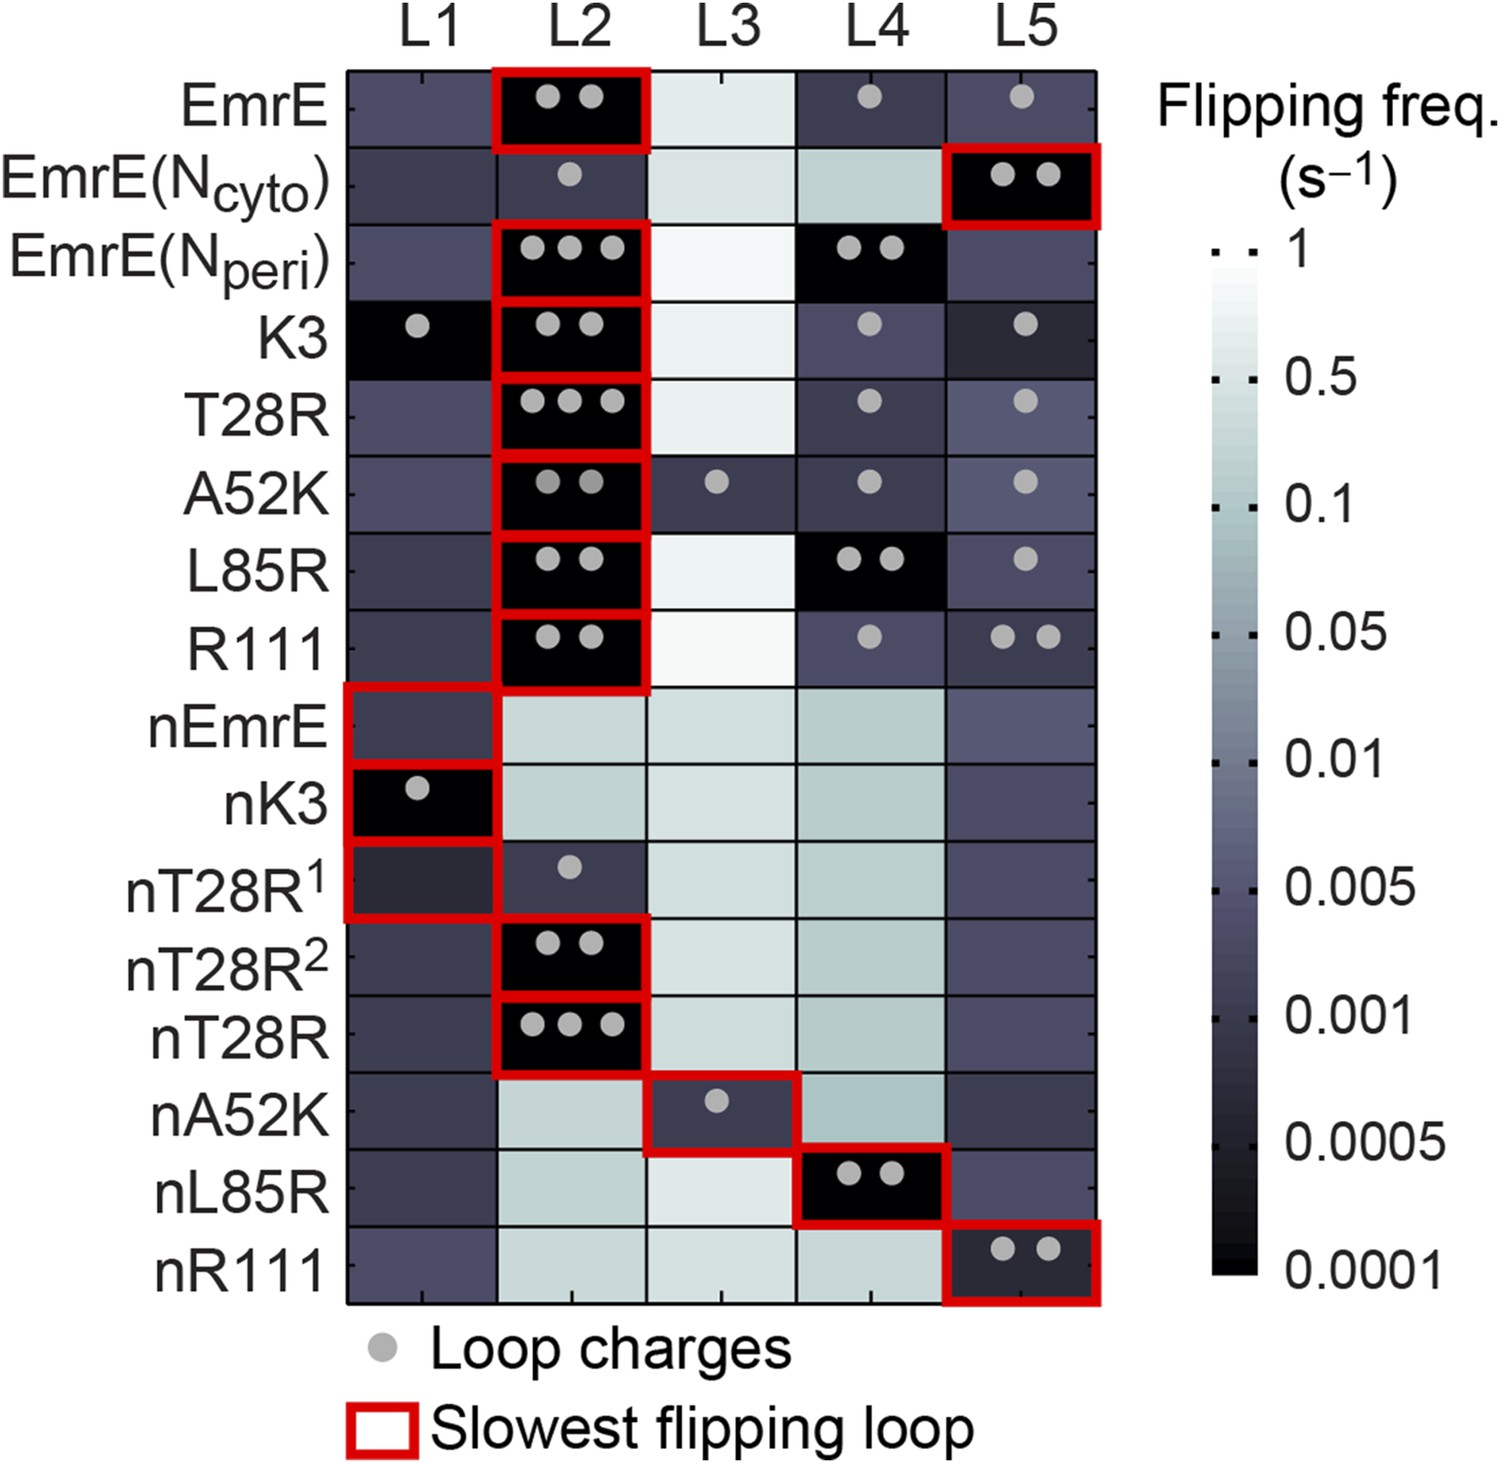
Loop-flipping frequencies computed from the CG trajectories.
Darker squares correspond to less frequent loop-flipping events according to the logarithmic color map. Gray dots indicate the number of positively charged residues on each loop. For each mutant, the red box indicates the slowest-flipping loop.
Figure 7 with 1 supplement
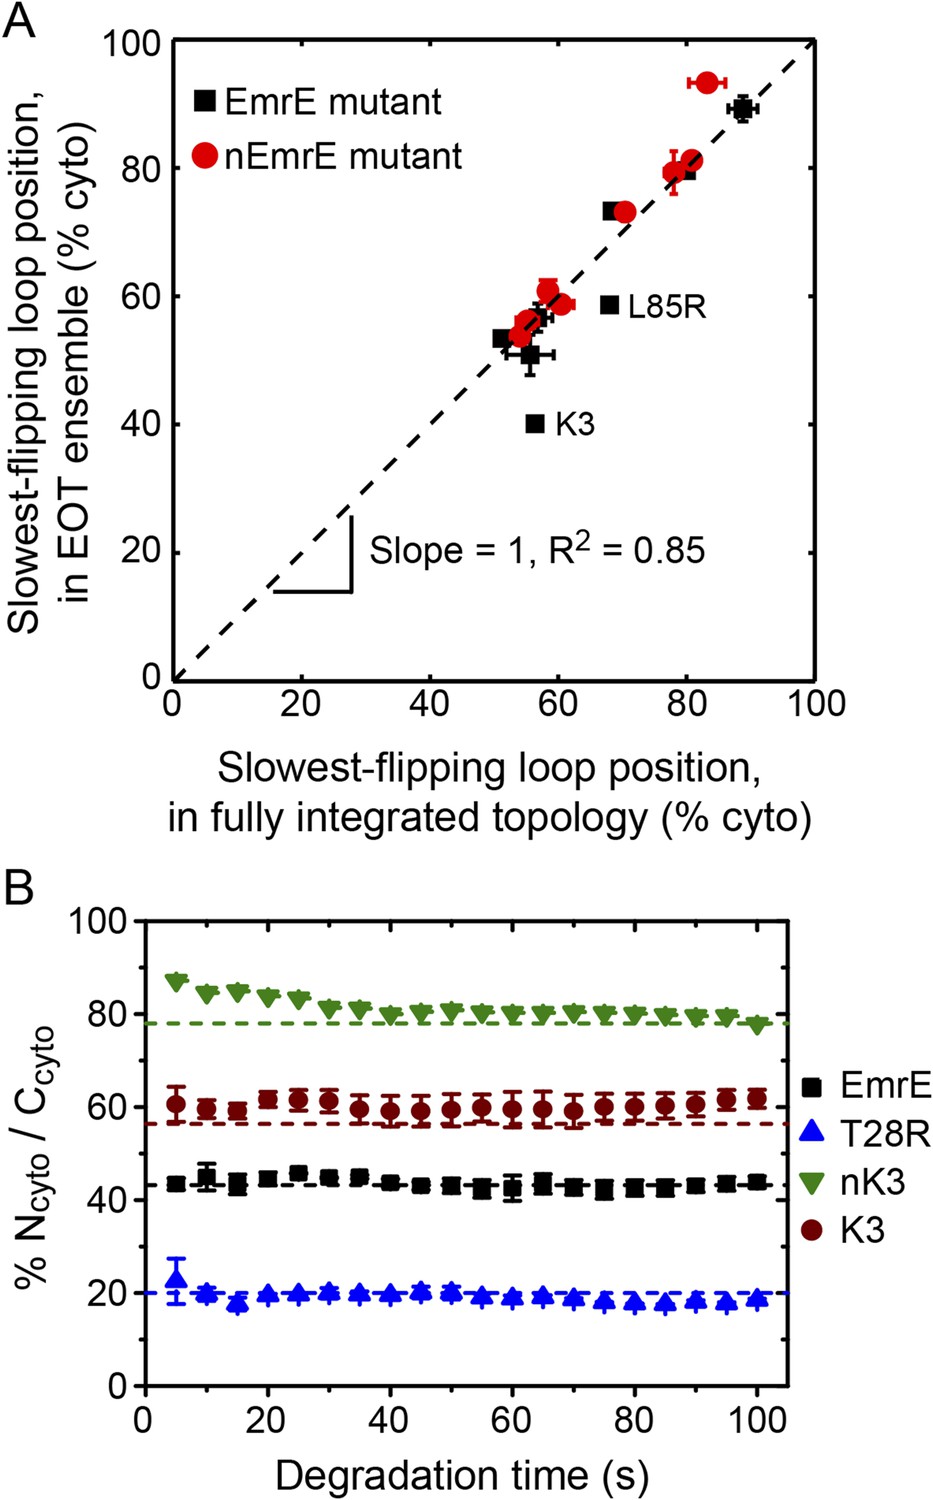
Relating configurations in the EOT ensemble to the fully integrated IMP topology.
(A) Comparison of the average position of the slowest-flipping loop in the EOT ensemble to the average position of that same loop in the ensemble of fully integrated configurations. The average loop positions are presented in terms of the fraction of configurations for which each loop occupies the cytoplasm. The black dashed line indicates perfect correlation. (B) Fraction of Ncyto/Ccyto topologies for the CG trajectories that have reached full integration, excluding all trajectories for which at least one TMD is misintegrated, plotted as a function of time following the end of translation. The dashed lines indicate the fraction of Ncyto/Ccyto topologies for each mutant after all CG trajectories reach full integration, corresponding to the results from Figure 2.
Figure 7—figure supplement 1

Comparison of the average position of the slowest-flipping loop in the EOT ensemble to the average position of that same loop in the ensemble of fully integrated configurations.
For the K3, L85R, nEmrE, and nT28R1 mutants, which have two slow-flipping loops, the axes of this plot are defined so as to account for the positions of both loops, as described in the Alternative definition of the slowest-flipping loop position for mutants with two slow-flipping loops section of the ‘Materials and methods’. The black dashed line indicates perfect correlation.
Figure 8 with 1 supplement
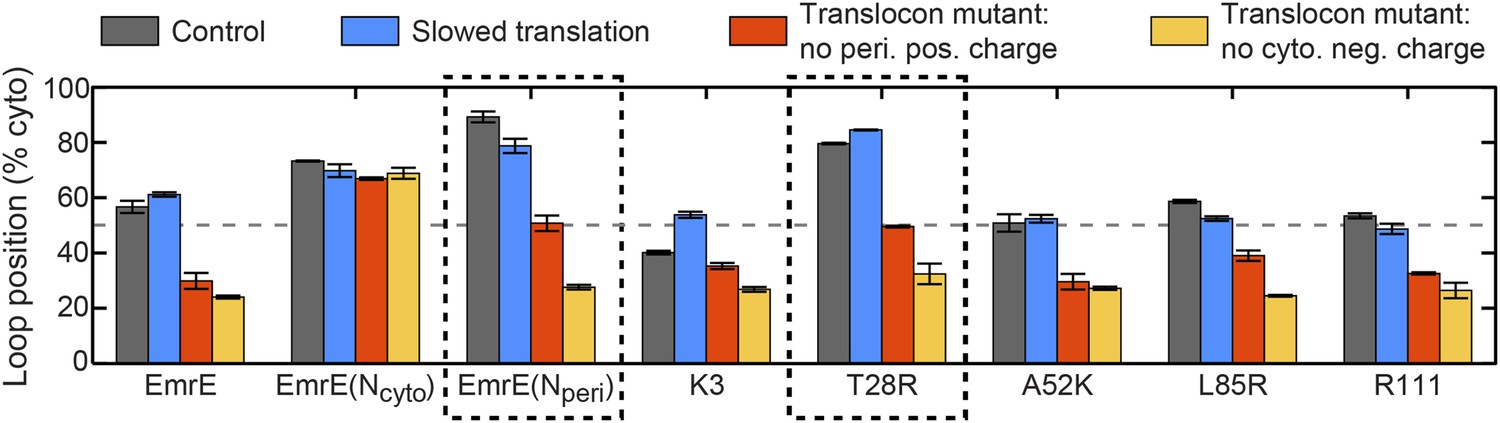
Predictions from the CG simulations in terms of changing the rate of ribosomal translation and introducing translocon mutations.
In each case, the figure presents the average position of the slowest-flipping loop in the EOT ensemble. The average loop position corresponds to the fraction of configurations for which that loop occupies the cytoplasm. The first column (dark gray) shows loop positions from the control simulation protocol. The remaining three columns show loop positions associated with the fourfold slowing of ribosomal translation (blue), associated with removal of the positive charge on the periplasmic opening of the translocon (red), and associated with removal of the negative charge on the cytoplasmic opening of the translocon (orange). The dashed boxes emphasize EmrE mutants that are predicted to exhibit dramatic inversions of the dominant topology upon translocon mutations.
Figure 8—figure supplement 1

Effect of changing the rate of ribosomal translation on loop positions.
In each case, the figure presents the average position of the slowest-flipping loop in the EOT ensemble. The average loop positions are presented in terms of the fraction of configurations for which each loop occupies the cytoplasm. Four different rates of ribosomal translation are presented: 24 residues/s (dark gray), 18 residues/s (blue), 12 residues/s (red), and 6 residues/s (orange).
Tables
Appendix table 1
CG bead charges (q) and water/membrane transfer free energies (g)
| Q | L | V | K | |
|---|---|---|---|---|
| q | 0.0 | 0.0 | 0.0 | 2.0 |
| g/ϵ | 2.0 | −4.0 | −2.0 | 6.0 |
Appendix table 2
CG bead sequences for each of the 16 EmrE mutants and the cotranslationally-biased mutant
| Protein | L1 | TMD1 | L2 | TMD2 | L3 | TMD3 | L4 | TMD4 | L5 |
|---|---|---|---|---|---|---|---|---|---|
| EmrE | QQQQQ | VVVV | QQQ | LLLL | QQQQQ | LLLL | QQQQ | LLLL | QQQQ |
| EmrE(Ncyto) | QQQQQ | VVVV | QQQQ | LLLL | QQQQQ | LLLL | QQQQQ | LLLL | QQQ |
| EmrE(Nperi) | QQQQQ | VVVV | LLLL | QQQQQ | LLLL | QQQ | LLLL | QQQQQ | |
| K3 | QQQQ | VVVV | QQQ | LLLL | QQQQQ | LLLL | QQQQ | LLLL | QQQQ |
| T28R | QQQQQ | VVVV | LLLL | QQQQQ | LLLL | QQQQ | LLLL | QQQQ | |
| A52K | QQQQQ | VVVV | QQQ | LLLL | QQQQ | LLLL | QQQQ | LLLL | QQQQ |
| L85R | QQQQQ | VVVV | QQQ | LLLL | QQQQQ | LLLL | QQQ | LLLL | QQQQ |
| R111 | QQQQQ | VVVV | QQQ | LLLL | QQQQQ | LLLL | QQQQ | LLLL | QQQ |
| nEmrE | QQQQQ | VVVV | QQQQQ | LLLL | QQQQQ | LLLL | QQQQQ | LLLL | QQQQQ |
| nK3 | QQQQ | VVVV | QQQQQ | LLLL | QQQQQ | LLLL | QQQQQ | LLLL | QQQQQ |
| nT28R1 | QQQQQ | VVVV | QQQQ | LLLL | QQQQQ | LLLL | QQQQQ | LLLL | QQQQQ |
| nT28R2 | QQQQQ | VVVV | QQQ | LLLL | QQQQQ | LLLL | QQQQQ | LLLL | QQQQQ |
| nT28R | QQQQQ | VVVV | LLLL | QQQQQ | LLLL | QQQQQ | LLLL | QQQQQ | |
| nA52K | QQQQQ | VVVV | QQQQQ | LLLL | QQQQ | LLLL | QQQQQ | LLLL | QQQQQ |
| nL85R | QQQQQ | VVVV | QQQQQ | LLLL | QQQQQ | LLLL | QQQ | LLLL | QQQQQ |
| nR111 | QQQQQ | VVVV | QQQQQ | LLLL | QQQQQ | LLLL | QQQQQ | LLLL | QQQQ |
| CB mutant | L1 | TMD1 | L2 | TMD2 | L3 | TMD3 | L4 | TMD4 | L5 |
|---|---|---|---|---|---|---|---|---|---|
| QQQ | LLLL | QQQQQQQQQQ | LLLL | QQQQQQQQ | LLLL | QQQQQQQQQQ | LLLL | QQQQQQQQ |
-
Moderately hydrophobic (V), very hydrophobic (L), neutral-hydrophilic (Q) and charged (K) beads are colored as light gray, gray, black, and red respectively. Loops and TMDs are labeled.
Download links
A two-part list of links to download the article, or parts of the article, in various formats.
Downloads (link to download the article as PDF)
Open citations (links to open the citations from this article in various online reference manager services)
Cite this article (links to download the citations from this article in formats compatible with various reference manager tools)
Regulation of multispanning membrane protein topology via post-translational annealing
eLife 4:e08697.
https://doi.org/10.7554/eLife.08697


