Differential inhibition onto developing and mature granule cells generates high-frequency filters with variable gain
- Instituto de Investigación en Biomedicina de Buenos Aires—CONICET—Partner Institute of the Max Planck Society, Argentina
- Leloir Institute—CONICET, Argentina
Figures
Figure 1 with 2 supplements
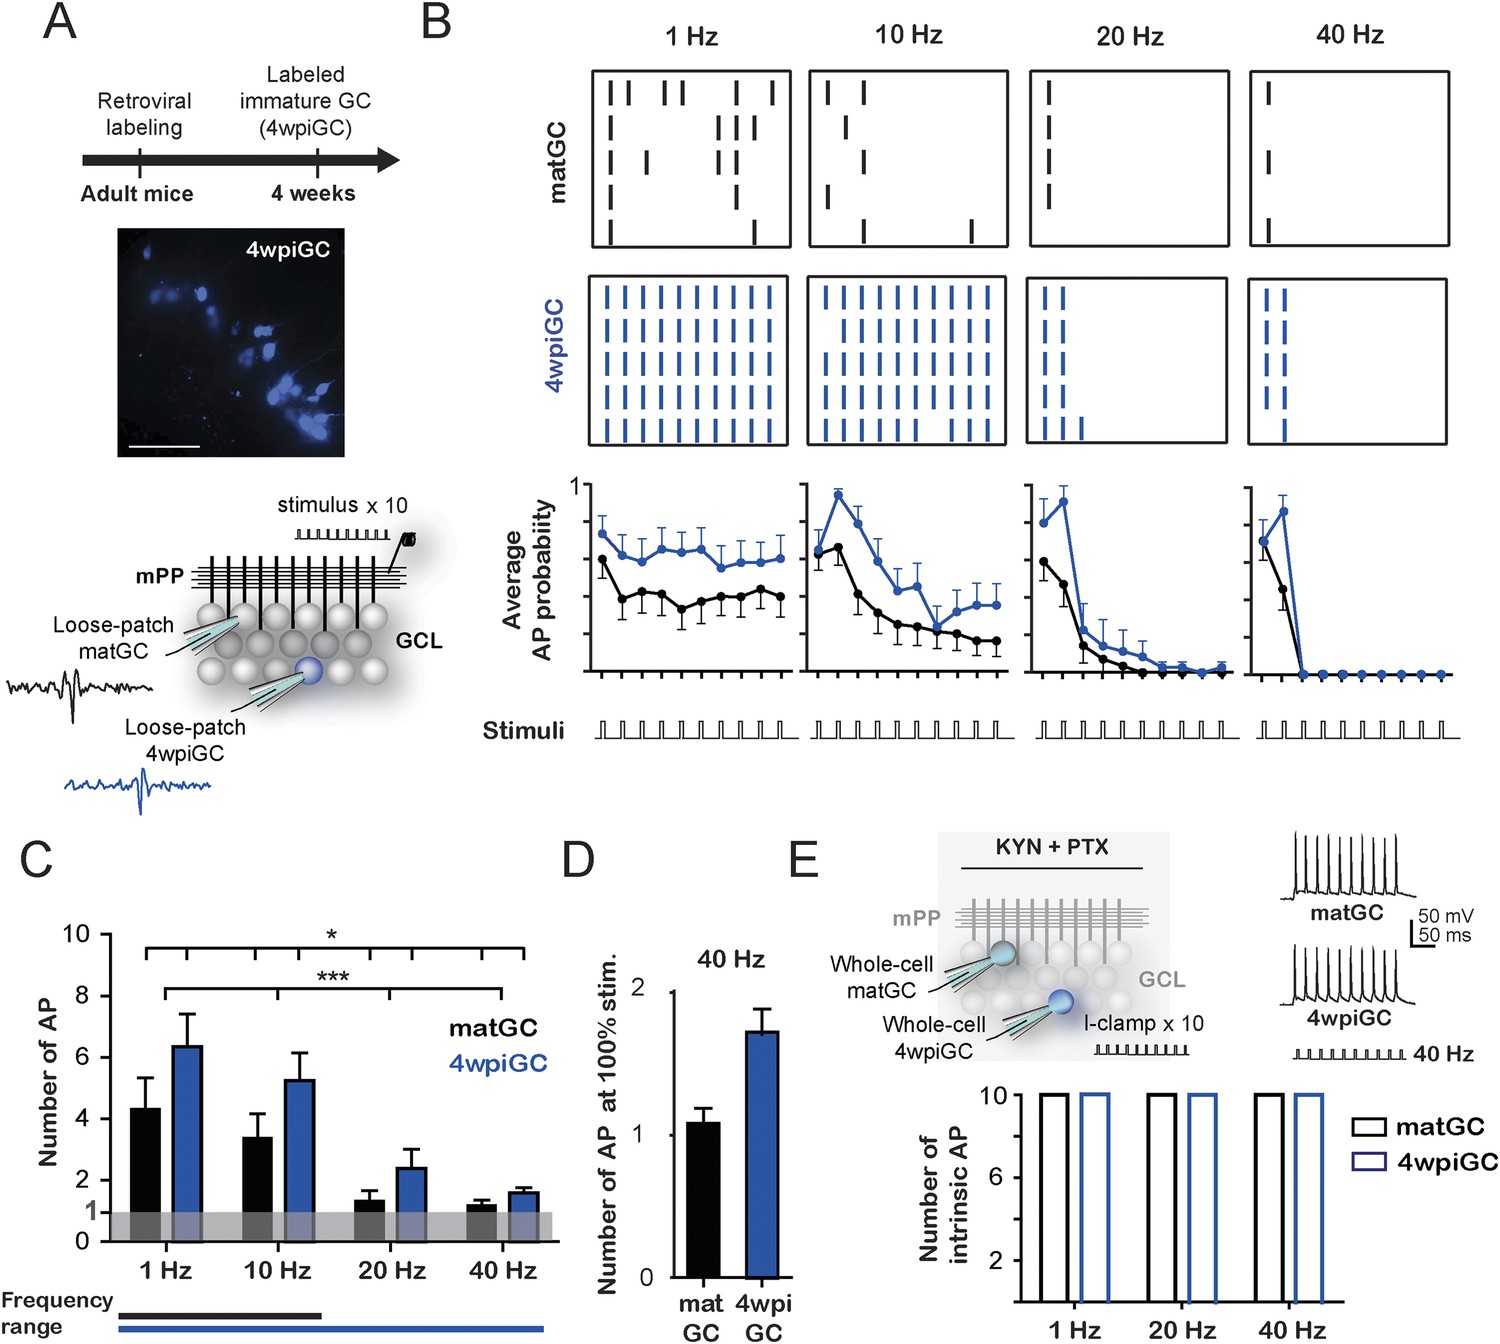
Frequency-dependent activation of mature and immature granule cells.
(A) The image shows a hippocampus slice with 4-weeks-old GC (4wpiGC) expressing RFP (pseudo-colored in blue). Scale bar: 50 µm. The upper timeline indicates the time of retroviral injection. The lower scheme shows the recording configuration: a stimulating electrode was placed in the medial perforant path (mPP) to deliver 10 stimuli at different frequencies; the stimulation intensity was kept at 50% fEPSP. Loose patch recordings were obtained from mature GC (matGC) and 4wpiGC to detect spikes. (B) Raster plots from one matGC (black) and one 4wpiGC (blue) at 1 Hz, 10 Hz, 20 Hz, and 40 Hz. Each color dash denotes a spike. Columns: stimulation pulses at the four frequencies. Rows: stimulation trains. Lower panels are the average action potential probability at each pulse of the train for all the data from matGC (black) and 4wpiGC (blue). (C) Average of the sum of action potentials evoked by stimulation trains of 1 Hz, 10 Hz, 20 Hz, and 40 Hz, in matGC (black bars) and 4wpiGC (blue bars). Activation decreases with frequency in both cells and is higher in 4wpiGC than in matGC at all stimulation frequencies (two-way ANOVA, variation between GC: *p < 0.05; variation in frequency: ***p < 0.001; interaction: ns, p > 0.05). N (4wpiGC) = 12, 13, 7, and 11 cells and N (matGC) = 15, 16, 11, 14 cells for 1 Hz, 10 Hz, 20 Hz, and 40 Hz, respectively. The frequency range lines at the bottom shows the range of frequencies that GC responded with a number of action potentials significantly different from 1 (Wilcoxon signed-rank test, at 20 and 40 Hz, p < 0.05 for 4wpiGC, p > 0.05 for matGC). (D) Average number of action potentials when stimulus was at 100% spiking of each cell after the first stimulation pulse (above threshold) in matGC (black) and 4wpiGC (blue) at 40 Hz stimulation. (E) Upper scheme shows the recording configuration. Whole cell current clamp (I-Clamp) recordings were obtained from matGC and 4wpiGC. Synaptic activity was blocked by kynurenic acid (KYN) and picrotoxin (PTX). Intrinsic spiking activity was evaluated by injecting 10 depolarizing brief square current pulses at an intensity that evoked action potentials in the 10 pulses at 1 Hz. Cells were tested at frequencies every 20 Hz. The lower graph shows the mean number of action potentials evoked at 1 Hz, 20 Hz, and 40 Hz. All recorded cells in whole-cell fired 10 action potentials when 10 current pulses were delivered at these frequencies (N = 4 cells for both GC). Error bars indicate SEM.
Figure 1—figure supplement 1
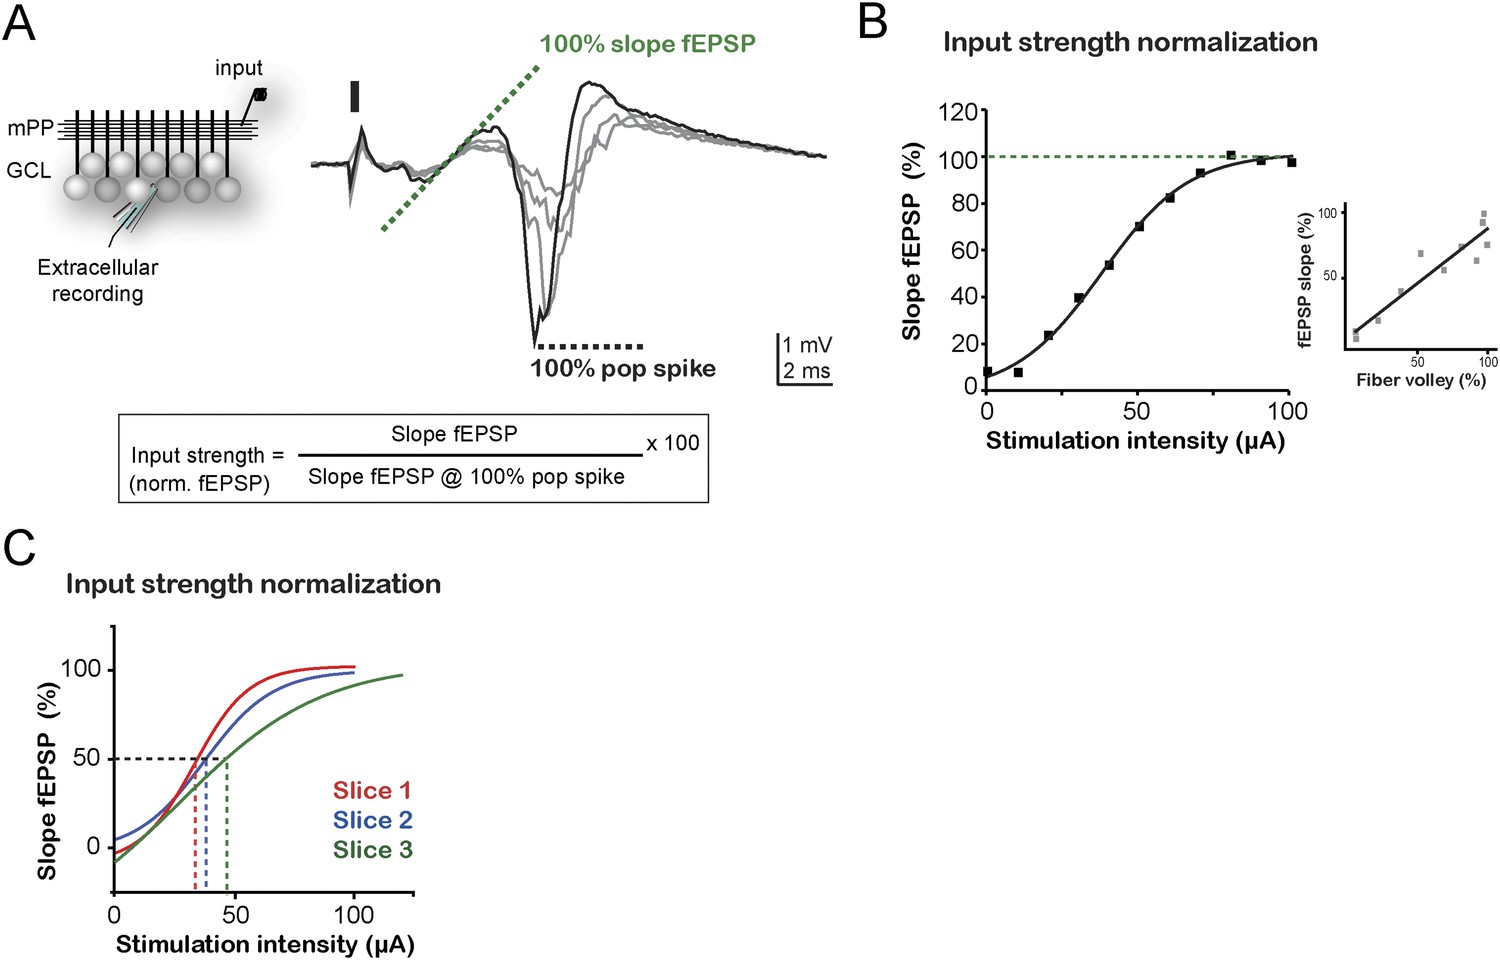
Input normalization.
(A) Left, recording configuration. A stimulation electrode (input) was placed to stimulate the medial perforant path (mPP); one field recording electrode placed in the GCL to simultaneously monitor the pop spike and fEPSP. Right, field recordings from the GCL at increasing stimulus intensities. The dash indicates the simulation time (the stimulation artifact was erased for better visualization of the data). The black trace corresponds to the intensity which evokes the maximum pop spike (100% pop spike). The dotted green line indicates the slope of the fEPSP corresponding to the maximum pop spike, considered 100% fEPSPslope. Bottom, input strength calculation formula: the input strength is the slope of the fEPSP elicited at any given stimulus intensity, normalized to the slope of the fEPSP evoked at the stimulus intensity that evokes a pop spike of maximal amplitude (100% pop spike). See ‘Materials and methods’ for details. (B) Normalized slope of the fEPSP (input strength) plotted against the current amplitude applied to the stimulating electrode (stimulation intensity) for the experiment illustrated in B. A sigmoid curve was fitted to the data. Inset: linear relationship between the percentage fEPSPslope and the percentage fiber volley amplitude for the example slice; R = 0.88. (C) Sigmoid fits from input strength normalization curves for three example slices reveal the need for a normalization procedure to compare physiologically equivalent input intensities among experiments.
Figure 1—figure supplement 2
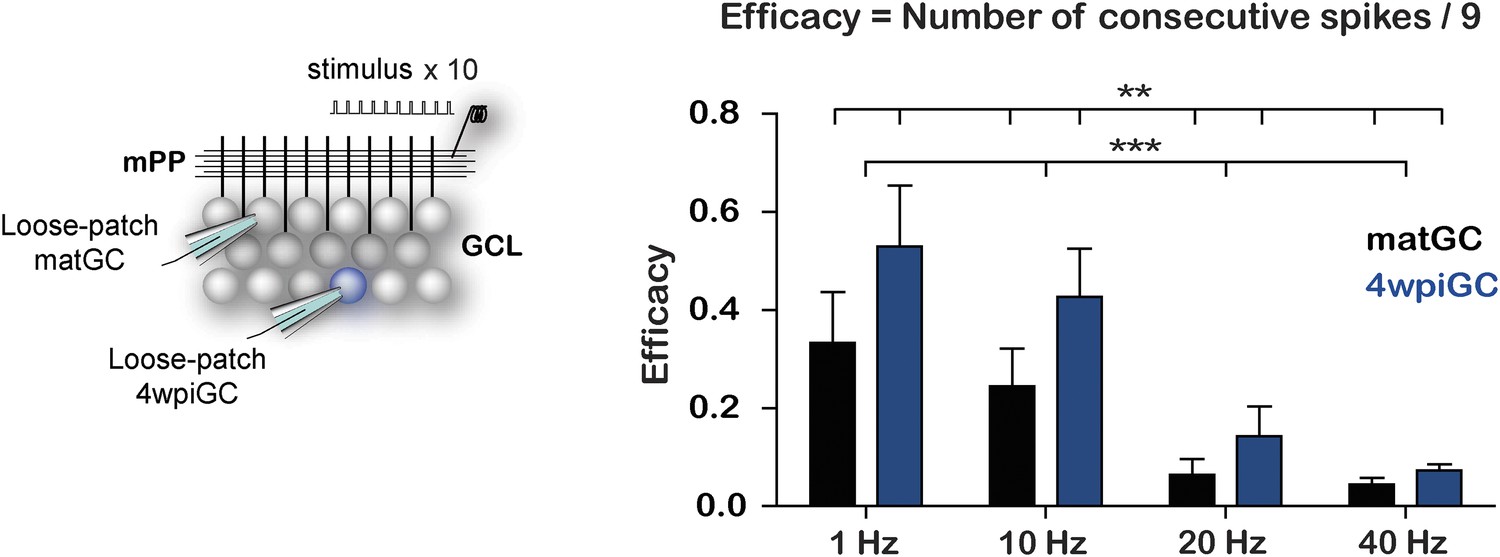
Immature GC are more effective at responding to frequency than matGC.
Left, recording configuration. Loose patch recordings were obtained from matGC and 4wpiGC in response to mPP stimulation with 10 pulses at different frequencies. Right, efficacy to reproduce the stimulating frequency with the spiking was calculated as the probability of occurrence of action potentials at the time interval of stimulation. The efficacy decreases with frequency in both matGC and 4wpiGC, and is greater in 4wpiGC than in matGC at all stimulation frequencies (two-way ANOVA, variation between GC: **p < 0.01; frequency variation: **p < 0.001; interaction: ns, p > 0.05). N (4wpiGC) = 12, 13, 7, and 11 cells and N (matGC) = 15, 16, 11, 14 cells for 1 Hz, 10 Hz, 20 Hz, and 40 Hz, respectively. Data expressed as average ±SEM.
Figure 2

GABAergic inhibition generates the difference between mature and immature GC.
(A) Left, the scheme shows the recording configuration, a stimulating electrode was placed in the medial perforant path (mPP) to deliver 10 stimuli at different frequencies; the stimulation intensity was kept at 50% fEPSP. Loose patch recordings were obtained from mature GC (matGC) and 4wpiGC to detect spikes in the presence of picrotoxin (PTX). Right, Raster plots from one matGC (in black) and one 4wpiGC (in blue) at 1 Hz, 10 Hz, 20 Hz, and 40 Hz. Each color line denotes a spike. Responses of neurons were recorded in PTX. (B) Average of the sum of action potentials evoked by stimulation trains of 1 Hz, 10 Hz, 20 Hz, and 40 Hz, in matGC (gray columns) and 4wpiGC (light blue columns) in the presence of PTX. Activation slightly decreases with frequency in both cells, but there were not significant differences among matGC and 4wpiGC (two-way ANOVA, variation between GC: ns; variation in frequency: *p < 0.05; interaction: ns, p > 0.05 N = 23 cells for both GC at the four frequencies). (C) Comparison of matGC activation to stimulation with trains in control conditions and when inhibition was blocked with PTX. Activation of matGC was higher in the presence of PTX at all frequencies (two-way ANOVA, variation between treatments: ***p < 0.001; frequency variation. **p < 0.01; interaction: ns, p > 0.05). (D) Comparison of 4wpiGC activation to stimulation with trains in control conditions and when inhibition was blocked with PTX. The effect of blocking inhibition in 4wpiGC varies with frequency. Activation increases only at high stimulation frequencies (two-way ANOVA variation between treatments: *p < 0.05; variation between frequencies: *p < 0.05; positive interaction p < 0.01; at 40 Hz, p < 0.01, Bonferroni post-test). Error bars indicate SEM.
Figure 3 with 2 supplements
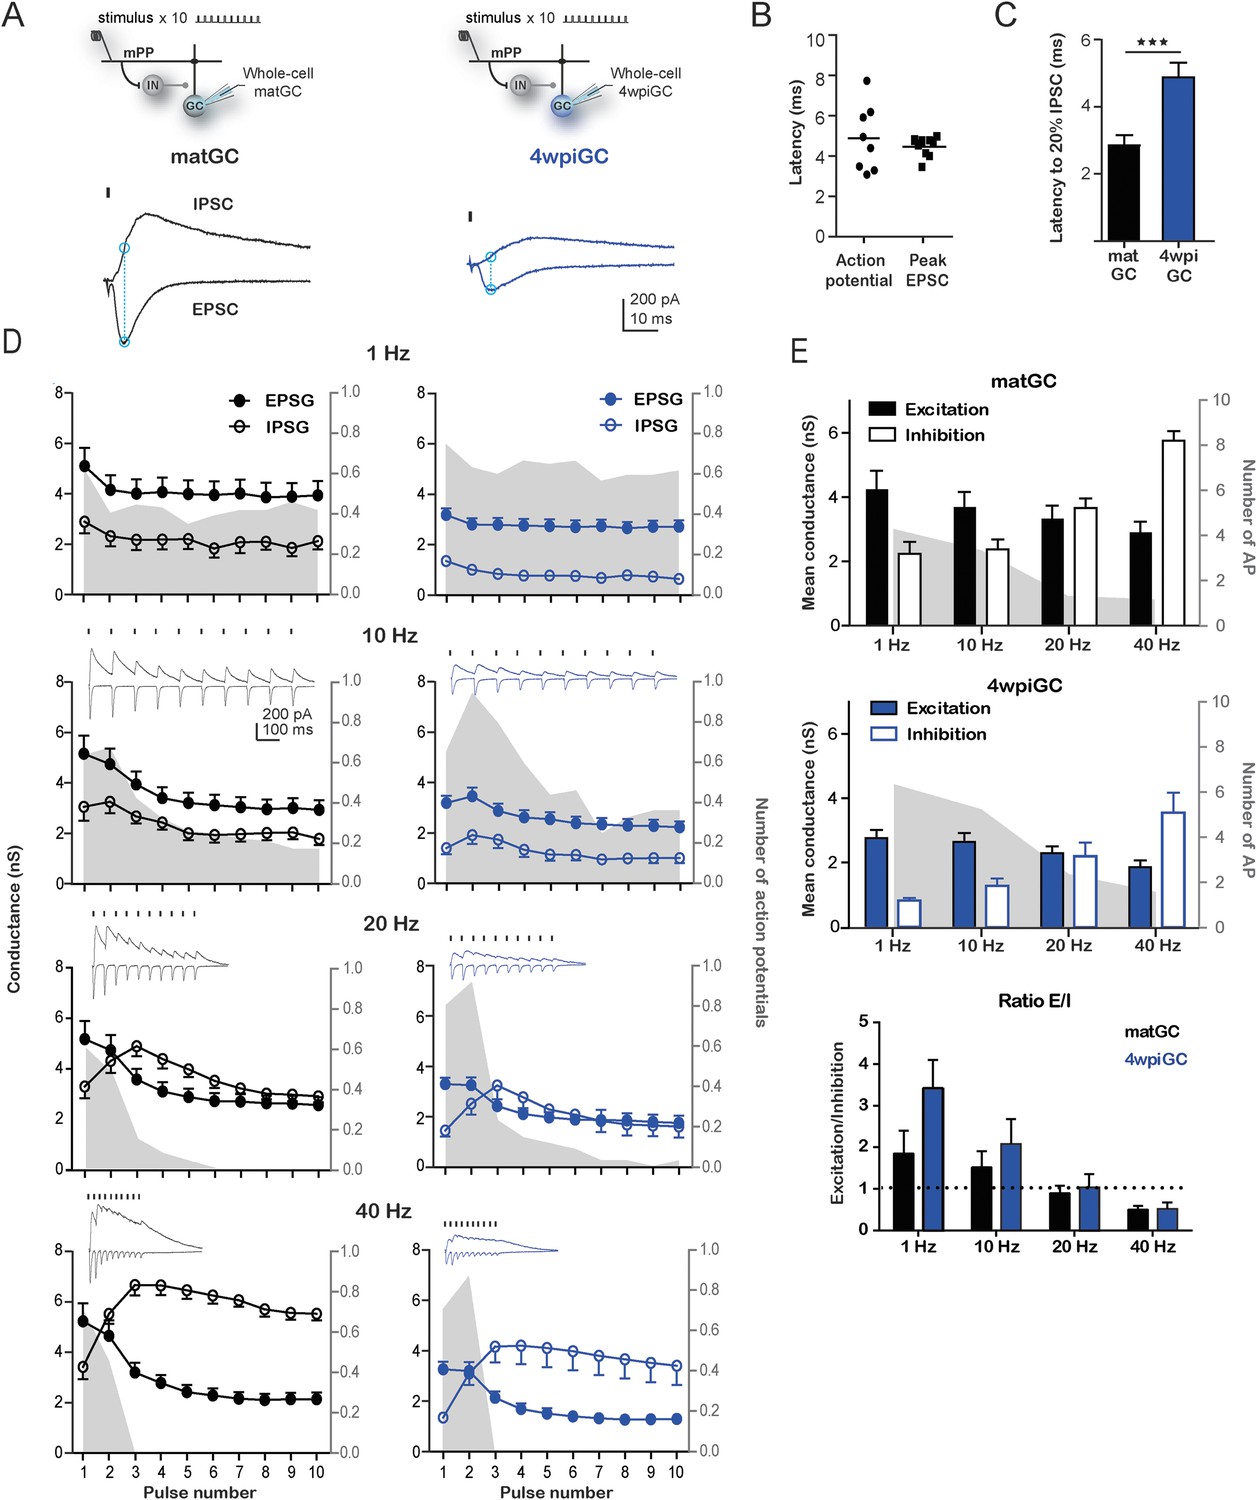
Interaction between excitation and inhibition determines the response of GC to frequency.
(A) Top, the schemes show the recording configuration. Whole-cell voltage-clamp recordings were obtained from matGC and 4wiGC in response to stimulation of mPP with trains at different frequencies. Bottom, example of recordings. IPSCs were recorded at the reversal potential of excitation (−60 mV), and EPSCs were recorded at the reversal potential of inhibition (0 mV). The dash indicates the time of the stimulus. In subsequent quantifications, excitation and inhibition were measured at the peak of the EPSC, marked with blue in the trace. Traces in black correspond to matGC and in blue to 4wpiGC. (B) Latency to action potentials compared to latency of the peak EPSC measured from the stimulating artifact. The action potentials and the peak of the EPSC occur close in time. (C) Average latency to reach the 20% of the peak IPSC evoked by the first stimulation pulse at 1 Hz in matGC (black) and 4wpiGC (blue). The IPSC is slower in 4wpiGC than in matGC (***p < 0.001, t test). (D) Average excitatory (EPSG) and inhibitory (IPSG) conductance evoked by each pulse in the train at 1 Hz, 10 Hz, 20 Hz, and 40 Hz. The values were calculated as indicated in A. For comparison, the spiking probability for each pulse in the train obtained from Figure 1A is plotted as the gray shadow in the back. The insets show representative current traces obtained for each frequency. Dashes indicate stimuli. (E) Average of the mean of excitatory and inhibitory conductances evoked by the 10 pulses in matGC and 4wpiGC. Excitation decreases with frequency and is higher in matGC than in 4wpiGC at all frequencies of stimulation (two-way ANOVA paired between frequencies; variation between GC: * p < 0.05; variation between frequencies. ***p < 0.001; interaction: ns, p > 0.05; N (4wpiGC) = 17 cells N (matGC) = 14 cells at the four frequencies). Inhibition increases with frequency and is higher in matGC than in 4wpiGC that at all frequencies of stimulation (two-way ANOVA paired between frequencies; variation between GC: ***p < 0.001; frequency variation. ***p < 0.001; interaction: ns, p > 0.05. N (4wpiGC) = 9 cells and N (matGC) = 11 cells at the four frequencies). For comparison, the average number of action potentials is plotted as a gray shadow in the back. Bottom: ratios between mean EPSG and IPSG evoked along train stimulation at 1, 10, 20, and 40 Hz for 4wpiGC (blue) and matGC (black). Dotted lines show the switch between higher excitation (above ratio = 1) and inhibition (below ratio = 1) balance. Error bars indicate SEM. Stimulation artifacts were erased from traces for better visualization.
Figure 3—figure supplement 1
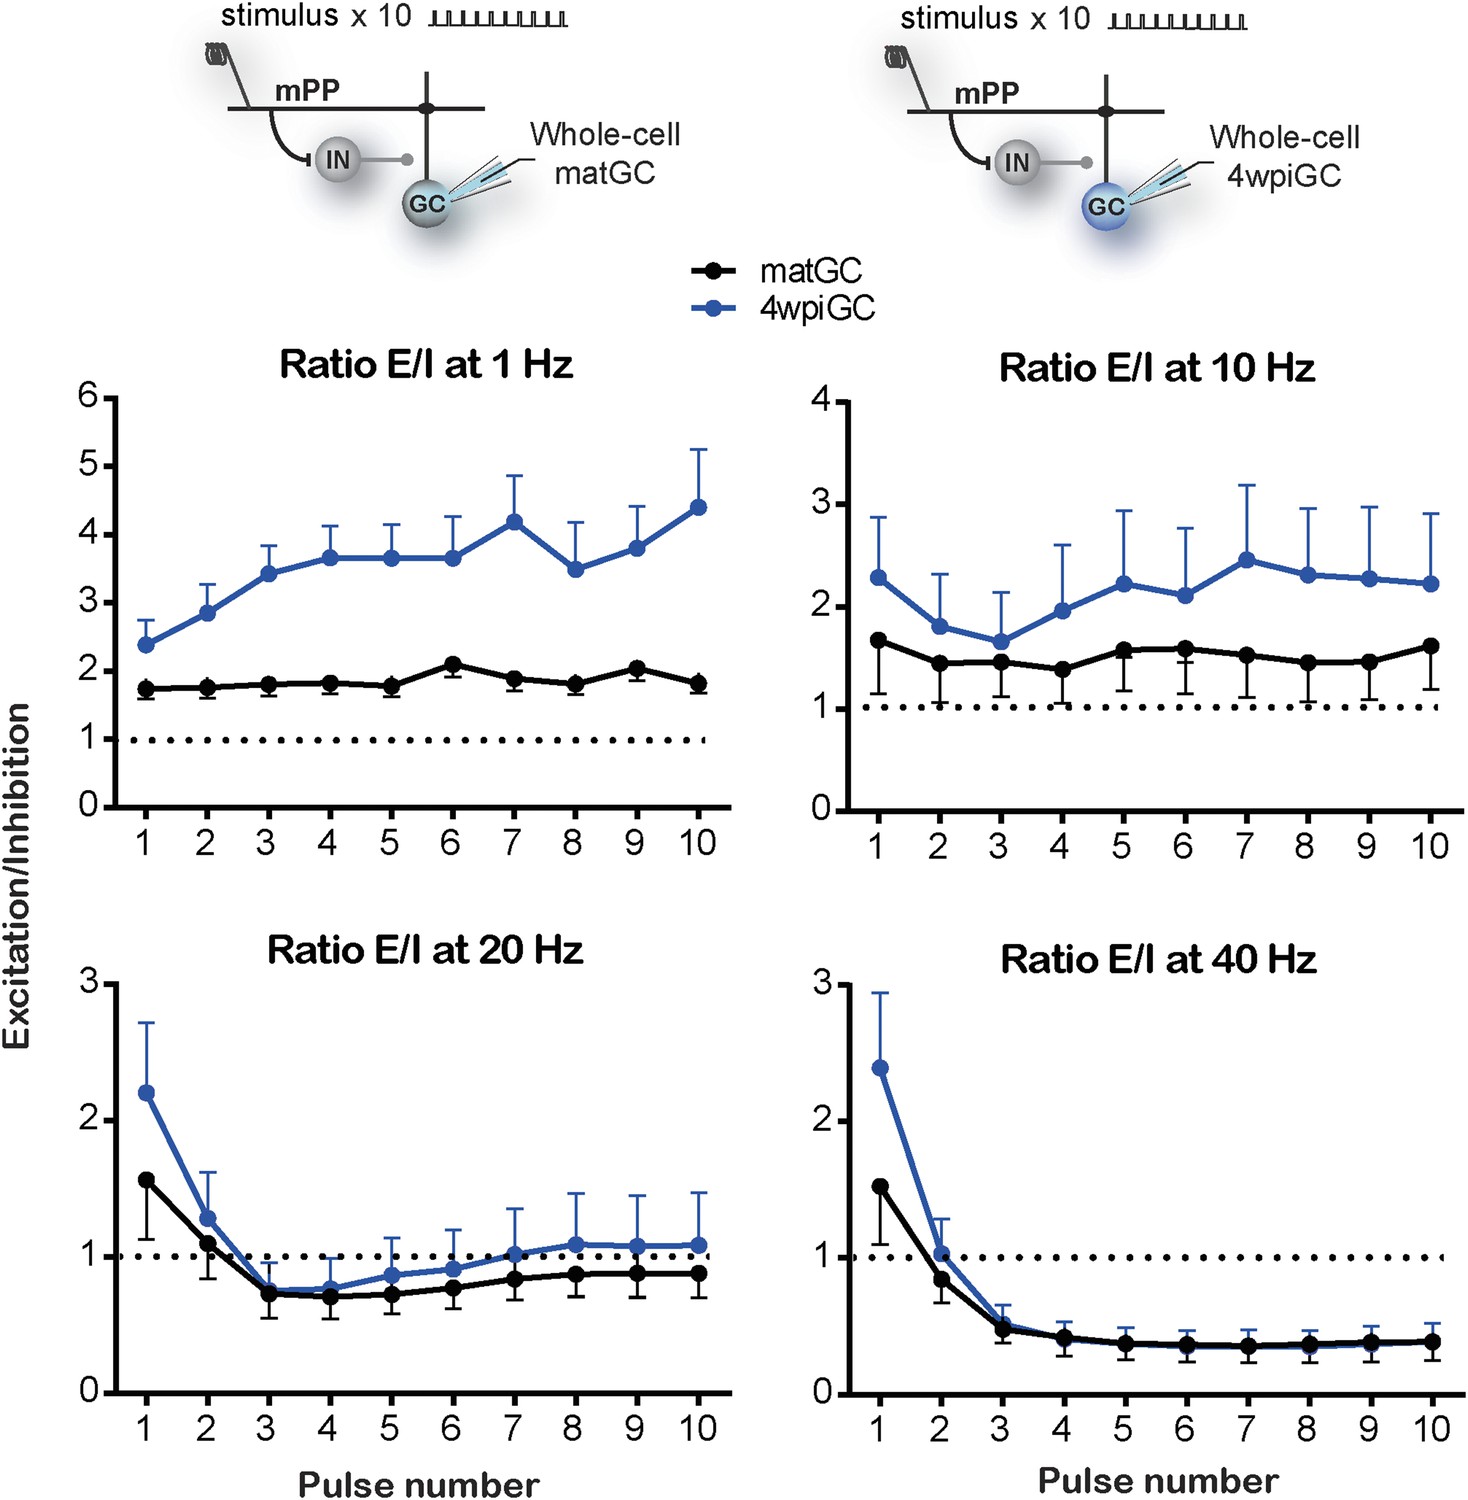
Excitation/inhibition ratios evoked by train stimulation.
Top, recording configuration. Bottom, ratios of EPSG and IPSG shown in Figure 3D, evoked after each pulse of train stimulation at 1, 10, 20, and 40 Hz for 4wpiGC (blue) and matGC (black). Dotted lines show the switch between higher excitation (above ratio = 1) and inhibition (below ratio = 1) balance. N (4wpiGC) = 9–18 cells and N (matGC) = 11–15 cells. Error bars indicate SEM.
Figure 3—figure supplement 2
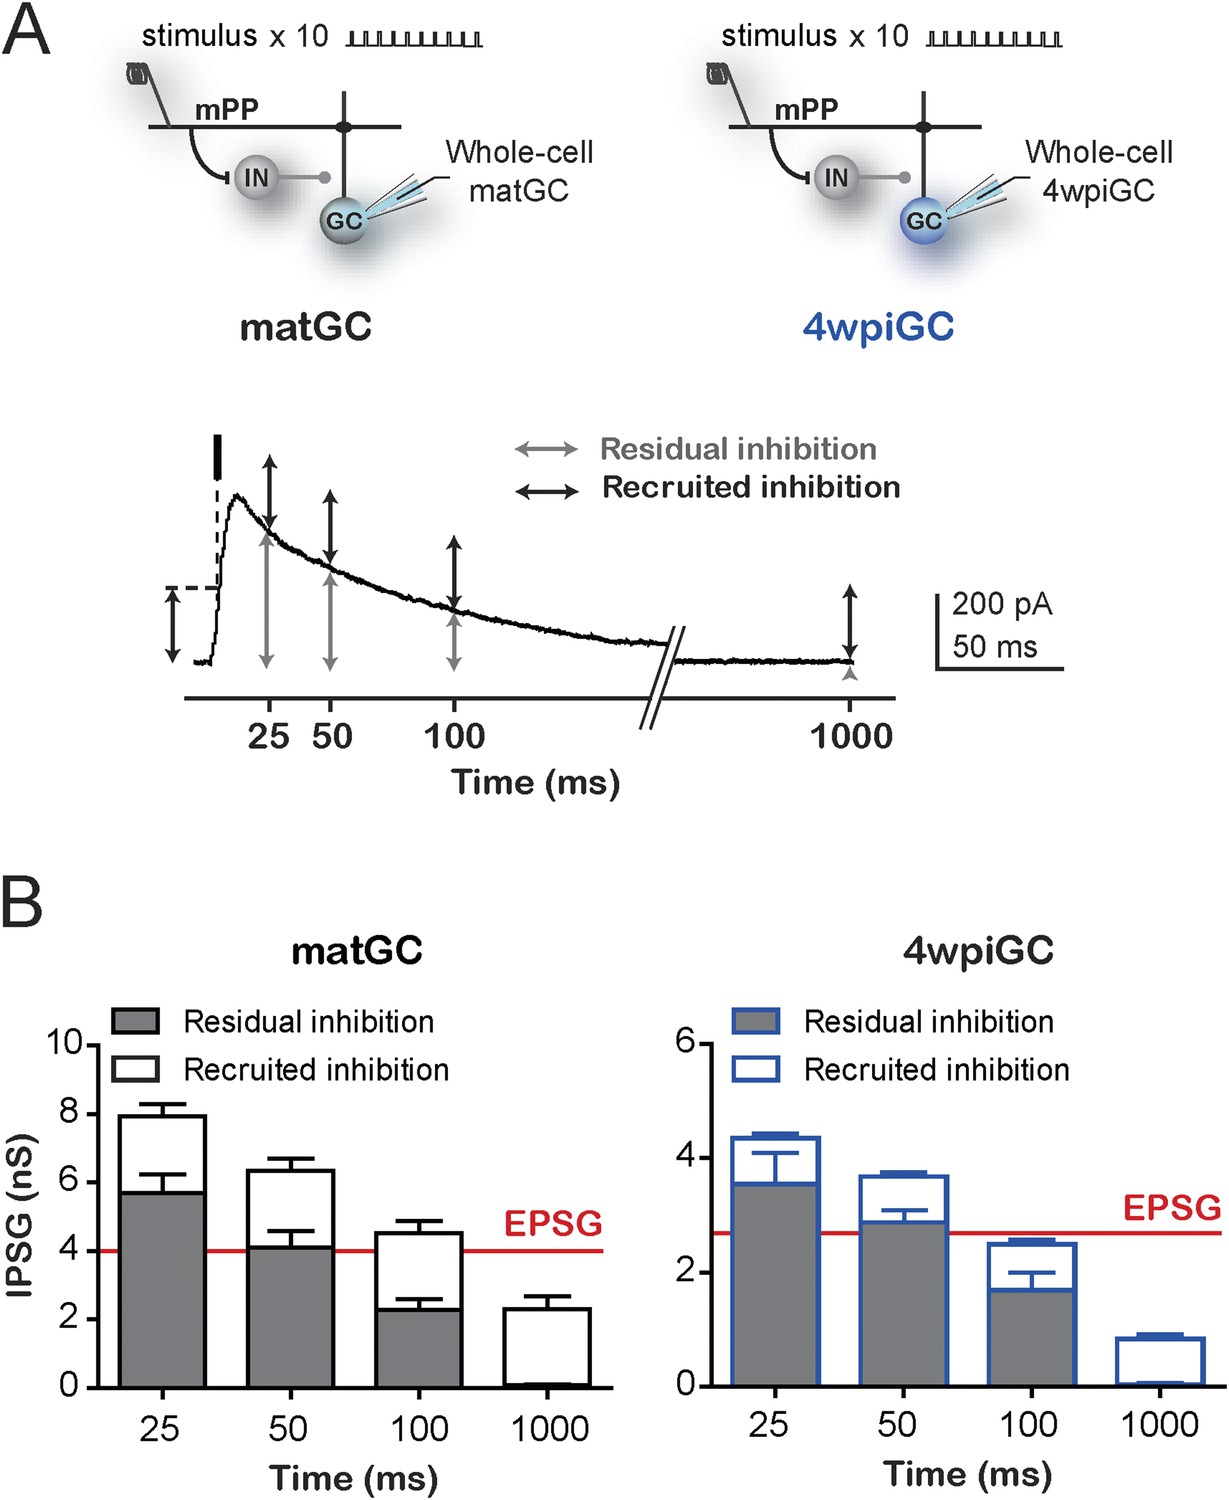
Contribution of residual and recruited inhibition in immature and mature GC.
(A) Top, recording configuration. Bottom, example trace of an IPSC to show the measurement of residual and recruited inhibition: residual inhibition (gray arrows) was measured as the remaining inhibition at 25 ms, 50 ms, 100 ms, and 1000 ms (corresponding to 40Hz, 20 Hz, 10 Hz, and 1 Hz respectively), after the first stimulation pulse at 1 Hz. Recruited inhibition (black arrows) was measured as the inhibition evoked after the stimulation pulse at the spike time (time of the peak EPSC) indicated with a black dash and dotted lines. (B) Average residual inhibition at the times related to the studied frequencies. Average recruited inhibition was plotted on top of each value and was obtained from the mean inhibition measured at 1 Hz. The red line depicts the mean EPSG of matGC and 4wpiGC. Error bars indicate SEM.
Figure 4 with 2 supplements
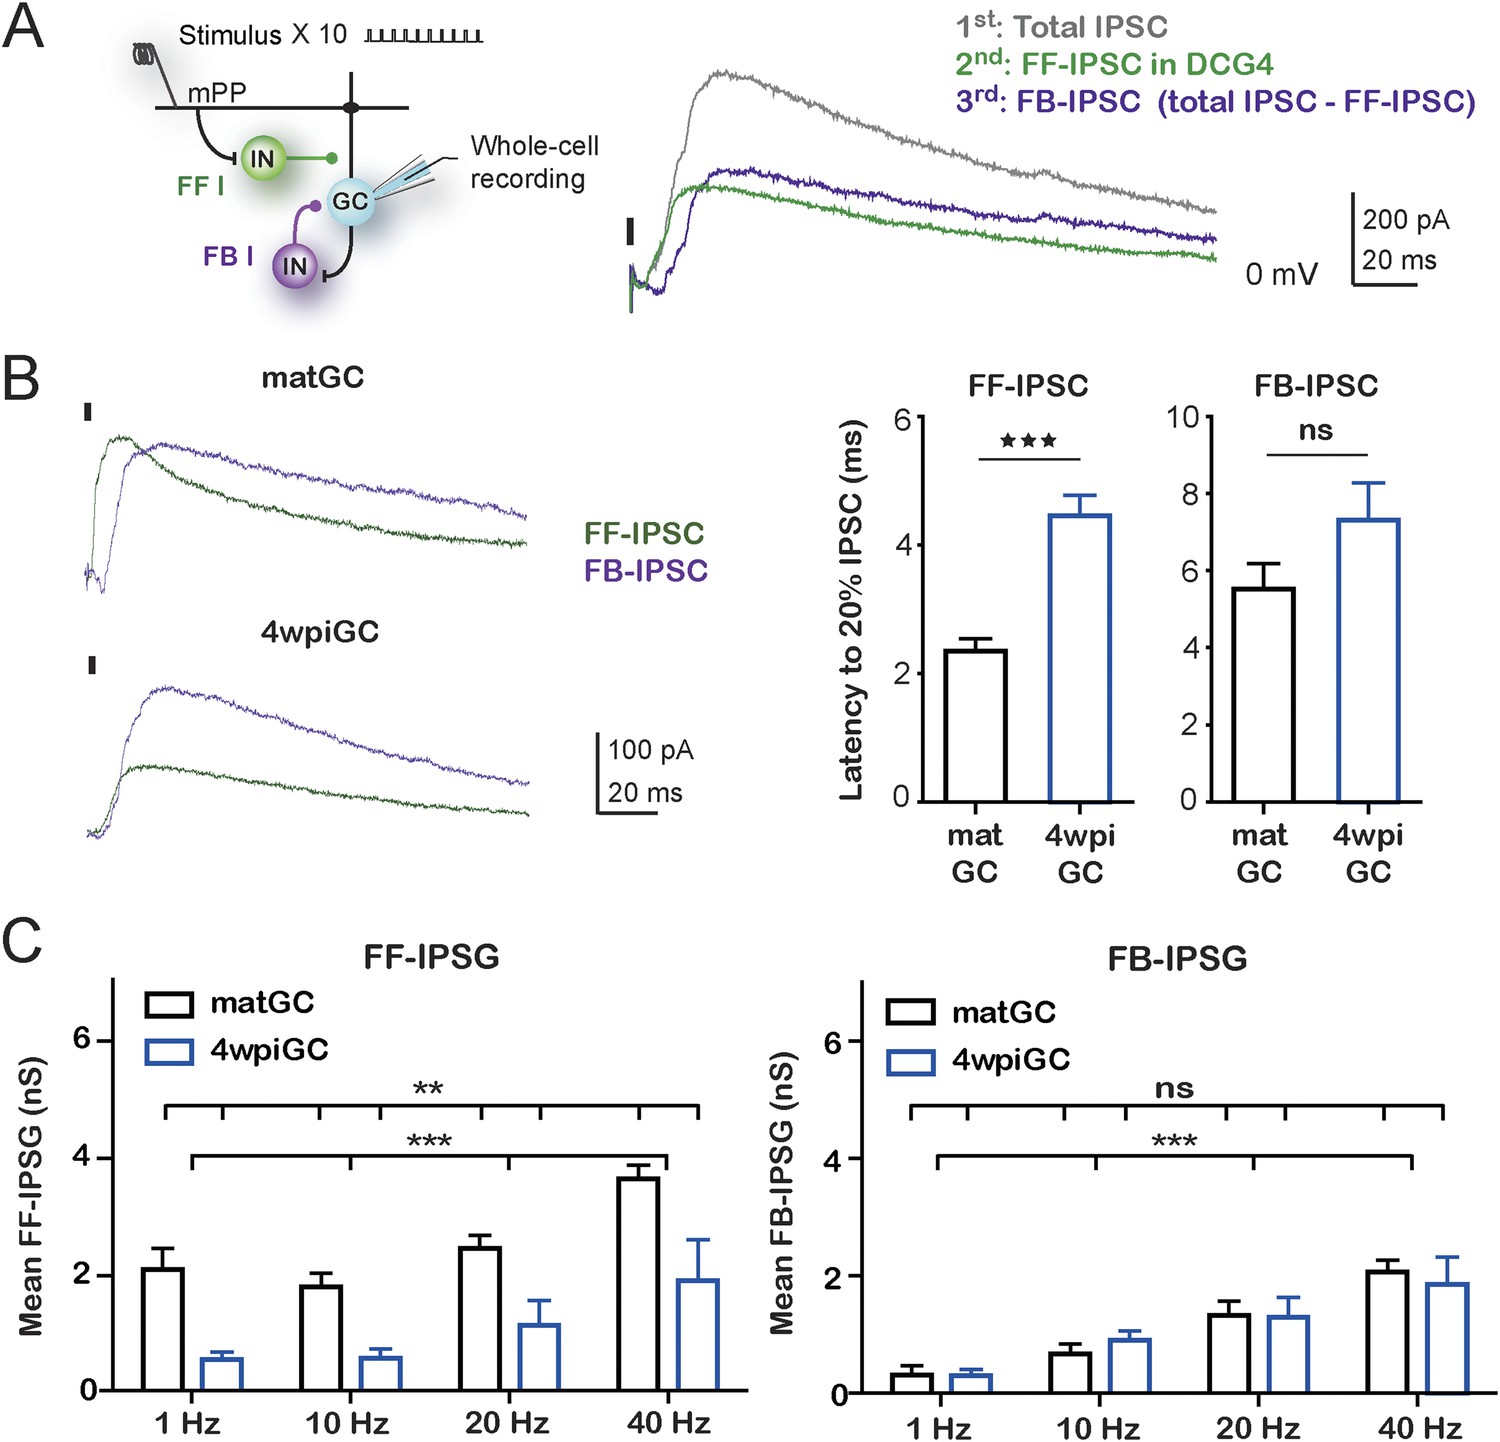
Feedforward inhibition generates differences between mature and immature GC.
(A) Recording configuration showing the activated circuit. Stimulation of mPP-activated monosynaptic excitation and feedforward inhibition (FF I, green). Feedback inhibition (FB I, purple) is recruited by the activity of GC. Right traces show inhibitory currents recorded in whole cell, voltage clamping the cell at the reversal potential of excitation (∼0 mV). The recorded total inhibitory post-synaptic current (total IPSC) obtained under control conditions is in gray. Application of DCG4 abolished feedback IPSC leaving only the feedforward IPSC (FF-IPSC, green trace). Feedback IPSC (FB-IPSC, purple trace) was measured by subtraction of the FF-IPSC from the total IPSC. (B) Left, traces from representative recordings of FF-IPSC and FB-IPSC from matGC and 4wpiGC. FF-IPSC in 4wpiGC is slower. The dash indicates the time of the stimulus. Right, average latency to reach 20% of the peak IPSC evoked by the first stimulation pulse at 1 Hz for FF and FB inhibition in matGC and 4wpiGC. The IPSC-FF is slower in 4wpiGC than in matGC (***p < 0.001, t test). The latency of the IPSC-FB did not show significant differences between 4wpiGC and matGC (ns, p > 0.05, t test). (C) Left, mean FF inhibitory postsynaptic conductance (IPSG-FF) evoked by stimulation of 10 pulses to mPP measured at the peak of the EPSC in matGC and 4wpiGC. The IPSG-FF increases with frequency and is higher in matGC than in 4wpiGC at all frequencies of stimulation (two-way ANOVA paired between frequencies; variation between GC: **p < 0.01; frequency variation. ***p < 0.001; interaction: ns, p > 0.05). Right, mean FB inhibitory postsynaptic conductance (IPSG-FB) evoked by stimulation of 10 pulses to mPP measured at the peak of the EPSC in matGC and 4wpiGC. The IPSG-FB shows no differences between matGC and 4wpiGC, but increases in both GC with frequency (two-way ANOVA paired between frequencies; variation between GC: ns, p > 0.05; variation between frequencies. ***p < 0.001; interaction: ns, p > 0.05). N (4wpiGC) = 6–7 cells, N (matGC) = 10–11 cells, in the four frequencies. Error bars indicate SEM. Stimulation artifacts were erased from traces for better visualization.
Figure 4—figure supplement 1
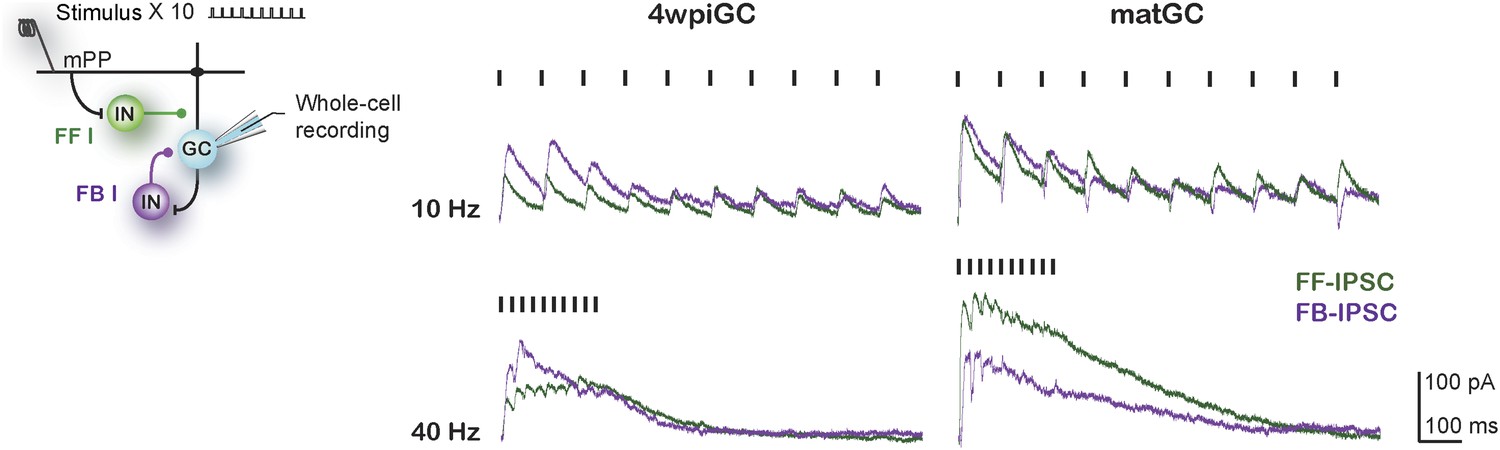
Feedforward and feedback inhibition recruited by train stimulation.
Left: recording configuration showing the activated circuit. Stimulation of mPP activated monosynaptic excitation and feedforward inhibition (FF I, green). Feedback inhibition (FB I, purple) is recruited by the activity of GC. Right: representative traces show feedforward inhibitory postsynaptic currents (FF-IPSC, green) and feedback IPSC (FB-IPSC, purple) recorded in whole-cell voltage clamp at ∼0 mV, after train pulses at 10 and 40 Hz, for a 4wpiGC and a matGC, as shown in Figure 4A. Dashes indicate stimuli. Stimulation artifacts were erased from traces for better visualization.
Figure 4—figure supplement 2
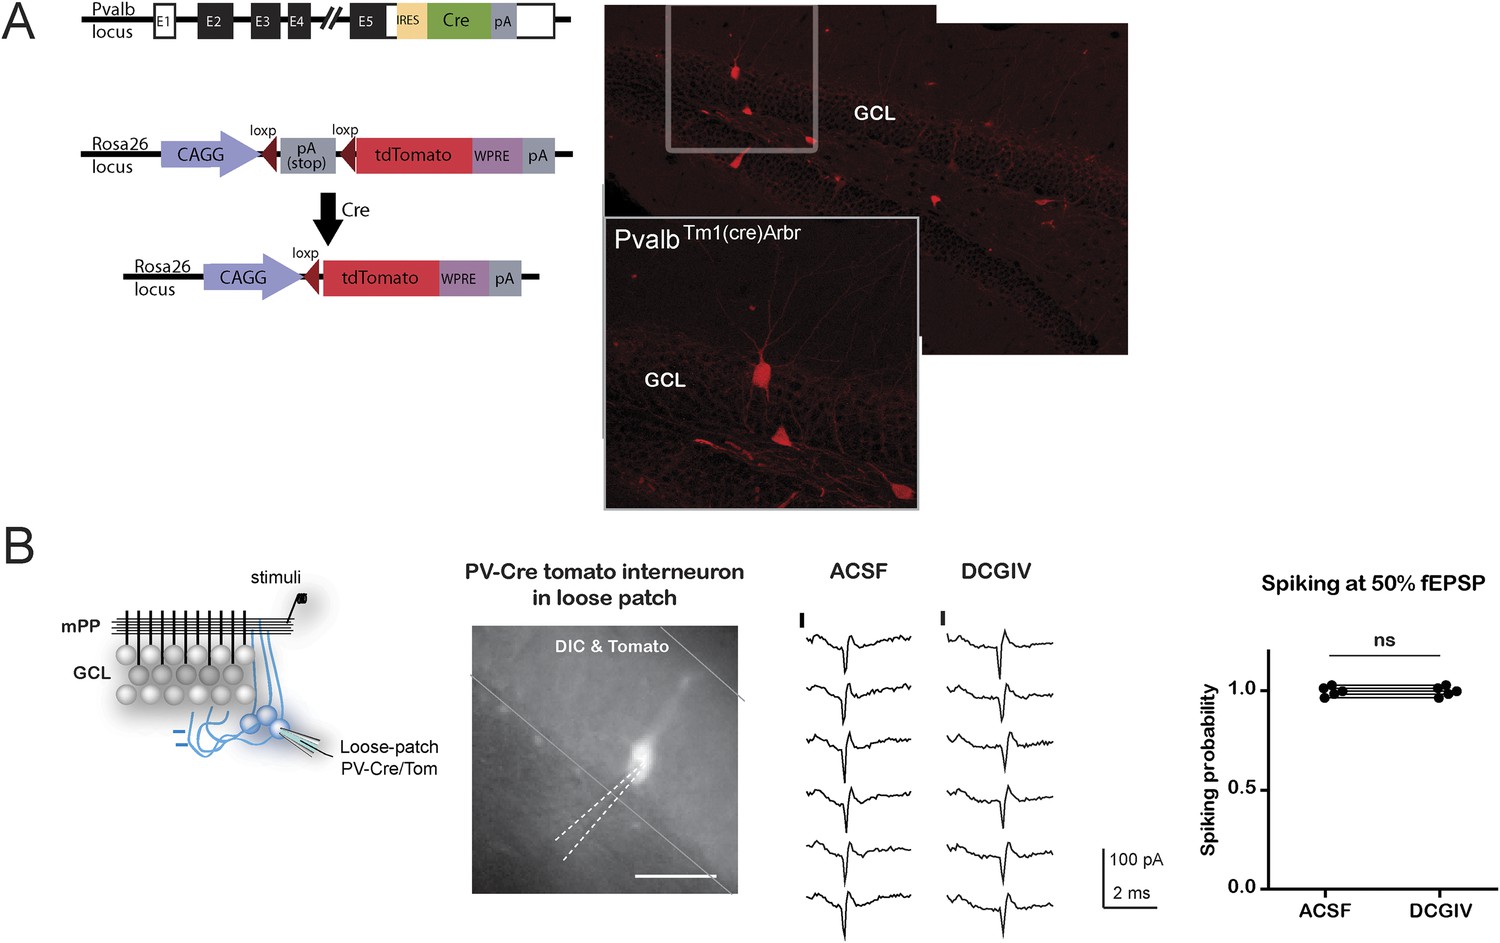
Response of PV+ interneurons to mPP stimulation is not affected with DCG4.
(A) Left, the scheme shows the crossing to obtain adult PVCre; CAGfloxStopTom (PV-Tom) mice. Right, confocal images of dentate gyrus (DG) from hippocampal slices obtained from PV-Tom animals. (B) Left, recording configuration. A stimulating electrode was placed to stimulate mPP and loose patch recordings were performed in PV-Tom+ interneurons from the DG. DIC image with a fluorescent PV-Tom interneuron with a loose patch pipette and delineation of the GCL. Scale bar: 50 µm. Right, representative traces showing the evoked spikes from a PV interneuron in control conditions and after the application of DCG4 at 50% fEPSP input strength. The graph shows the spiking probability in control conditions and after the application of DCG4 for five PV interneurons. The spiking probability does not change with DCG4 (ns, paired t test, p > 0.05).
Figure 5
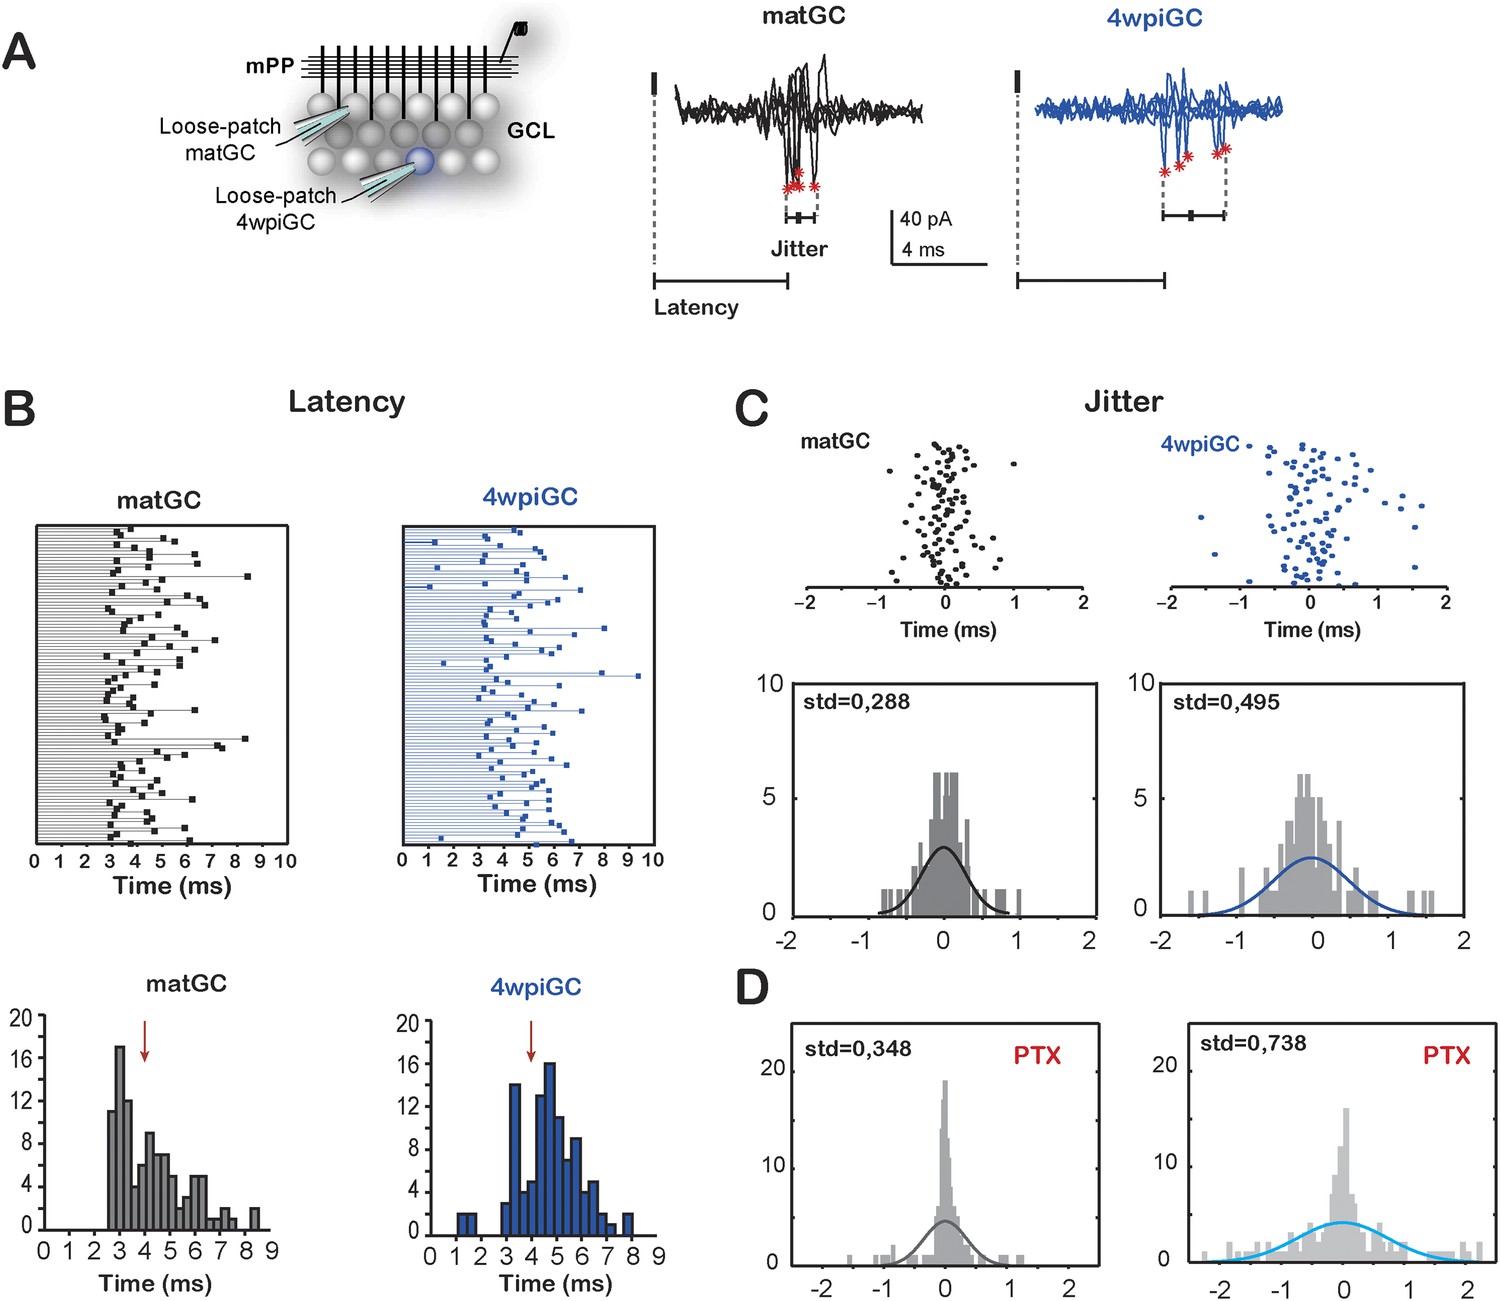
Temporal fidelity in mature and immature GC
(A) Recording configuration. Left, the mPP was stimulated at an intensity of 50% fEPSP. Recordings were performed from 4wpiGC and matGC in loose patch configuration. Right, representative traces of evoked action potentials in response to stimulation of the mPP. The latency from the stimulation artifact to action potentials (asterisks) and spiking jitter and were calculated for matGC (black) and 4wpiGC (blue). (B) Top, latencies measured in 100 spikes from matGC (black) and 4wpiGC (blue). Bottom, distribution of latencies binned along 20 bins. The red arrow denotes the average pop spike time of all included experiments (4.36 ± 0.19 ms). (C) Top, jitter measured as the time of action potential occurrence relative to the mean spike timing of 3–5 trials. Bottom, jitter distribution in matGC and 4wpiGC; solid lines represent a normal fitting lines. Distribution is wider in 4wpiGC than in matGC (p < 0.001, two-sample F-test for equal variances). N (matGC) = 114 spikes from 8 cells; N (4wpiGC) = 96 spikes from 6 cells. Std: standard deviation. (D) Jitter distribution in matGC and 4wpiGC in the presence of picrotoxin (PTX); solid lines represent normal fitting lines. Distribution is wider in 4wpiGC than in matGC (p < 0.001, two-sample F-test for equal variances) and is wider in the presence of PTX for both matGC (p < 0.05, two-sample F-test for equal variances) and 4wpiGC (p < 0.001, two-sample F-test for equal variances). N (matGC) = 142 spikes of 9 cells; N (4wpiGC) = 170 spikes from 10 cells.
Download links
A two-part list of links to download the article, or parts of the article, in various formats.
Downloads (link to download the article as PDF)
Open citations (links to open the citations from this article in various online reference manager services)
Cite this article (links to download the citations from this article in formats compatible with various reference manager tools)
Differential inhibition onto developing and mature granule cells generates high-frequency filters with variable gain
eLife 4:e08764.
https://doi.org/10.7554/eLife.08764


