Maternally provided LSD1/KDM1A enables the maternal-to-zygotic transition and prevents defects that manifest postnatally
- Emory University School of Medicine, United States
- Emory University, United States
- National Institutes of Health, United States
- Howard Hughes Medical Institute, The Salk Institute for Biological Studies, United States
- The Salk Institute for Biological Studies, United States
Figures
Figure 1 with 2 supplements
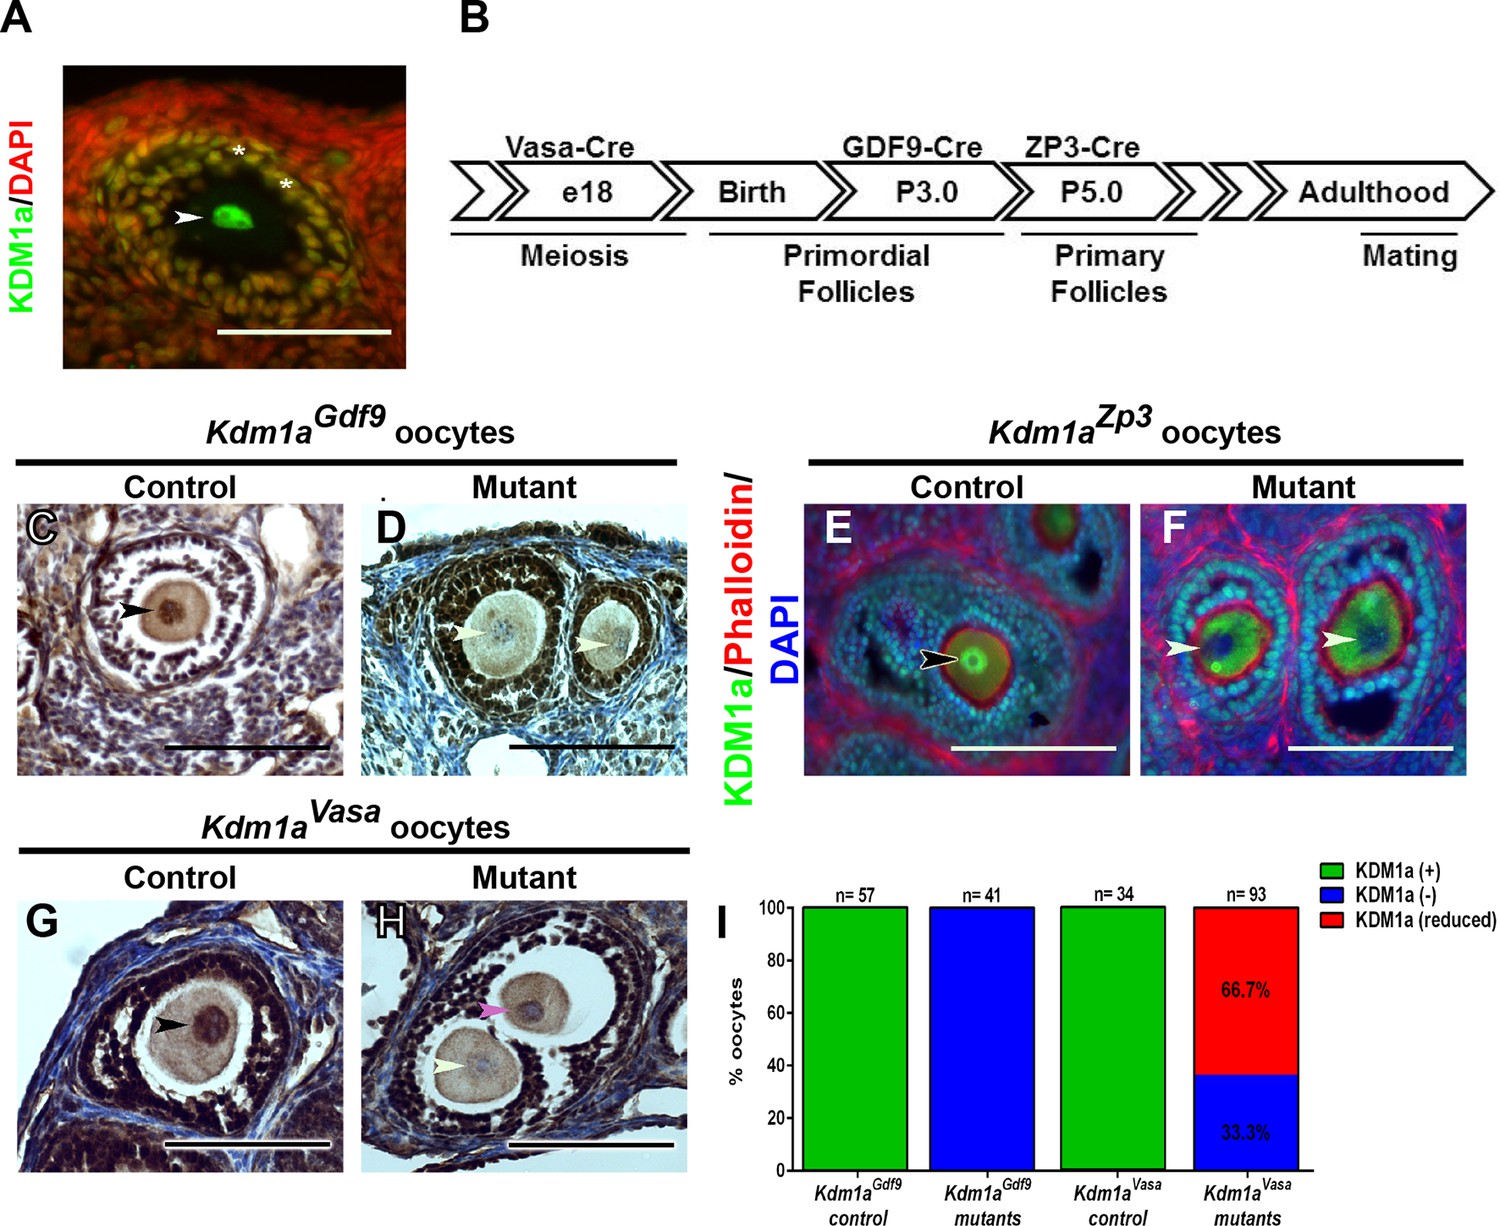
Maternal expression and coditional deletion of Kdm1a in mouse oocytes.
(A) Wild-type mouse oocyte nucleus (white arrowhead) and surrounding follicle cells (white asterisks) stained with anti-KDM1A (green) antibody and DAPI (red). (B) Developmental timeline of maternal Cre expression (Vasa-Cre, Gdf9-Cre and Zp3-Cre transgenes) and corresponding oogenesis stages. (C,D) Immunohistochemistry (IHC) with anti-KDM1A (brown) antibody and hematoxylin (blue) showing KDM1A nuclear expression (black arrowhead) and absence of expression (white arrowheads) in Kdm1aGdf9 control (C) and mutant (D) oocytes. (E,F) Immunofluorescence (IF) with anti-KDM1A (green) antibody, phalloidin (red) and DAPI (blue) showing KDM1A nuclear expression (black arrowhead) and absence of expression (white arrowheads) in Kdm1aZp3 control (E) and mutant (F) oocytes. (G,H) IHC with anti-KDM1A (brown) antibody and hematoxylin (blue) showing KDM1A nuclear expression (black arrowhead), absence of expression (white arrowhead) and reduced expression (pink arrowhead) in Kdm1aVasa control (G) and mutant (H) oocytes. (I) Percentage of oocytes with KDM1A (green), reduced KDM1A (red) or no KDM1A blue) staining in Kdm1aGdf9 and Kdm1aVasa heterozygous control versus mutant oocytes. Scale bars represent 50 μm. n=number of oocytes analyzed with percentages indicated for each category.
Figure 1—figure supplement 1
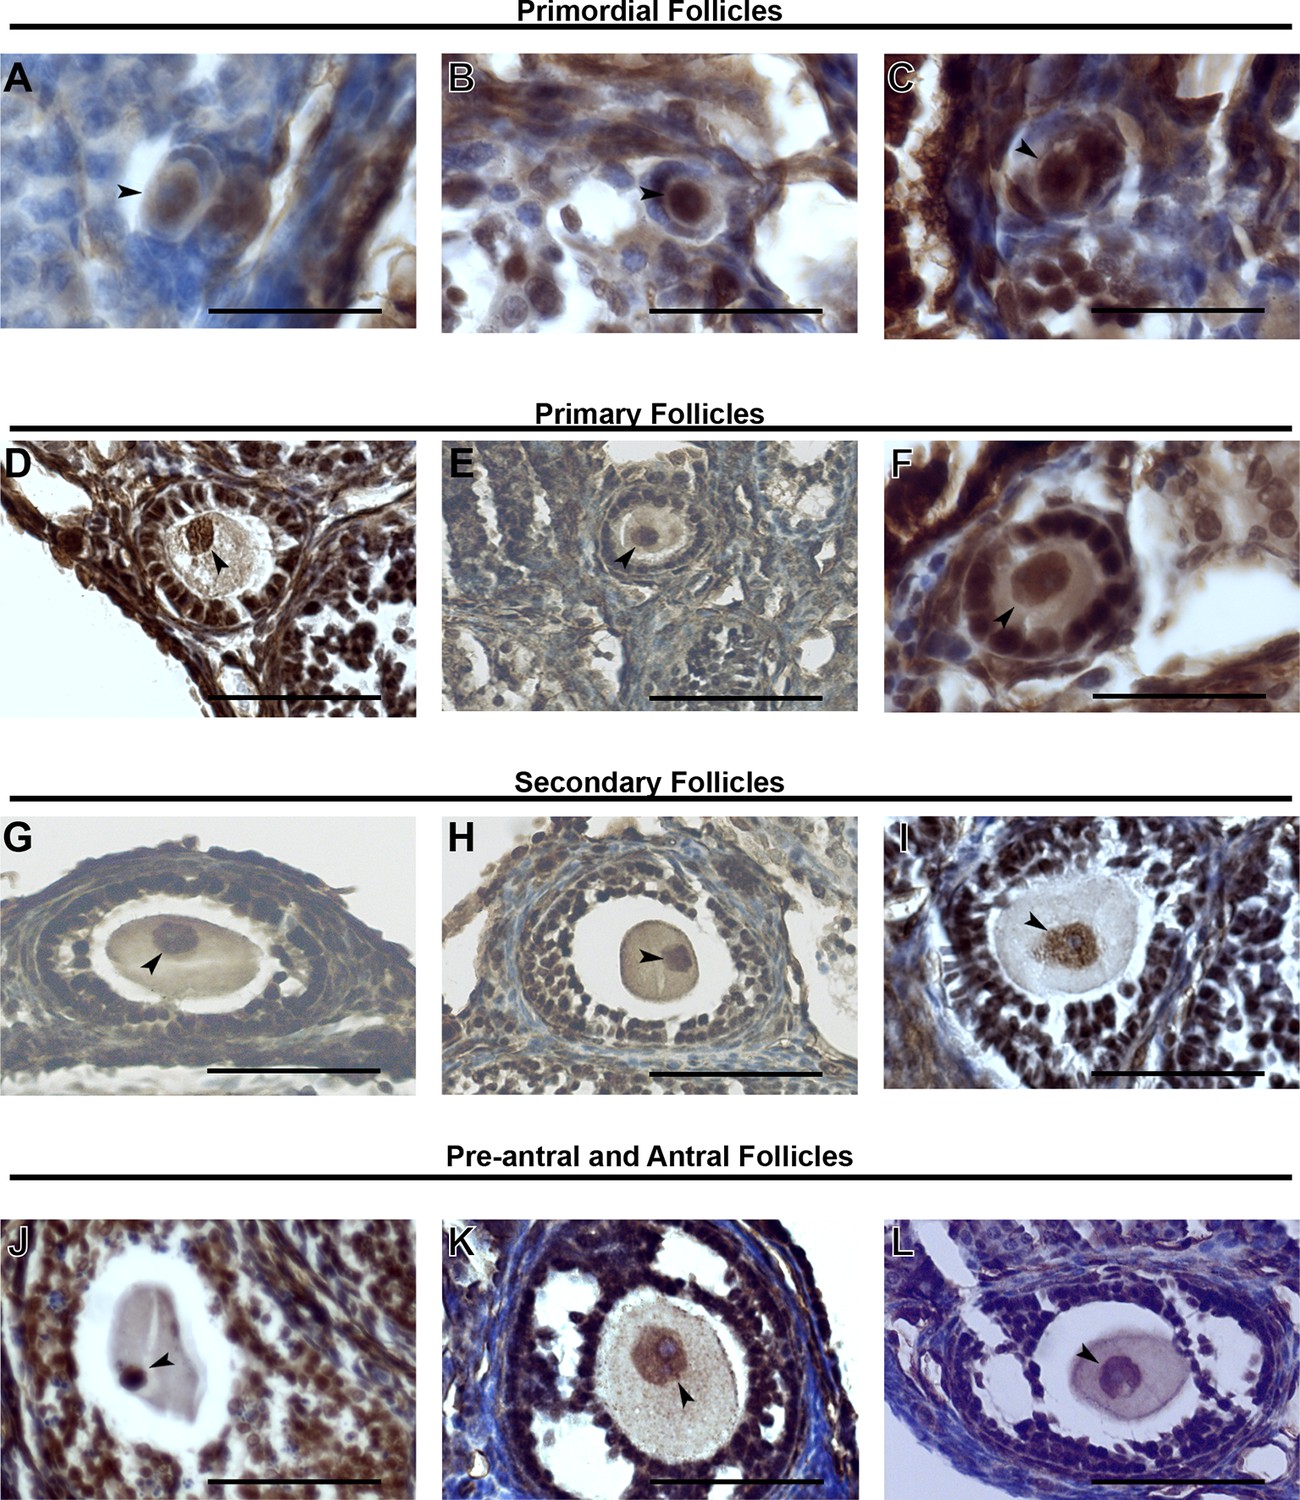
KDM1A expression in stged oocytes.
(A–L) Immunohistochemistry (IHC) of primordial follicles (A–C), primary follicles (D–F), secondary follicles (G-I) and pre-antral and antral follicles (J–L) stained with anti-KDM1A(brown) antibody and hematoxylin (blue). The oocyte nucleus is indicated with black arrowheads. Scale bars represent 50 μm.
Figure 1—figure supplement 2
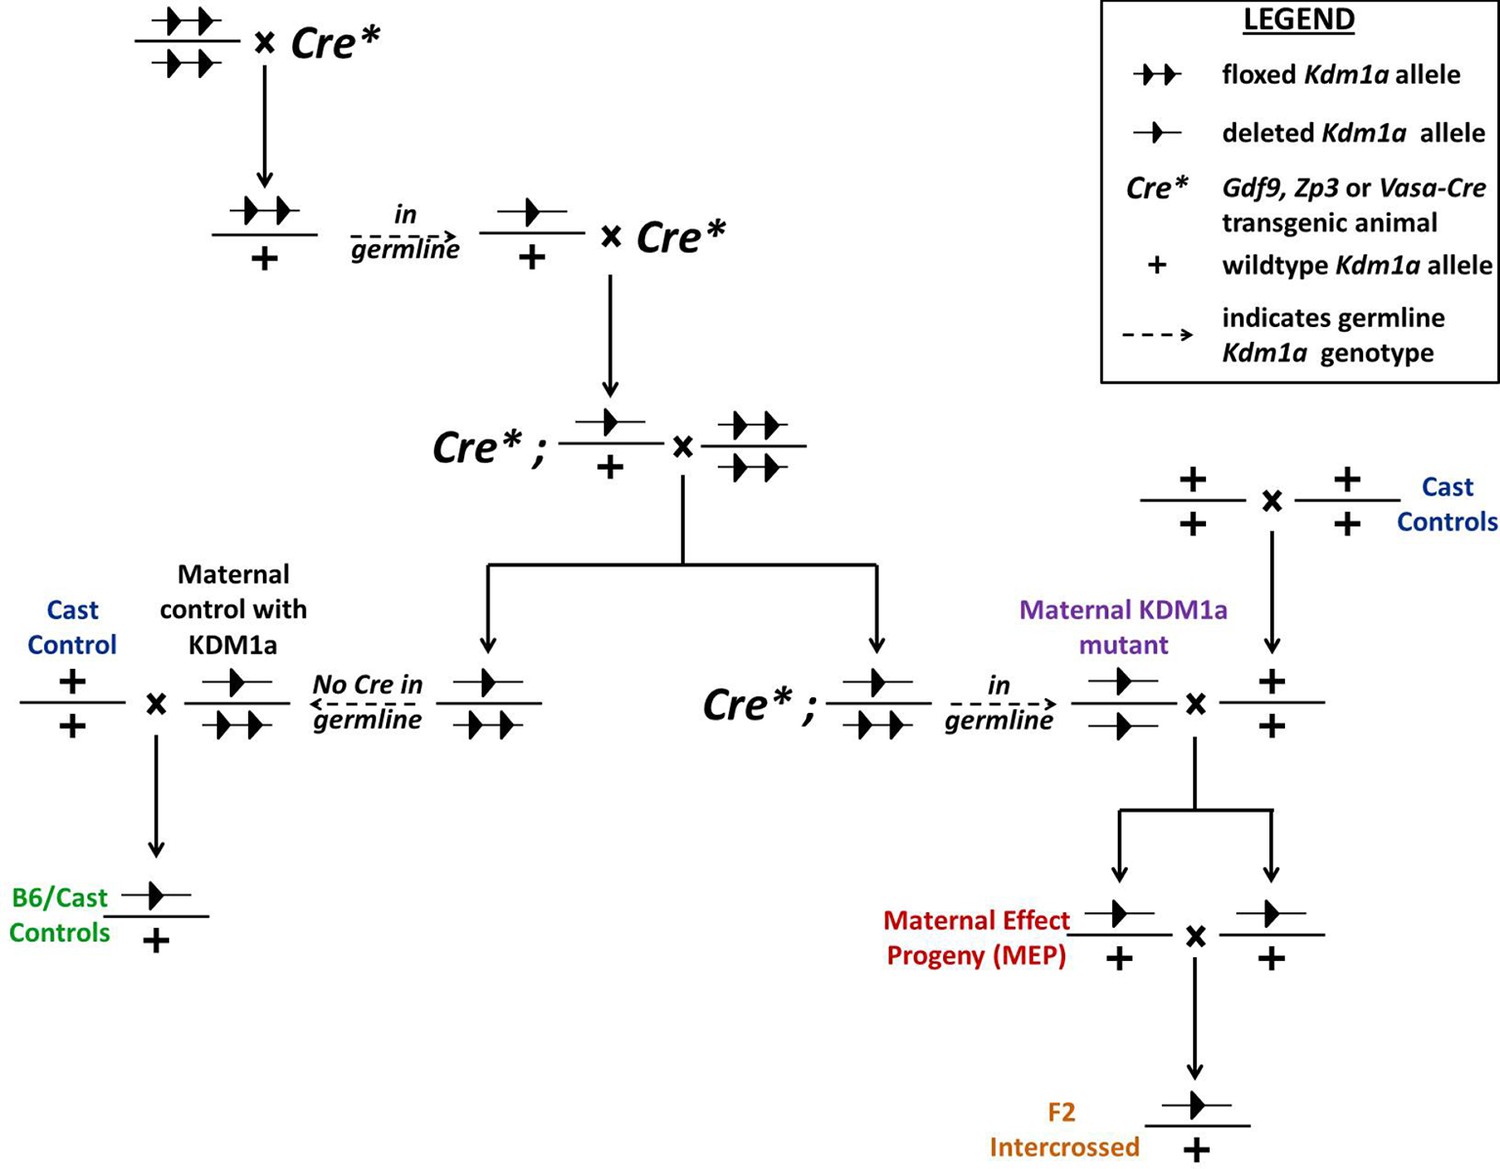
Generation of Kdm1a mutant and control animals.
Kdm1a animals were generated by crossing multiple generations of Kdm1afl/fl animals with either Gdf9-, Zp3-, or Vasa-Cre transgenic animals. Blue indicates Mus castaneus control animals. Purple indicates Kdm1a mutant females. Green indicates B6/Cast hybrid control progeny. Red indicates Kdm1a maternal effect progeny (MEP). Orange indicates progeny resulting from intercrossing 2 MEP adult animals. All labelled progeny were used in crosses and assays presented in subsequent figures (color-coding matches animals used and graphed in each figure).
Figure 2 with 1 supplement
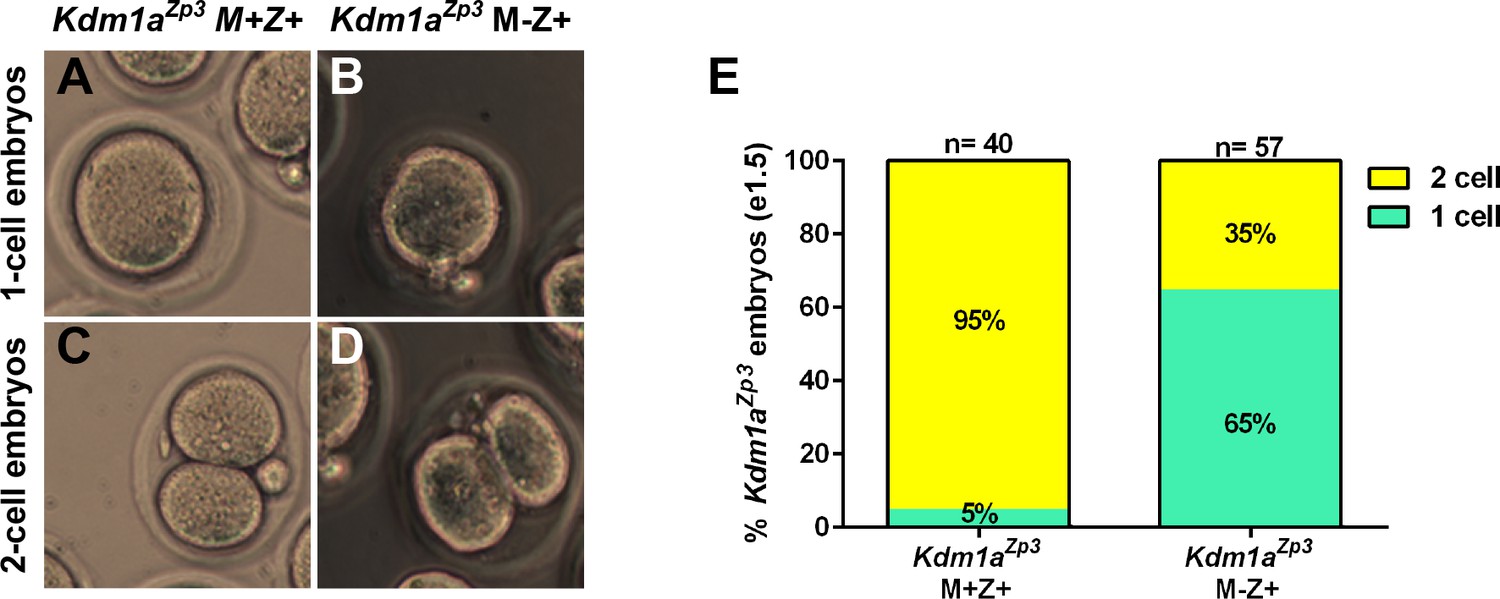
Kdm1aZp3 embryos arrest at the 1–2 cell stage.
(A–D) Brightfield images of (A,C) M+Z+ and (B,D) M-Z+ 1- and 2-cell embryos derived from Kdm1aZp3 control and mutant mothers at e1.5. (E) Percentage of 1-cell (green) and 2-cell (yellow) embryos derived from Kdm1aZp3 control and mutant mothers at e1.5. n = 40 for Kdm1aZp3 M+Z+ embryos from 3 litters. n = 57 for Kdm1aZp3 M-Z+ embryos from 6 litters.
Figure 2—figure supplement 1
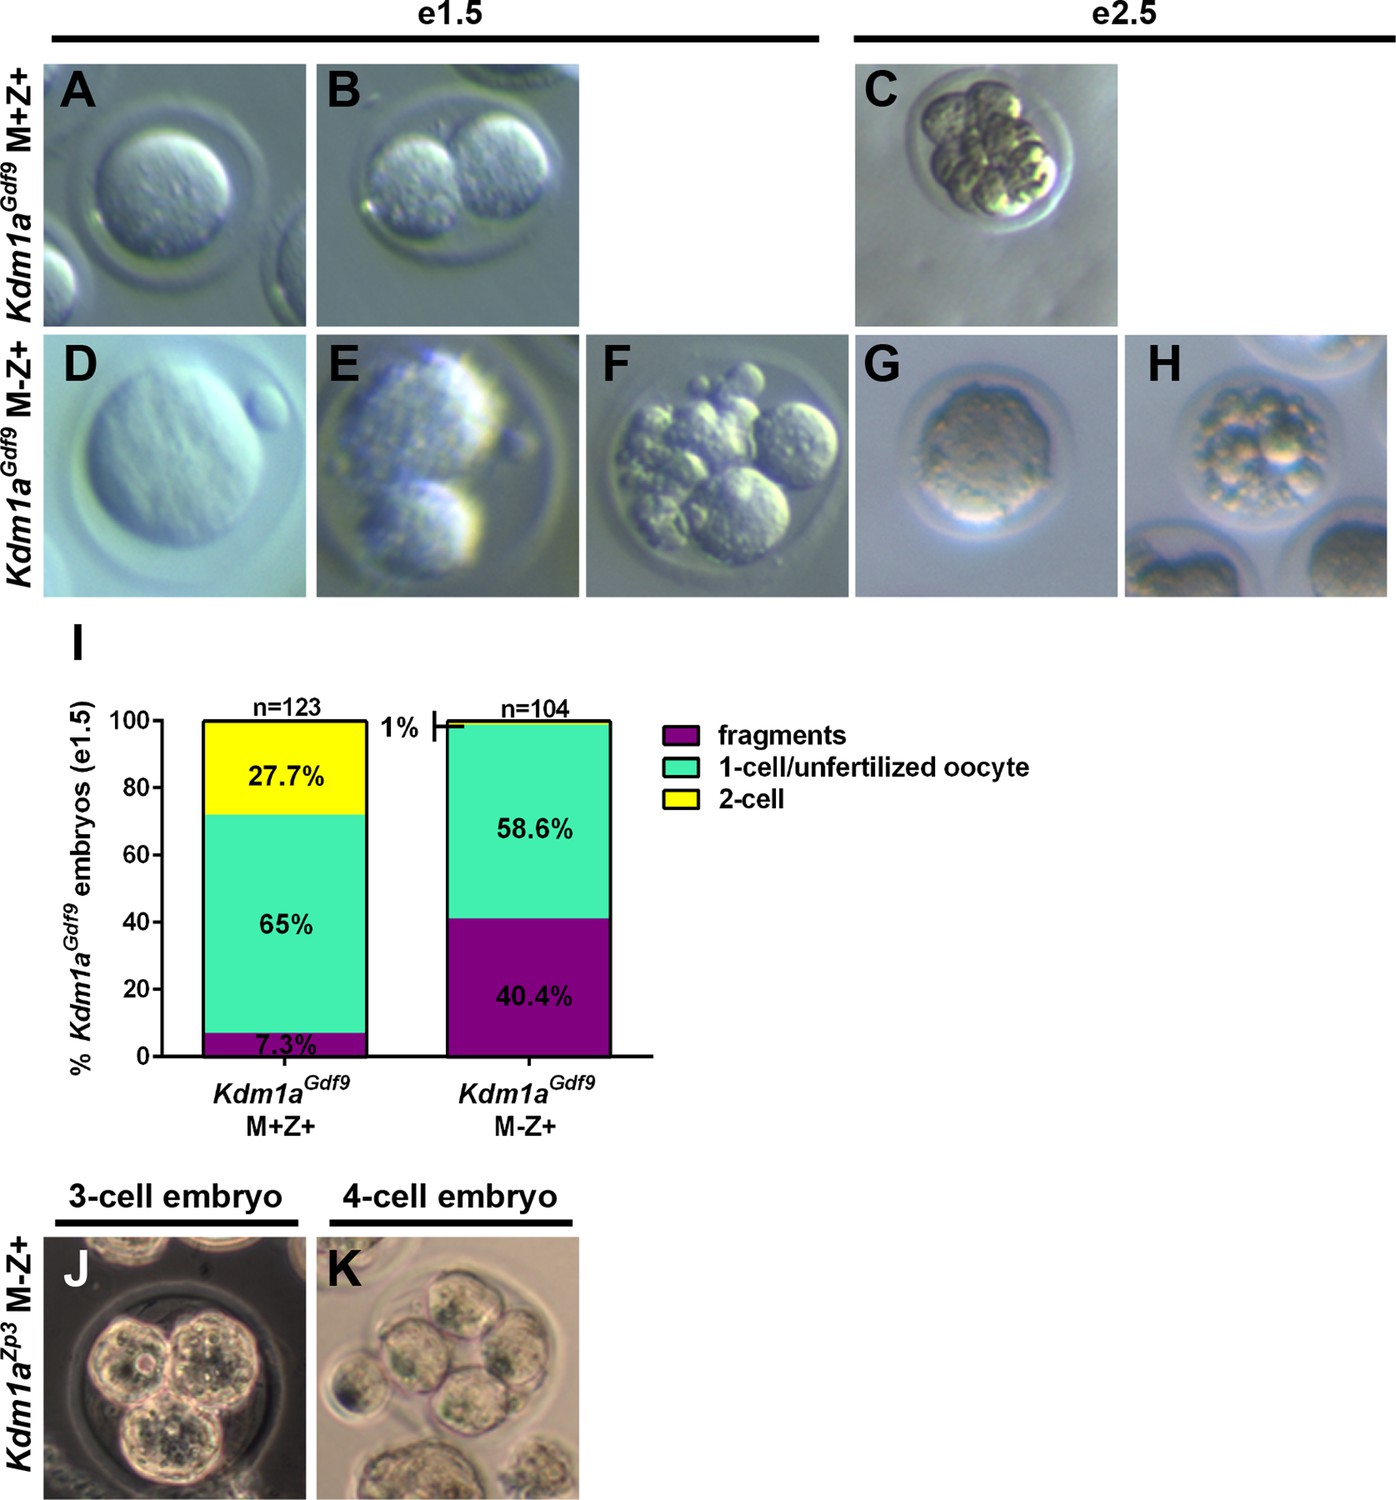
Lack of normal Kdm1aGdf9 and Kdm1aZp3 embryos at embryonic day 1.5 and 2.5.
(A,B,D,E,F) Brightfield images of embryonic day 1.5 (e1.5) M+Z+ 1-cell (A) and 2-cell (B) embryos and M-Z+ 1-cell (D), 2-cell (E), and fragmented (F) embryos derived from Kdm1aGdf9 control and mutant mothers. (C,G,H) Brightfield images of e2.5 M+Z+ 8-cell (C) embryo and M-Z+ abnormal 1-cell (G), and fragmented (H) embryos derived from Kdm1aGdf9 control and mutant mothers. (I) Percentage of fragmented (purple), unfertilized oocyte or 1C (green), and 2C (yellow) embryos from Kdm1aGdf9 control and mutant mothers. n = 123 for Kdm1aGdf9 M+Z+ control embryos from 8 litters. n = 104 for Kdm1aGdf9 M-Z+ embryos from 8 litters. (J) Brightfield image of 3-cell M-Z+ embryo derived from a Kdm1aZp3 mutant mother. (K) Brightfield image of 4-cell M-Z+ embryo derived from a Kdm1aZp3 mutant mother.
Figure 3 with 5 supplements
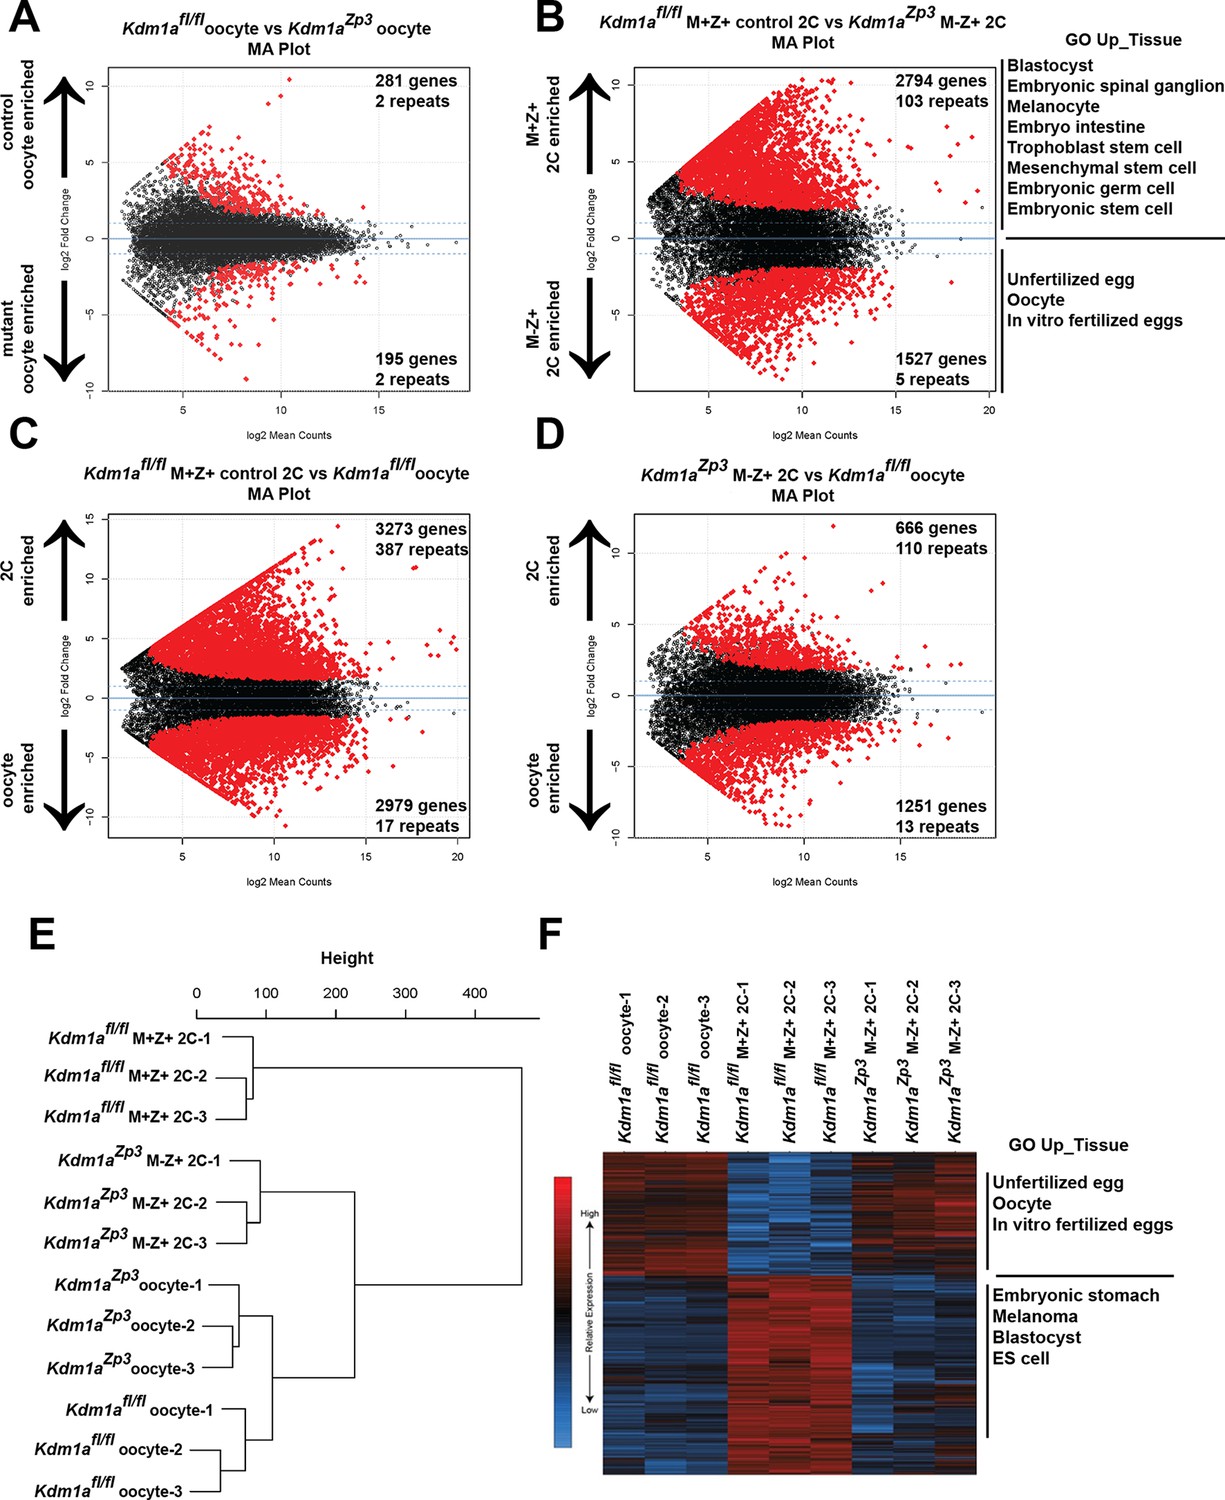
The MZT is impaired in Kdm1aZp3 mutants.
(A,B) Differential expression of mRNAs in Kdm1afl/fl versus Kdm1aZp3 oocytes (A) or Kdm1afl/fl M+Z+ versus Kdm1aZp3 M-Z+ 2C embryos (B) as determined by RNA-seq. Genes/repeats highlighted in red are significant with the number of significant gene/repeats show. GO enrichment using the Up_tissue database was performed on Kdm1afl/fl M+Z+ 2C enriched and Kdm1aZp3 M-Z+ 2C enriched mRNAs, with a list of the most enriched categories displayed. (C,D) Differential expression of mRNAs in Kdm1afl/fl M+Z+ 2C embryos versus Kdm1afl/fl oocytes (C) or Kdm1aZp3 M-Z+ 2C embryos versus Kdm1afl/fl oocytes (D). The numbers of zygotically activated (2C enriched) genes/repeats and zygotically repressed (oocyte enriched) genes/repeats are highlighted in each comparison. (E) Hierarchical cluster dendrogram of transcriptomes in Kdm1afl/fl oocytes, Kdm1aZp3 oocytes, Kdm1afl/fl M+Z+ 2C embryos, and Kdm1aZp3 M-Z+ 2C embryos. (F) Heat map of gene expression of principal component 1 (PC1) genes in Kdm1afl/fl oocytes, Kdm1afl/fl M+Z+ 2C embryos, and Kdm1aZp3 M-Z+ 2C embryos. The most GO Up_tissue enriched terms are displayed for the 2 categories of PC1 genes.
-
Figure 3—source data 1
Gene Table comparison of Kdm1afl/fl oocytes and Kdm1aZp3 oocytes.
Deseq output for expression of genes used for pairwise comparisons. Column labeled a represents average normalized expression of Kdm1afl/fl control oocytes and b represents average normalized expression of Kdm1aZp3 mutant oocytes.
- https://doi.org/10.7554/eLife.08848.009
-
Figure 3—source data 2
Gene Table comparison of Kdm1aZp3 M+Z+ 2C and Kdm1aZp3 M-Z+ 2C embryos.
Deseq output for expression of genes used for pairwise comparisons. Column labeled a represents average normalized expression of Kdm1aZp3 M+Z+ 2C embryos and b represents average normalized expression of Kdm1aZp3 M-Z+ 2C embryos.
- https://doi.org/10.7554/eLife.08848.010
-
Figure 3—source data 3
Gene Table comparison of Kdm1aZp3 M+Z+ 2C and Kdm1afl/fl oocytes.
Deseq output for expression of genes used for pairwise comparisons. Column labeled a represents average normalized expression of Kdm1aZp3 M+Z+ 2C embryos and b represents average normalized expression of Kdm1afl/fl control oocytes.
- https://doi.org/10.7554/eLife.08848.011
-
Figure 3—source data 4
Gene Table comparison of Kdm1aZp3 M-Z+ 2C and Kdm1afl/fl oocytes.
Deseq output for expression of genes used for pairwise comparisons. Column labeled a represents average normalized expression of Kdm1aZp3 M-Z+ 2C embryos and b represents average normalized expression of Kdm1afl/fl control oocytes.
- https://doi.org/10.7554/eLife.08848.012
Figure 3—figure supplement 1

The MZT is impaired in Kdm1aZp3 mutants.
(A–H) Differential expression of mRNAs in Kdm1afl/fl versus Kdm1aZp3 oocytes (A,E), Kdm1afl/fl M+Z+ versus Kdm1aZp3 M-Z+ 2C embryos (B,F), Kdm1afl/fl M+Z+ 2C embryos versus Kdm1afl/fl oocytes (C,G), and Kdm1aZp3 M-Z+ 2C embryos versus Kdm1afl/fl oocytes (D,H) as determined by RNA-seq. Differential expression represented in mean difference plots (A–D) and normalized FPKM values on XY scatter plots (E–H). Genes/repeats highlighted in red are significant.
Figure 3—figure supplement 2

Principal component analysis of Kdm1aZp3 2C embryos.
(A) Principal Component 1 is plotted on x-axis and Principal Component 2 is plotted on y-axis. Variance due to each component for Kdm1aZp3 M-Z+ 2C embryos (red), Kdm1afl/fl M+Z+ 2C embryos (green), and Kdm1afl/fl oocytes (purple) are shown.
Figure 3—figure supplement 3
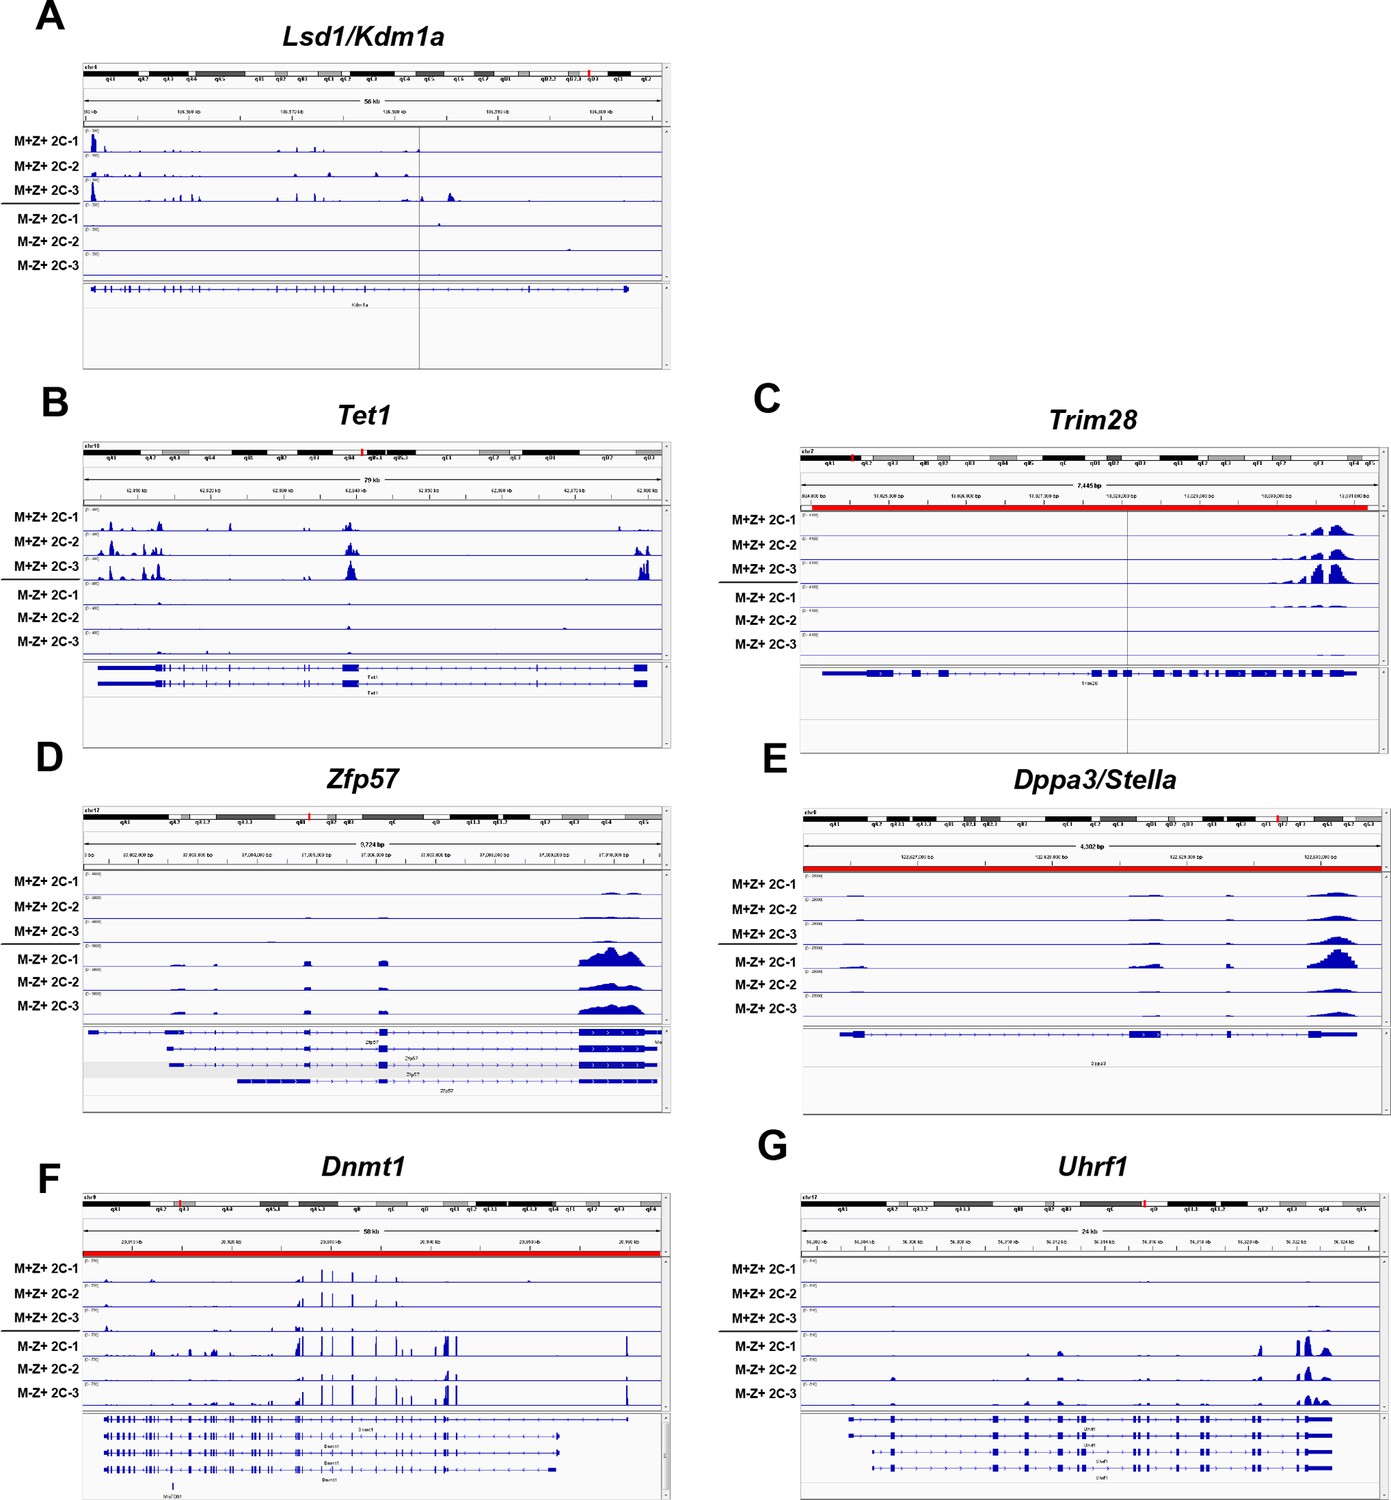
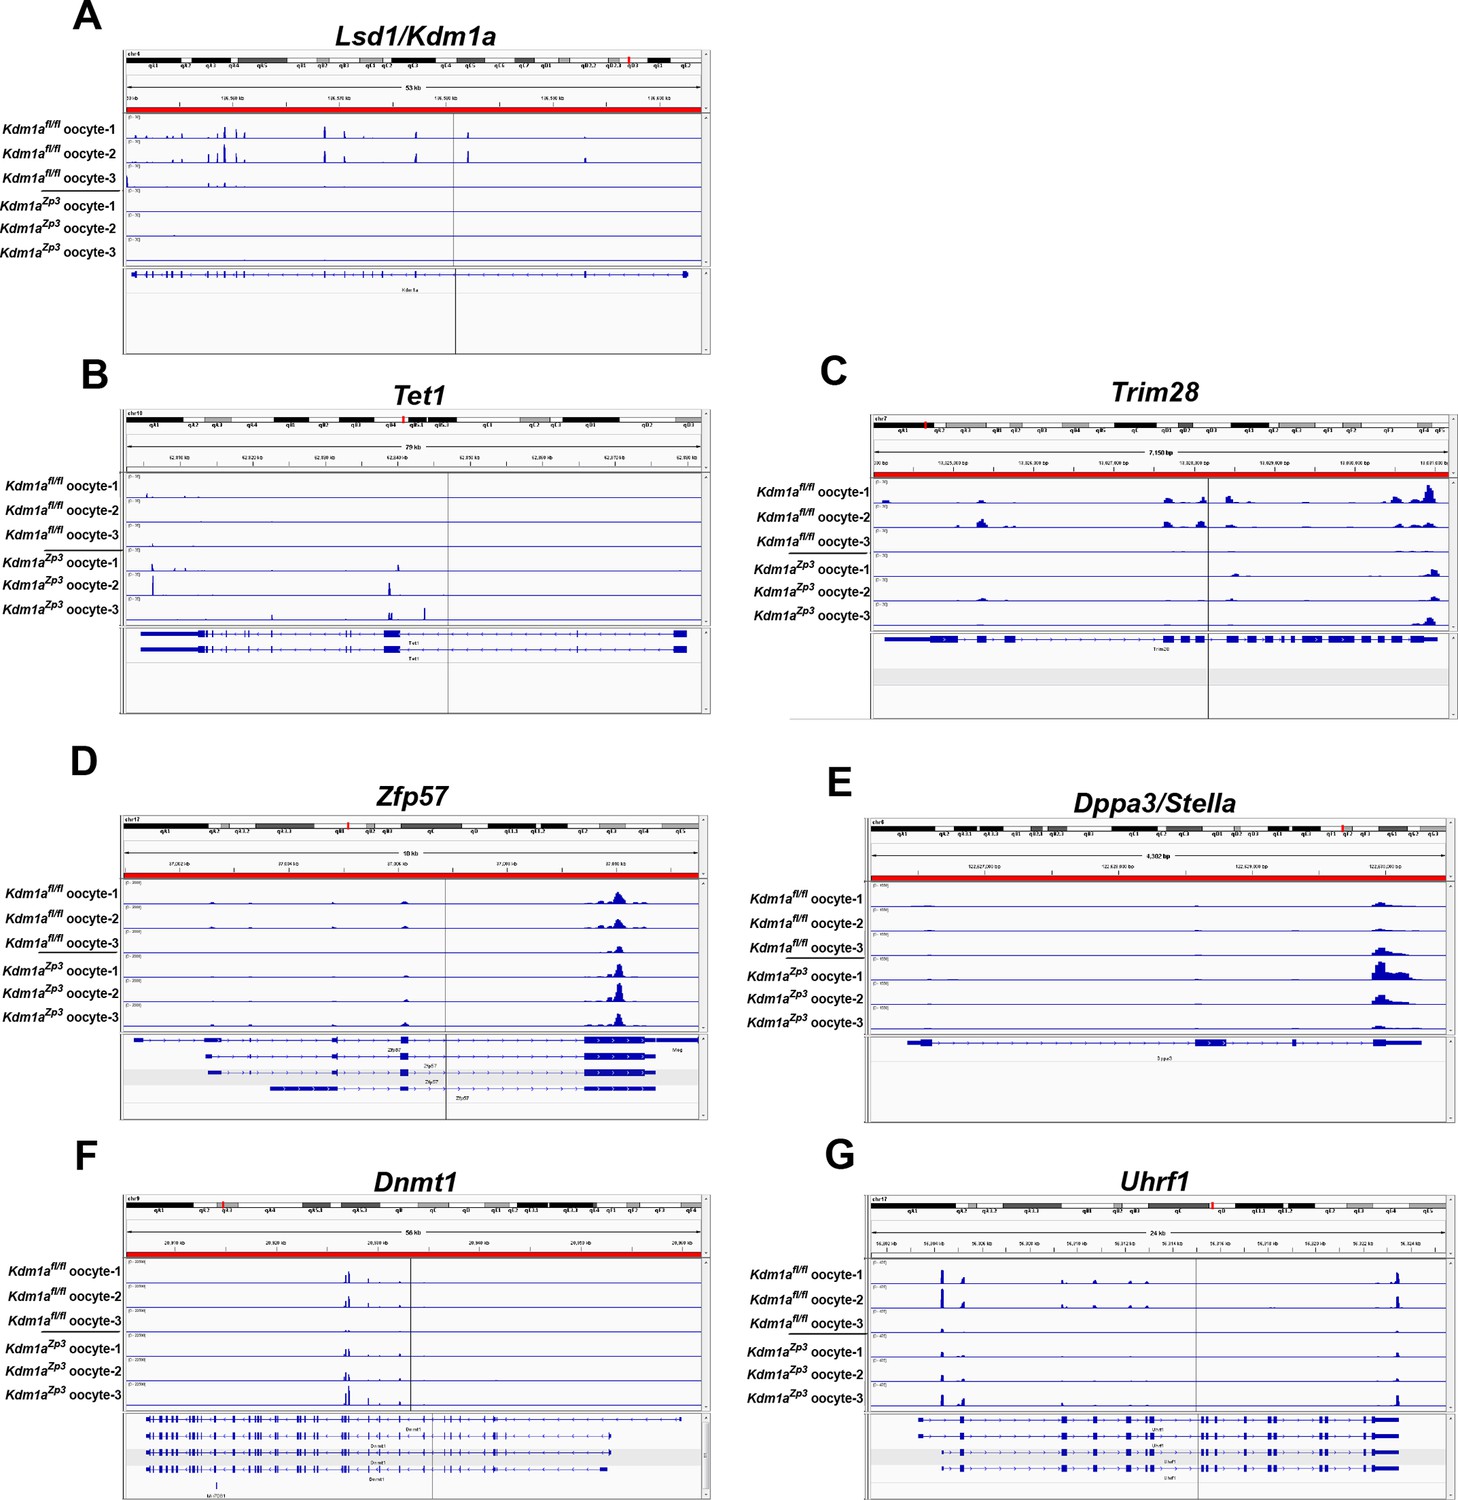
Expression of epigenetic regulators in Kdm1aZp3 2C embryos.
Sequenced RNA-seq reads showing relative expression from Kdm1afl/fl M+Z+ 2C embryos and Kdm1aZp3 M-Z+ 2C embryos aligned to the genome for Lsd1/Kdm1a (A), Tet1 (B), Trim28 (C), Zfp57 (D), Dppa3/stella (E), Dnmt1 (F) and Uhrf1 (G). Gene tracks visualized using Integrative Genomics Viewer.
Figure 3—figure supplement 4
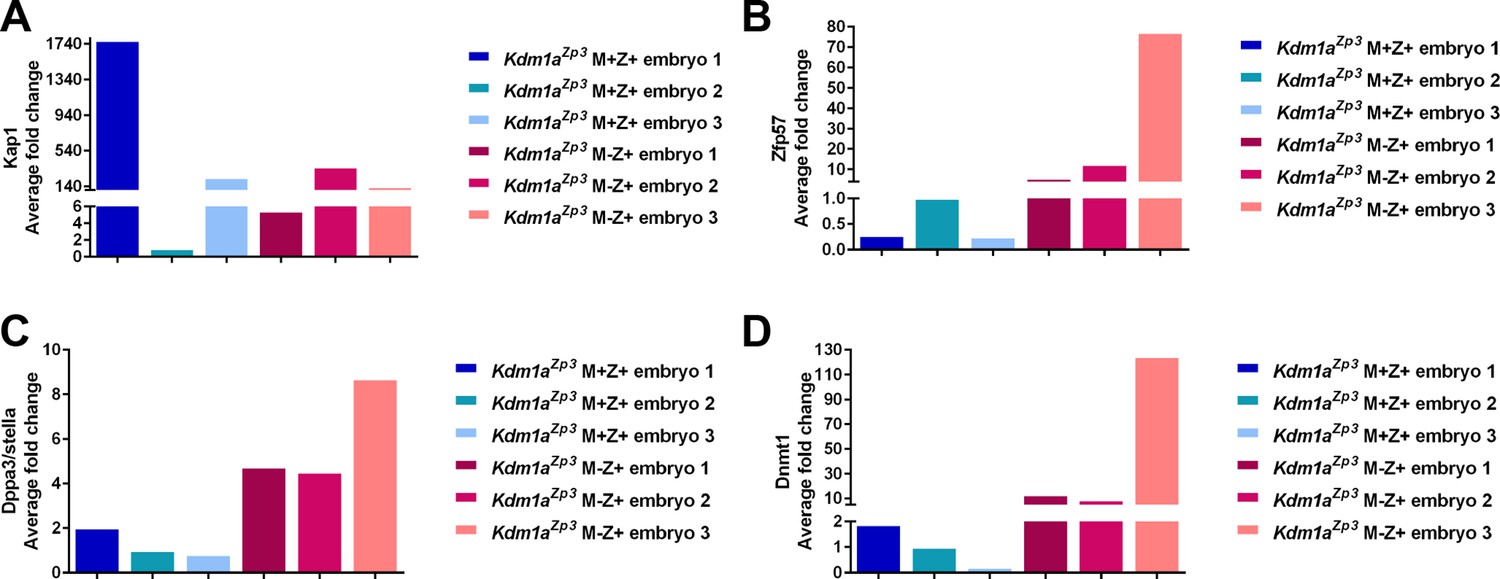
Relative expression of epigenetic regulators in Kdm1aZp3 2C embryos.
Quantitative RT-PCR analysis of epigenetic regulators including Trim28 (A), Zfp57 (B) Dppa3/stella (C), and Dnmt1 (D) in Kdm1aZp3 M+Z+ 2C embryos compared to Kdm1aZp3 M-Z+ 2C embryos. Y-axis represents average fold change. All gene expression was normalized to Hprt expression.
Figure 3—figure supplement 5
Expression of epigenetic regulators in Kdm1afl/fl and Kdm1aZp3 oocytes.
Sequenced RNA-seq reads showing relative expression from Kdm1afl/fl oocytes and Kdm1aZp3 mutant oocytes aligned to the genome for Lsd1/Kdm1a (A), Tet1 (B), Trim28 (C), Zfp57 (D), Dppa3/stella (E), Dnmt1 (F) and Uhrf1 (G). Gene tracks visualized using Integrative Genomics Viewer.
Figure 4

Hypomorphic phenotype in Kdm1aVasa progeny.
(A–D) Brightfield images of M+Z+. (A) and M-Z+ (B–D) embryos derived from Kdm1aVasa control and mutant mothers at embryonic day 3.5 (e3.5). Panels show blastocysts (A,B), a multicellular embryo (C) and a fragmented embryo (D). (E) Percentage of fragmented (purple), 1-cell (green), multi-cellular (blue) and blastocyst (yellow) embryos from Kdm1aVasa control and mutant mothers at e3.5. n = 58 for Kdm1aVasa M+Z+ embryos from 7 litters. n = 79 for Kdm1aVasa M-Z+ embryos from 10 litters. (F) Litter sizes of Kdm1aVasa control and mutant mothers. Average litter size for each indicated by red line. Each circle indicates one litter and n=number of litters analyzed. p-values calculated using an unpaired t-test with **** = p<0.0001 indicating statistical significance. (G) Percentage of newborn pups from Kdm1aVasa heterozygous control and mutant mothers that died perinatally. n = number of litters analyzed. p-values calculated using an unpaired t-test with **** = p<0.0001 indicating statistical significance.
Figure 5 with 1 supplement
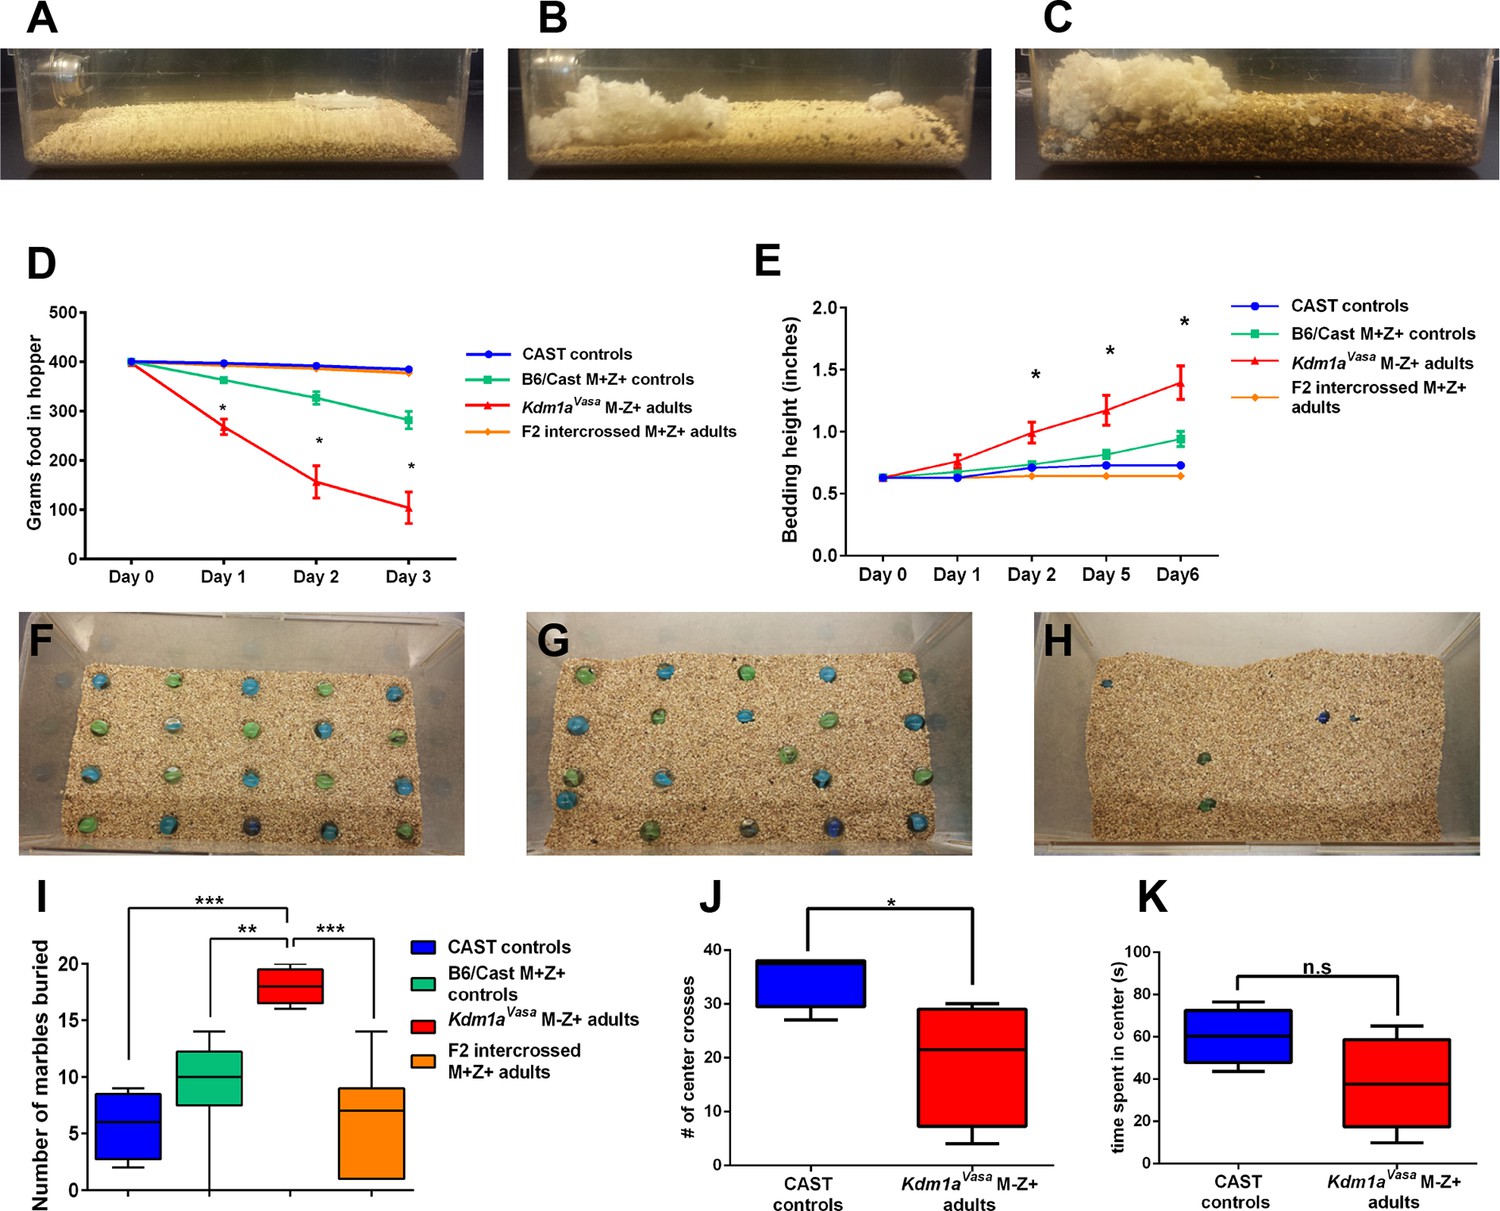
Abnormal behaviors in Kdm1aVasa M-Z+ adults.
(A–C) Mouse cages at day 0 (A) and day 8 (B) from M. castaneus (CAST) controls compared to day 6 (C) from a Kdm1aVasa M-Z+ adult. (D) Quantification of change in weight of food in the hopper from CAST controls, B6/CAST hybrid M+Z+ controls, and F2 intercrossed M+Z+ adults versus Kdm1aVasa M-Z+ adults. Data are shown as mean for each day with error bars indicating ± S.E.M. (E) Quantification of change in bedding height from CAST controls, B6/CAST hybrid M+Z+ controls, and F2 intercrossed M+Z+ adults versus Kdm1aVasa M-Z+ adults. Data are shown as mean for each day with error bars indicating ± S.E.M. (F–H) Mouse cages before (F) and after (G,H) the marble burying assay was performed on a CAST control (G) compared to a Kdm1aVasa M-Z+ adult (H). (I) Quantification of the number of marbles buried during the marble burying assay performed on CAST controls, B6/CAST hybrid M+Z+ controls, and F2 intercrossed M+Z+ adults versus Kdm1aVasa M-Z+ adults. Data are shown as quartiles with error bars indicating ± S.E.M. (J,K) Open field test performance in CAST controls versus Kdm1aVasa M-Z+ adults scored by number of center crosses (J) and time spent in center of cage (K). Data are shown as quartiles with error bars indicating ± S.E.M. p-values calculated using an unpaired t-test with n.s. indicating p>0.05, * = p<0.05, ** = p<0.005, *** = p<0.0005. All asterisks indicate statistical significance.
Figure 5—figure supplement 1
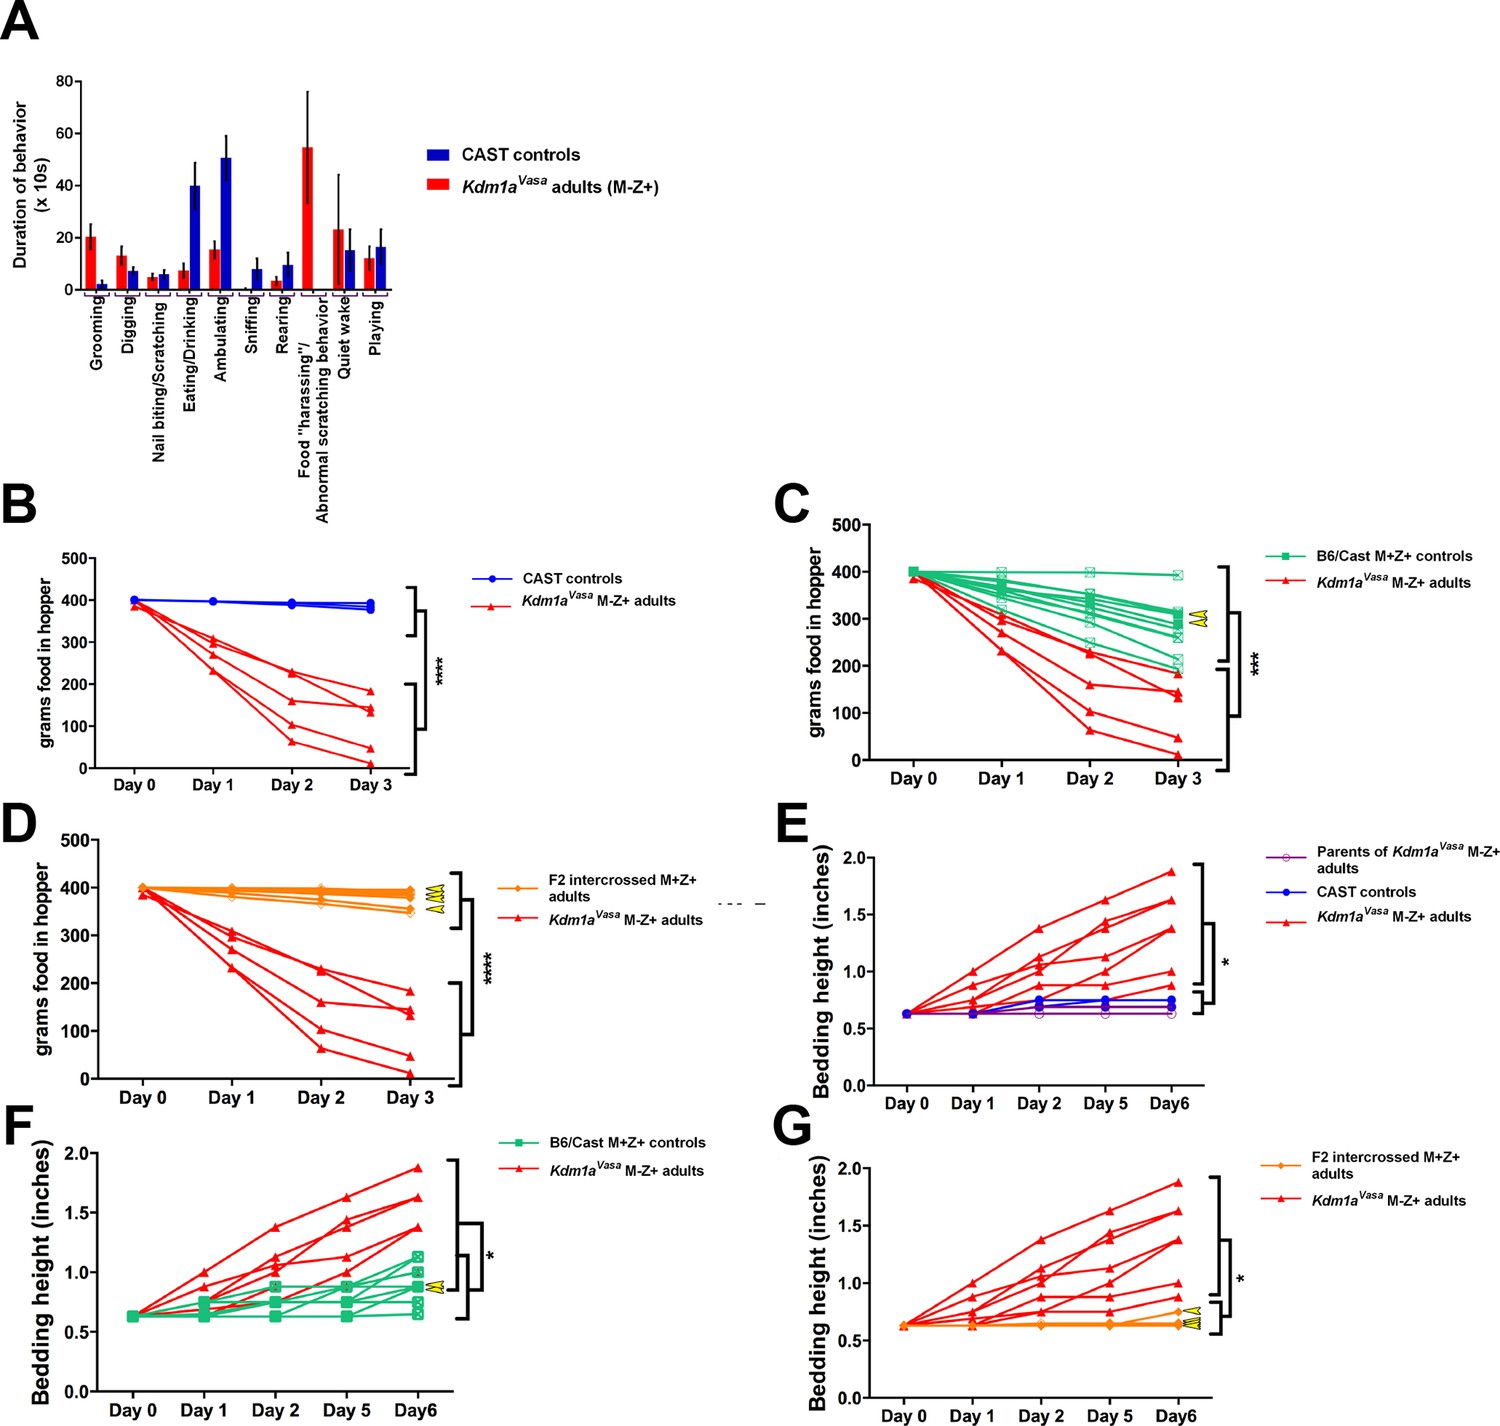
Abnormal behaviors in individual Kdm1aVasa M-Z+ adults.
(A) Behavioral ethogram of M. castaneus (CAST) controls versus Kdm1aVasa M-Z+ adults. (B) Quantification of change in weight of food in the hopper of parents of Kdm1aVasa M-Z+ adults and CAST controls versus Kdm1aVasa M-Z+ adults. (C) Quantification of change in weight of food in the hopper of B6/CAST M+Z+ controls versus Kdm1aVasa M-Z+ adults. (D) Quantification of change in weight of food in the hopper of F2 intercrossed M+Z+ adults versus Kdm1aVasa M-Z+ adults. (E) Quantification of change in bedding height of parents of Kdm1aVasa M-Z+ adults and CAST controls versus Kdm1aVasa M-Z+ adults. (F) Quantification of change in bedding height of B6/CAST M+Z+ controls versus Kdm1aVasa M-Z+ adults. (G) Quantification of change in bedding height of F2 intercrossed M+Z+ adults versus Kdm1aVasa M-Z+ adults. The measurements for each individual animal (B–D) and (E–G) correspond to the averages shown in Figure 5 (D,E). Yellow arrowheads represent animals heterozygous for Kdm1a. Data shown as mean for each day. p-values calculated using an unpaired t-test with * = p<0.05, *** = p<0.0005, **** = p<0.0001. All asterisks indicate statistical significance.
Figure 6 with 1 supplement
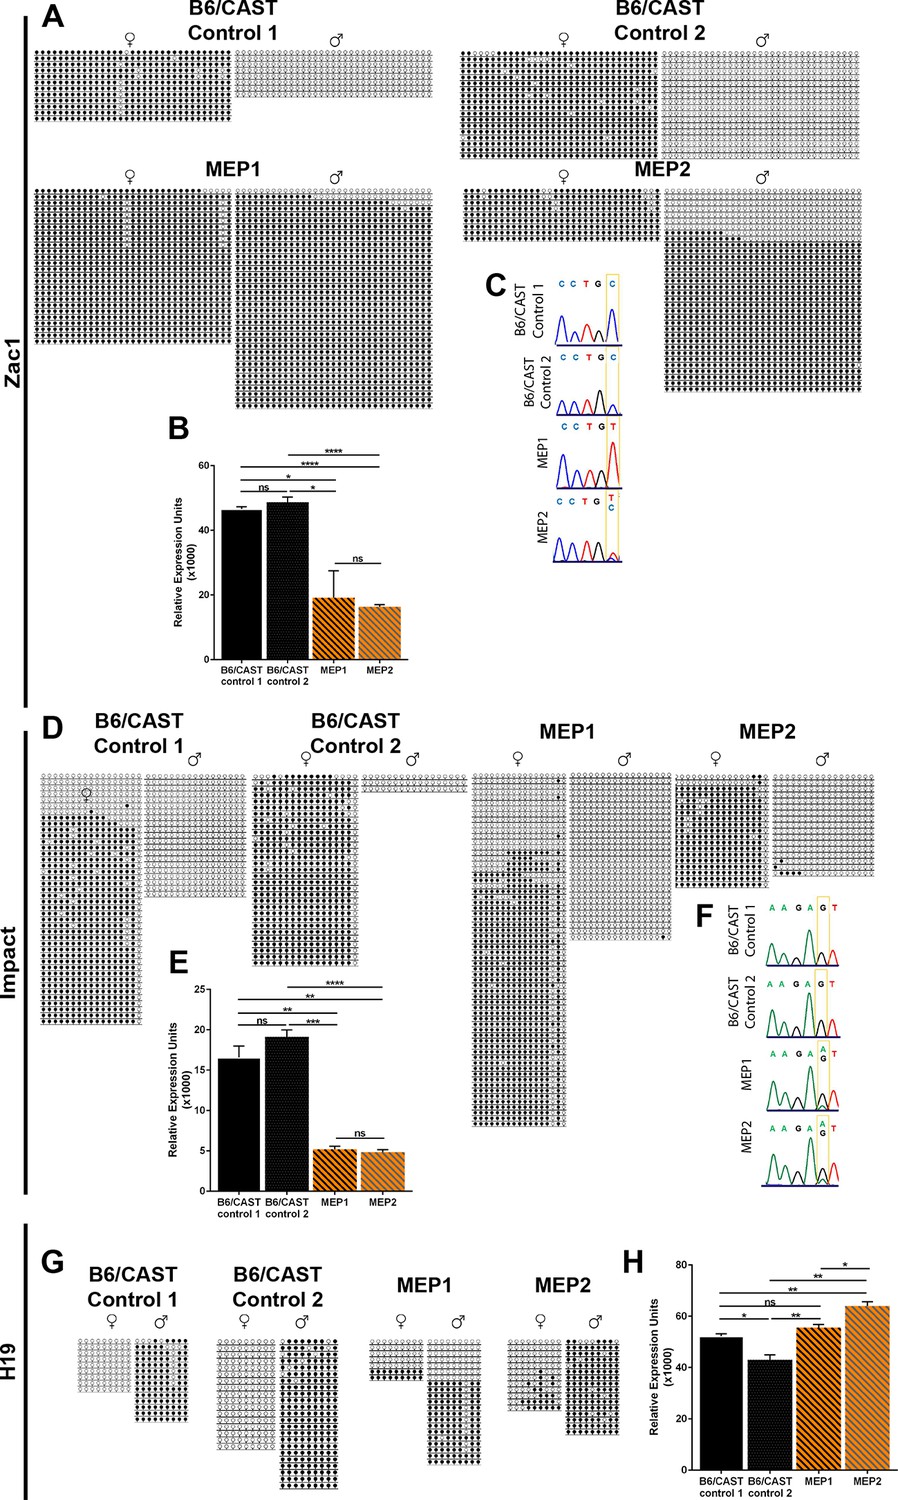
Imprinting defects in Kdm1aVasa progeny.
(A,D,G) Allele-specific bisulfite analysis of Zac1 (A), Impact (D), and H19 (G). Each line represents the clone of an allele. Each circle represents a CpG dinucleotide where closed circles indicate methylation and open circles indicate no methylation. Maternal and paternal alleles are indicated. (B,E,H) Relative expression analysis of Zac1 (B), Impact (E), and H19 (H). Expression normalized to β-actin. Error bars indicate S.E.M. p-values calculated using an unpaired t-test with n.s. indicating p>0.05, * = p<0.05, ** = p<0.005, **** = p<0.0001. All asterisks indicate statistical significance. (C,F) Allele-specific expression of Zac1 (C) and Impact (F). The polymorphic base is highlighted in yellow. For Zac1, the maternal allele SNP is T (red) in highlighted position and paternal allele SNP is C (blue) in electrophoretogram. For Impact, the maternal allele SNP is A (green) in highlighted position and paternal allele SNP is G (black) in electrophoretogram. All analyses were performed on 2 staged matched B6/CAST hybrid control pups and 2 maternal effect progeny (MEP) exhibiting perinatal lethality.
Figure 6—figure supplement 1
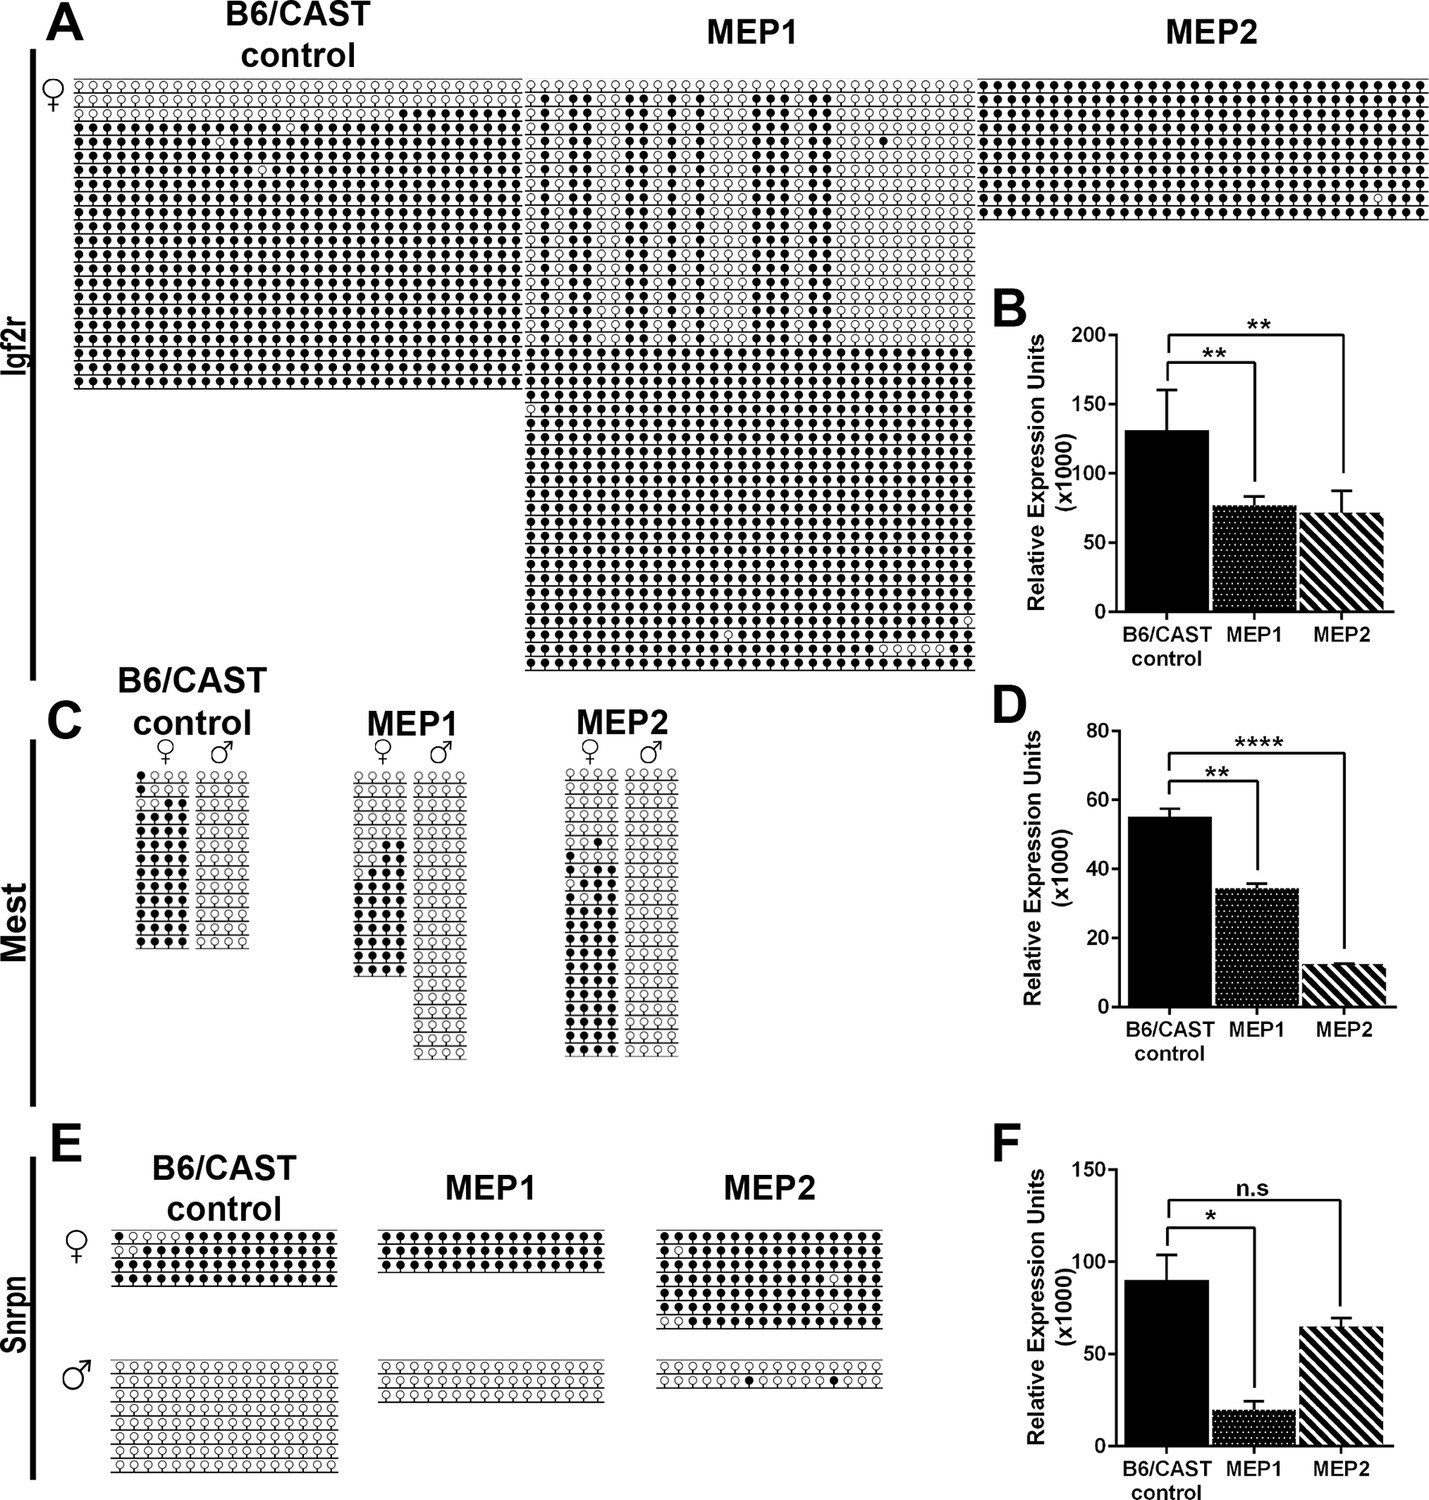
Imprinting analysis of Kdm1aVasa progeny.
(A,C,E) Allele-specific bisulfite analysis of, Igf2r (A), Mest (C), and Snrpn (E). Each line represents the clone of an allele. Each circle represents a CpG dinucleotide where closed circles indicate methylation and open circles indicate no methylation. Maternal and paternal alleles are indicated. (B,D,F) Relative expression analysis of Igf2r (B), Mest (D), and Snrpn (F). Expression normalized to β-actin. Error bars indicate ± S.E.M. p-values calculated using an unpaired t-test with n.s. indicating p>0.05, * = p<0.05, ** = p<0.005, **** = p<0.0001. All asterisks indicate statistical significance. All analyses were performed on a stage matched B6/CAST hybrid control pup and 2 maternal effect progeny (MEP) exhibiting perinatal lethality.
Figure 7
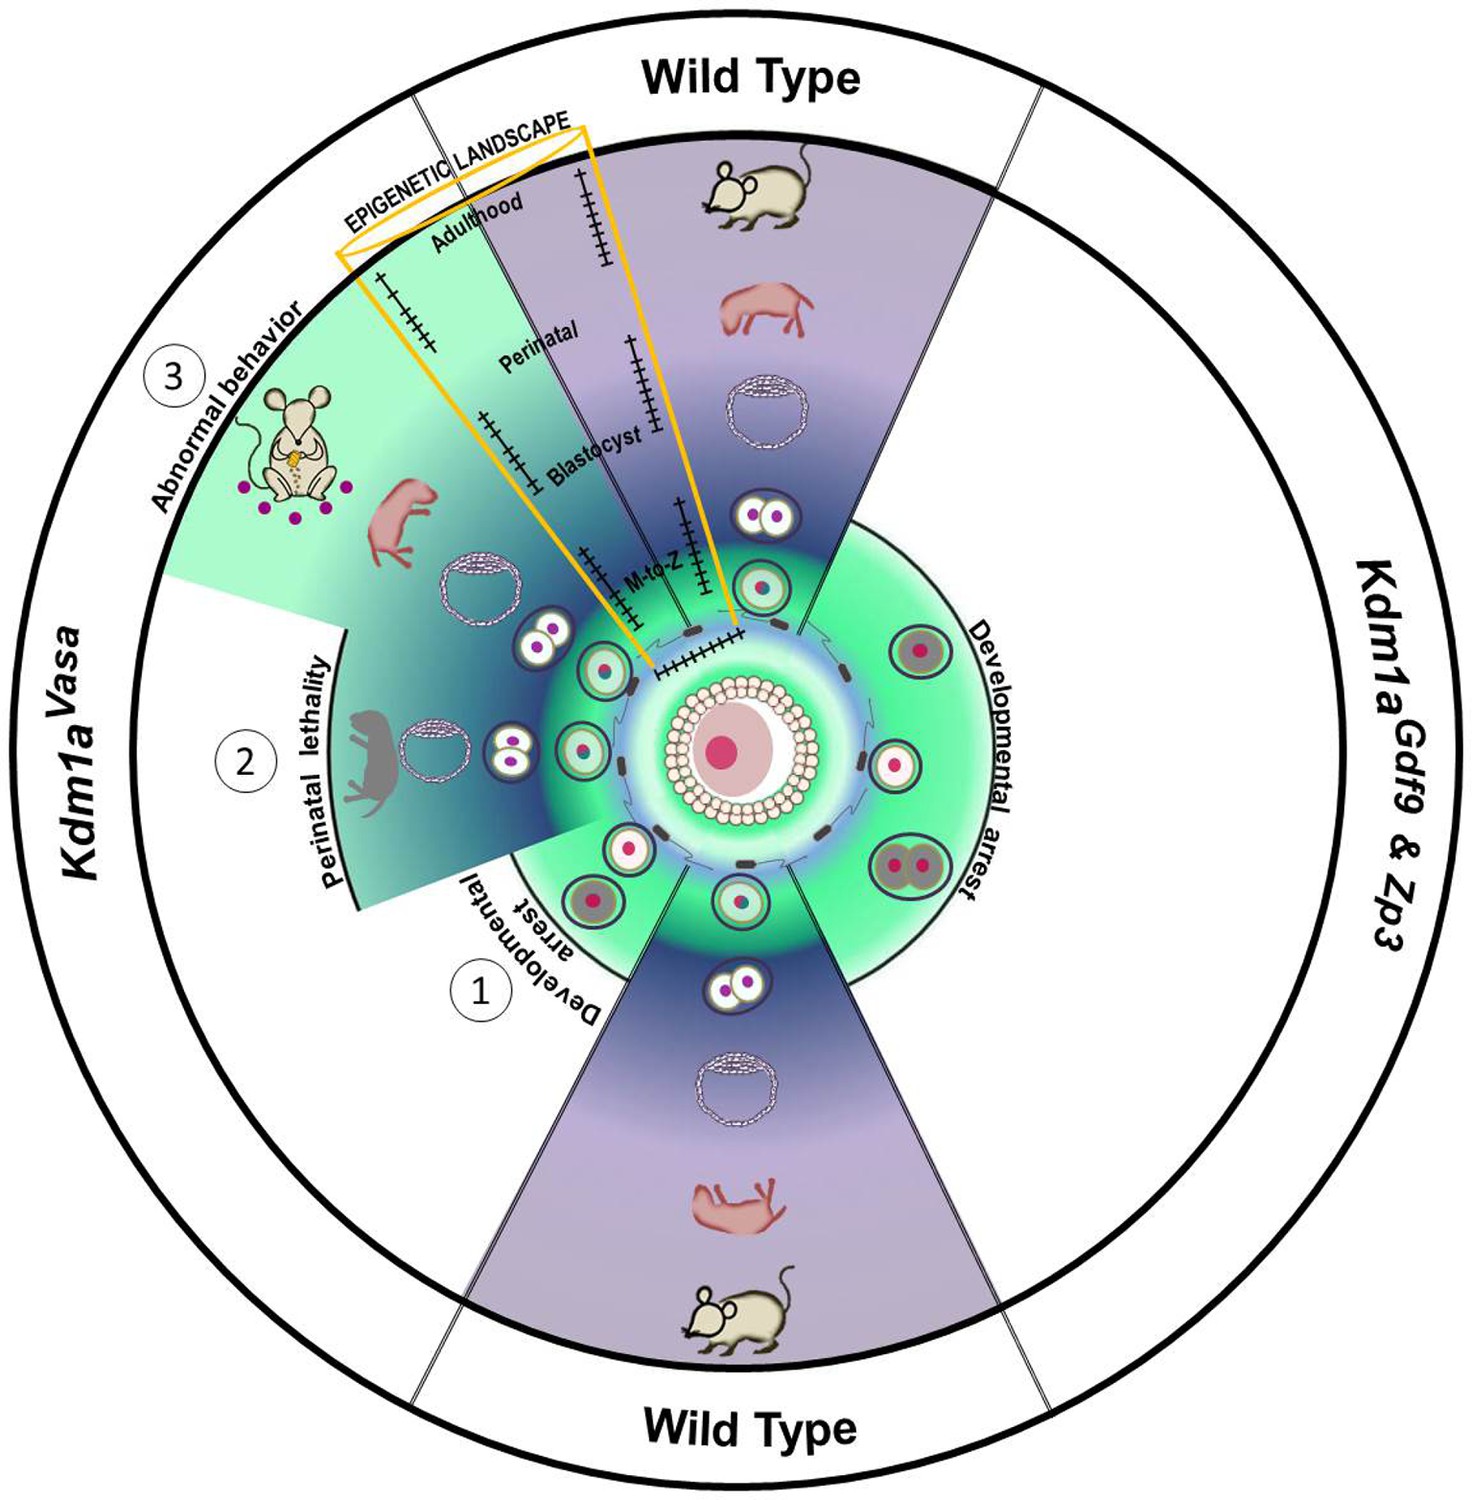
Model.
Loss of maternal LSD1 results in defects later in development in wild-type oocytes, after fertilization (denoted by blue sperm encircling oocyte) the fertilized egg undergoes the maternal to zygotic transition (MZT; green to blue/purple) at the 1–2 cell stage. These M+Z+ embryos proceed normally through development (indicated by blastocyst, perinatal stage pup, and adult mouse). In contrast, when Lsd1 is deleted with either Gdf9- or Zp3-Cre, the resulting Lsd1Gdf9 and Lsd1Zp3 progeny become arrest at the 1–2 cell stage and never undergo the MZT (green). When Lsd1 is deleted with Vasa-Cre, we observe 3 hypomorphic outcomes in resulting Lsd1Vasa progeny: (1) developmental arrest at the 1–2 cell stage, (2) perinatal lethality and (3) abnormal behavior in surviving adult animals. These outcomes are due to reduced LSD1 in the mothers oocyte, suggesting that lowered maternal LSD1 can result in defects much later in development. These long-range outcomes are associated with imprinting defects (depicted as wild-type versus mutant changes in DNA methylation within the yellow region).
Videos
Video 1
Stereotypical and abnormal behaviors in Kdm1aVasa M-Z+ adults.
0:00-0:27 M. castaneus (CAST) control playing behavior. 0:27-0:40 M. castaneus (CAST) control eating. 0:40-1:03 (right) Kdm1aVasa M-Z+ adult food harassing behavior. 1:03-1:28 (right) Kdm1aVasa M-Z+ adult abnormal scratching behavior. 1:28-1:45 (right) Kdm1aVasa M-Z+ adult food harassing behavior and (left) abnormal digging behavior.
Video 2
Marble burying in Kdm1aVasa adults.
0:00-0:23 Clip 1 of M. castaneus (CAST) control in marble burying assay. 0:23-0:44 Clip 2 of M. castaneus (CAST) control in marble burying assay. 0:44-1:22 Clip 1 of Kdm1aVasa M-Z+ adult in marble burying assay. 1:22-1:36 Clip 2 of Kdm1aVasa M-Z+ adult in marble burying assay. 1:36-2:13 Clip 3 of Kdm1aVasa M-Z+ adult in marble burying assay.
Video 3
Open field test on Kdm1aVasa M-Z+ adults.
0:00-0:30 M. castaneus control in open field test. 0:30-0:56 Kdm1aVasa M-Z+ adult in open field test.
Tables
Table 1
Litter sizes for Kdm1aVasa animals Kdm1aVasa litters for mutant and control mothers indicating number of pups that died and entire litters that died. Kdm1aVasa adult, B6/Cast control, and F2 intercrossed control litter sizes that were assayed for behavioral defects.
| Kdm1aVasa M+Z+ | Kdm1aVasa M-Z+ | B6/Cast M+Z+ controls | Kdm1aVasa M-Z+ adults | F2 intercrossed M+Z+ adults | ||
|---|---|---|---|---|---|---|
| Litter size 1 | 8 (1) | 1* | 7 | 2 | 7 | |
| Litter size 2 | 7 | 4 | 3 | 1 | ||
| Litter size 3 | 7 | 2 | 4 | |||
| Litter size 4 | 7 | 4 | ||||
| Litter size 5 | 7 | 1* | ||||
| Litter size 6 | 5 | 4 | ||||
| Litter size 7 | 9 | 1* | ||||
| Litter size 8 | 8 (1) | 5 | ||||
| Litter size 9 | 11 | 2* | ||||
| Litter size 10 | 8 | 2* | ||||
| Litter size 11 | 5 (2) | 2* | ||||
| Litter size 12 | 10 | 4 | ||||
| Litter size 13 | 3 | 3 | ||||
| Litter size 14 | 9 | 1* | ||||
| Litter size 15 | 5 | 3 | ||||
| Litter size 16 | 6 | 1* | ||||
| Litter size 17 | 4 | 3 | ||||
| Litter size 18 | 3 | 1* | ||||
| Litter size 19 | 11 | 1* | ||||
| Litter size 20 | 8 | 2 | ||||
| Litter size 21 | 2* | |||||
| Litter size 22 | 7 | |||||
| Litter size 23 | 10 | |||||
| Litter size 24 | 8 | |||||
| Litter size 25 | 8 | |||||
| Litter size 26 | 3 (1) | |||||
| Litter size 27 | 9 (1) | |||||
| Litter size 28 | 11 | |||||
| Litter size 29 | 7 | |||||
| Litter size 30 | 4 | |||||
| Litter size 31 | 5 (1) | |||||
| Litter size 32 | 1 | |||||
-
( ) indicates pups that died.
-
* indicates entire litter died.
Table 2
Allele-specific primers and polymorphisms, each primer and polymorphism used for allele-specific analysis bisulfite analysis and allele-specific expression analysis.
| Gene name | Use (Bisulfite or qPCR) | Verified SNP (rs#) | Primers |
|---|---|---|---|
| Zac1 | Allele-Specific Bisulfite Analysis | A-B6/ G-Cast (rs29364824) | For- G GGTAGGTAAGTAGTGATAA |
| Rev- C CTAAAACACCAAAATAACA | |||
| qPCR | T-B6/C-Cast (rs33583472) | For- CATTTGTAGGCATGCCCGTC | |
| Rev- G TGGTAGCTGCATCTGGGGCTGGA | |||
| Impact | Allele-Specific Bisulfite Analysis | A-B6/G-Cast (rs31057356) | For- TTGTATAGTTTTGTTTTTATAAGTG |
| Rev- AACCTACTCATATAACAATACAAC | |||
| qPCR | A-B6/ G-Cast (rs31052361) | For- GAAGAAAACTGAAGAGGTTG | |
| Rev- GCATAGATGTTGTGGGTGGC | |||
| H19 | Allele-Specific Bisulfite Analysis | G-B6/ A-Cast (verified from Bartolomei Lab) | For- ATTTATAAATGGTAATGTTGTGG |
| Rev- CCTCATAAAACCCATAACTATAAAATC | |||
| qPCR | For- CCACTACACTACCTGCCTCAGAATCTGC | ||
| Rev- GGTGGGTACTGGGGCAGCATTG | |||
| Igf2r | Allele-Specific Bisulfite Analysis | G-B6/ A-Cast (rs107811421) | For- TAGAGGATTTTAGTATAATTTTAA |
| Rev- TAACACTTTTAAATTCATCTCT | |||
| qPCR | For- CTGGAGGTGATGAGTGTAGCTCTGGC | ||
| Rev- GAGTGACGAGCCAACACAGACAGGTC | |||
| Mest | Allele-Specific Bisulfite Analysis | G-B6/ T-Cast (rs245841095) | ForMat- GGGTGTTTTATGTTTTTTAGGGT; ForPat- GGGTGTTTTATGTTTTTTAGGGG |
| Rev- CCCAAATTCTAATAAAAAAAACCTTCCCAT | |||
| qPCR | For- GCTGGGGAAGTAGCTCAGT | ||
| Rev- TTTCTTCTTAGCAAGGGCCA | |||
| Snrpn | Allele-Specific Bisulfite Analysis | A-B6/T-Cast (rs50790468) | ForMat- GTAATTATATTTATTATTTTAGATTGATAGTGAT; ForPat- GTAATT ATATTTATTATTTTAGATTGATAGTGAG |
| Rev- ATAAAATACACTTTCACTACTAAAATCC | |||
| qPCR | For- TGC TCGTGTTGCTGCTACTG | ||
| Rev- GCAGTAAGAGGGGTCAAAAGC | |||
| β-actin | qPCR | For- G TGACGAGGCCCAGAGCAAGAG | |
| Rev- C GTACATGGCTGGGGTGTTGAAGG |
Download links
A two-part list of links to download the article, or parts of the article, in various formats.
Downloads (link to download the article as PDF)
Open citations (links to open the citations from this article in various online reference manager services)
Cite this article (links to download the citations from this article in formats compatible with various reference manager tools)
Maternally provided LSD1/KDM1A enables the maternal-to-zygotic transition and prevents defects that manifest postnatally
eLife 5:e08848.
https://doi.org/10.7554/eLife.08848


