Protocadherin-dependent dendritic self-avoidance regulates neural connectivity and circuit function
- Harvard University, United States
- Harvard Medical School, United States
Figures
Figure 1
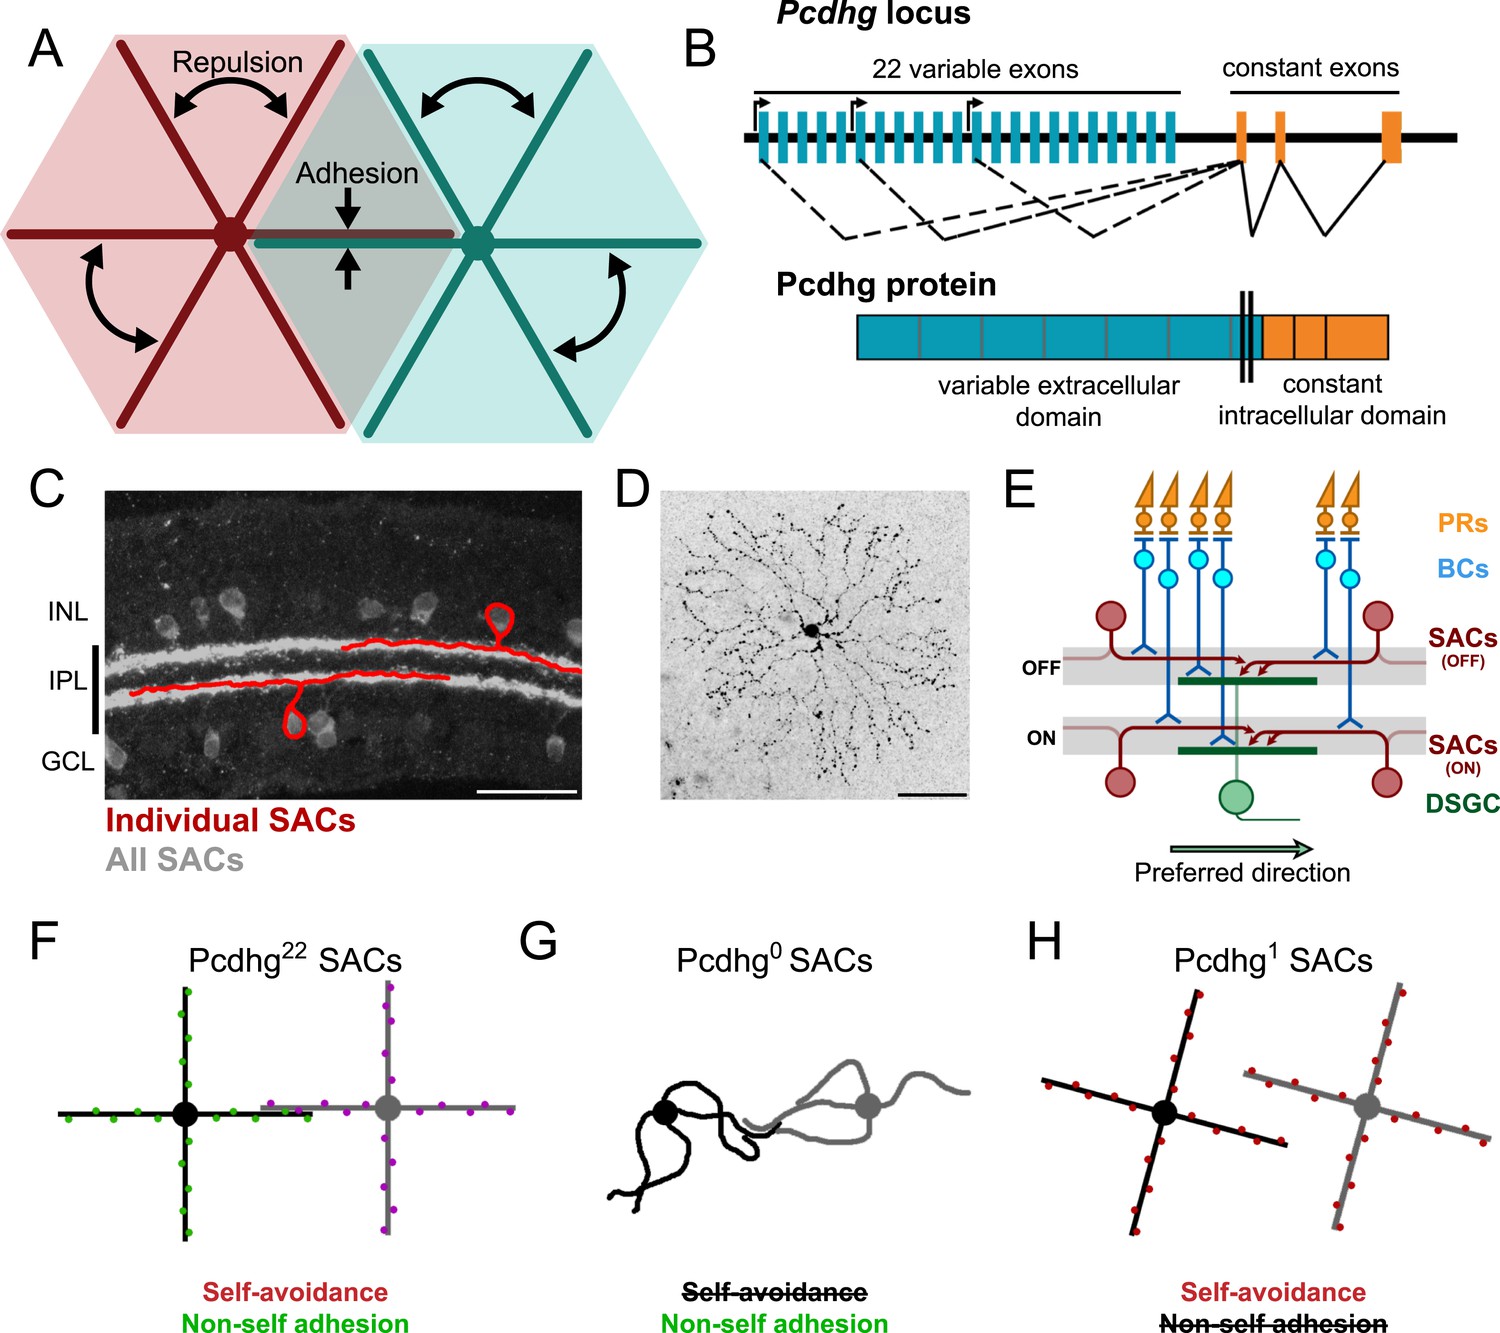
Pcdhg-dependent self-avoidance and self/non-self discrimination in SACs.
(A) Self-avoiding neurites lack isoneuronal contacts (repulsion) but adhere to and can form synapses with neurites of other cells of the same type, displaying self/non-self discrimination (adhesion). (B) Schematic of Pcdhg genomic locus and protein product. Distinct Pcdhg isoforms are assembled by splicing one of 22 variable exons, encoding the extracellular and transmembrane portions of the protein, to three constant exons, encoding the intracellular portion of the protein. (C) Vertical section of retina stained against ChAT to label all SACs (gray) overlaid with cartooned individual OFF and ON SACs (red). OFF SAC cell bodies reside in the inner nuclear layer (INL) and ON SAC cell bodies reside in the ganglion cell layer (GCL). SAC neurites reside in the inner plexiform layer. (D) En face view of individual dye-filled ON SAC in Pcdhg22 retina. (E) Schematic of the retinal direction-selective circuit components and connections. PRs, photoreceptors; BCs, bipolar cells; SACs, starburst amacrine cells; DSGC, direction-selective ganglion cell. Gray stripes indicate OFF and ON direction-selective sublaminae (S2 and S4, respectively). Green and red arrows indicate directional preferences of DSGCs and SAC dendrites, respectively. (F–H) Schematic representation of the effects of changing Pcdhg expression in SACs (summary from Lefebvre et al., 2012). SACs from Pcdhg22 retinas (F) are posited to express unique subsets of Pcdhgs and thus exhibit both self-avoidance and non-self adhesion. SACs from Pcdhg0 retinas (G) express no Pcdhgs and thus do not exhibit self-avoidance. SACs from Pcdhg1 retinas (H) all express the same Pcdhg and thus exhibit self-avoidance but not non-self adhesion. Scale bar = 50 μm in C and D.
Figure 2 with 4 supplements
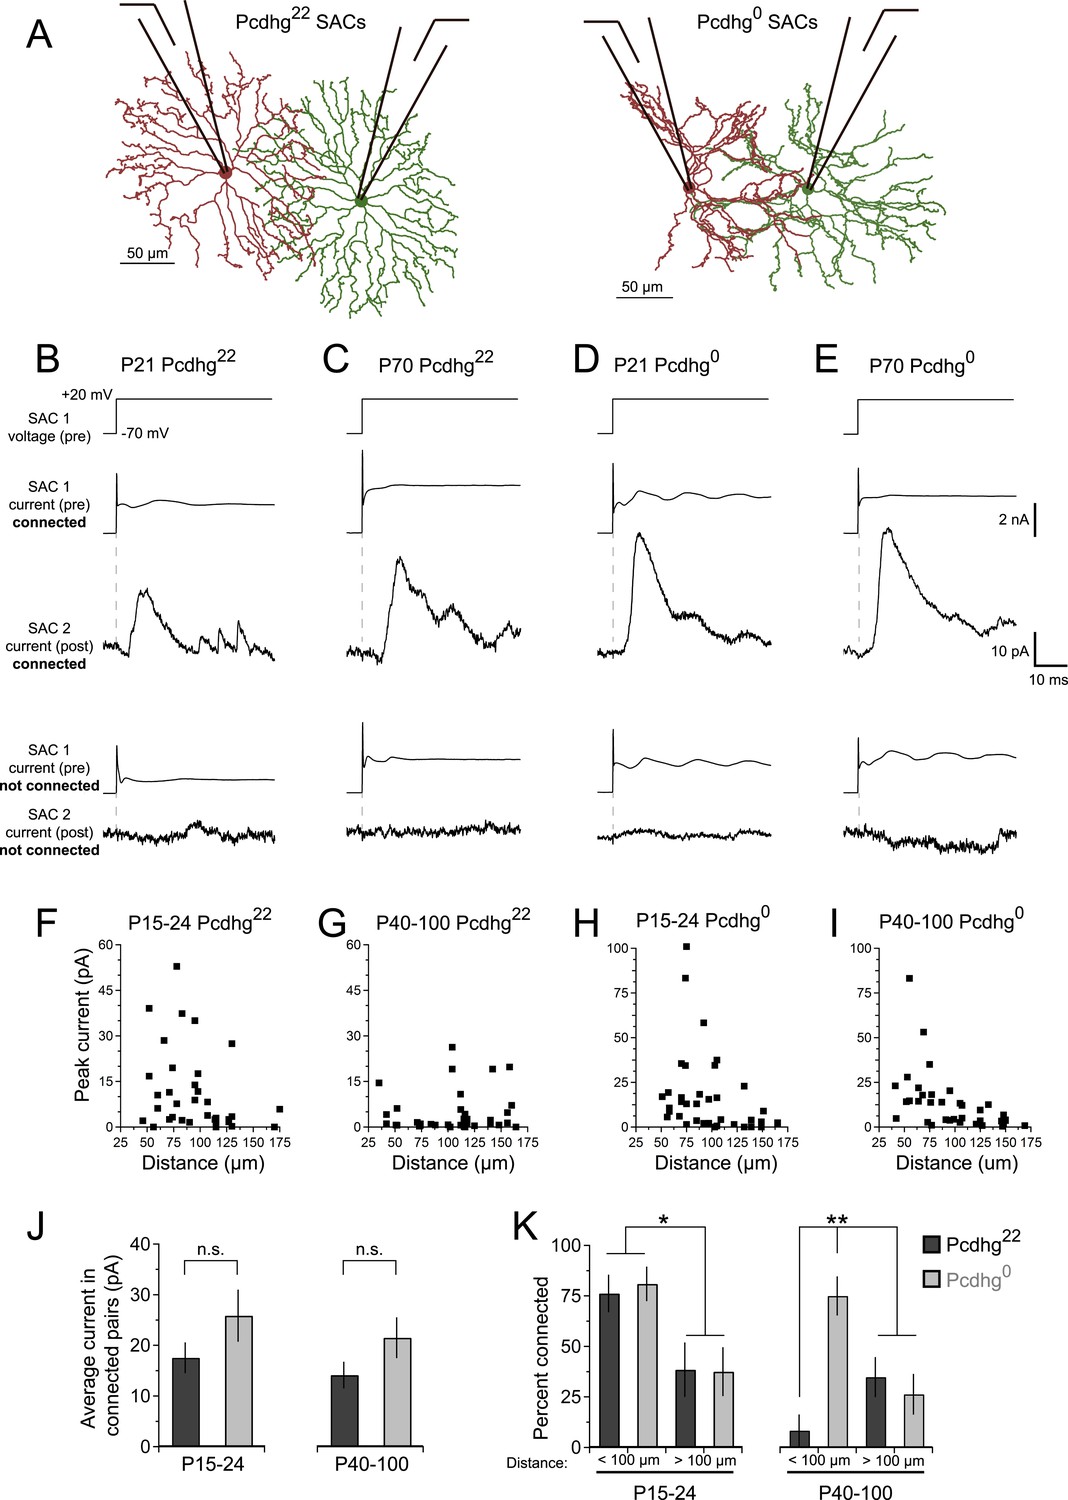
SAC–SAC connections in Pcdhg22 and Pcdhg0 retinas.
(A) Paired recording configuration: SACs at various intercellular distances were targeted for recording in Pcdhg22 (left) and Pcdhg0 (right) retinas. Imaged are tracings of real SACs. (B–E) Presynaptic voltage steps from Vh = −70 to +20 mV (top) and examples of currents recorded from both pre- and postsynaptic pairs of SACs that were connected (middle) and not connected (bottom) in juvenile Pcdhg22 retinas (B), adult Pcdhg22 retinas (C), juvenile Pcdhg0 retinas (D), and adult Pcdhg0 retinas (E). (F–I) Scatter plots of intercellular distance vs peak current size in juvenile Pcdhg22 retinas (F), adult Pcdhg22 retinas (G), juvenile Pcdhg0 retinas (H), and adult Pcdhg0 retinas (I). Number of connections tested = 34, 35, 37, and 39 in F–I, respectively. (J) Average peak current in connected SAC pairs at P15-24 (left) and P40-100 (right). Number of connections recorded = 21, 9, 23, and 20 in juvenile Pcdhg22 retinas, adult Pcdhg22 retinas, juvenile Pcdhg0 retinas, and adult Pcdhg0 retinas, respectively. (K) Distance-dependence of SAC–SAC connectivity at in P15-24 animals (left) and P40-100 animals (right). Data are shown as mean ± S.E.M. Statistics: n.s. = not significant, *p < 0.05, **p < 0.01. See also Figure 2—figure supplements 1–4.
Figure 2—figure supplement 1
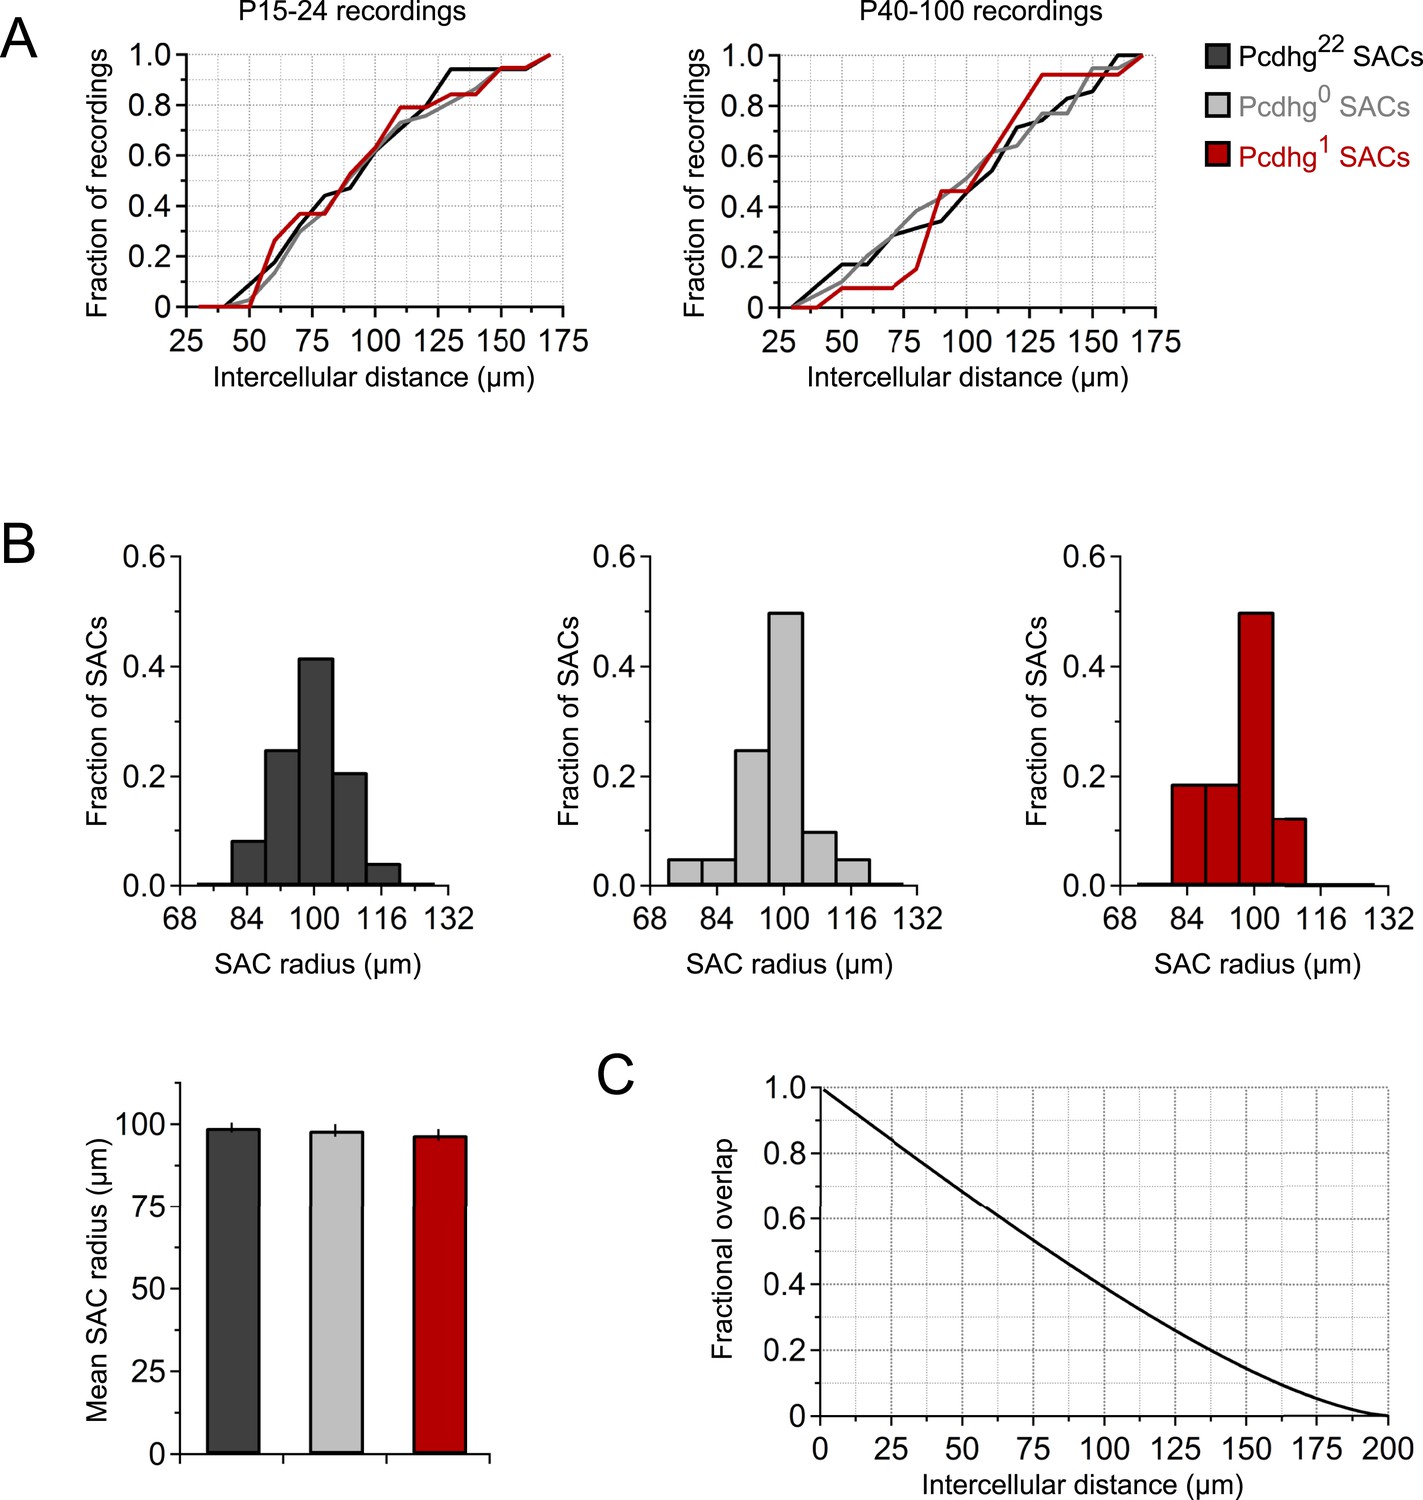
Recording distances and SAC dendritic radii.
(A) Cumulative histogram of intercellular distances of SAC connections that were tested in juvenile animals (left) and adult animals (right). Histogram range is 25–175 μm with bins of 10 μm. Number of connections tested = 34, 37, 19, 35, 39, and 13 for P15-24 Pcdhg22, P15-24 Pcdhg0, P15-24 Pcdhg1, P40-100 Pcdhg22, P40-100 Pcdhg0 SACs, and P40-100 Pcdhg1 SACs, respectively. (B) Top: histograms of dendritic radii of Pcdhg22, Pcdhg0, and Pcdhg1 SACs. Bottom: average dendritic radii across conditions. These measurements are from living retinas; following fixation, staining, and mounting, the dendritic radius of SACs is ∼25% larger, as reported in many anatomical studies. (C) Relationship between intercellular distance and amount of dendritic overlap (SACs modeled as 100 µm radius circles).
Figure 2—figure supplement 2
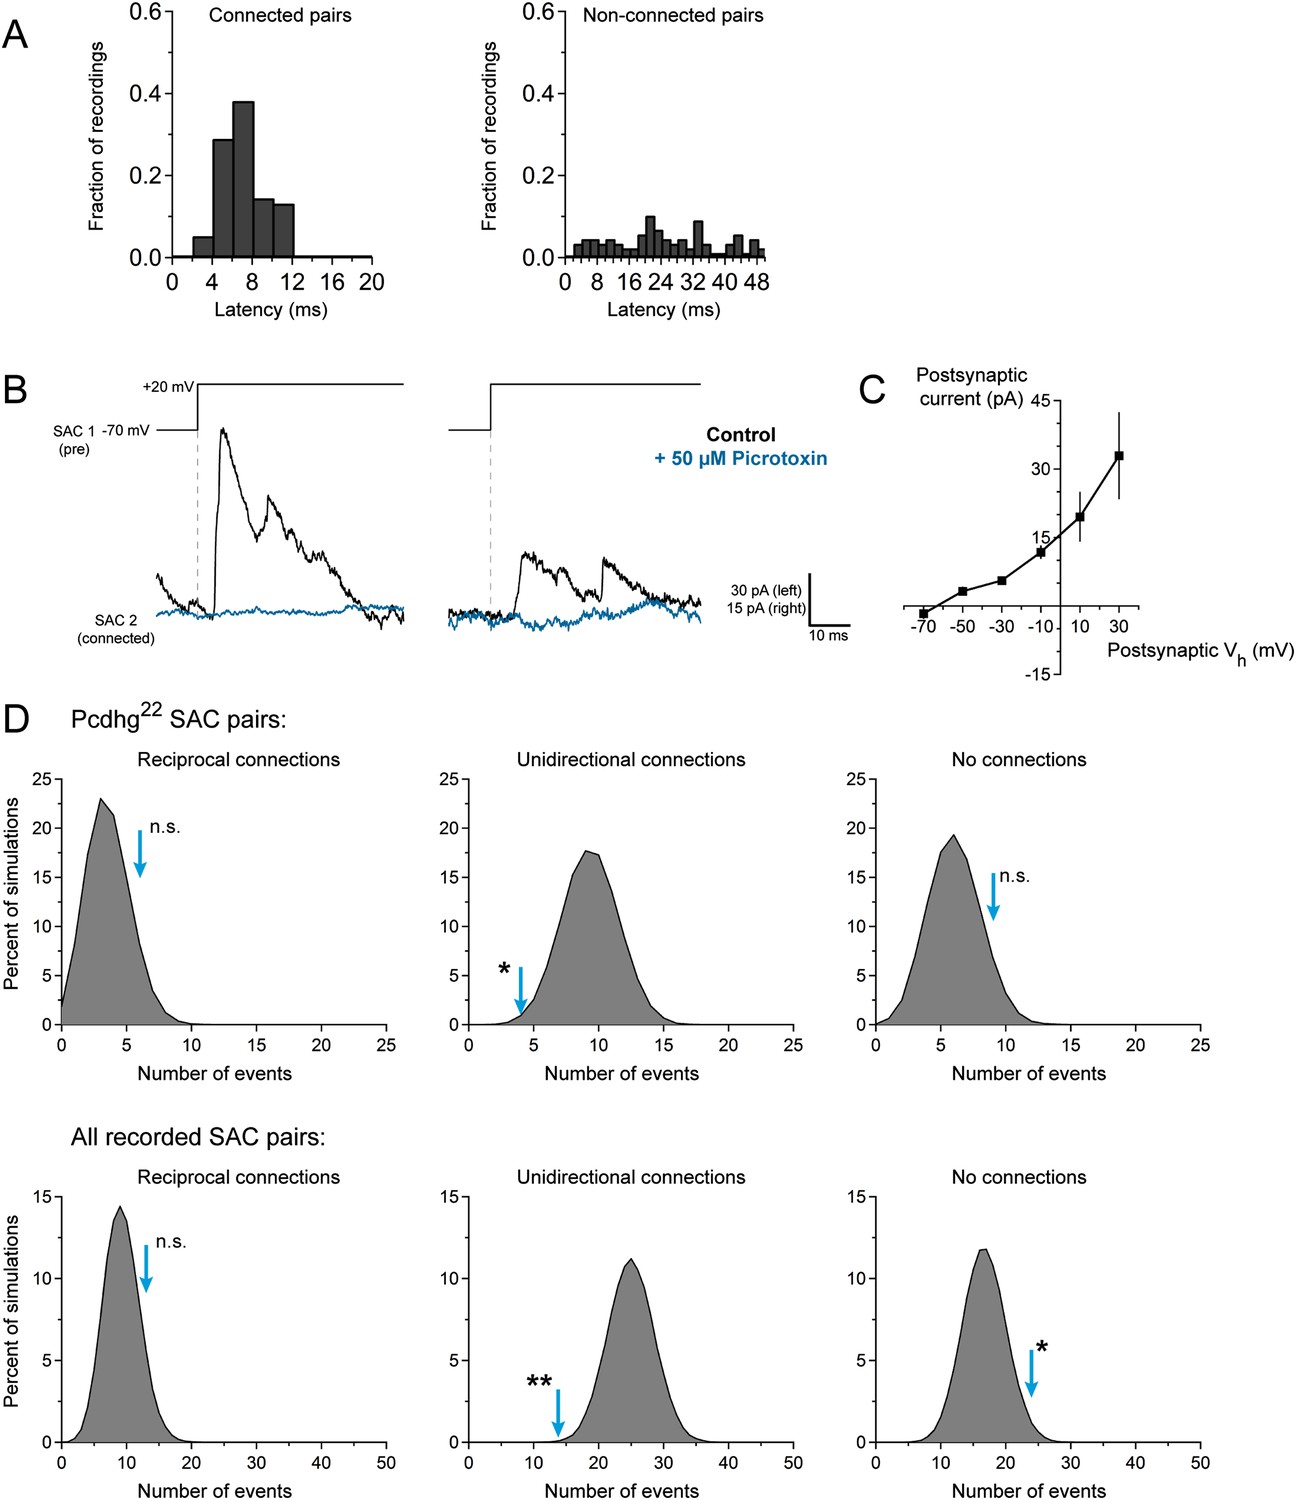
Characterization of SAC–SAC synaptic connections.
(A) Left: histogram of synaptic latencies in all connected cells. Histogram range is 0–20 ms after presynaptic depolarization, and bin size is 2 ms. Right: same analysis performed on non-connected pairs with histogram range of 0–50 ms and bin size 2 ms. (B) Two examples of SAC paired recording showing that application of 50 μM picrotoxin eliminates transmission in these pairs, and thus currents are GABAergic. Presynaptic cells were stepped from Vh = −70 to +20 mV. Postsynaptic cells were held at Vh = +30 mV. (C) Average current–voltage relationship of SAC–SAC connections, showing reversal at ECl (n = 3 pairs). (D) Monte Carlo simulations of paired SAC recordings to assess the specificity of reciprocal connections. Each gray histogram was generated from 105 simulations using experimentally determined connection probabilities. Experimentally observed values are indicated by cyan arrows. Top: comparison of observed values with simulations for all reciprocal connections recorded in Pcdhg22 retinas. Unidirectional connections are significantly underrepresented in our data set. Bottom: comparison of observed values with simulations for all reciprocal connections recorded across all conditions. Unidirectional connections are significantly underrepresented in our data set, and non-connected pairs are significantly overrepresented in our data set. Statistics: n.s. = not significant, *p < 0.05, **p < 0.01.
Figure 2—figure supplement 3
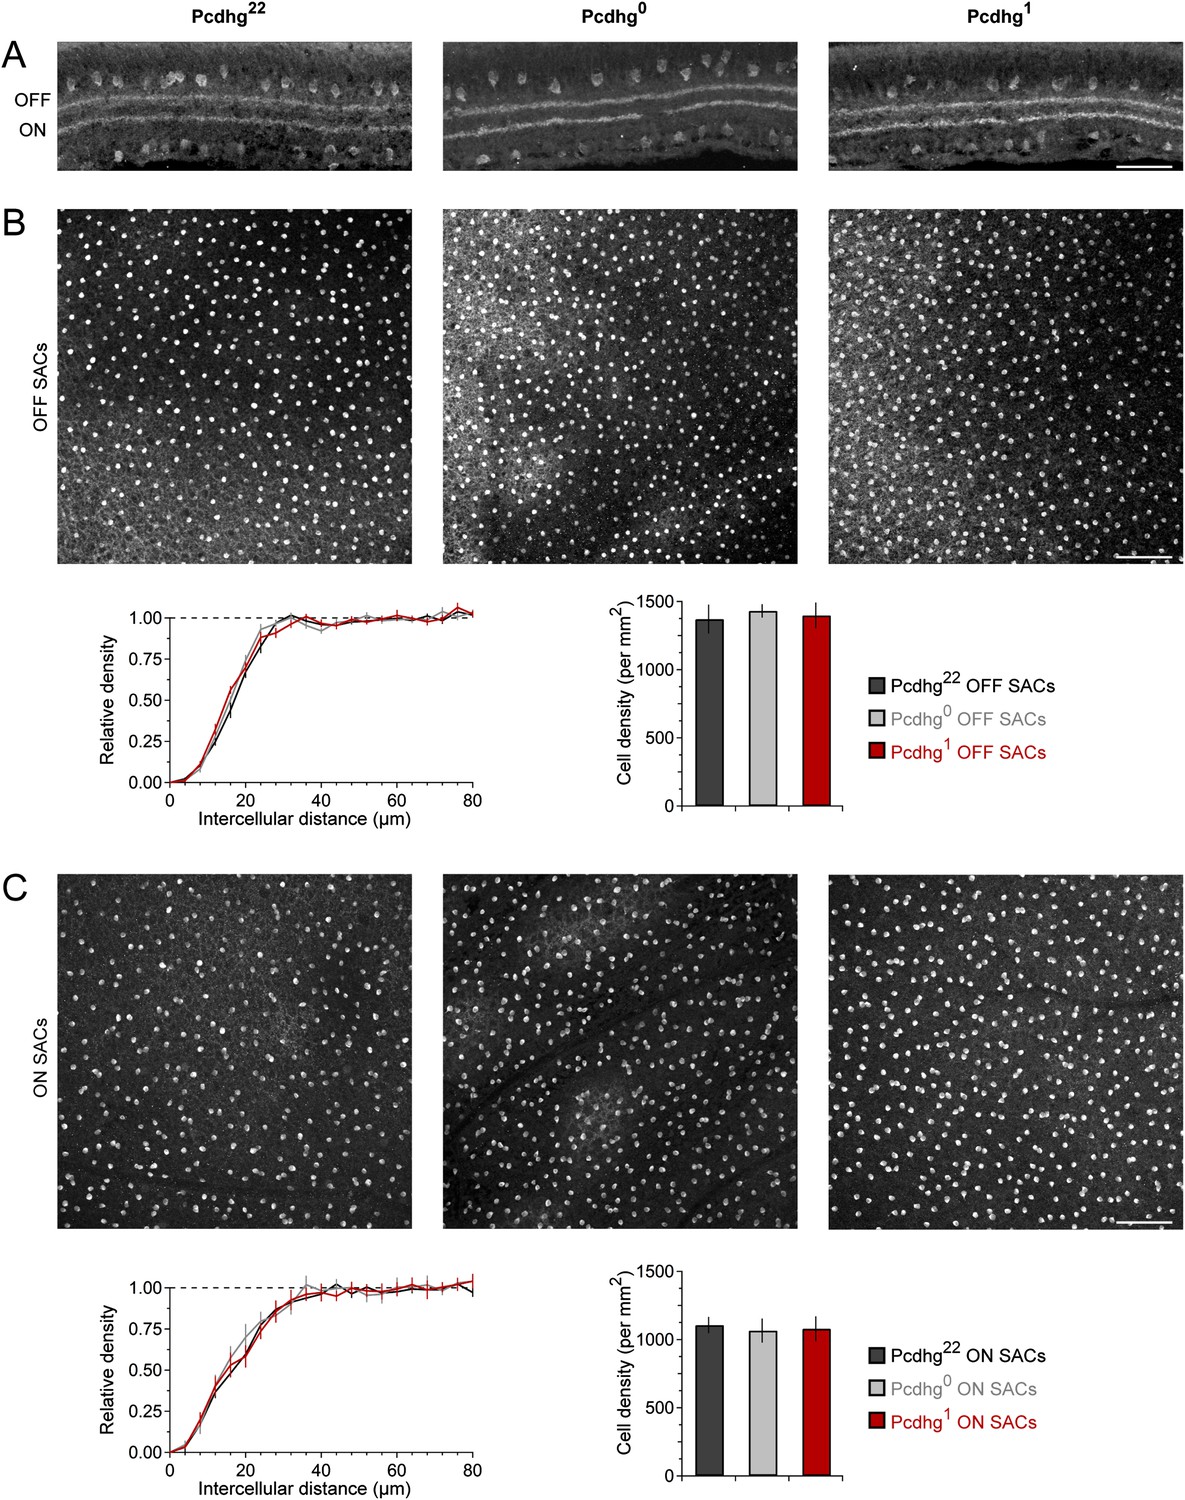
Lamination and spacing of SACs are normal in Pcdhg0 and Pcdhg1 retinas.
(A) Vertical section of retina stained against ChAT to label all SACs in Pcdhg22, Pcdhg0, and Pcdhg1 retinas (left to right). Scale bar = 50 μm. (B) Top: En face view of OFF SACs in Pcdhg22, Pcdhg0, and Pcdhg1 retinas (left to right, respectively). Scale bar = 100 μm. Bottom: density recovery profile of OFF SACs in Pcdhg22, Pcdhg0, and Pcdhg1 retinas (left) and total OFF SAC density. (C) Same as B but for ON SACs.
Figure 2—figure supplement 4
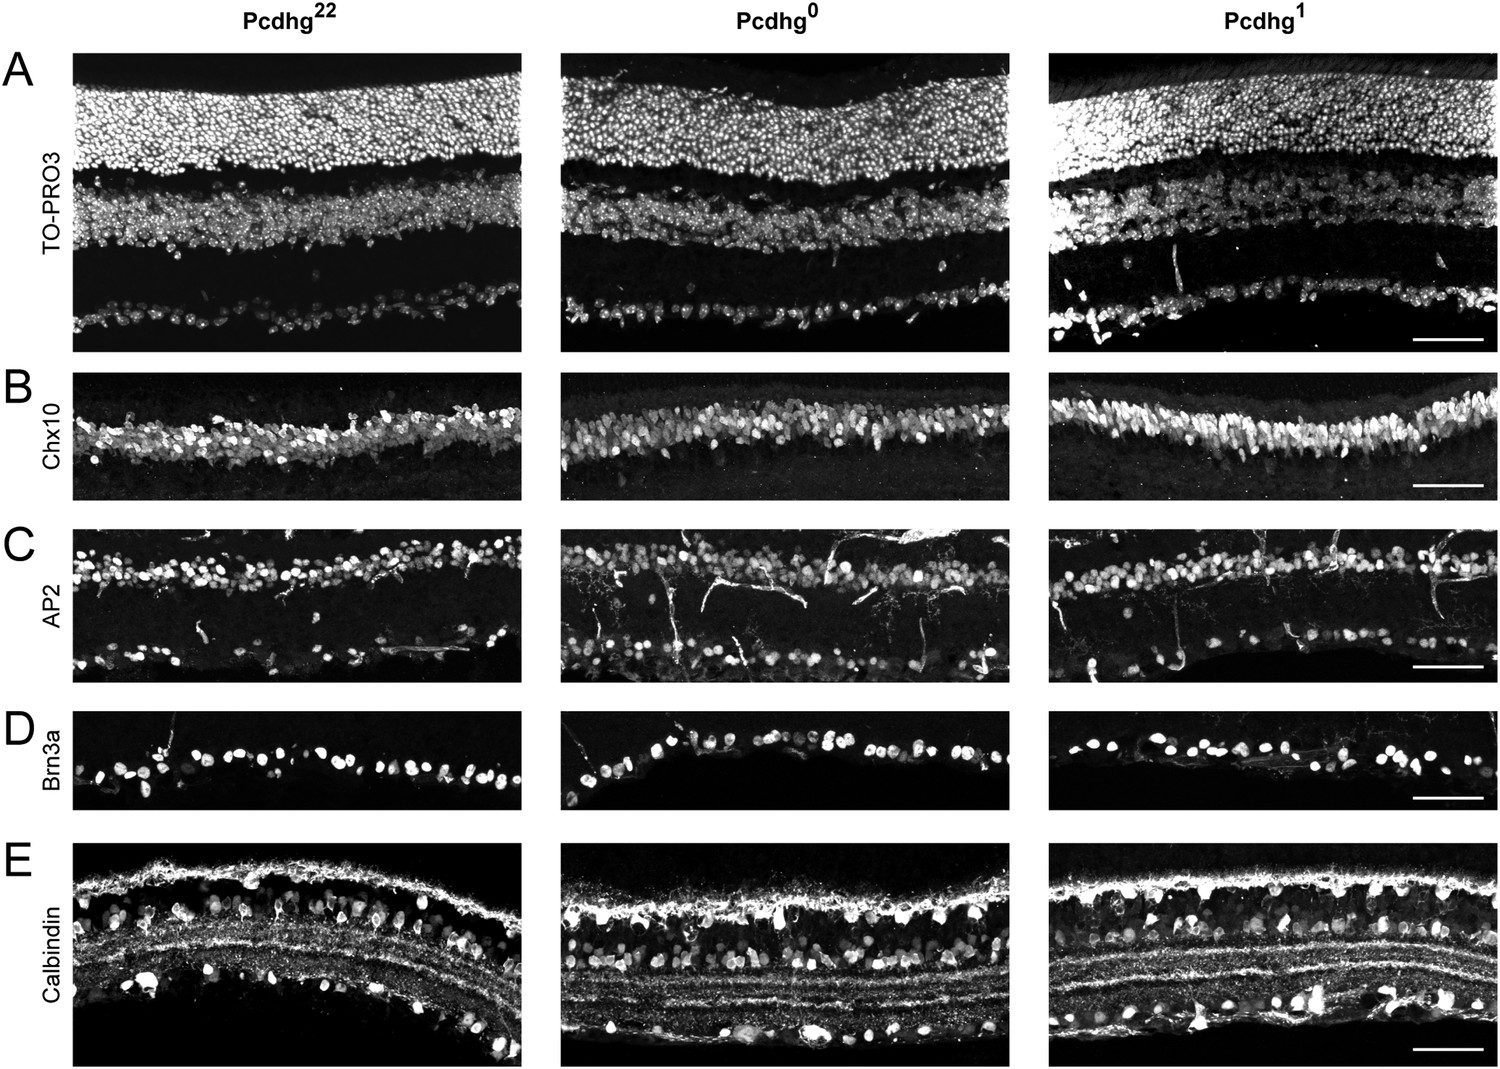
Normal retinal morphology in Pcdhg0 and Pcdhg1 retinas.
(A) Nuclear label of all retinal neurons (TO-PRO3) showing retinal thickness is similar across conditions. Whole retinal thickness is shown. (B) Anti-Chx10 immunostaining to label bipolar cells. Image is cropped to just show INL. (C) Anti-AP2 immunostaining to label amacrine cells. Image is cropped to just show INL through GCL. Some retinal blood vessels were also labeled because primary antibody is mouse monoclonal. (D) Anti-Brn3a immunostaining to label many retinal ganglion cells. Image is cropped to just show GCL. (E) Anti-Calbindin immunostaining to label horizontal cells, some amacrine cells, and some retinal ganglion cells. Image is cropped to just show outer plexiform layer through GCL. All images show examples from P21 Pcdhg22, Pcdhg0, and Pcdhg1 vertical retinal sections in parallel (left to right, respectively). Scale bar = 50 μm in all panels. Images are oriented with photoreceptors towards the top and retinal ganglion cells toward the bottom of the page.
Figure 3 with 1 supplement

Pcdhg0 SACs form autapses.
(A) SAC autaptic voltage stimulus (left). Single SAC recording configuration in Pcdhg22 (middle) and Pcdhg0 (right) retinas. (B–E) Example currents recorded from SACs in juvenile Pcdhg22 retinas (B), juvenile Pcdhg0 retinas (C), adult Pcdhg22 retinas (D) and adult Pcdhg0 retinas (E) in response to voltage stimulus shown in A. Arrowheads in C and E points to autaptic currents in SAC from Pcdhg0 retinas that were blocked by 50 μM picrotoxin (blue trace in C). Gray bars indicate depolarization steps to +60 mV (stimulus artifacts) that were 2 ms long in both B, C, and D, and 4 ms long in E. The shorter latency in E likely reflects the longer depolarization step. Full traces are shown as insets with enlarged regions outlined in magenta. (F) Peak outward currents measured during falling phase recorded current after initial voltage step to +60 mV. Data points are staggered slightly for visual clarity. Number of SACs recorded = 8, 8, 7, and 6 in juvenile Pcdhg22 retinas, juvenile Pcdhg0 retinas, adult Pcdhg22 retinas, and adult Pcdhg0 retinas, respectively. (G) Average peak autaptic currents evoked in SACs from Pcdhg0 retinas at P21-24 (left) and P40-100 (right) at Vh = −20 mV. Data are shown as mean ± S.E.M. See also Figure 3—figure supplement 1.
Figure 3—figure supplement 1
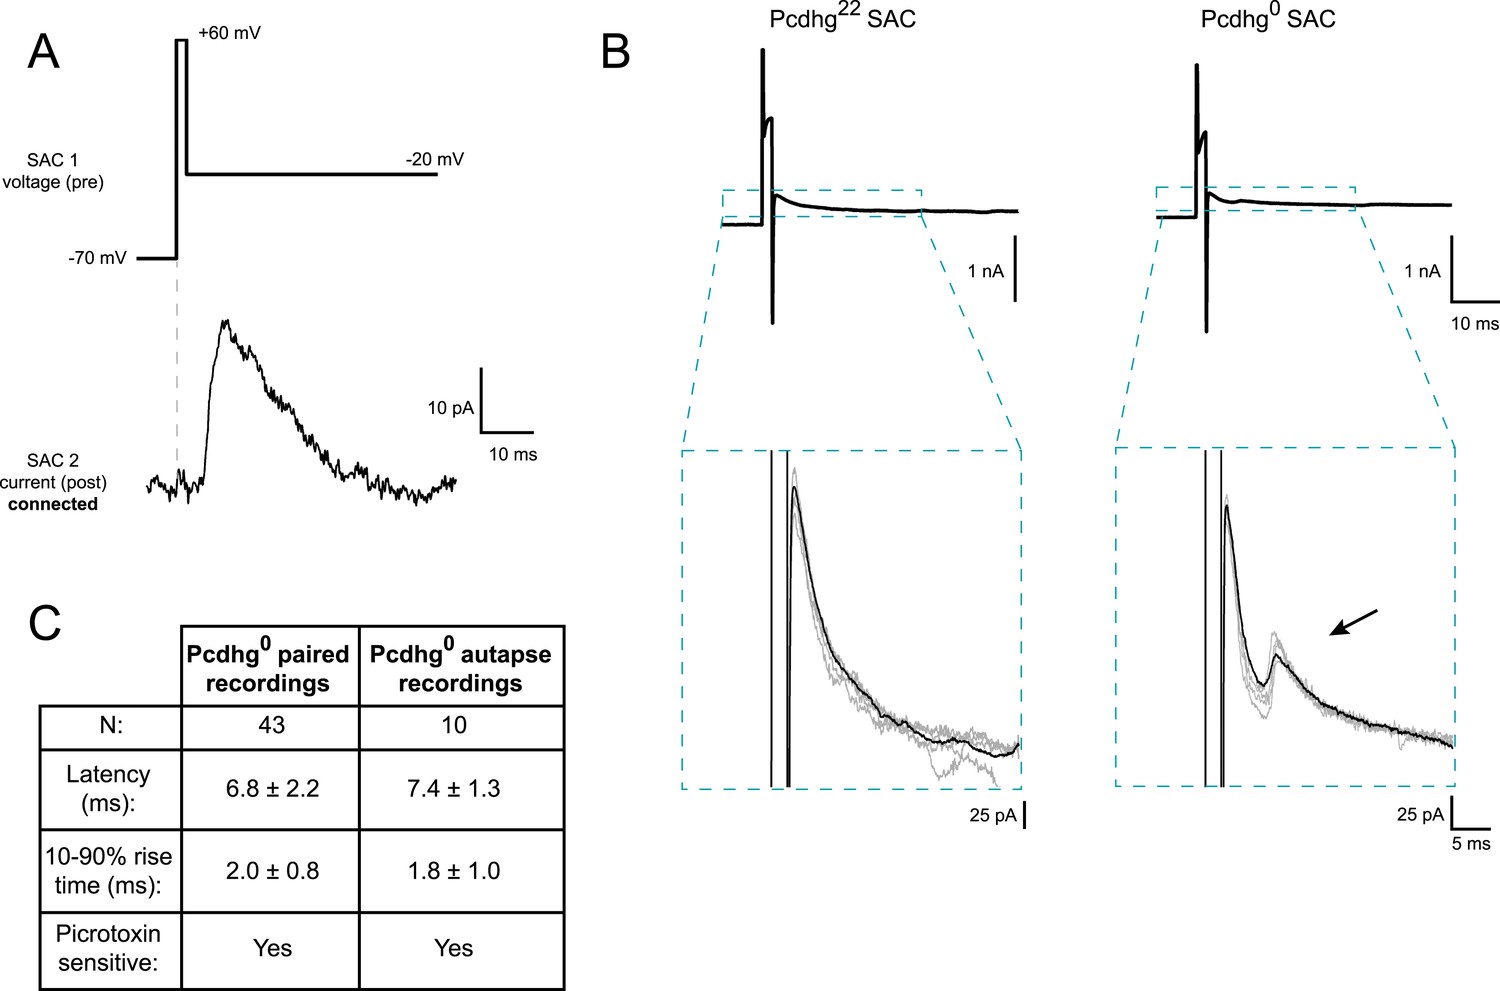
Quantification of autaptic currents.
(A) Example of paired recording using ‘autaptic’ voltage stimulus, showing that brief depolarization can evoke transmission in pairs of neurons. (B) Top: example current recordings of Pcdhg22 (left) and Pcdhg0 SACs in response to autaptic voltage stimulus. Bottom: insets from top panel showing averaged responses (black) and 4 raw traces in each condition (gray). (C) Comparison of synaptic and autaptic properties in SACs showing similarity in latency, rise time, and picrotoxin sensitivity. Data are shown as mean ± S.D.
Figure 4
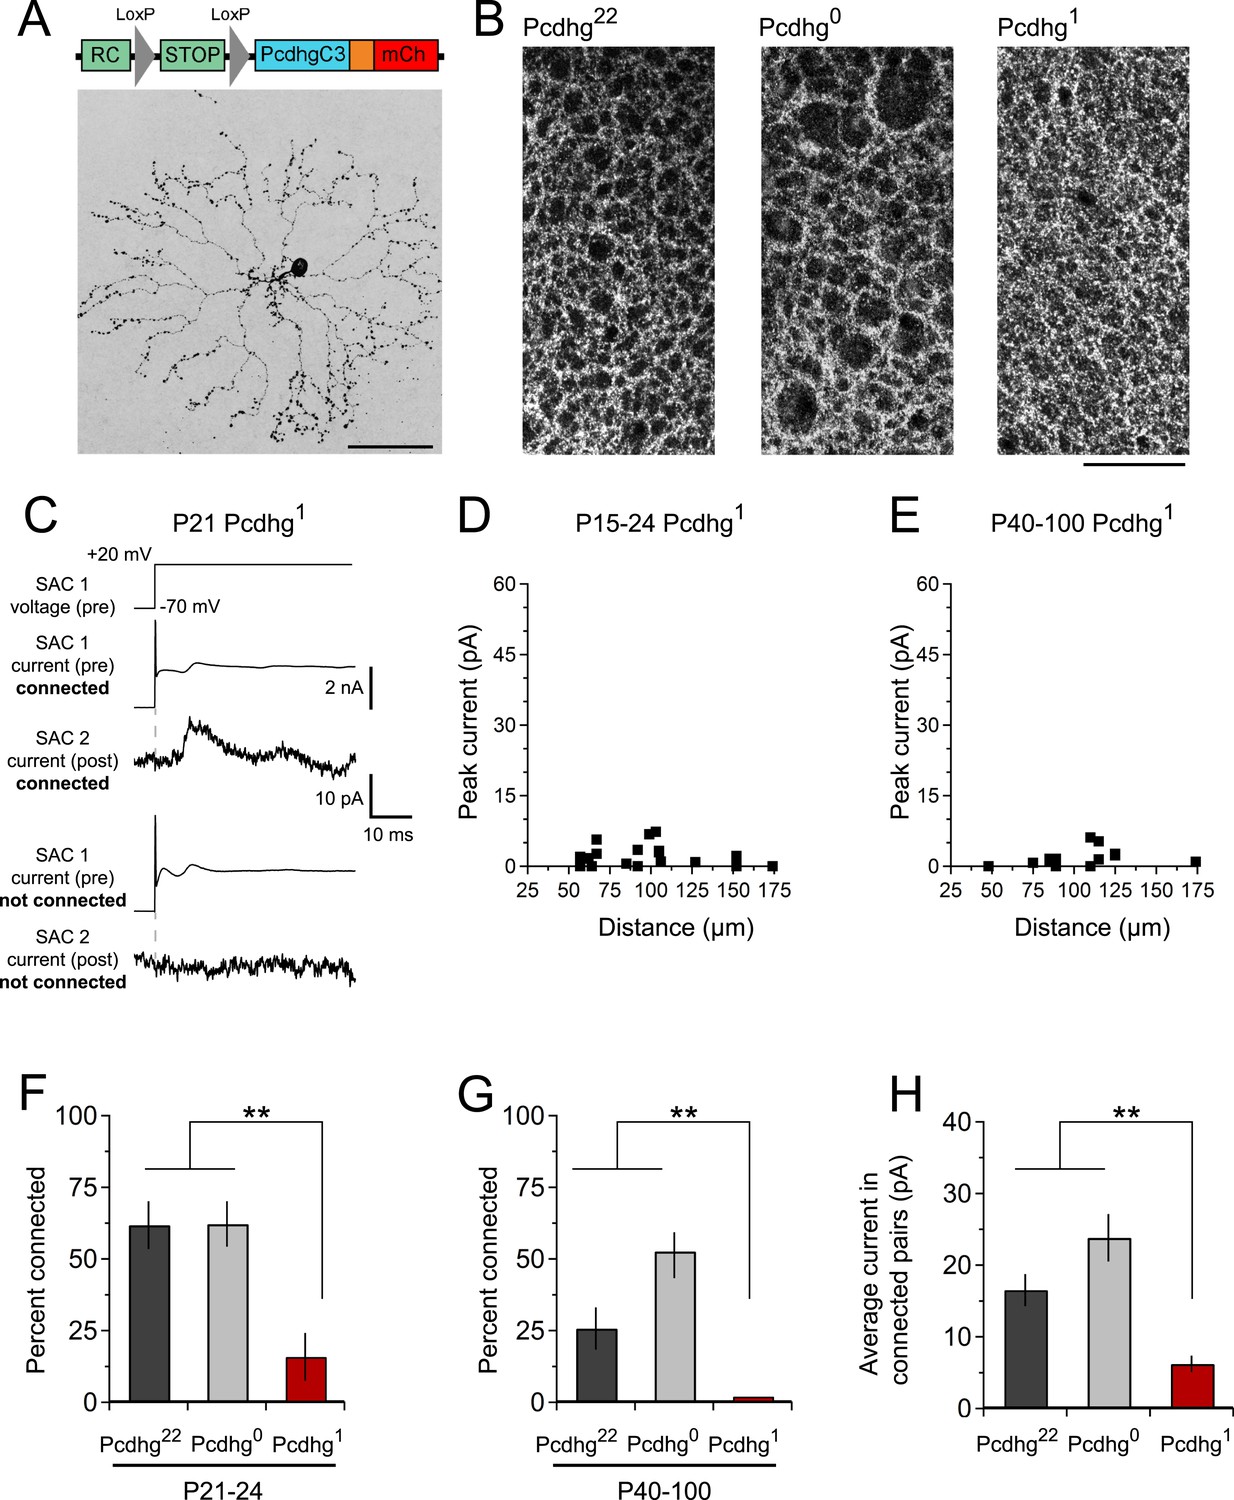
Decreased SAC–SAC connections in Pcdhg1 retina.
(A) Replacement of all 22 Pcdhgs in SACs with a single Pcdhg isoform (top) rescues self-avoidance in individual SACs (bottom). (B) Plexus of all SAC dendrites (stained with anti-ChAT) in Pcdhg22 (left), Pcdhg0 (middle), and Pcdhg1 (right) retinas. (C) Presynaptic voltage steps from Vh = −70 to +20 mV (top) and examples of currents recorded from both pre- and postsynaptic pairs of SACs that were connected (middle) and not connected (bottom) in juvenile Pcdhg1 retinas. (D–E) Scatter plots of intercellular distance vs peak current size in juvenile (D) and adult (E) Pcdhg1 retinas. (F) Percent of P15-24 recorded SAC pairs that were connected, irrespective of intercellular distance. Number of connections tested = 34, 37, and 19 in Pcdhg22, Pcdhg0, and Pcdhg1 retinas, respectively. (G) Same as F for adult retinas. Number of connections tested = 35, 39, and 13 in Pcdhg22, Pcdhg0, and Pcdhg1 retinas, respectively. (H) Average peak current in connected SAC pairs at all ages. Number of recorded connections = 30, 43, and 3 in Pcdhg22, Pcdhg0, and Pcdhg1 retinas, respectively. Scale bar = 50 μm in A and 25 μm in B. Data are shown as mean ± S.E.M. Statistics: **p < 0.01.
Figure 5 with 1 supplement
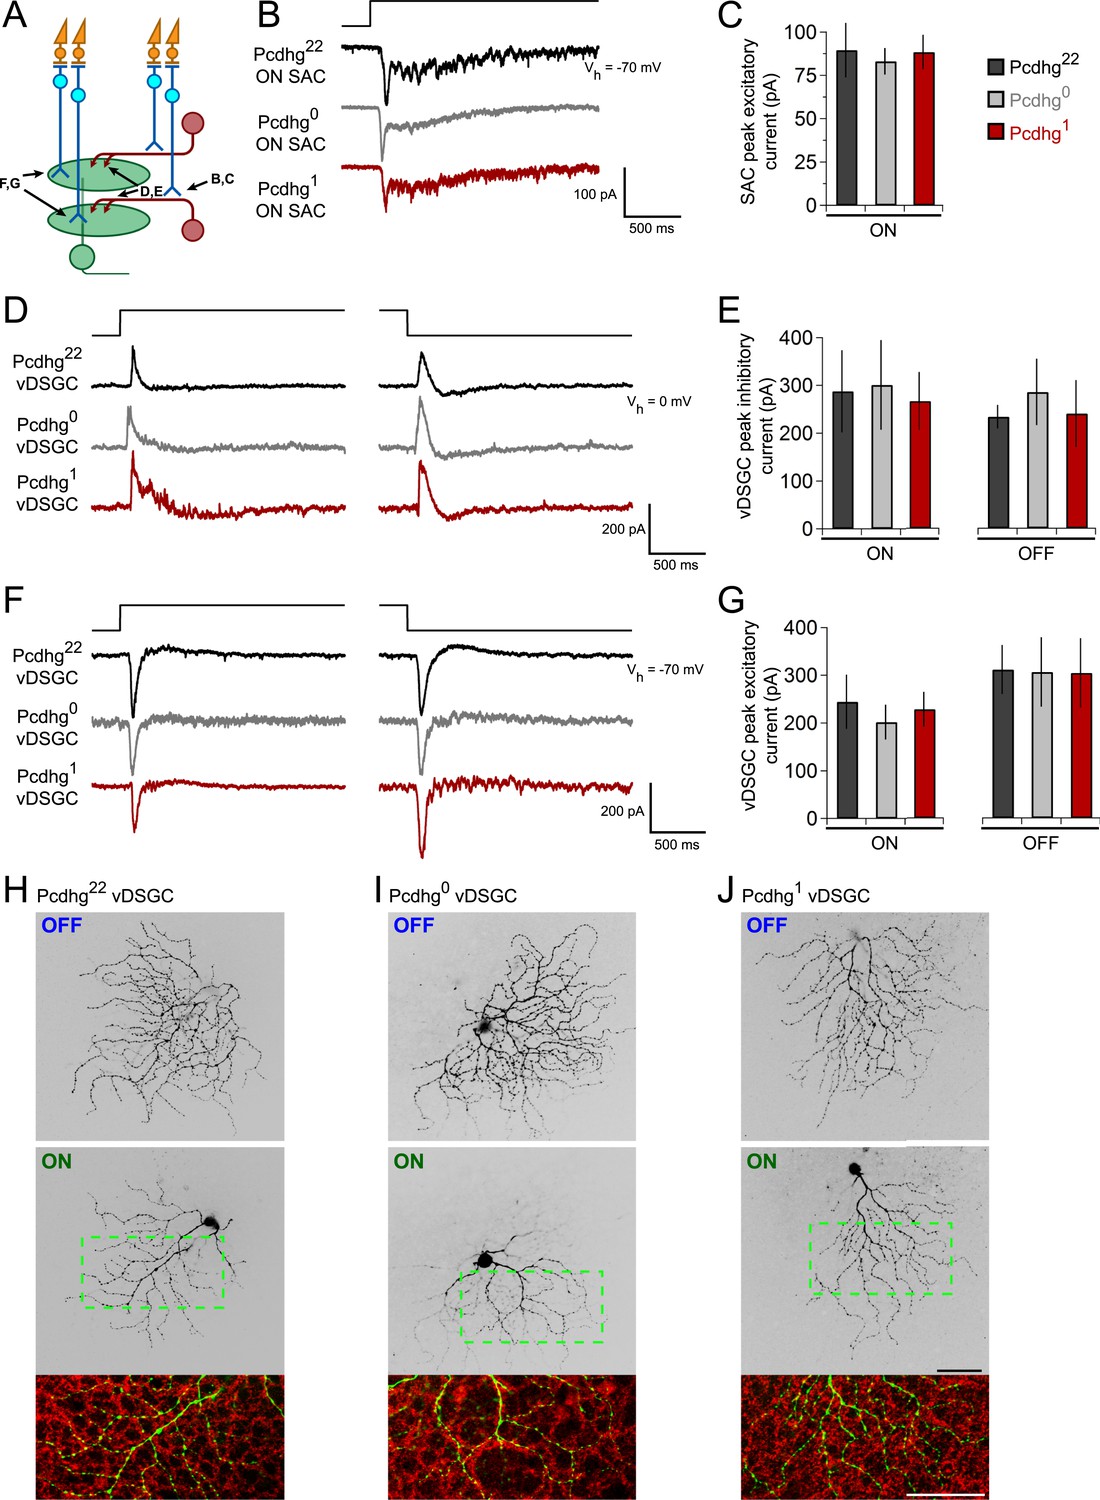
Integration of SACs into a direction-selective circuit is Pcdhg-independent.
(A) Schematic of excitatory and inhibitory synaptic inputs of retinal direction-selective circuit, showing bipolar inputs to SACs (measured in B and C), SAC inputs to DSGCs (measured in D and E), and bipolar inputs to DSGCs (measured in F and G). (B) Example excitatory currents (Vh = −70 mV) of ON SACs from Pcdhg22 (black), Pcdhg0 (gray), and Pcdhg1 (red) retinas evoked by a bright spot flash. (C) Average peak current responses to the onset of flash stimulus. Number of SACs recorded is 8, 9, and 7 in Pcdhg22, Pcdhg0, and Pcdhg1 retinas, respectively. (D) Example inhibitory currents (Vh = 0 mV) of vDSGCs from Pcdhg22, Pcdhg0, and Pcdhg1 retinas evoked by the onset (left) and offset (right) of a bright spot flash. (E) Average peak current responses to the onset (left) and offset (right) of flash stimulus. Number of vDSGCs recorded is 12, 13, and 10 in Pcdhg22, Pcdhg0, and Pcdhg1 retinas, respectively. (F) Example excitatory currents (Vh = −70 mV) of vDSGCs from Pcdhg22, Pcdhg0, and Pcdhg1 retinas evoked by the onset (left) and offset (right) of a 2 s bright spot flash. (G) Average peak current responses to the onset (left) and offset (right) of flash stimulus. Number of vDSGCs recorded is 14, 11, and 13 in Pcdhg22, Pcdhg0, and Pcdhg1 retinas, respectively. (H–J) Dye-filled vDSGCs with OFF and ON arborizations separated (top and middle, respectively) in Pcdhg22 (H), Pcdhg0 (I), and Pcdhg1 (J) retinas. Bottom panels: Overlay of ON vDSGC dendrites (green) with ON SAC dendrites labeled with anti-ChAT antibody (red). Similar co-fasciculation was seen for OFF dendrites. Scale bar = 50 μm. Data are shown as mean ± S.E.M. Spot flashes were displayed for 2 s in each case. See also Figure 5—figure supplement 1.
Figure 5—figure supplement 1
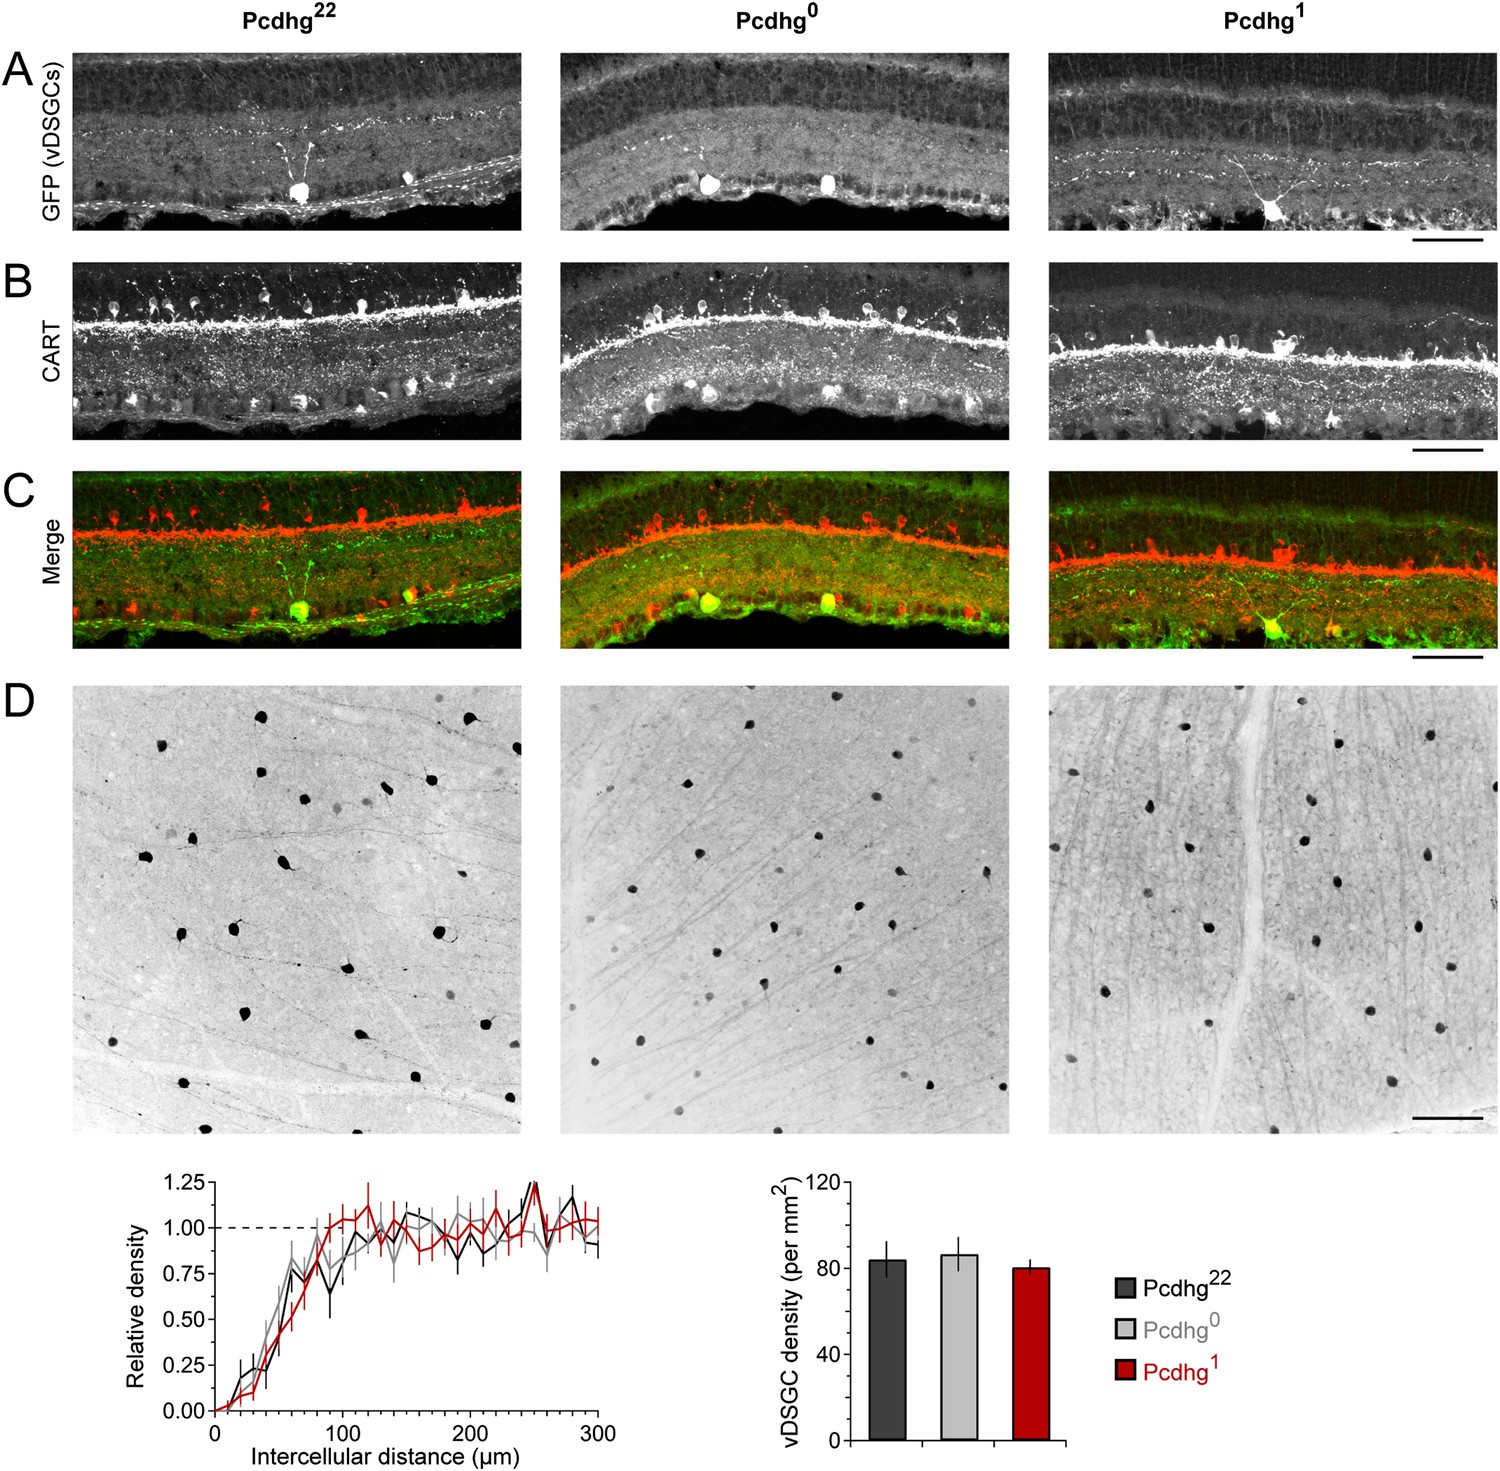
Normal expression, spacing, and number of vDSGCs in Pcdhg0 and Pcdhg1 retinas.
(A) Anti-GFP immunostaining in HB9-GFP positive retinas. Note that GFP signal is faint in dendrites by P21 but retained in cell body. Image is cropped to show INL through GCL. (B) Anti-CART immunostaining in same sections from A to label all populations of DSGCs. (C) Merge of panels A and B showing that HB9-GFP positive vDSGCs are positive for CART but not the only CART positive cells in the GCL. Note that CART antibody also labels Tyrosine hydroxylase-positive amacrine cells strongly in IPL sublamina 1. (D) Top: En face view of field of HB9-positive vDSGCs (inverted contrast). Bottom: density recovery profile of HB9-GFP positive vDSGCs in Pcdhg22, Pcdhg0, and Pcdhg1 retinas (left) and total HB9-GFP positive vDSGC density. All images show examples from P21 Pcdhg22, Pcdhg0, and Pcdhg1 retinas in parallel (left to right, respectively). Scale bar = 50 μm in panels A–C and 100 μm in panel D. Images in panels A–C are vertical retinal sections oriented such that photoreceptors are towards the top of the page.
Figure 6 with 2 supplements

Alteration of Pcdhg expression degrades direction selectivity.
(A) Spiking responses of vDSGC from adult Pcdhg22 retina to a bright moving bar moving in 8 directions. Polar plot is of peak firing rates in response to bar entering (ON, green) and exiting (OFF, blue) the receptive field center. Vectors represent vector sum direction-selective indices (DSIs) of ON and OFF responses. Surrounding central plots are spike histograms used to make polar plot and calculate DSIs and preferred directions. (B) ON (left, green) and OFF (right, blue) DSI vectors for all recorded DSGCs in Pcdhg22 retina (n = 28 cells). Axes of retina are indicated with compass arrows: D, V, N, and T represent dorsal, ventral, nasal, and temporal. (C, D) Same as A and B but from adult Pcdhg0 retinas (n = 28 cells). (E, F) Same as A and B but from adult Pcdhg1 retinas (n = 19 cells). (G) Mean absolute DSI for all cells recorded, irrespective of which direction they preferred. (H) Mean angle deviated from ventral direction for all cells recorded. (I) Mean absolute difference between DSI (left) and angle of preference (right) for all recorded cells. (J) Plot of mean ventral projections of DSI vectors. For each recorded vDSGC in J, maximal ON and OFF firing rates in each direction were summed and used to generate a single DSI vector for each cell. Data are shown as mean ± S.E.M. Statistics: n.s. = not significant, *p < 0.05, **p < 0.01, ***p < 0.001. See also Figure 6—figure supplements 1, 2.
Figure 6—figure supplement 1
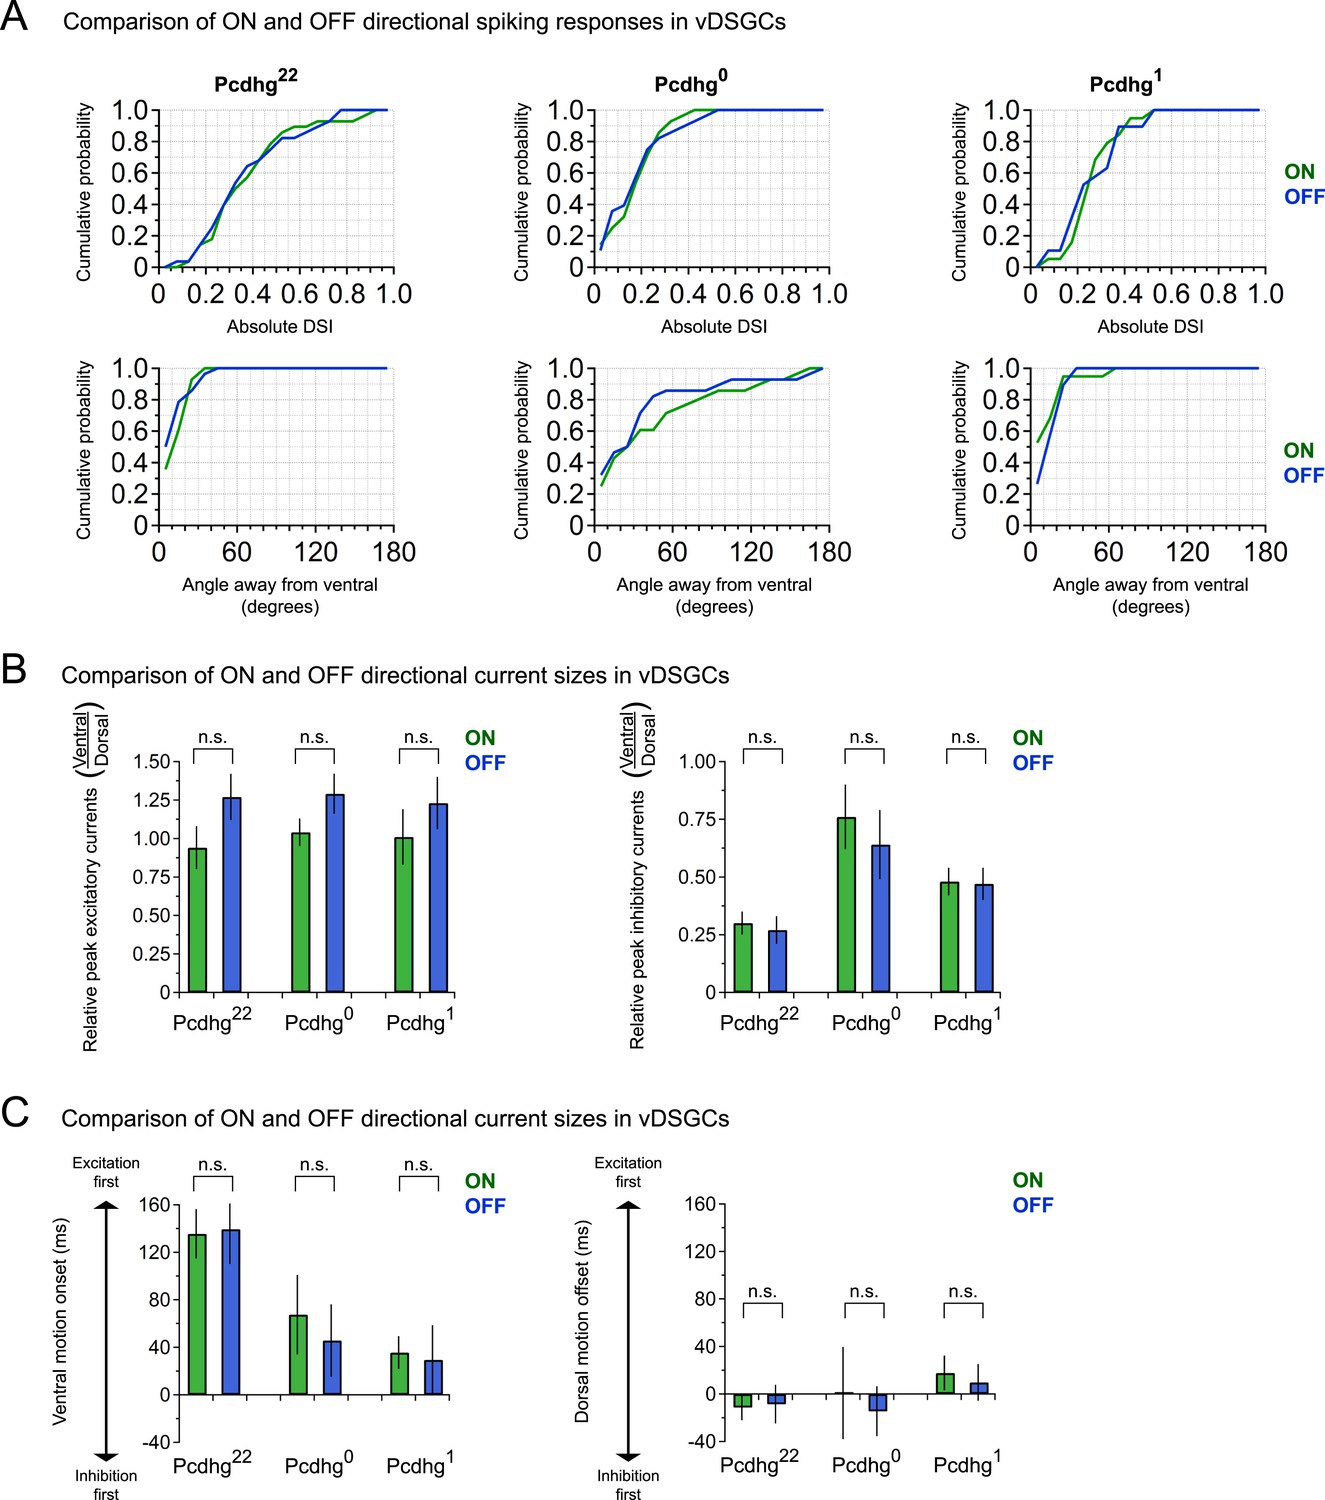
ON and OFF direction responses of vDSGCs are similarly blunted when Pcdhg expression in SACs is altered.
(A) Cumulative histogram of ON and OFF direction-selective indices (top) and angle away from ventral (bottom) for all recorded vDSGCs in Pcdhg22, Pcdhg0, and Pcdhg1 retinas (n = 28, 28, and 19, respectively). Histogram bins are 0.05 DSI units and 10° for top and bottom panels, respectively. (B) Ratios of excitatory (left) and inhibitory (right) ON and OFF current sizes (ventral over dorsal motion) for all recorded cells in Pcdhg22, Pcdhg0, and Pcdhg1 retinas (Excitatory n = 14, 10, and 10 ON and OFF each, respectively; Inhibitory n = 14, 10, and 13 ON and OFF each, respectively). (C) Relative timing of ON and OFF excitation compared to inhibition during ventral motion (left) and dorsal motion (right) for all recorded cells in Pcdhg22, Pcdhg0, and Pcdhg1 retinas (n = 12, 8, and 8 ON and OFF each, respectively). ON and OFF responses are shown in green and blue, respectively. Statistics: n.s. = not significant.
Figure 6—figure supplement 2
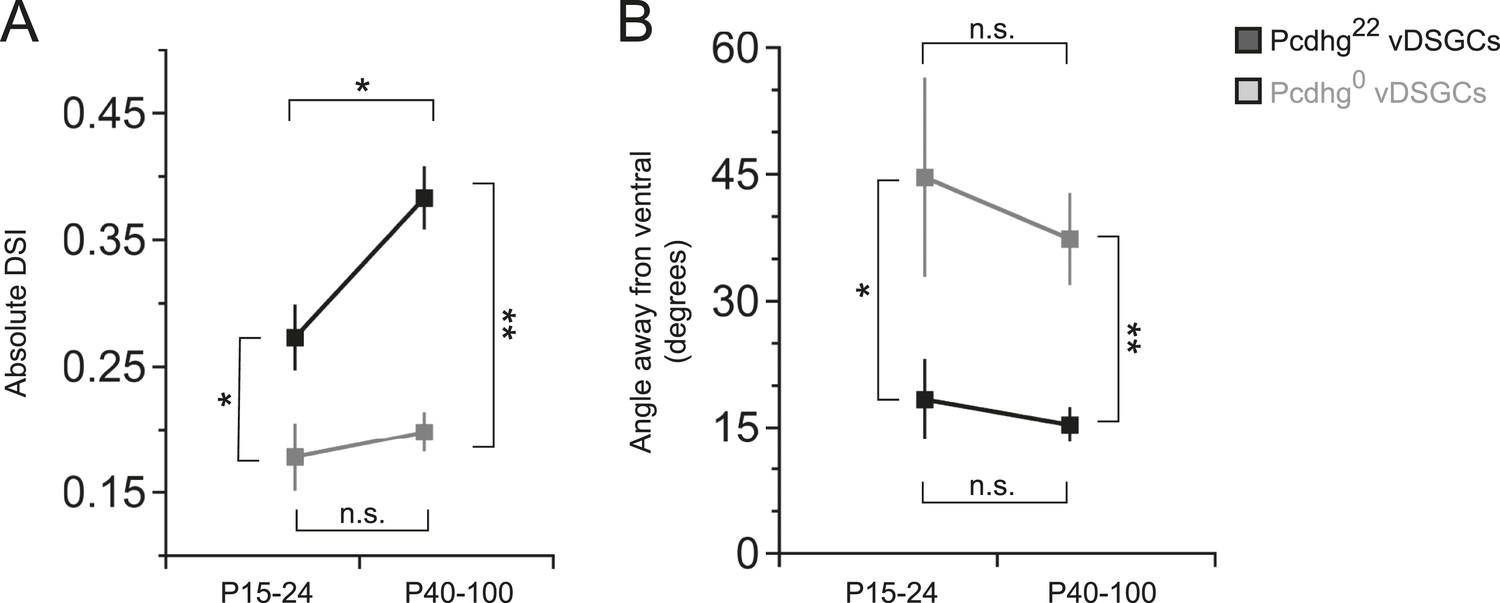
Age-dependent improvement in direction selectivity of vDSGCs requires Pcdhgs.
(A) Comparison of DSI of juvenile and adult vDSGCs in Pcdhg22 and Pcdhg0 retinas. (B) Comparison of deviations from ventral of juvenile and adult vDSGCs Pcdhg22 and Pcdhg0 retinas. Statistics: n.s. = not significant, *p < 0.05, **p < 0.0005. n = 10 and 6 for P15-24 Pcdhg22 and Pcdhg0 vDSGCs, respectively, and n = 28 and 28 for adult Pcdhg22 and Pcdhg0 vDSGCs, respectively. Leading edge (ON) and trailing edge (OFF) responses were measured for all cells and used as independent data points.
Figure 7
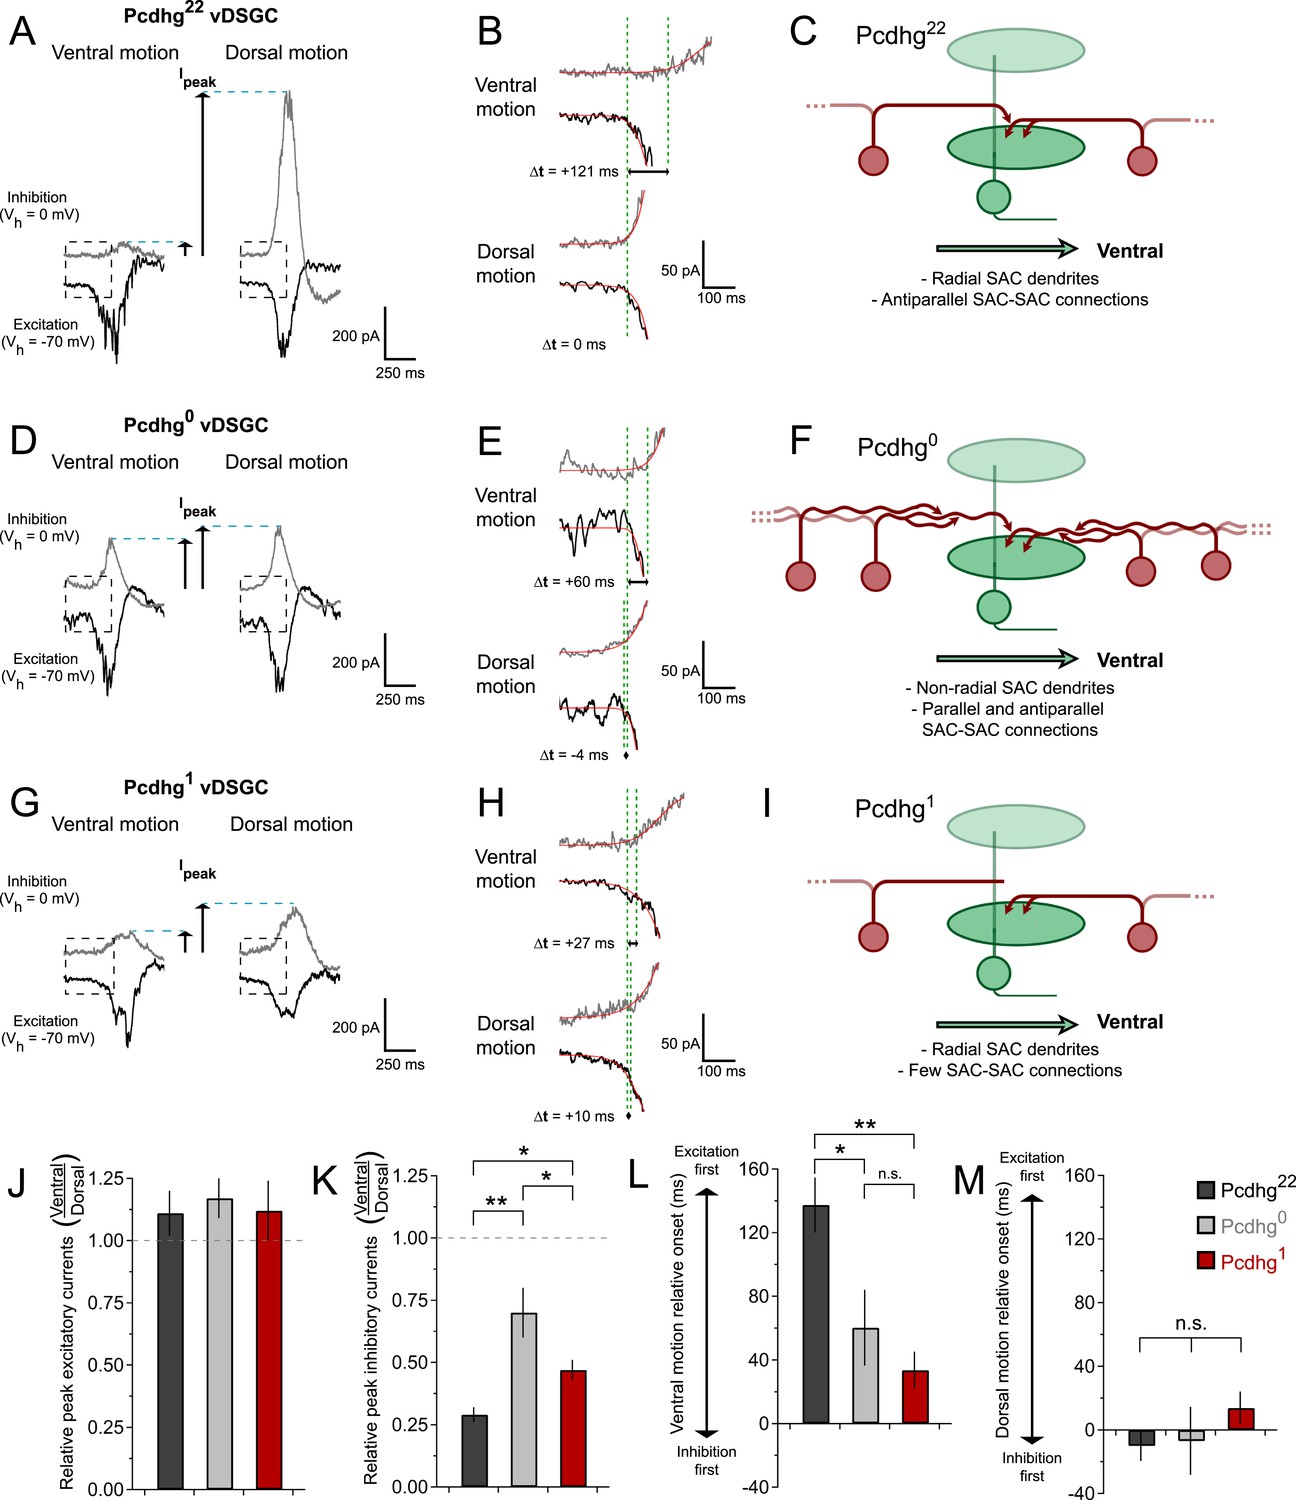
Synaptic basis of degraded direction selectivity in Pcdhg0 and Pcdhg1 retinas.
(A) Example excitatory (black, Vh = −70 mV) and inhibitory (gray, Vh = 0 mV) currents evoked by leading edge (ON response) of bar moving in ventral (left) and dorsal (right) directions in vDSGC from Pcdhg22 retina. (B) Examples of relative timing of excitation and inhibition in same cell from panel A. (C) Schematic of inhibitory input to vDSGCs in Pcdhg22 retinas. vDSGCs receive inhibitory input from SAC dendrites with predominately dorsal orientations and directional preferences, setting the null direction of vDSGCs. These SAC dendrites, in turn, receive inhibitory input from SAC dendrites with predominately ventral orientation and preference, suppressing inhibition to vDSGCs during ventral motion through inhibition of inhibition. (D, E) Same as A, B but in Pcdhg0 retina. (F) Schematic of inhibitory input to vDSGCs in Pcdhg0 retinas. vDSGCs receive inhibitory input from curvilinear SAC dendrites with disrupted orientations and directional preferences, diminishing their ability to set the null direction of vDSGCs. These SAC dendrites, in turn, receive inhibitory input from both parallel and antiparallel SAC dendrites. (G, H) Same as A, B but for trailing edge (OFF response) in Pcdhg1 retina. (I) Schematic of inhibitory input to vDSGCs in Pcdhg1 retinas. vDSGCs receive inhibitory input from SAC dendrites with predominately dorsal orientations and directional preferences, setting the null direction of vDSGCs. These SAC dendrites, however, are no longer inhibited by SAC dendrites with predominately ventral orientation and preference, so their input to vDSGCs during ventral motion is not suppressed. (J) Ratio of peak excitatory current sizes evoked in vDSGCs by ventral vs dorsal motion in Pcdhg22 (black), Pcdhg0 (gray), and Pcdhg1 (red) retinas. (K) Same as J but for inhibitory currents. (L) Relative timing of onset of excitation compared to inhibition during ventral motion in Pcdhg22 (black), Pcdhg0 (gray), and Pcdhg1 (red) retinas. (M) Same as L but during dorsal motion. Data are shown as mean ± S.E.M. Number of recorded vDSGCs = 14, 10, and 13 in Pcdhg22, Pcdhg0, and Pcdhg1 retinas. Leading edge (ON) and trailing edge (OFF) responses were measured for all cells and used as independent data points for quantification. Statistics: n.s. = not significant, *p < 0.05, **p < 0.001.
Additional files
-
Source code 1
Visual stimuli.
- https://doi.org/10.7554/eLife.08964.018
-
Source code 2
Microscope acquisition.
- https://doi.org/10.7554/eLife.08964.019
-
Source code 3
Electrophysiology analysis.
- https://doi.org/10.7554/eLife.08964.020
Download links
A two-part list of links to download the article, or parts of the article, in various formats.
Downloads (link to download the article as PDF)
Open citations (links to open the citations from this article in various online reference manager services)
Cite this article (links to download the citations from this article in formats compatible with various reference manager tools)
Protocadherin-dependent dendritic self-avoidance regulates neural connectivity and circuit function
eLife 4:e08964.
https://doi.org/10.7554/eLife.08964


