Deconvoluting heme biosynthesis to target blood-stage malaria parasites
- Washington University School of Medicine, United States
Figures
Figure 1 with 4 supplements

Exogenous ALA stimulates protoporphyrin IX (PPIX) biosynthesis in Plasmodium-infected erythrocytes.
(A) Schematic depiction of the heme biosynthesis pathway in Plasmodium falciparum parasites. Enzymes abbreviations are in red and pathway substrates and intermediates are in black: ALAS (aminolevulinic acid synthase), ALAD (aminolevulinic acid dehydratase), PBGD (porphobilinogen deaminase), UROS (uroporphyrinogen synthase), UROD (uroporphyrinogen decarboxylase), CPO (coproporphyrinogen III oxidase), PPO (PPIX oxidase), FC (ferrochelatase). For simplicity, all organelles are depicted with single membranes. Succinylacetone (SA) inhibits ALAD. (B) Bright field and fluorescence microscopy images of untreated and 200 µM aminolevulinic acid (ALA)-treated parasites. Fluorescence images were acquired with a Zeiss filter set 43 HE (excitation 537–562 nm, emission 570–640 nm). (C) Growth of asynchronous 3D7 parasites in the presence or absence of 200 µM ALA and 50 µM SA, with 2-min exposures to white light on an overhead projector on days 0–2. Parasitemia (percentage of total erythrocytes infected with parasites) as a function of time was fit with an exponential growth equation.
Figure 1—figure supplement 1
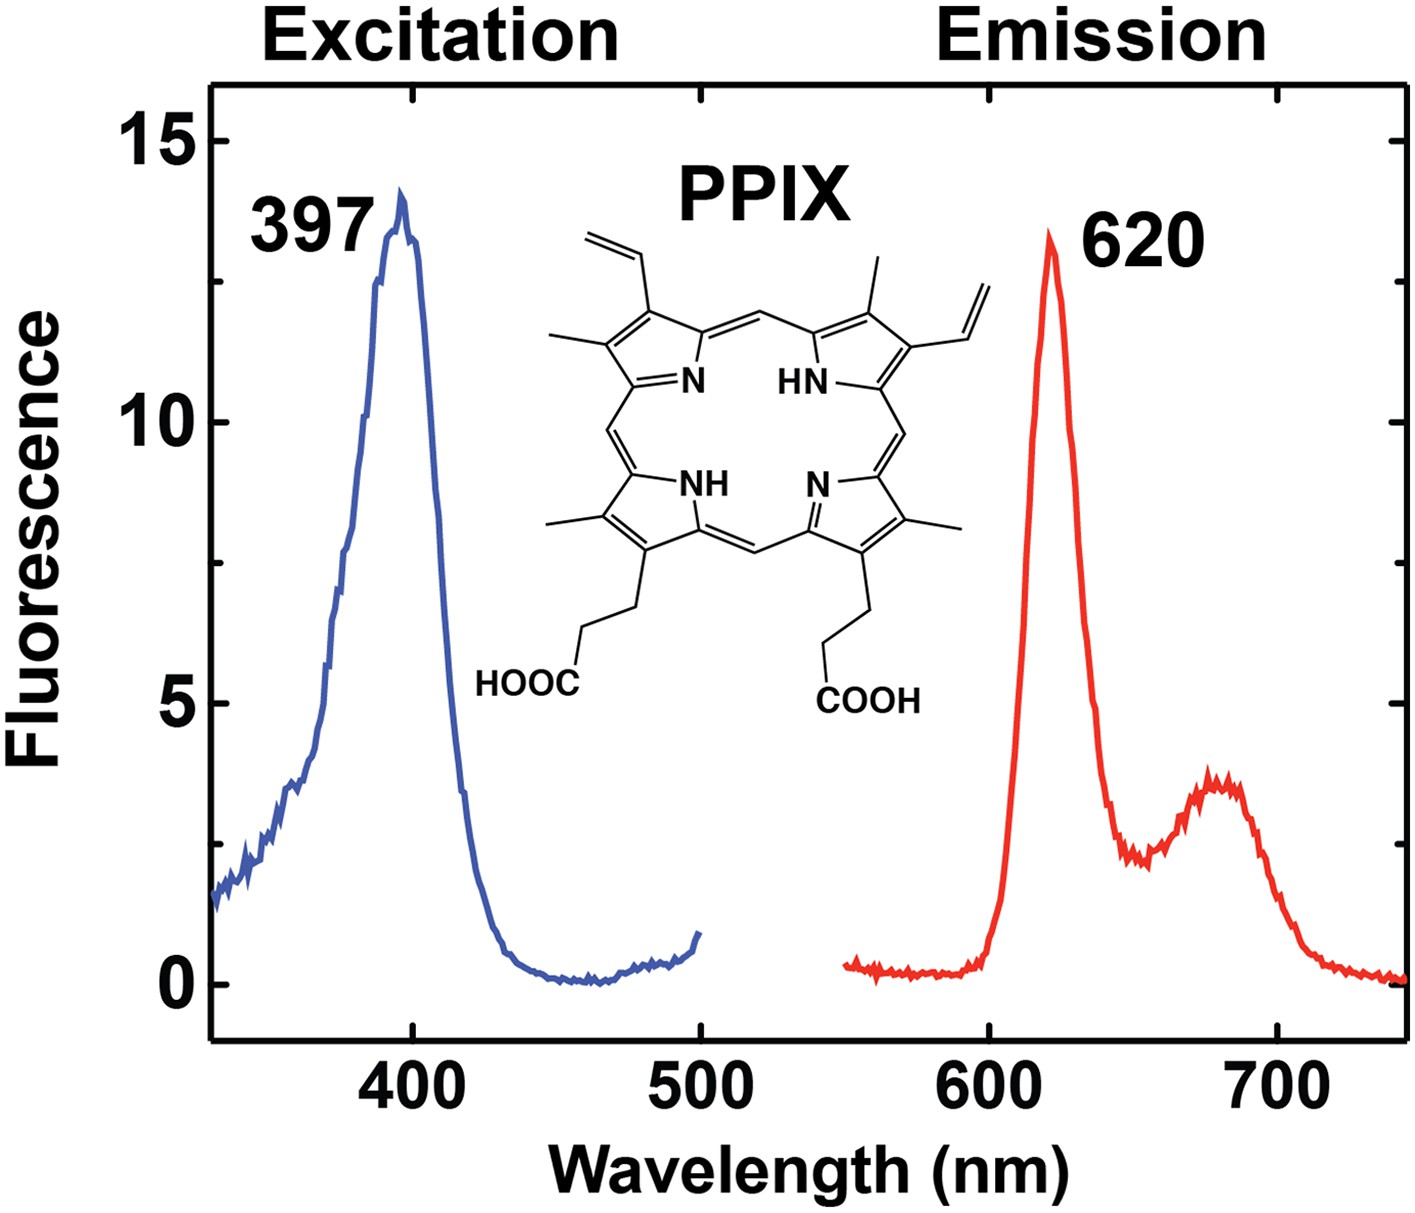
Fluorescence excitation and emission spectrum of PPIX in aqueous buffer.
https://doi.org/10.7554/eLife.09143.004
Figure 1—figure supplement 2
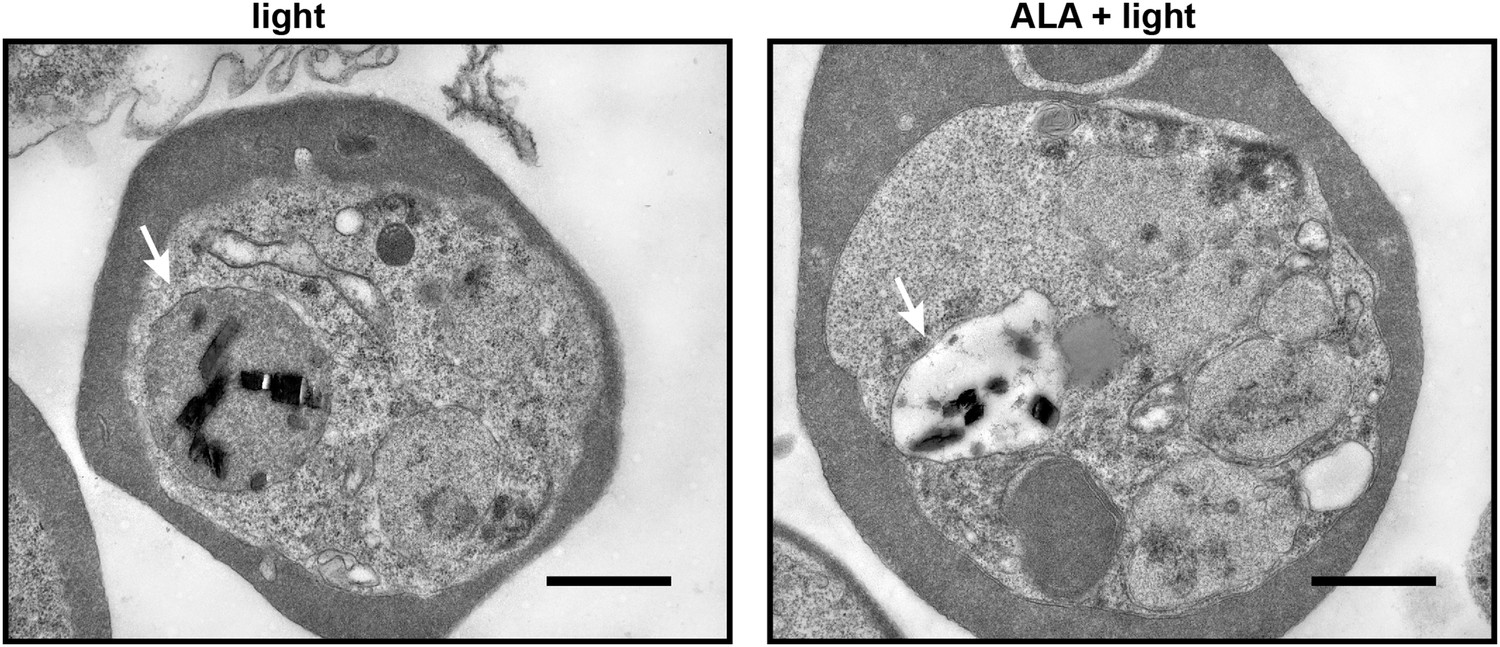
Transmission electron microscopy images of untreated and 500 µM ALA-treated P. falciparum-infected erythrocytes after light exposure on an overhead projector light box.
The white arrow identifies the digestive vacuole. Scale bar equals 1 µm.
Figure 1—figure supplement 3
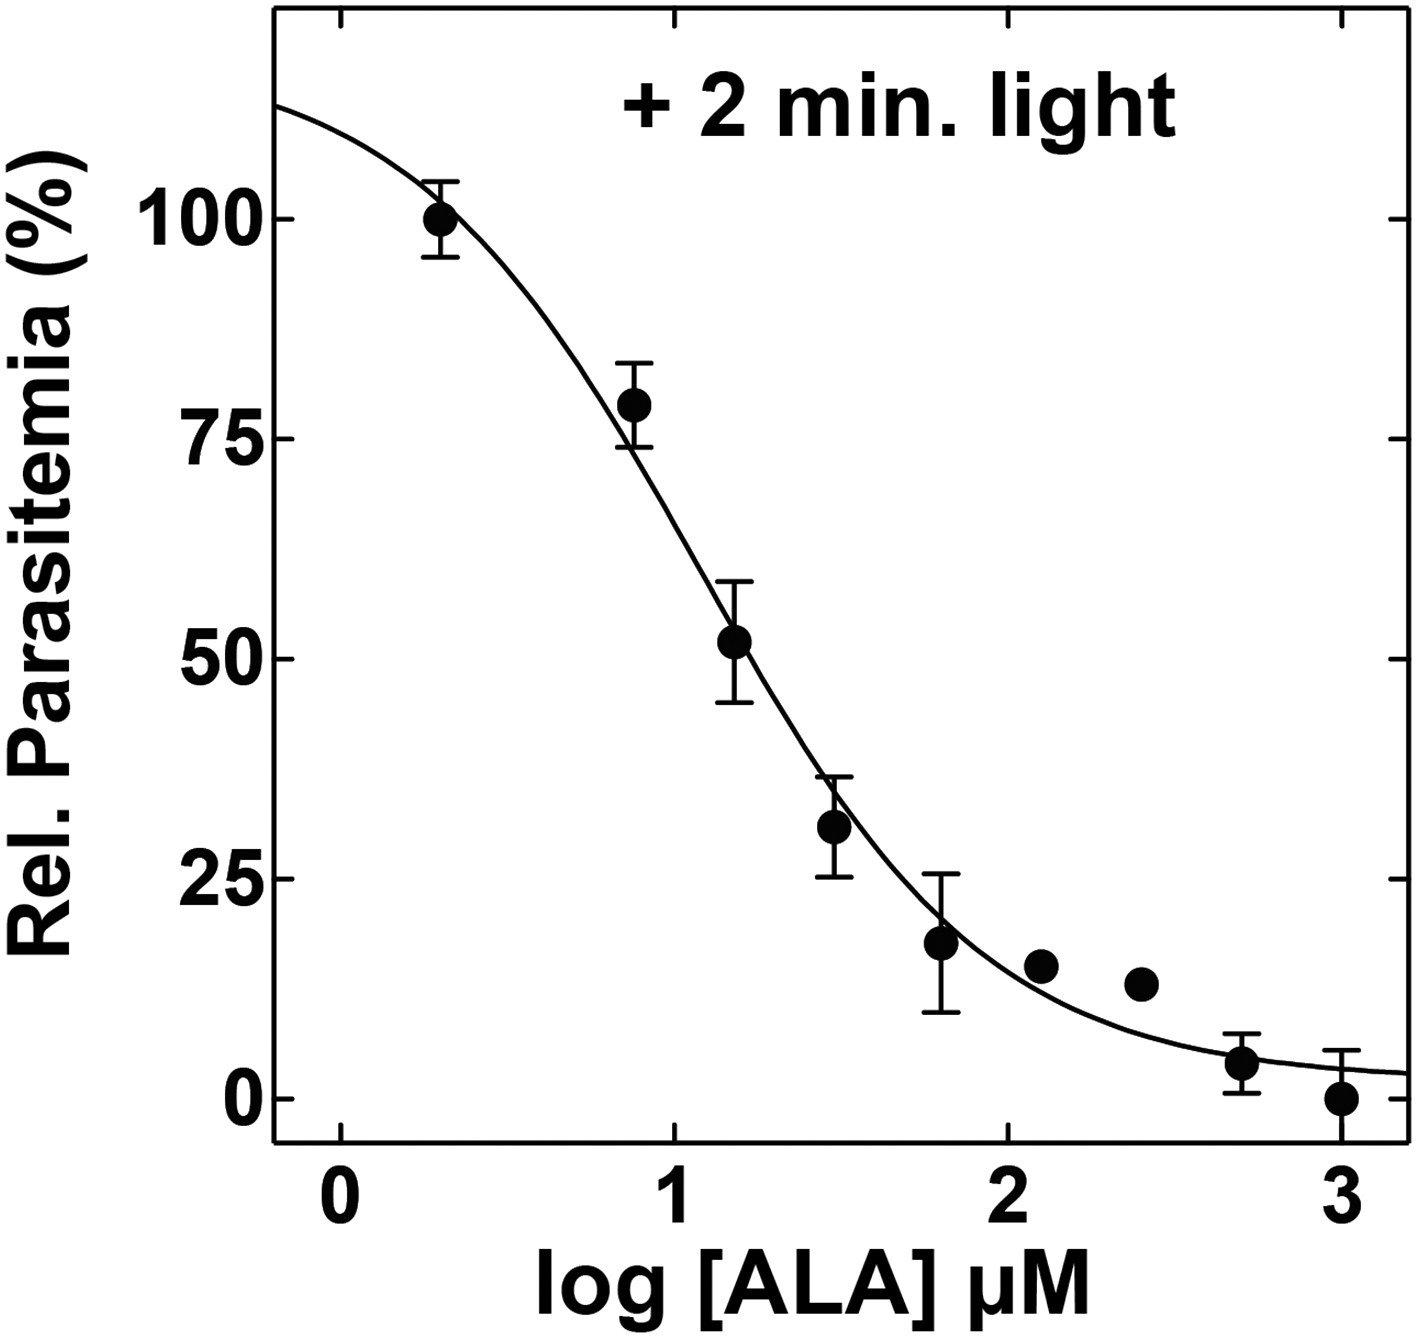
ALA dose dependence of photosensitivity by blood-stage Plasmodium parasites.
Asynchronous parasites were cultured in the indicated concentration of ALA and exposed to 2 min light daily. Parasitemia was measured after 48 hr and normalized to a reference culture grown without ALA.
Figure 1—figure supplement 4
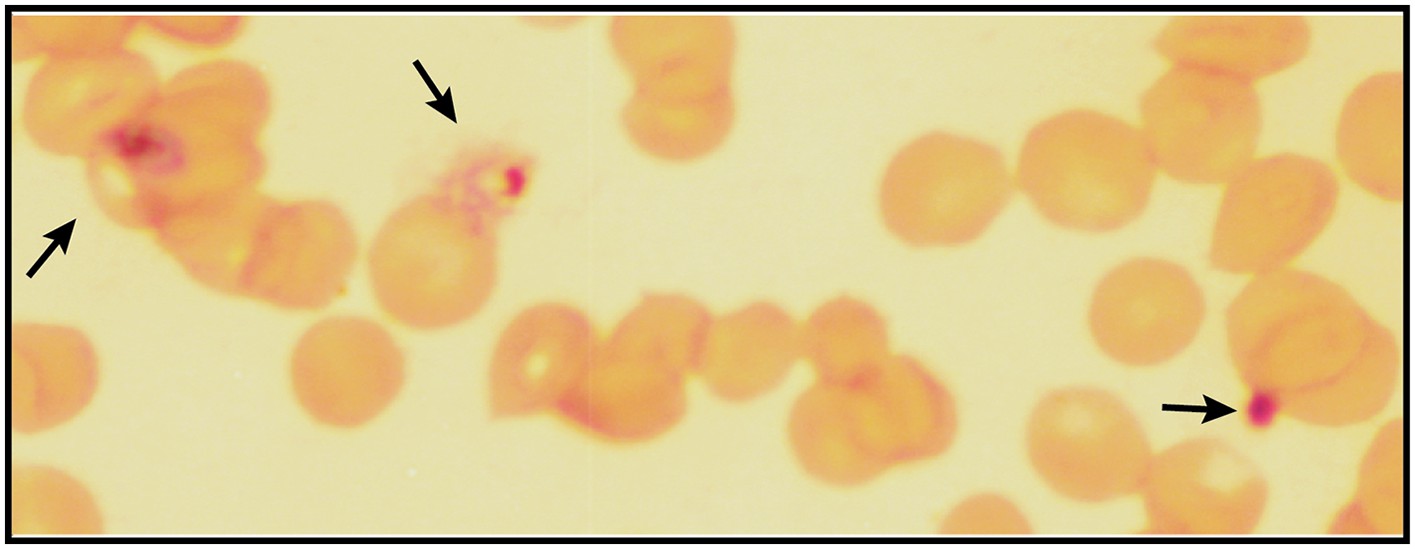
Giemsa-stained blood smear of P. falciparum culture after 3 days of treatment with 200 µM ALA and 2-min daily light exposure on an overhead projector light box.
Black arrows identify dead parasite remnants.
Figure 2 with 7 supplements
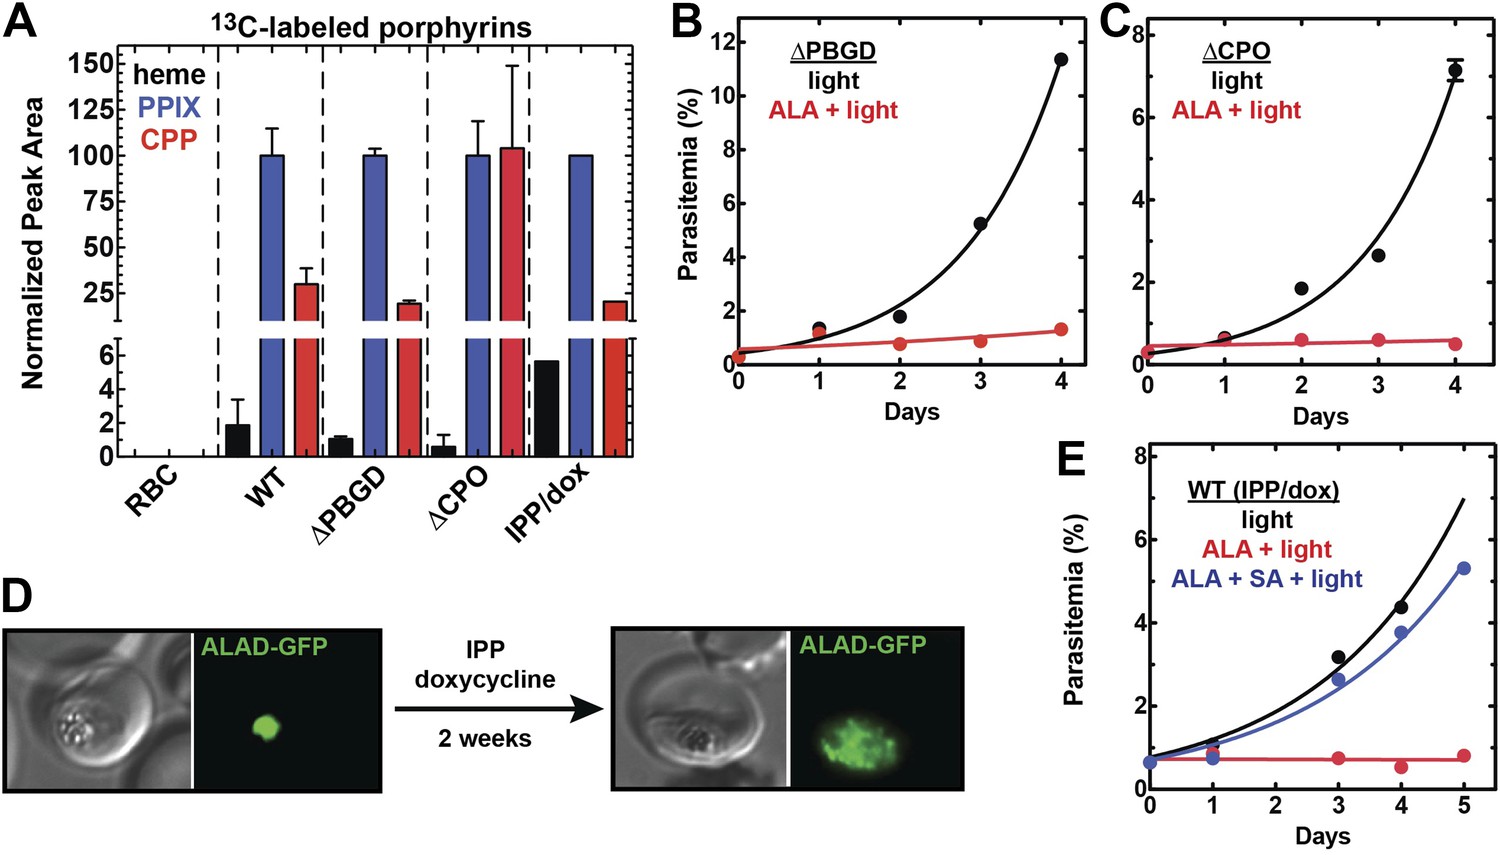
Heme biosynthesis in infected erythrocytes persists despite disruption of parasite enzymes or the apicoplast.
(A) Liquid chromatography-tandem mass spectrometry (LC-MS/MS) detection of 13C-labelled heme, PPIX, and coproporphyrinogen III (CPP) in parasites grown in 200 µM 5-[13C4]-ALA. Parasites were extracted in dimethyl sulfoxide (DMSO), supplemented with deuteroporphyrin as an internal standard, and analyzed by LC-MS/MS. Integrated analyte peak areas were normalized to PPIX in each sample. RBC: uninfected red blood cells, WT: parental clone 3D7, IPP/dox: isopentenyl pyrophosphate/doxycycline-treated 3D7 parasites. (B, C) Growth of asynchronous ∆PBGD (B) and ∆CPO (C) 3D7 parasites in the presence or absence of 200 µM ALA, with 2-min light exposures on an overhead projector on days 0–2. WT growth was fit to an exponential equation. (D) Bright field and fluorescence images of live 3D7 parasites expressing ALAD-GFP from a plasmid before or after 2-week treatment with IPP and doxycycline. (E) Growth of asynchronous IPP/doxycycline-treated parasites in the presence or absence of 200 µM ALA and 50 µM SA, with 2-min light exposures on an overhead projector on days 0–2.
Figure 2—figure supplement 1
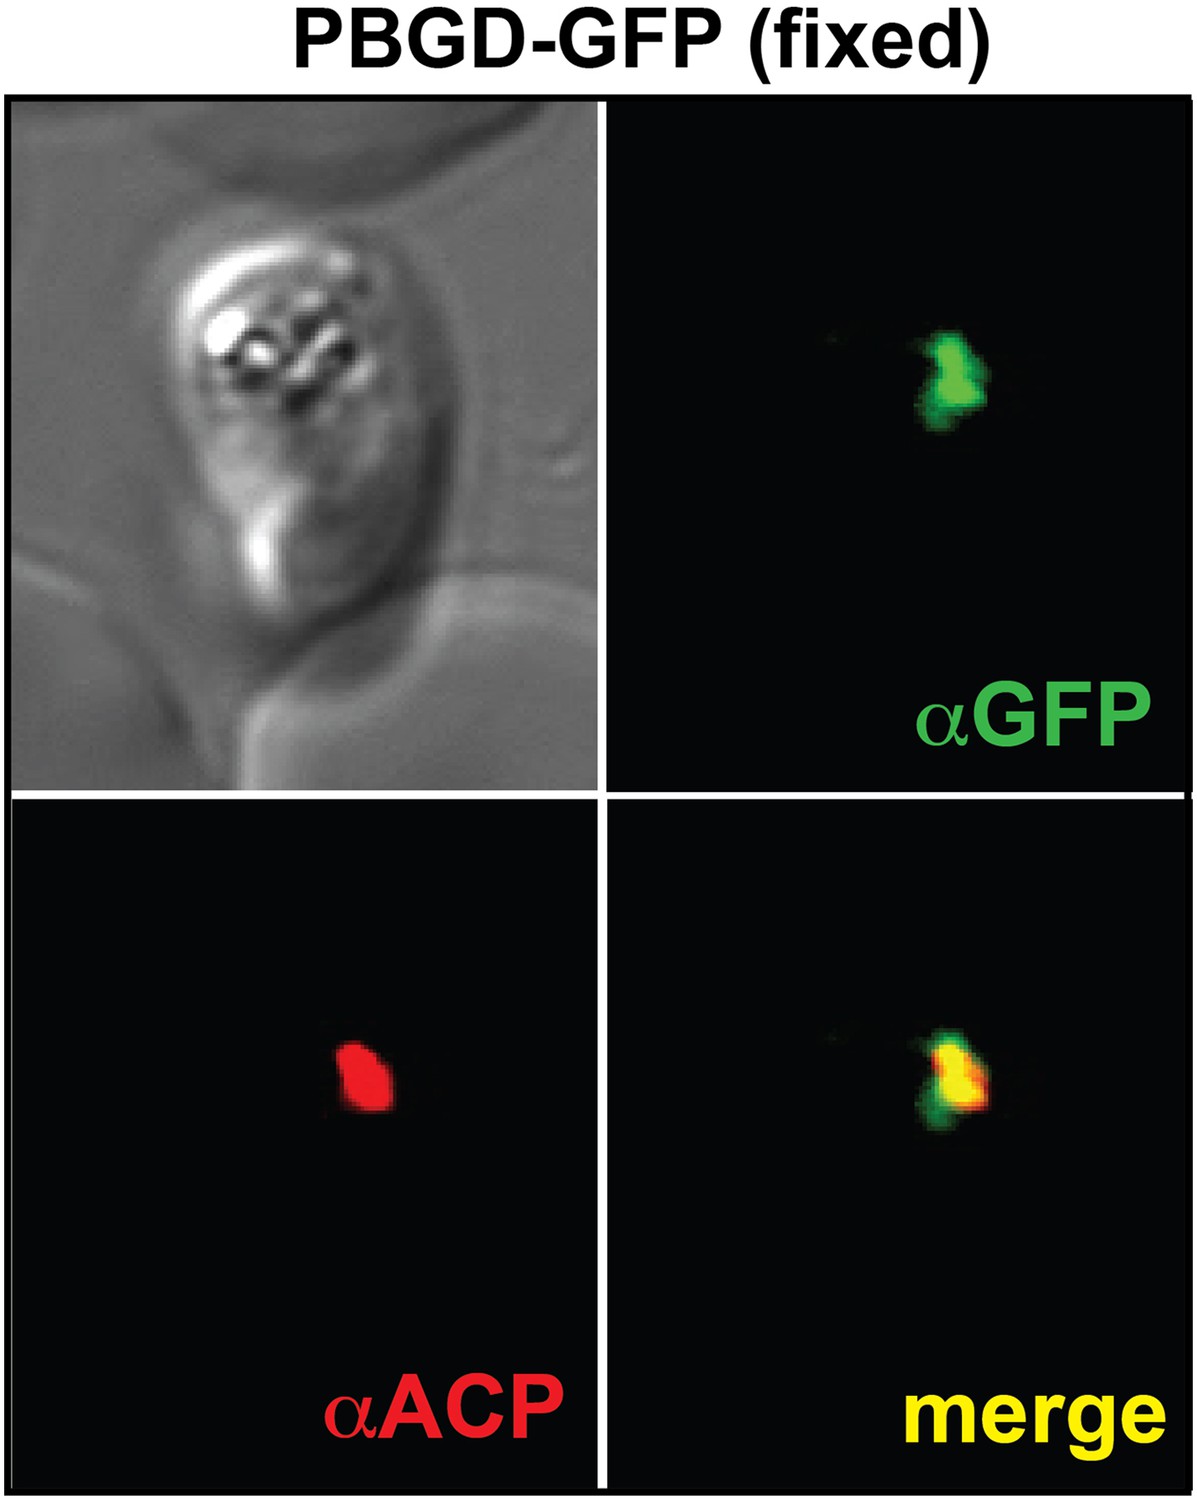
Immunofluorescence microscopy (IFM) images of fixed 3D7 parasites expressing full-length PBGD tagged at its endogenous locus with C-terminal GFP confirm targeting of the native protein to the parasite apicoplast.
Parasites were stained with αGFP and αACP (ACP, apicoplast marker).
Figure 2—figure supplement 2
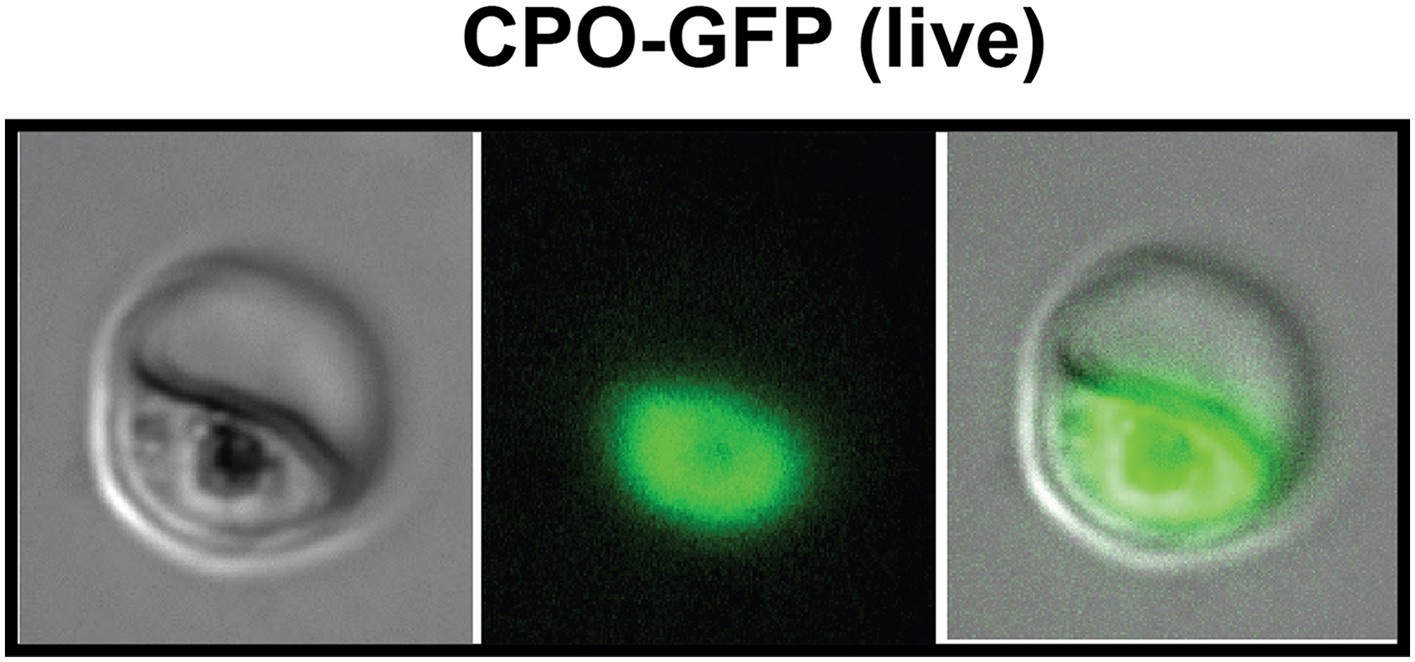
Fluorescence microscopy images of live 3D7 parasites episomally expressing full-length CPO with a C-terminal GFP tag confirm protein localization to the parasite cytoplasm.
https://doi.org/10.7554/eLife.09143.014
Figure 2—figure supplement 3
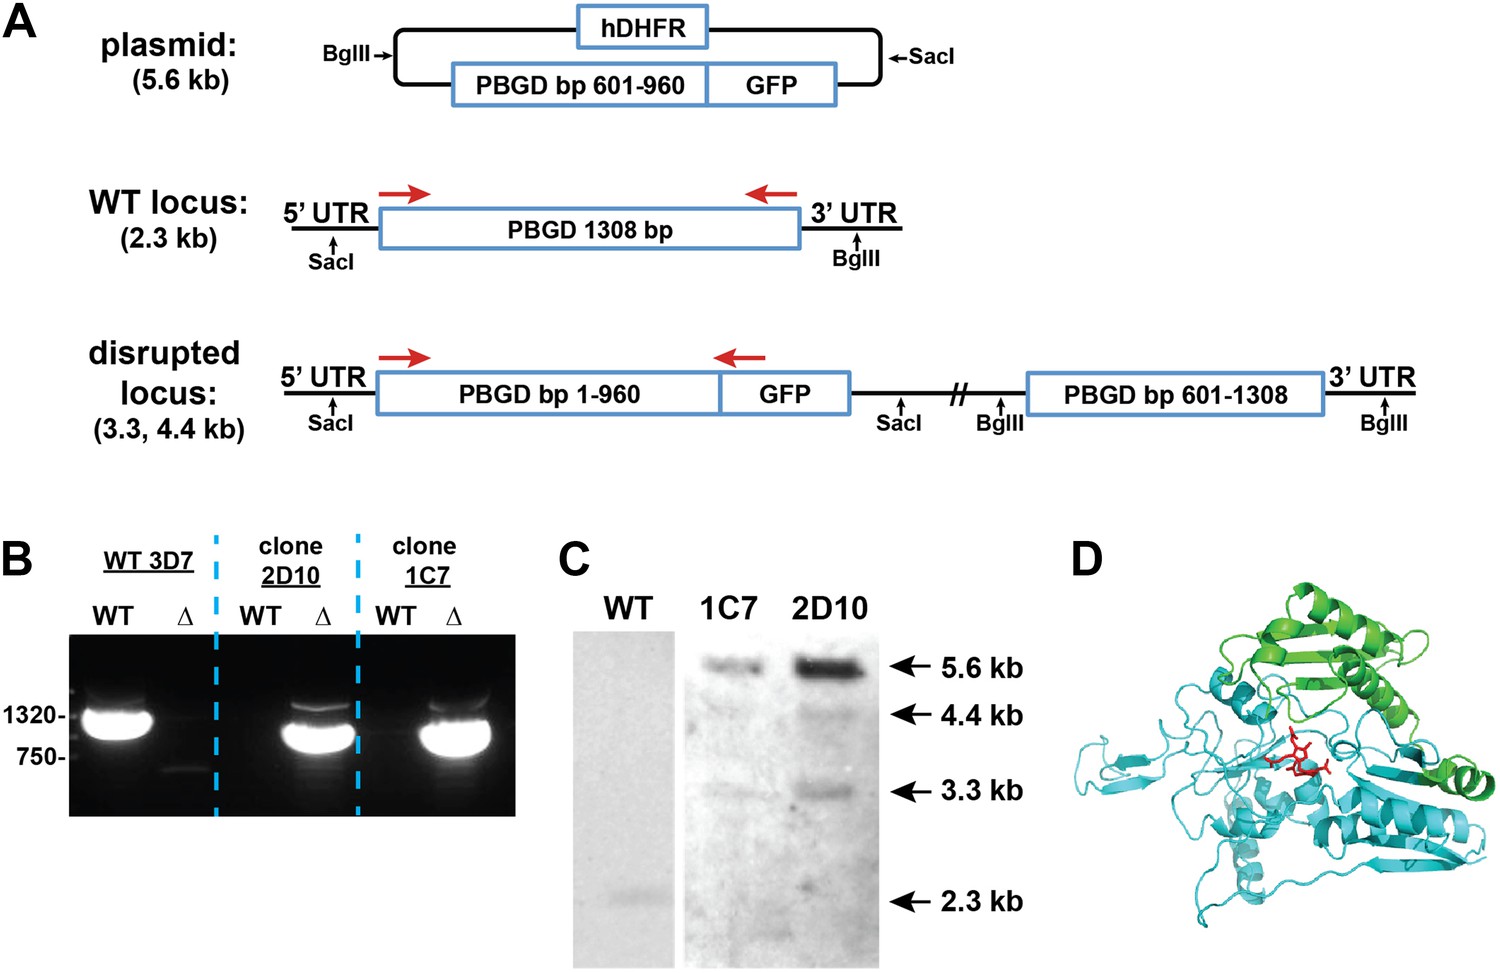
Disruption of the P. falciparum PBGD gene (PF3D7_1209600) by single-crossover homologous recombination.
(A) Schematic depiction of the PBGD gene locus before and after incorporation of the donor plasmid via single-crossover recombination. Red arrows indicate the primers used to selectively polymerase chain reaction (PCR) amplify either the intact WT or disrupted ∆PBGD locus. SacI and BglII were used to digest the donor plasmid and genomic DNA (gDNA) of WT and ∆PBGD parasites to give the expected fragment sizes indicated in parentheses for hybridization to a PBGD bp 601–960 oligonucleotide probe. (B) PCR analysis of gDNA from WT and ∆PBGD clones using the primers indicated in (A) to selectively amplify the 1.3 kb WT gene or the 960 bp truncated gene. (C) Southern blot analysis of gDNA from 3D7 WT and ∆PBGD clonal parasites after digestion with SacI and BglII, hybridization with a PBGD bp 601–960 oligonucleotide probe, and detection using the Amersham AlkPhos Labeling and CDP-Star chemiluminescent reagents. (D) Homology model of P. falciparum PBGD (human PBGD template structure 3EQ1) to indicate the portion of the protein retained (cyan) or lost (green) by single-crossover truncation. The deleted sequence comprises half of the active site binding pocket, identified by the dipyrromethane cofactor shown in red.
Figure 2—figure supplement 4
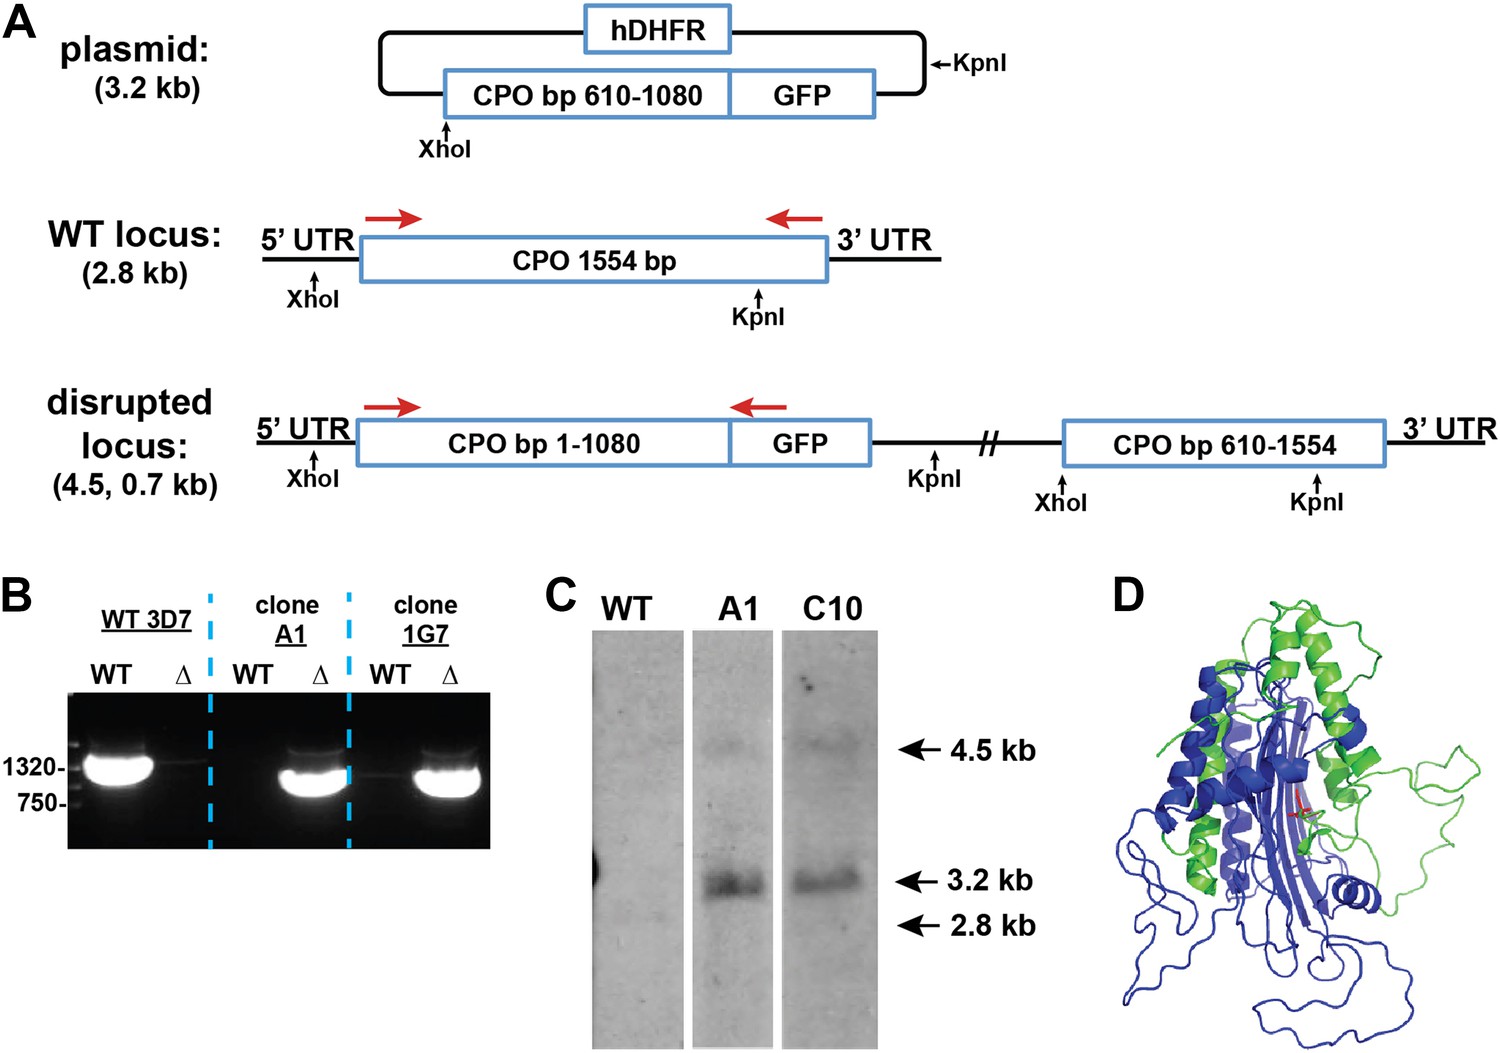
Disruption of the P. falciparum CPO gene (PF3D7_1142400) by single-crossover homologous recombination.
(A) Schematic depiction of the CPO gene locus before and after incorporation of the donor plasmid via single-crossover recombination. Red arrows indicate the primers used to selectively PCR-amplify either the intact WT or disrupted ∆CPO locus. XhoI and KpnI were used to digest the donor plasmid and gDNA of WT and ∆CPO parasites to give the expected fragment sizes indicated in parentheses for hybridization to a CPO bp 610–1080 oligonucleotide probe. (B) PCR analysis of gDNA from WT and ∆CPO clones using the primers indicated in (A) to selectively amplify the 1.6 kb WT gene or the 1.1 kb truncated gene. (C) Southern blot analysis of gDNA from 3D7 WT and ∆CPO clonal parasites after digestion with XhoI and KpnI, hybridization with a CPO bp 610–1080 oligonucleotide probe, and detection using the Amersham AlkPhos Labeling and CDP-Star chemiluminescent reagents. (D) Homology model of P. falciparum CPO (human CPO template structure 2AEX) to indicate the portion of the protein retained (blue) or lost (green) by single-crossover truncation. The deleted sequence comprises half of the active site binding pocket, identified by the citrate molecule shown in red.
Figure 2—figure supplement 5
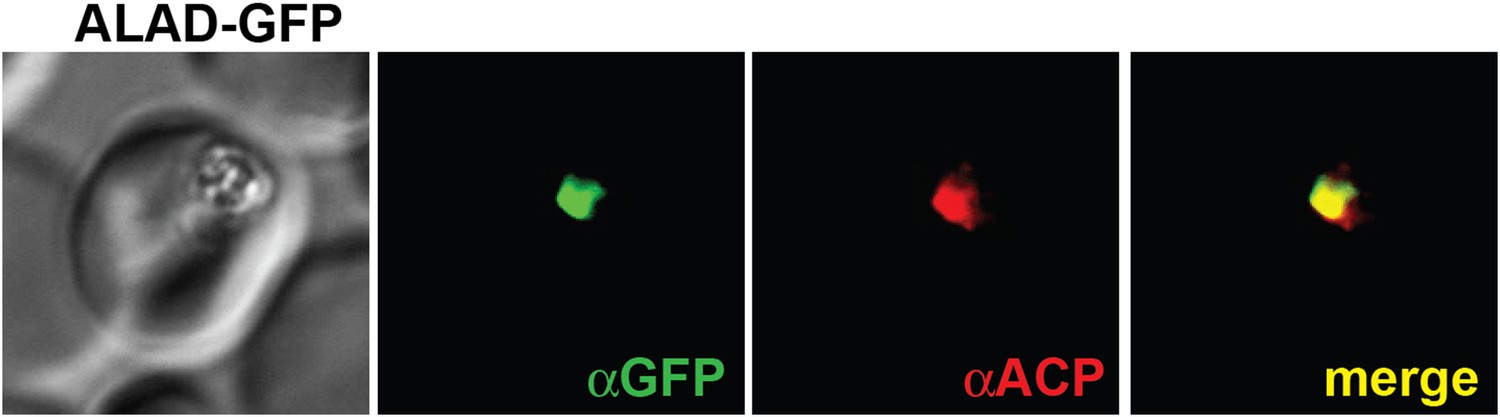
IFM images of fixed 3D7 parasites expressing full-length ALAD tagged at its endogenous locus with C-terminal GFP confirm targeting to the parasite apicoplast.
Parasites were stained with αGFP and αACP (ACP, apicoplast marker).
Figure 2—figure supplement 6
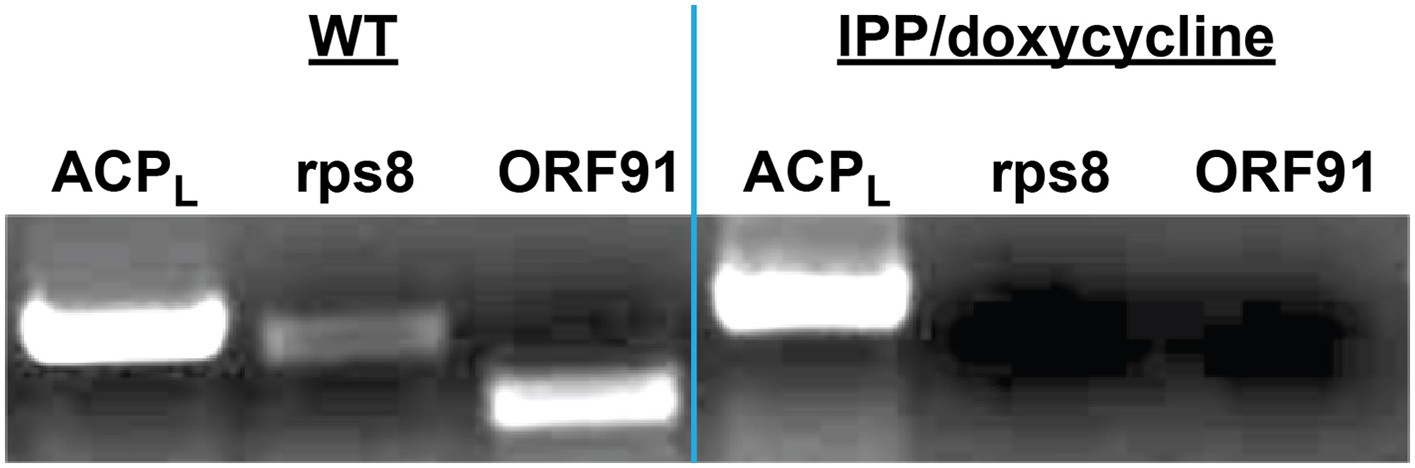
PCR analysis of genomic DNA from untreated WT parasites or parasites cultures ≥7 days in 1 µM doxycycline and 200 µM IPP.
ACPL refers to the 385 bp leader sequence (with introns) of the nuclear-encoded ACP. Rps8 (387 bp) and ORF91 (276) are two genes encoded by the Plasmodium apicoplast genome.
Figure 2—figure supplement 7
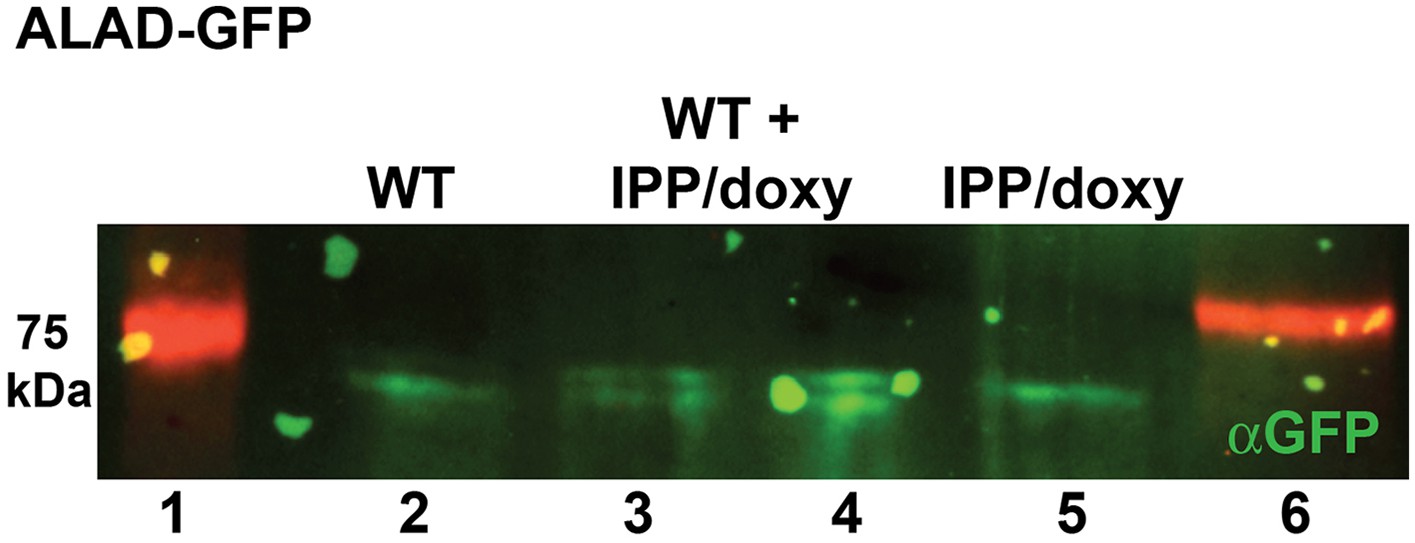
Western blot analysis of parasites episomally expressing ALAD-GFP and cultured 7 days in IPP and doxycycline.
Blots confirm disrupted proteolytic processing of the ALAD leader sequence that results in retarded migration by SDS-PAGE relative to parasites cultured in normal conditions. Extracts from WT and IPP/doxycycline parasites were loaded separately in lanes 2 and 5, respectively, and were loaded together in lanes 3 and 4.
Figure 3 with 1 supplement

Erythrocytes have latent porphyrin biosynthesis activity that requires exogenous ALA and parasite permeability mechanisms to enable ALA uptake.
(A) LC-MS/MS detection of 13C-labelled PPIX and CPP in erythrocyte lysate supernatants incubated with 200 µM 5-[13C4]-ALA without or with 50 µM SA. Erythrocytes were lysed in 0.04% saponin, centrifuged at 25,000×g for 60 min, and 0.2 µM syringe filtered prior to ALA addition. (B) Bright field and fluorescence (Zeiss filter set 43 HE) images of uninfected erythrocytes incubated in 500 µM ALA before or after electroporation. (C) Bright-field and fluorescence images of parasites cultured in 500 µM ALA with normal (+TMP) or blocked (−TMP) establishment of parasite permeability pathways in the erythrocyte membrane. Infected erythrocyte permeability was modulated using a 3D7 parasite line expressing HSP101 tagged at its endogenous locus with a TMP-dependent destabilization domain (Beck et al., 2014). TMP was maintained or washed out from synchronous schizont-stage parasites, which were allowed to rupture and invade new erythrocytes. 500 µM ALA was added to both cultures after invasion, and parasites were imaged 8 hr later.
Figure 3—figure supplement 1
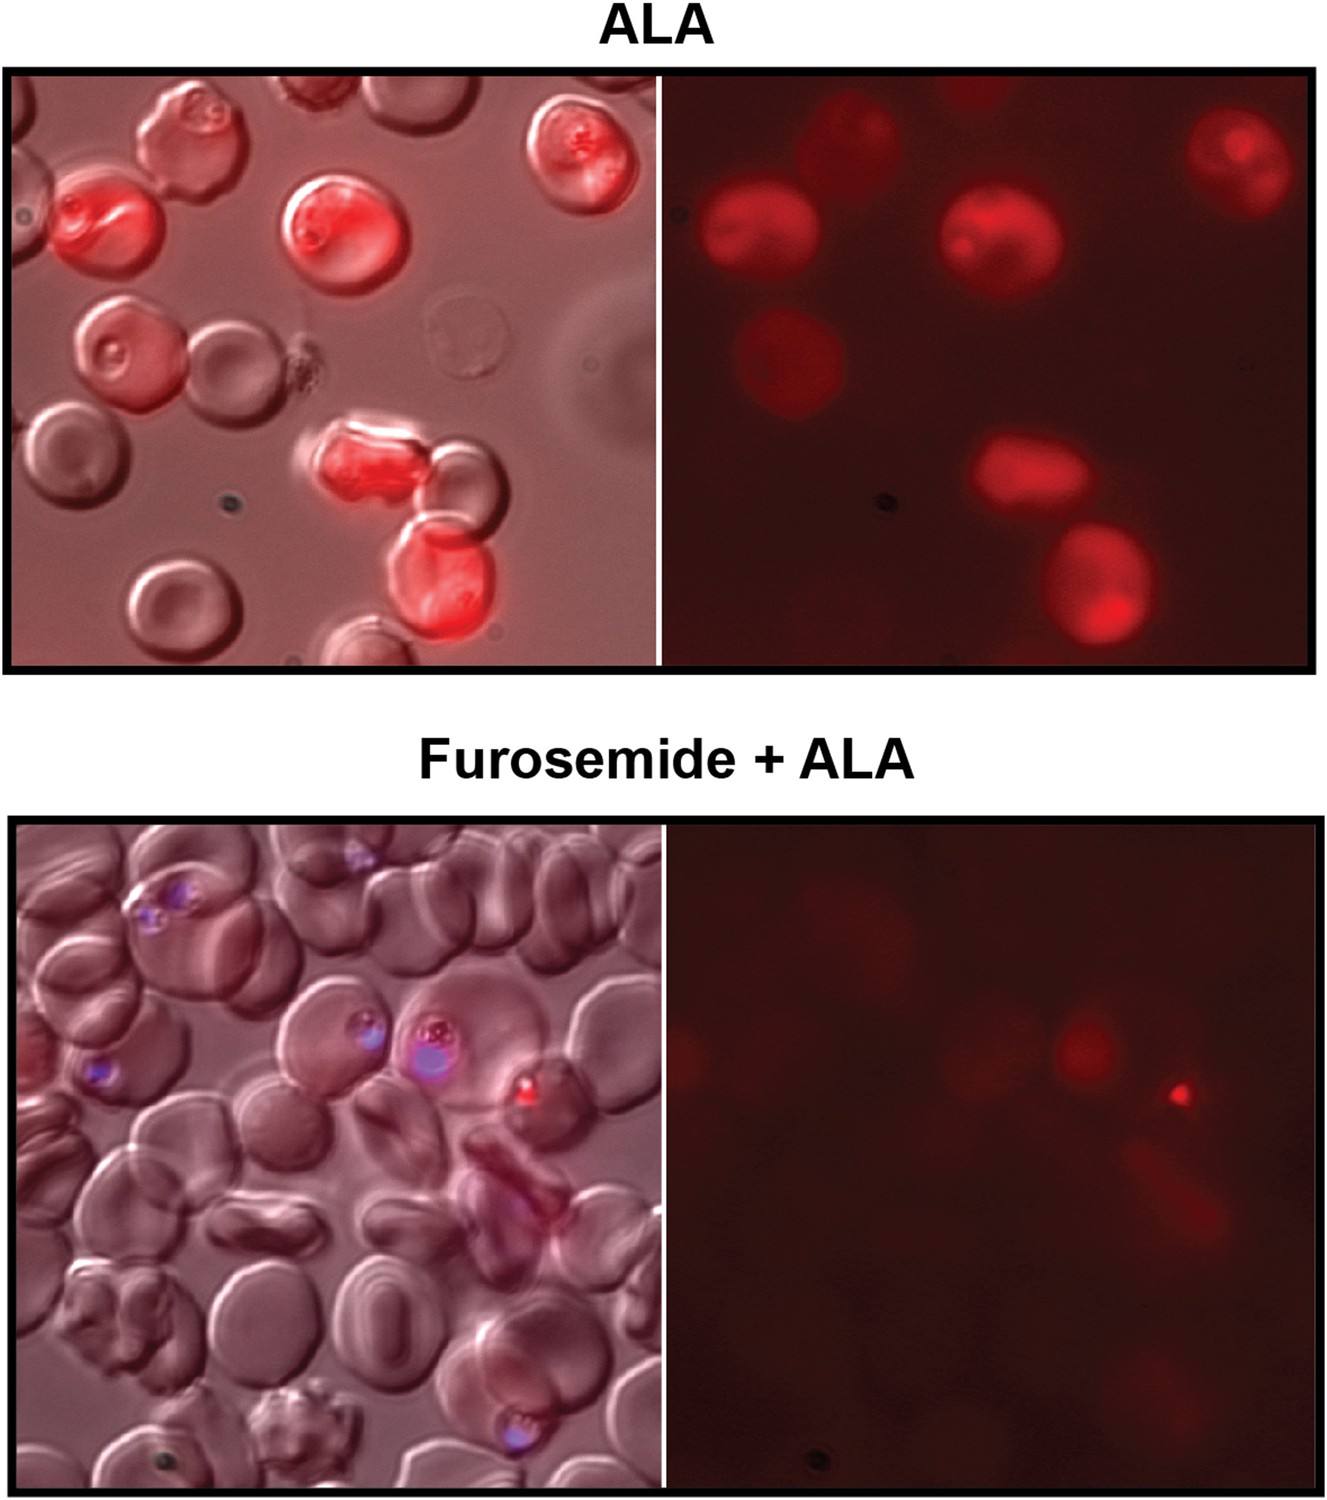
Furosemide blocks ALA uptake and PPIX biosynthesis in parasite-infected erythrocytes.
Asynchronous wild-type 3D7 parasites were incubated in the absence or presence of 100 µM furosemide for 1 hr to block nutrient acquisition pathways, followed by addition of 500 µM ALA and further incubation for 8 hr. Parasites were then imaged by live microscopy on the bright field or red fluorescence (Zeiss filter set 43 HE) channels. In lower panel, parasite nuclei (blue) were visualized with Hoechst DNA stain.
Figure 4 with 1 supplement
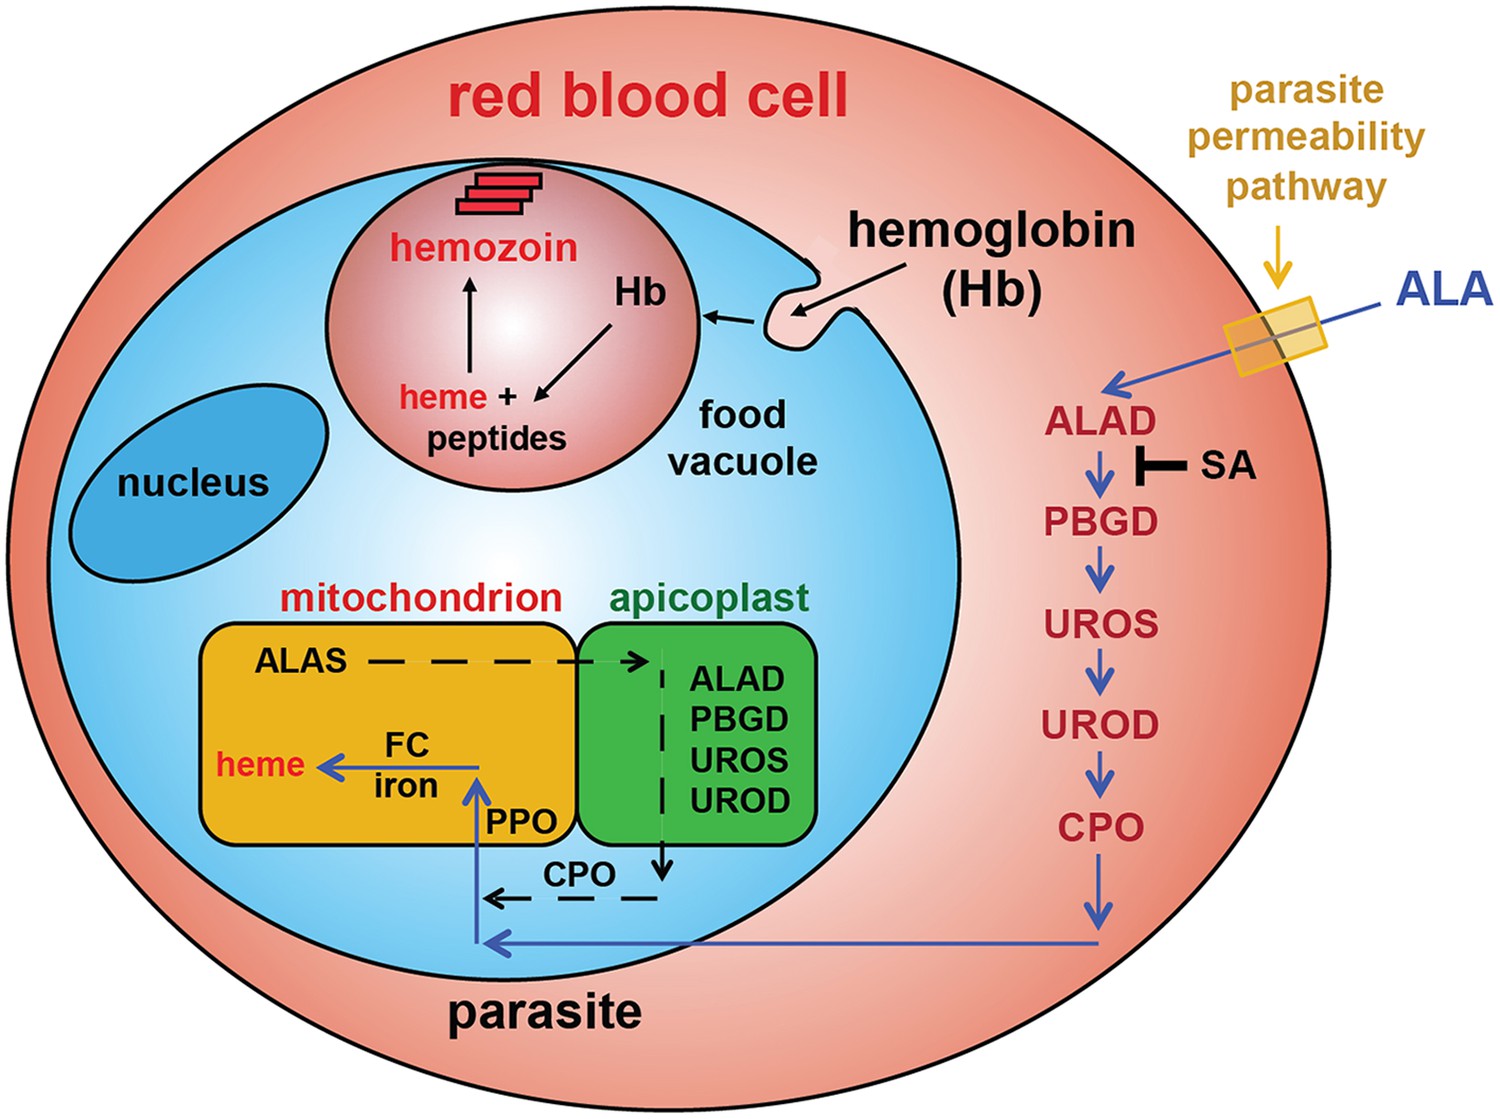
Schematic depiction of ALA-uptake and porphyrin biosynthesis pathways in Plasmodium-infected erythrocytes.
For simplicity, all membranes are depicted as single. Porphyrins synthesized in the infected erythrocyte cytoplasm from exogenous ALA may be transported across the parasite membrane via unspecified mechanisms or may be taken up via hemoglobin import mechanisms. SA inhibits ALAD and blocks porphyrin synthesis from ALA.
Figure 4—figure supplement 1
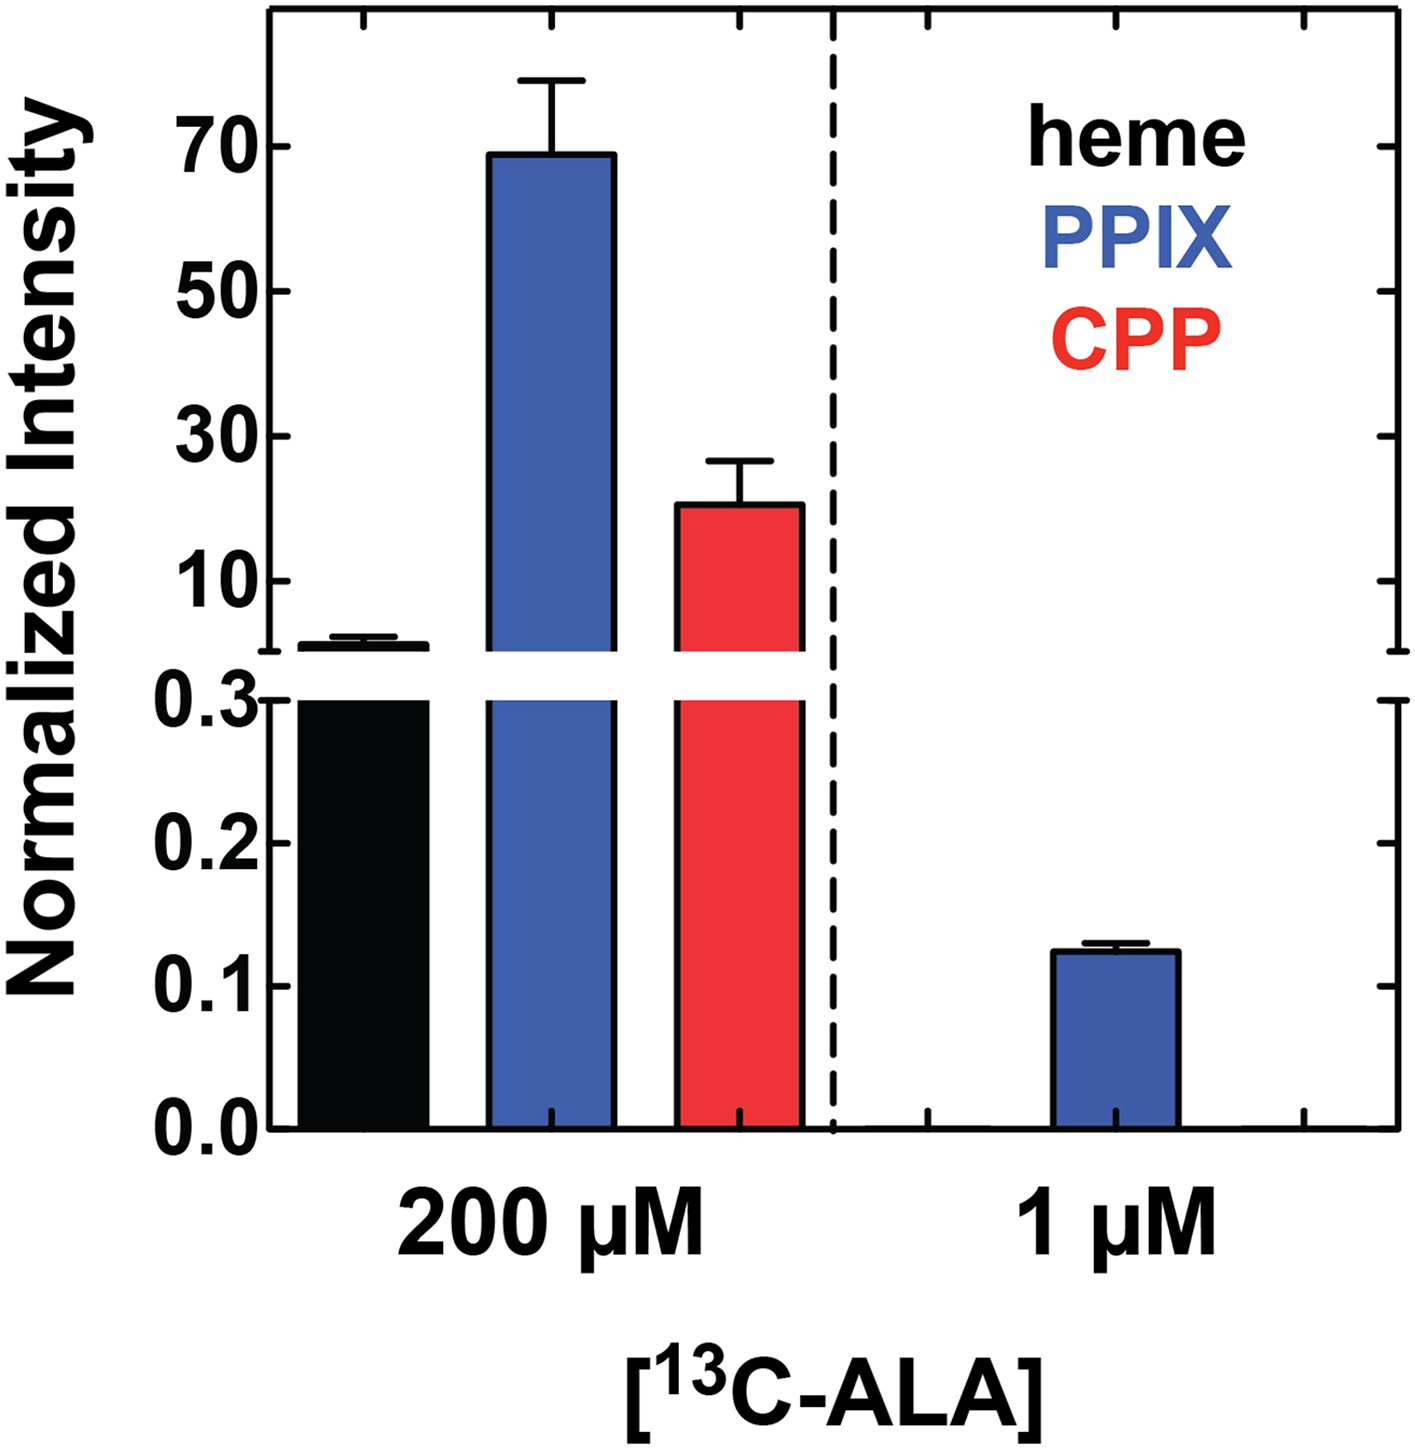
Growth of parasites in 1 µM 5-[13C4]-ALA results in detectable biosynthesis of 13C-labeled PPIX.
Parasites were grown overnight in 1 µM 5-[13C4]-ALA, permeabilized with saponin, extracted in DMSO, and analyzed by LC-MS/MS for 13C-labeled heme, PPIX, and CPP. Integrated peak areas measured for each analyze were normalized to that measured for the deuteroporphyrin internal standard added to each sample.
Figure 5
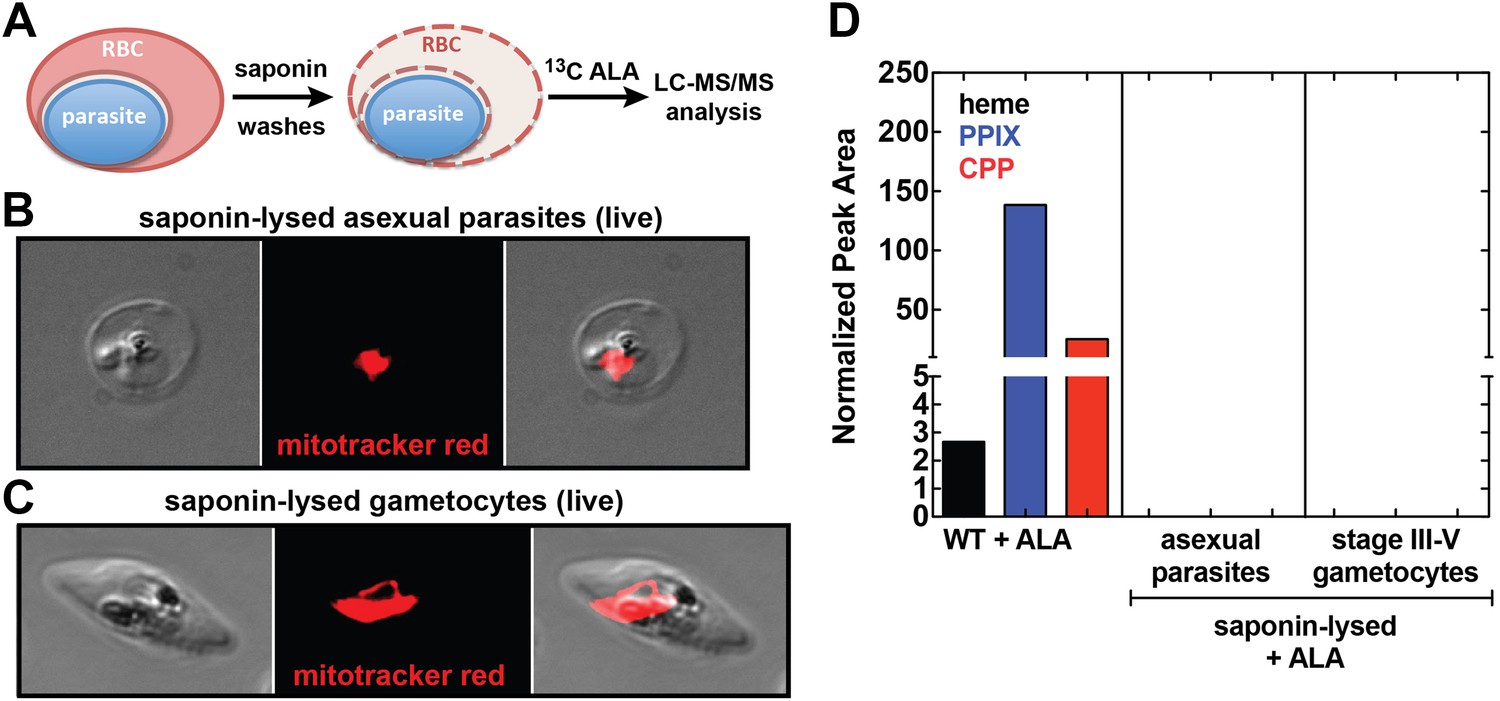
Analysis of heme biosynthesis activity in parasite-infected erythrocytes after saponin permeabilization and culture in 13C-labelled ALA.
(A) Parasite-infected erythrocytes were permeabilized in 0.02% saponin, washed to remove the erythrocyte cytoplasm, and placed back into culture medium containing 200 µM 5-[13C4]-ALA for 12 hr prior to DMSO extraction and analysis by LC-MS/MS. Bright field and fluorescence image of live (B) asexual trophozoite and (C) stage IV sexual gametocyte treated with 0.02% saponin and stained with 20 nM MitoTracker Red. (D) LC-MS/MS quantification of 13C-labelled heme, PPIX, and CPP in DMSO extracts of intact WT 3D7 asexual parasites, saponin-released asexual parasites, and saponin-released gametocytes cultured overnight in 200 µM 5-[13C4]-ALA.
Figure 6 with 1 supplement

Analysis of heme biosynthetic flux within the apicoplast of live parasites using the cobA biosensor.
(A) Fluorescence excitation (black) and emission (red) spectra of clarified lysates from Escherichia coli bacteria expressing the cobA gene from Propionibacterium freudenreichii (shermanii), showing the expected peaks for conversion of uroporphyrinogen III to sirohydrochlorin and trimethylpyrrocorphin. (B) Fluorescence microscopy images of live bacteria expressing the cobA gene, acquired on the bright field and red (Zeiss filter set 43 HE) channels. (C) Immunofluorescence (IFM) images of fixed 3D7 parasites episomally expressing an ACPleader-cobA-GFP fusion confirm targeting to the parasite apicoplast. Parasites were stained with αGFP and αACP (acyl carrier protein [ACP], apicoplast marker). The αACP antibody recognizes an epitope that is different from the ACP leader sequence. (D) Fluorescence microscopy images of live asexual parasites episomally expressing ACPleader-cobA-GFP without or with 500 µM exogenous ALA. (E) Fluorescence microscopy images of live stage III–IV sexual gametocytes episomally expressing ACPleader-cobA-GFP without or with 500 µM exogenous ALA. Fluorescence images in (D) and (E) were acquired on the GFP (Zeiss filter set 38) and red (Zeiss filter set 43 HE) channels.
Figure 6—figure supplement 1
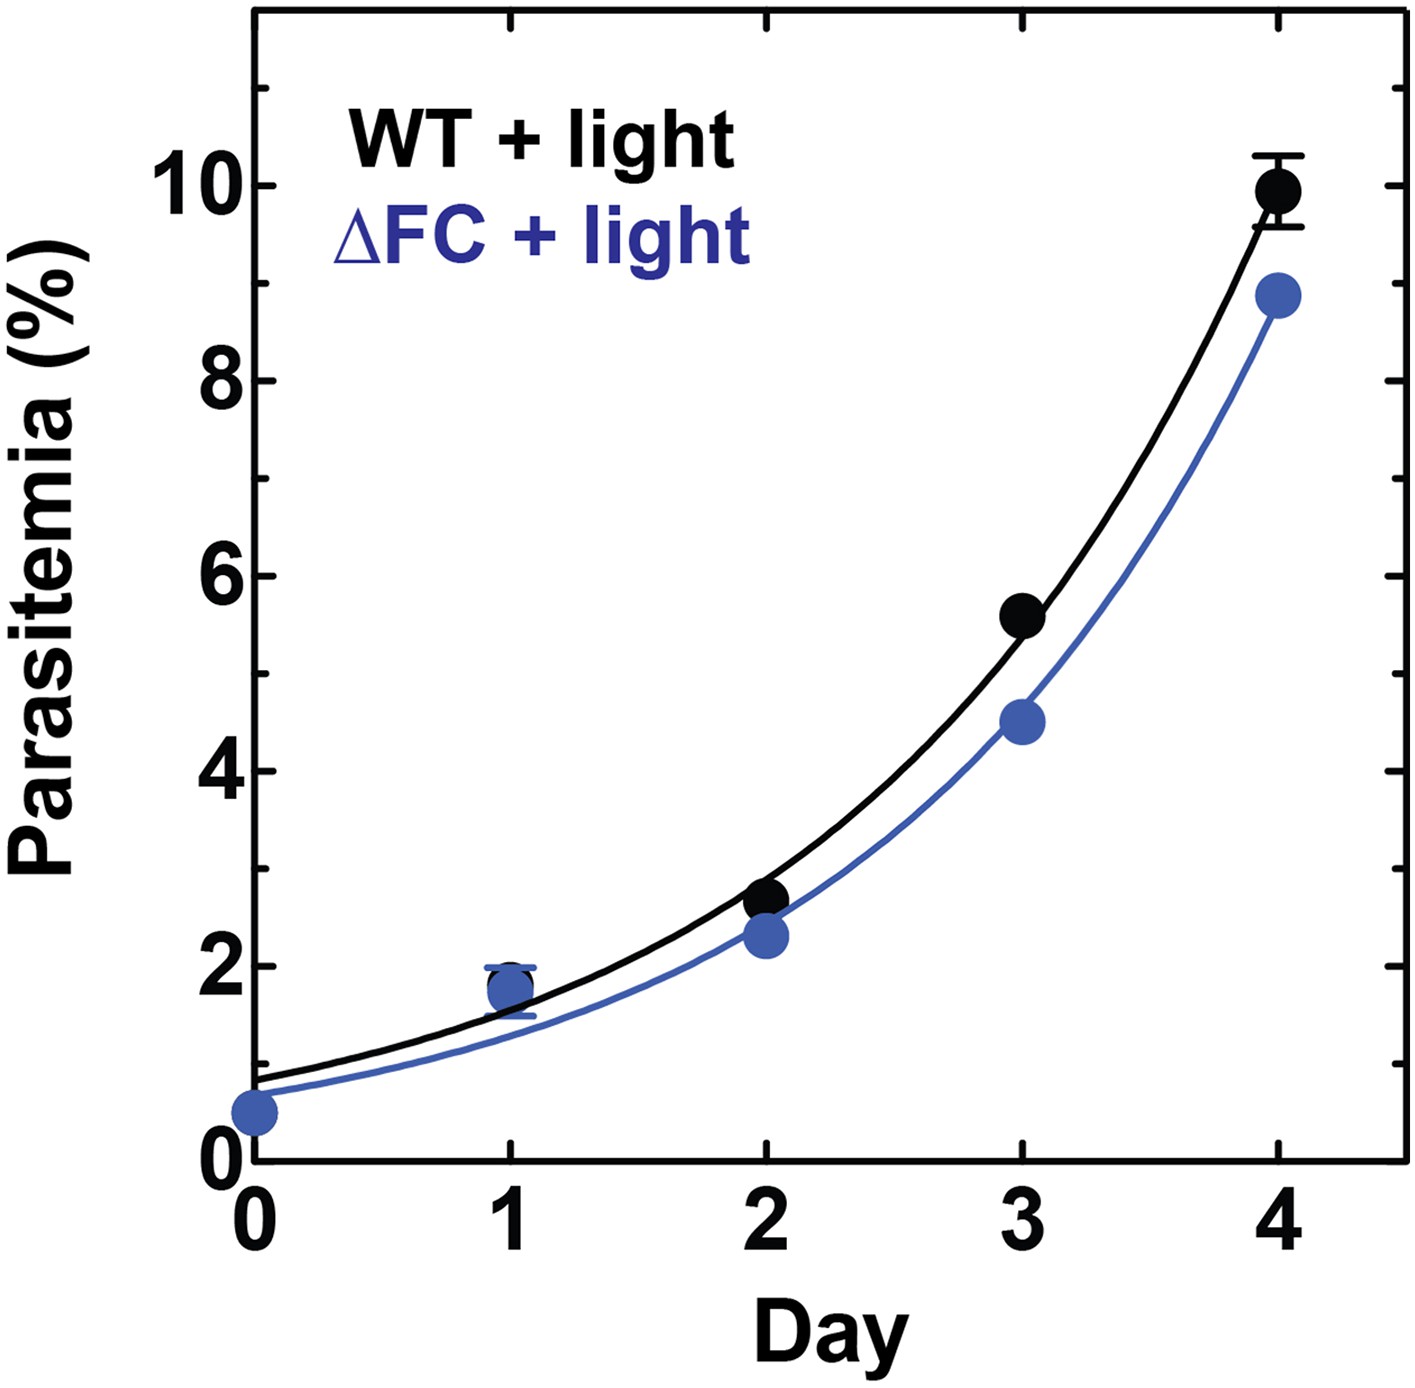
Disruption of the Plasmodium FC gene in ∆FC parasites does not photosensitize parasites.
WT or ∆FC D10 parasites were cultured under normal growth conditions (without exogenous ALA) with 2-min light exposures on an overhead projector light box on days 0–2. Culture parasitemia as a function of time was fit to an exponential growth model. Both WT and ∆FC parasites had parasitemia doubling times of 1.1 days under these conditions.
Figure 7 with 6 supplements
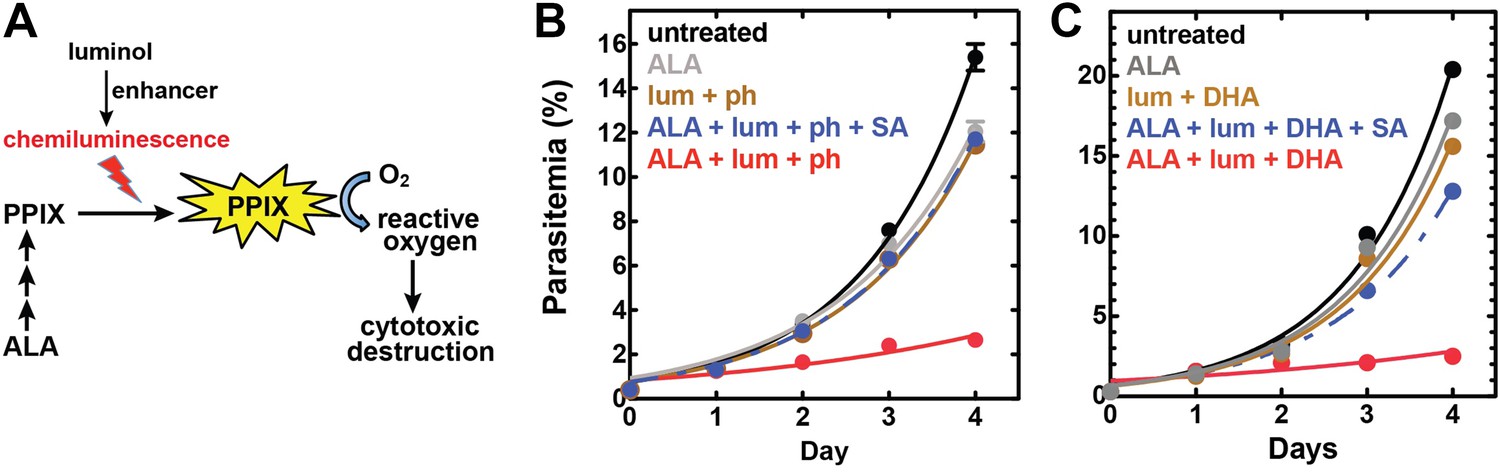
Targeting blood-stage Plasmodium parasites by chemiluminescence-based photodynamic therapy (CL-PDT).
(A) Schematic depiction of a CL-PDT mechanism for targeting blood-stage malaria. (B) Effect of 100 µM ALA, 750 µM luminol (lum), 50 µM 4-iodophenol (ph), 50 µM SA and their combination (all 0.25% DMSO) on the growth of asynchronous 3D7 parasites. (C) Effect of 100 µM ALA, 750 µM luminol, 0.5 nM dihydroartemisinin (DHA), 50 µM SA and their combination (all 0.25% DMSO) on the growth of asynchronous 3D7 parasites. Parasite media was changed twice daily, and parasitemia increases were fit to an exponential growth equation.
Figure 7—figure supplement 1
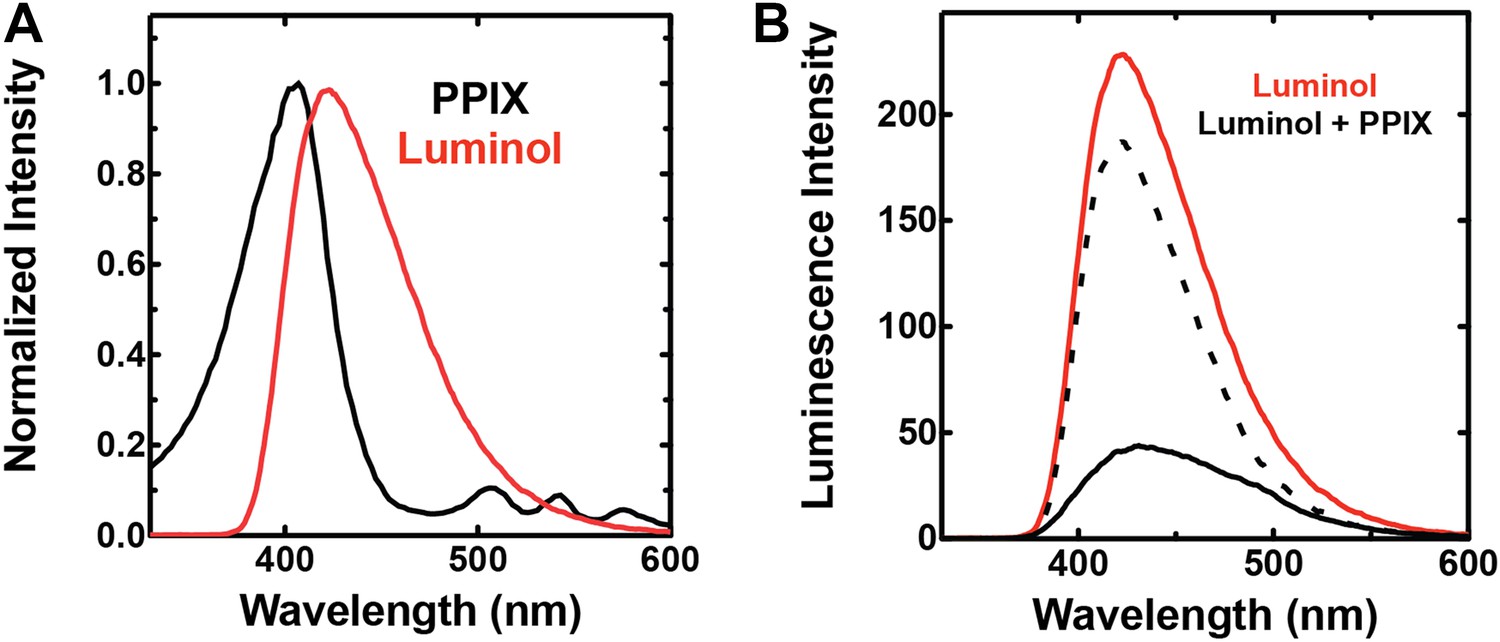
Spectral compatibility of luminol and PPIX.
(A) Overlay of normalized absorbance spectrum of PPIX (black) and chemiluminescence spectrum of luminol (red). (B) Chemiluminescence of luminol (solid red) is attenuated in the presence of PPIX (solid black), giving rise to a difference spectrum (dashed black) that is similar to the absorbance spectrum of PPIX in the spectral region that overlaps luminol chemiluminescence. Solutions contained 25 mM luminol in 100 mM NaOH (aq), 0.5% (wt/vol) ammonium persulfate, and/or 70 µM PPIX.
Figure 7—figure supplement 2
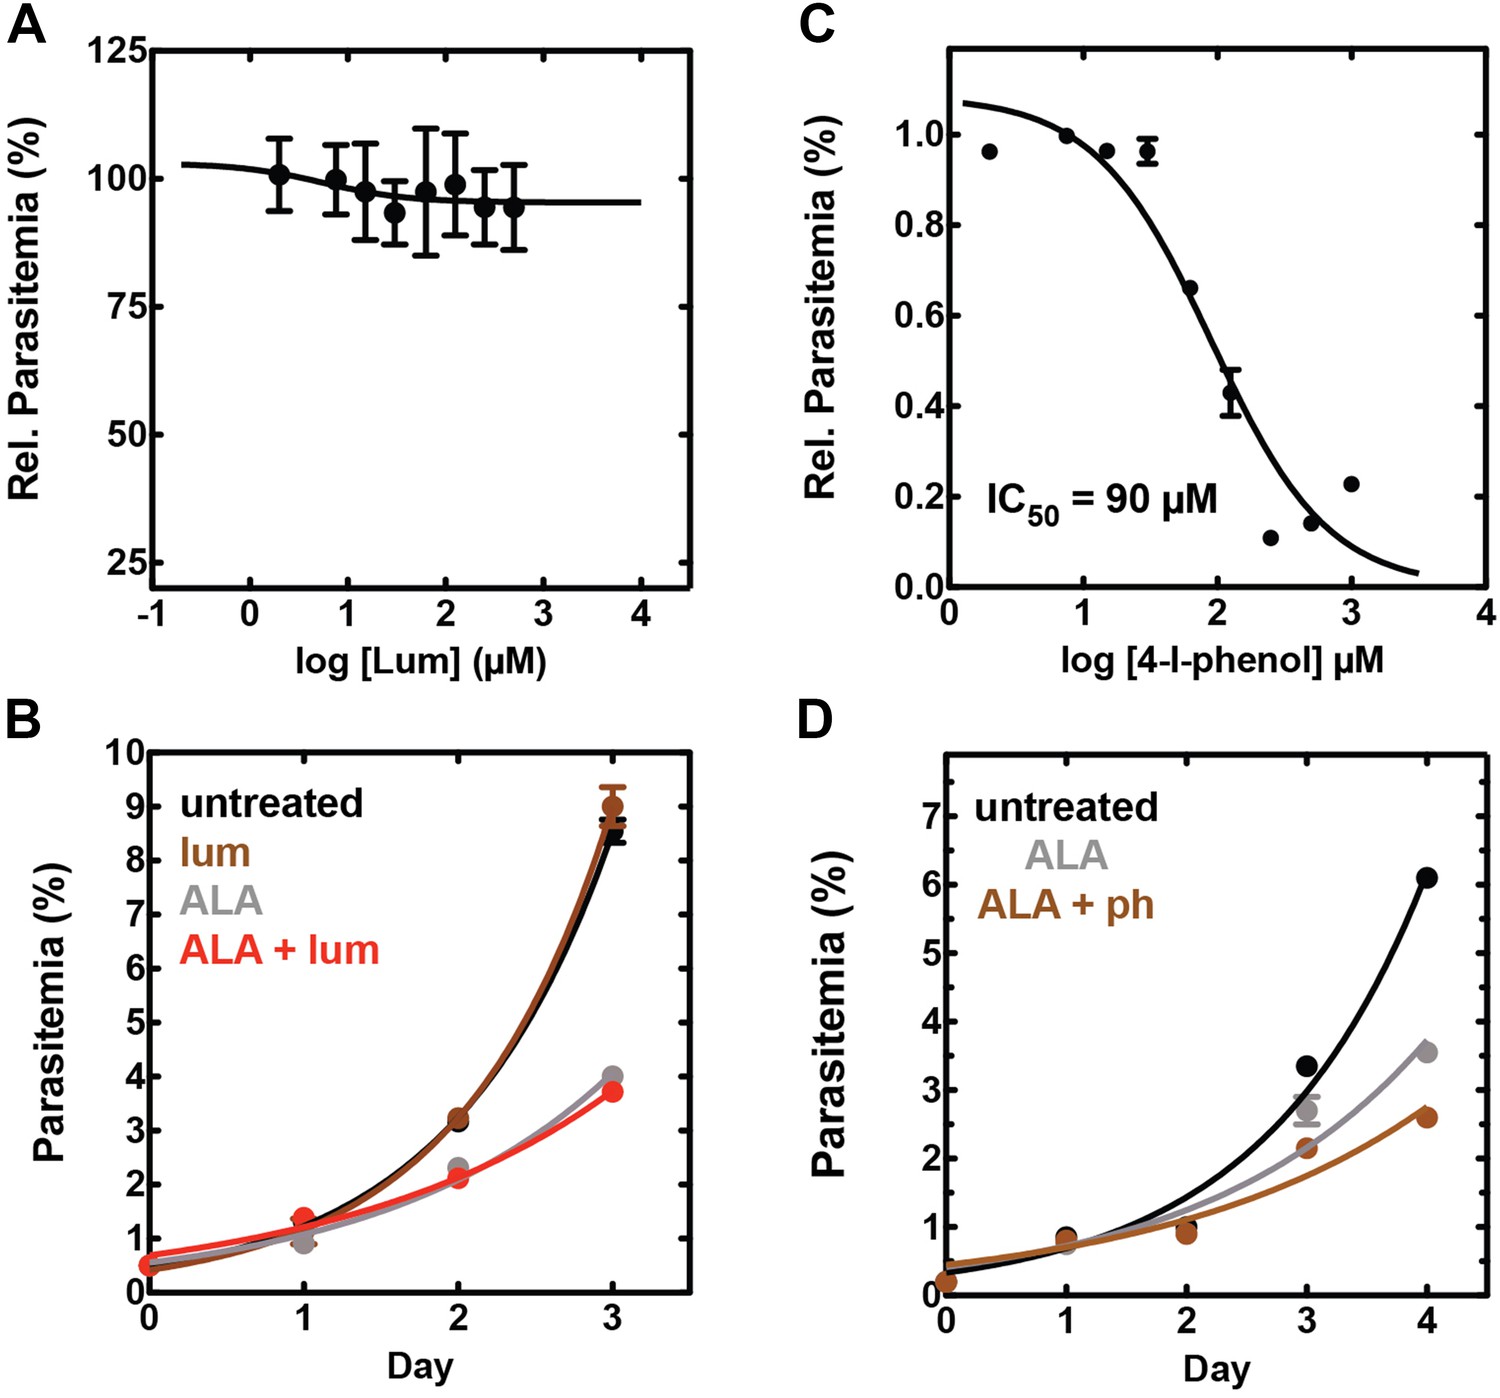
Effect of combinatorial ALA, luminol, and 4-iodophenol treatment on parasite growth.
(A) Luminol concentrations as high as 750 µM (in 0.2% DMSO) have no effect on 3D7 parasite growth over 48 hr. (B) Effect of 750 µM luminol, 100 µM ALA, and their combination (all in 0.2% DMSO) on the growth of asynchronous 3D7 parasites. (C) Concentration dependence of growth inhibition of 3D7 parasites by 4-iodophenol (in 0.2% DMSO) over 48 hr. (D) Effect of 100 µM ALA, 50 µM 4-iodophenol, and their combination (all in 0.2% DMSO) on the growth of asynchronous 3D7 parasites.
Figure 7—figure supplement 3
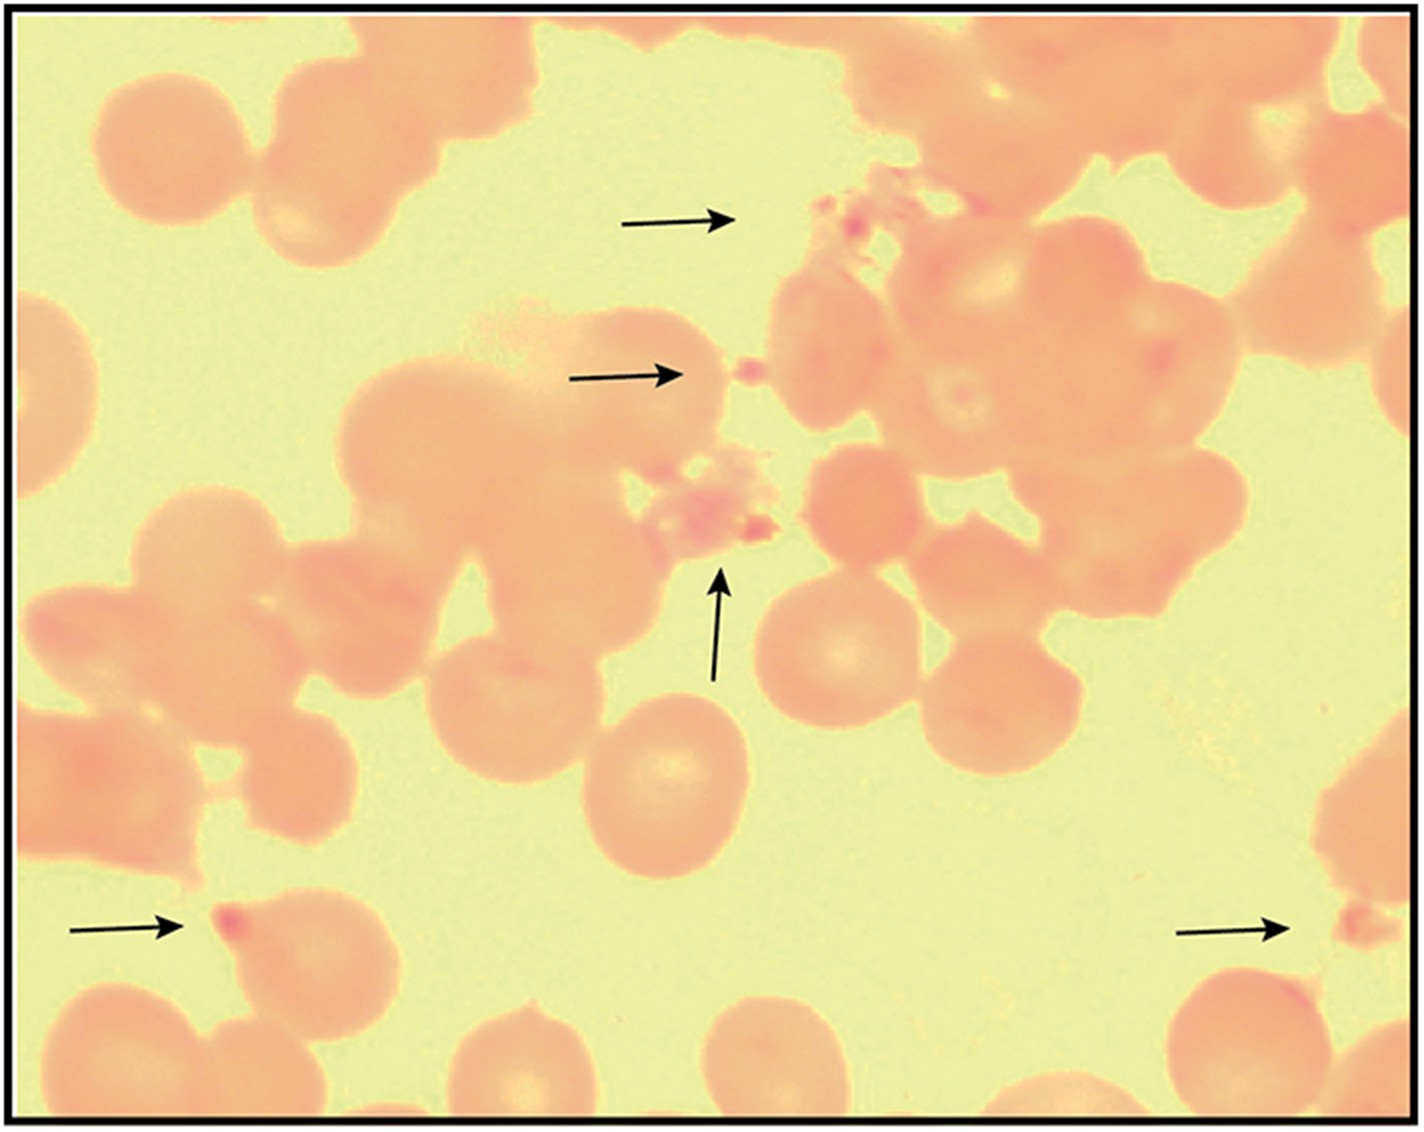
Giemsa-stained blood smear of 3D7 parasite culture after 3 days of treatment in 100 µM ALA, 750 µM luminol, and 50 µM 4-iodophenol.
Arrows point to dead parasite remnants.
Figure 7—figure supplement 4
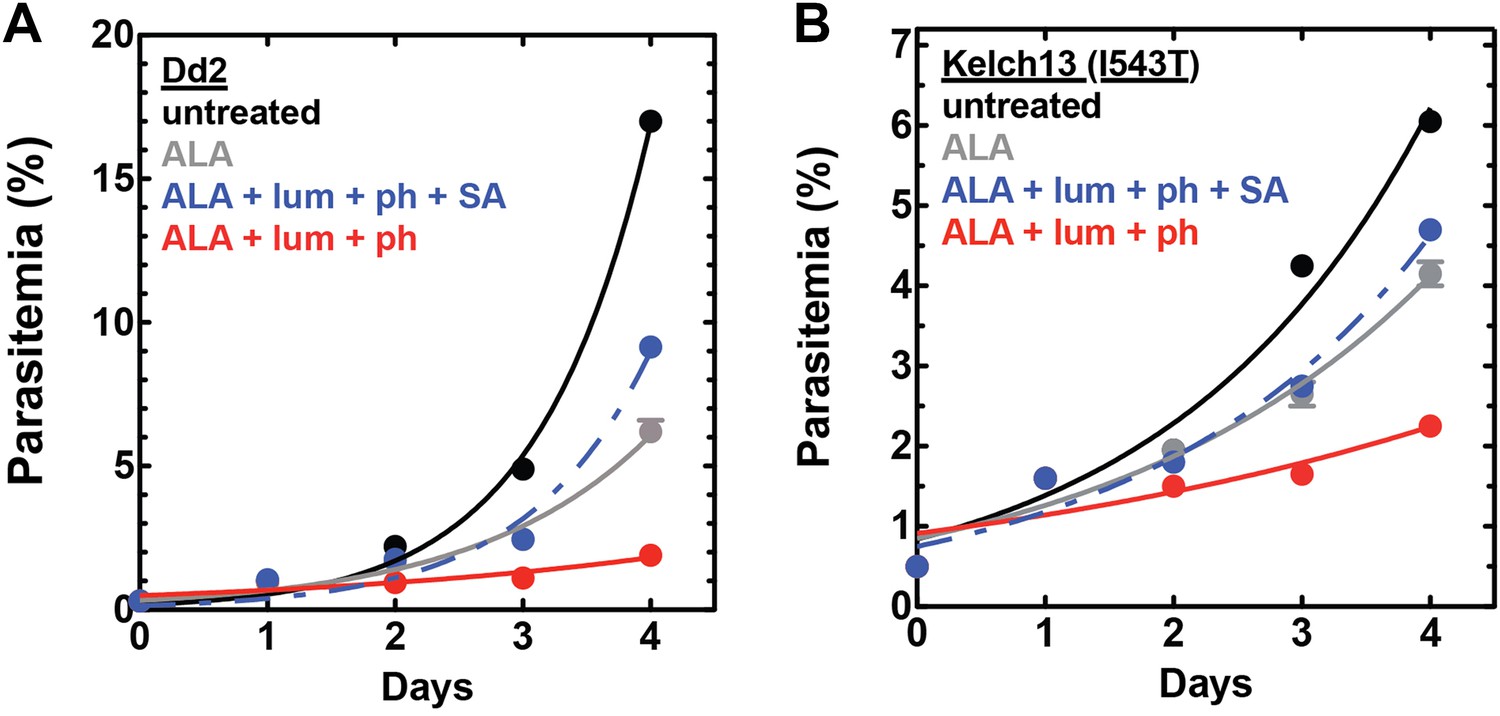
Efficacy of CL-PDT with drug-resistant parasites.
Effect of 100 µM ALA, 750 µM luminol, 50 µM 4-iodophenol, 50 µM SA (all 0.2% DMSO) and their combination on the growth of asynchronous (A) Dd2 parasites or (B) Kelch-13 I543T (MRA-1241) parasites.
Figure 7—figure supplement 5
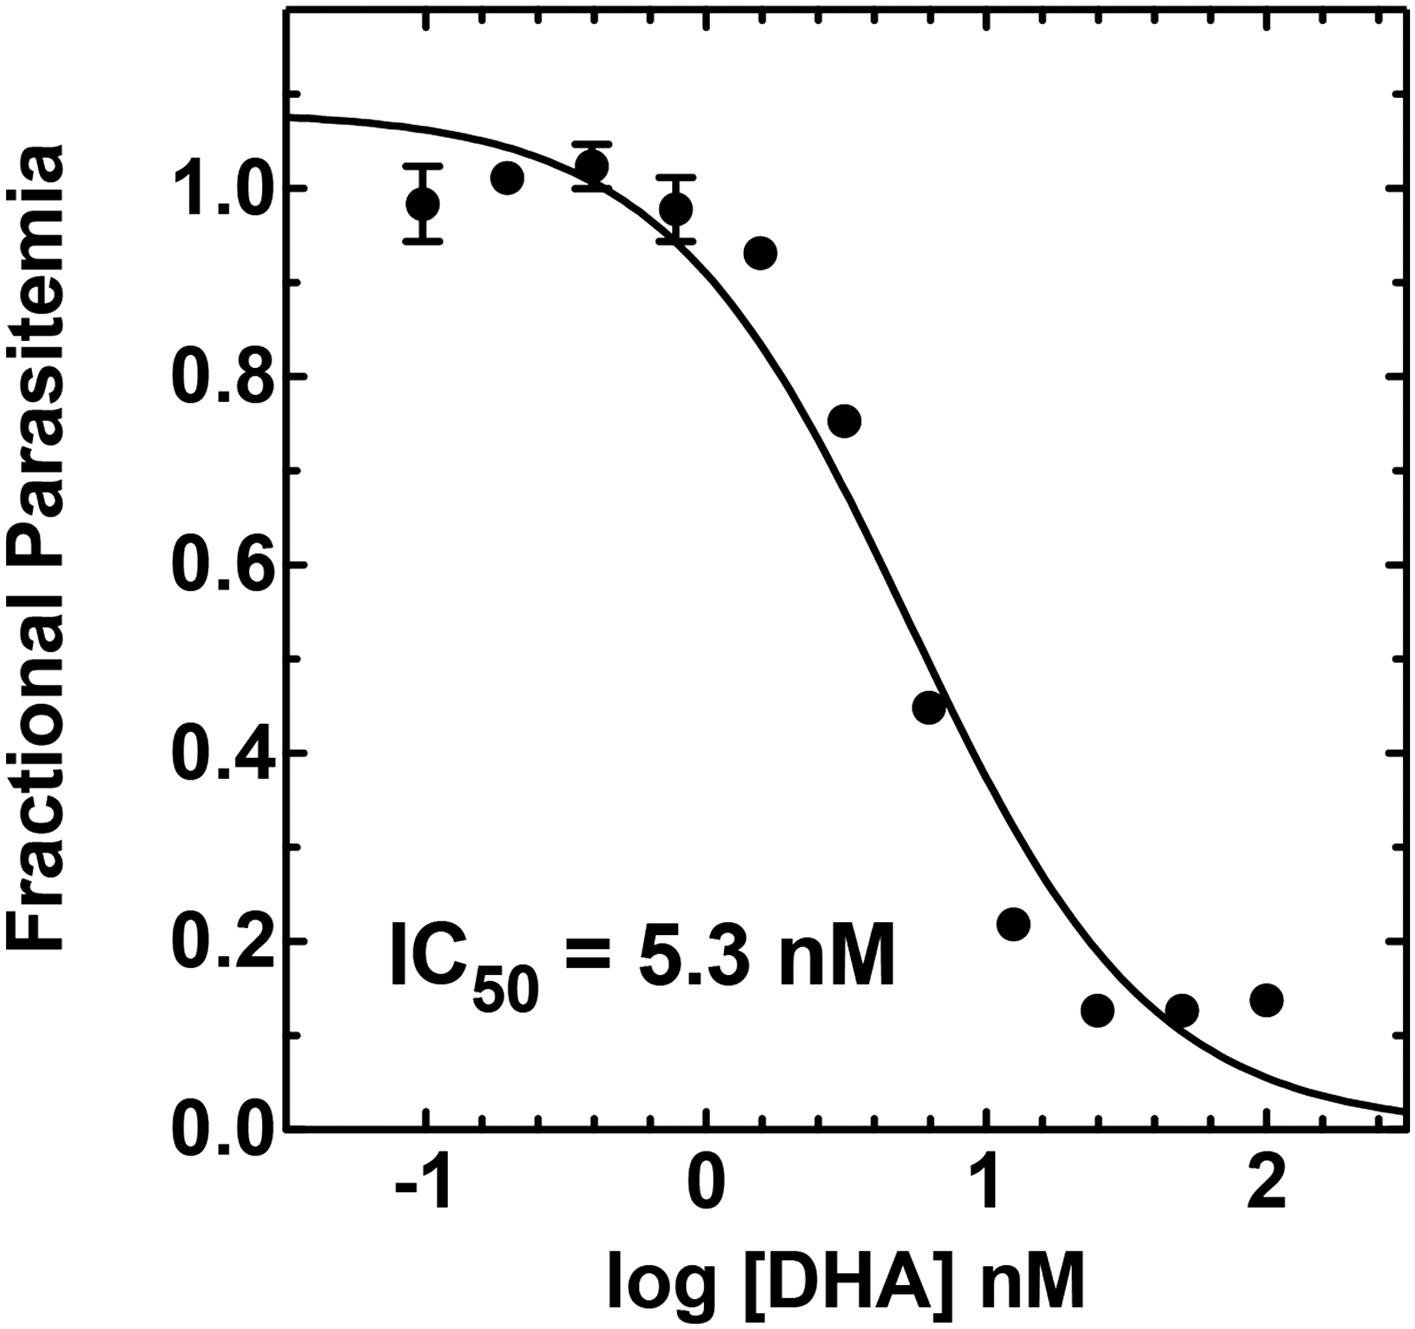
Concentration dependence of growth inhibition of 3D7 parasites by DHA over 48 hr (in 0.2% DMSO).
https://doi.org/10.7554/eLife.09143.032
Figure 7—figure supplement 6
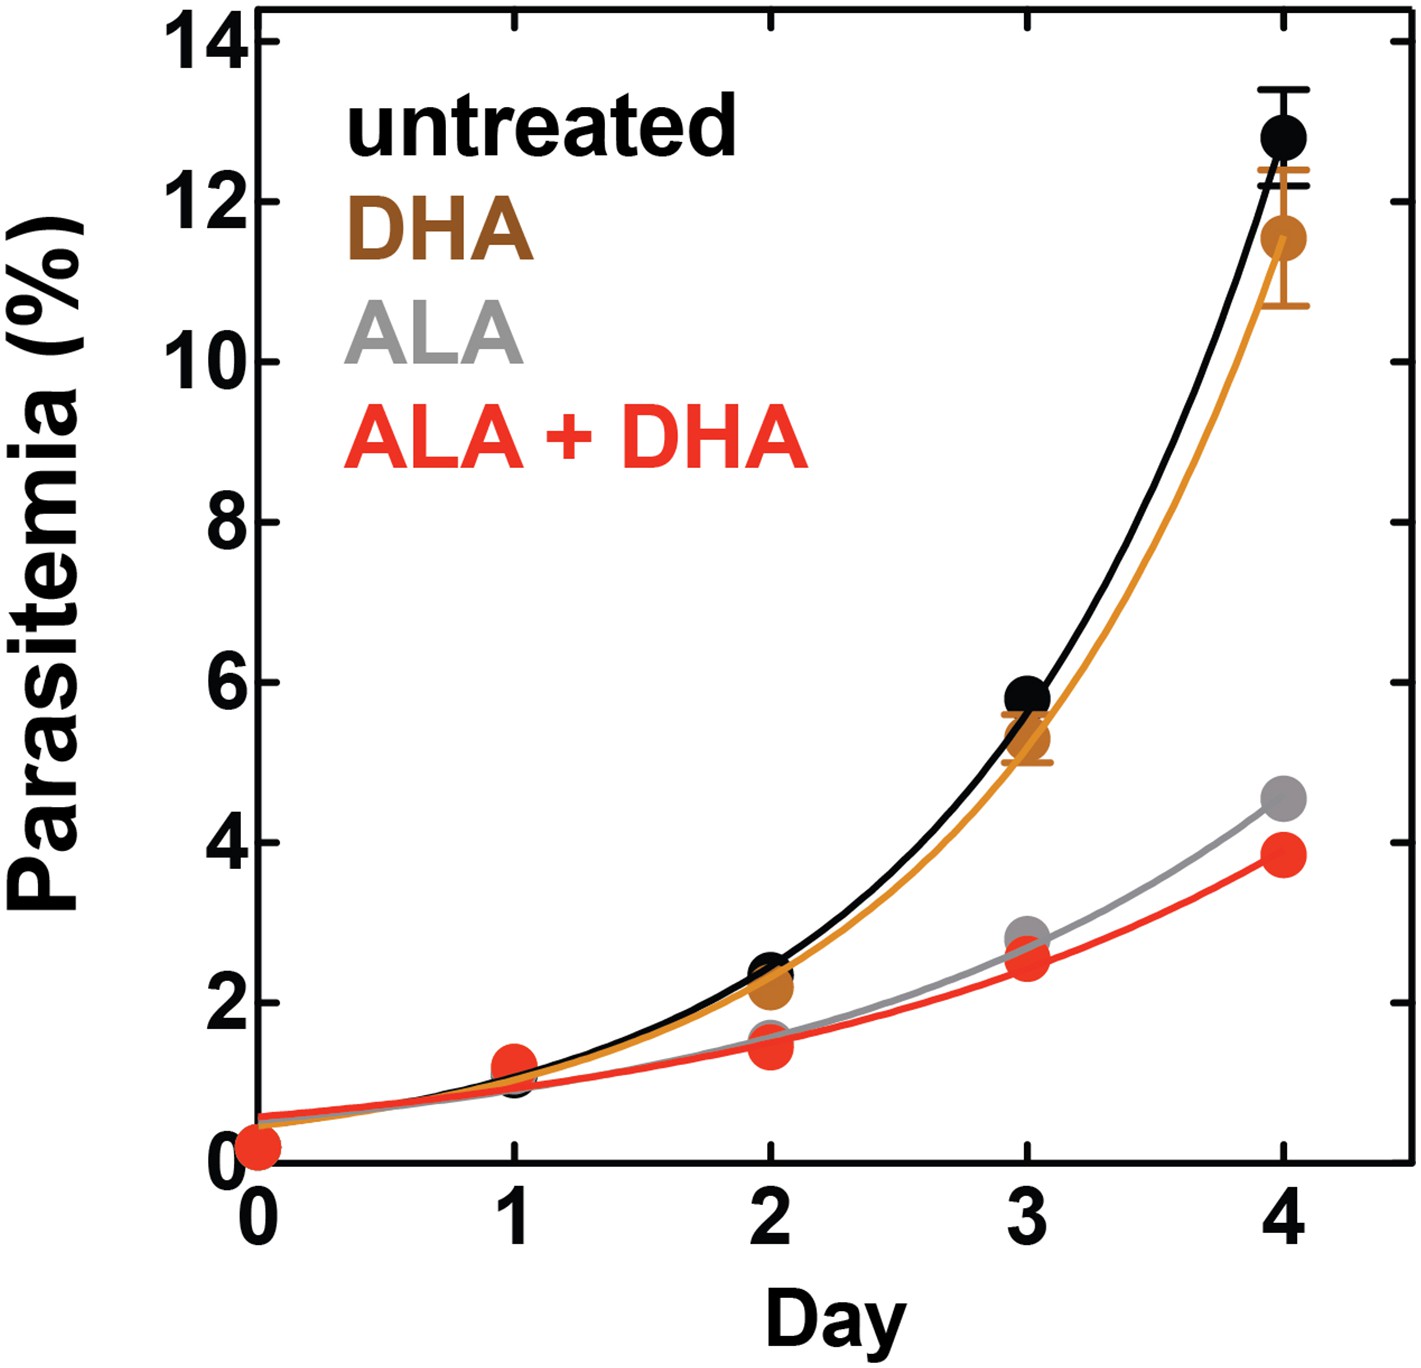
Effect of 500 pM DHA, 100 µM ALA, and their combination (all in 0.2% DMSO) on the growth of asynchronous 3D7 parasites.
https://doi.org/10.7554/eLife.09143.033Videos
Video 1
Hemozoin dynamics in the digestive vacuole of untreated parasites prior to light exposure.
https://doi.org/10.7554/eLife.09143.008
Video 2
Hemozoin dynamics in the digestive vacuole of untreated parasites after light exposure.
https://doi.org/10.7554/eLife.09143.009
Video 3
Hemozoin dynamics in the digestive vacuole of 200 µM ALA-treated parasites prior to light exposure.
https://doi.org/10.7554/eLife.09143.010
Video 4
Hemozoin dynamics in the digestive vacuole of 200 µM ALA-treated parasites after light exposure.
https://doi.org/10.7554/eLife.09143.011Download links
A two-part list of links to download the article, or parts of the article, in various formats.
Downloads (link to download the article as PDF)
Open citations (links to open the citations from this article in various online reference manager services)
Cite this article (links to download the citations from this article in formats compatible with various reference manager tools)
Deconvoluting heme biosynthesis to target blood-stage malaria parasites
eLife 4:e09143.
https://doi.org/10.7554/eLife.09143


