Spontaneous neurotransmission signals through store-driven Ca2+ transients to maintain synaptic homeostasis
- University of Texas Southwestern Medical Center, United States
Figures
Figure 1
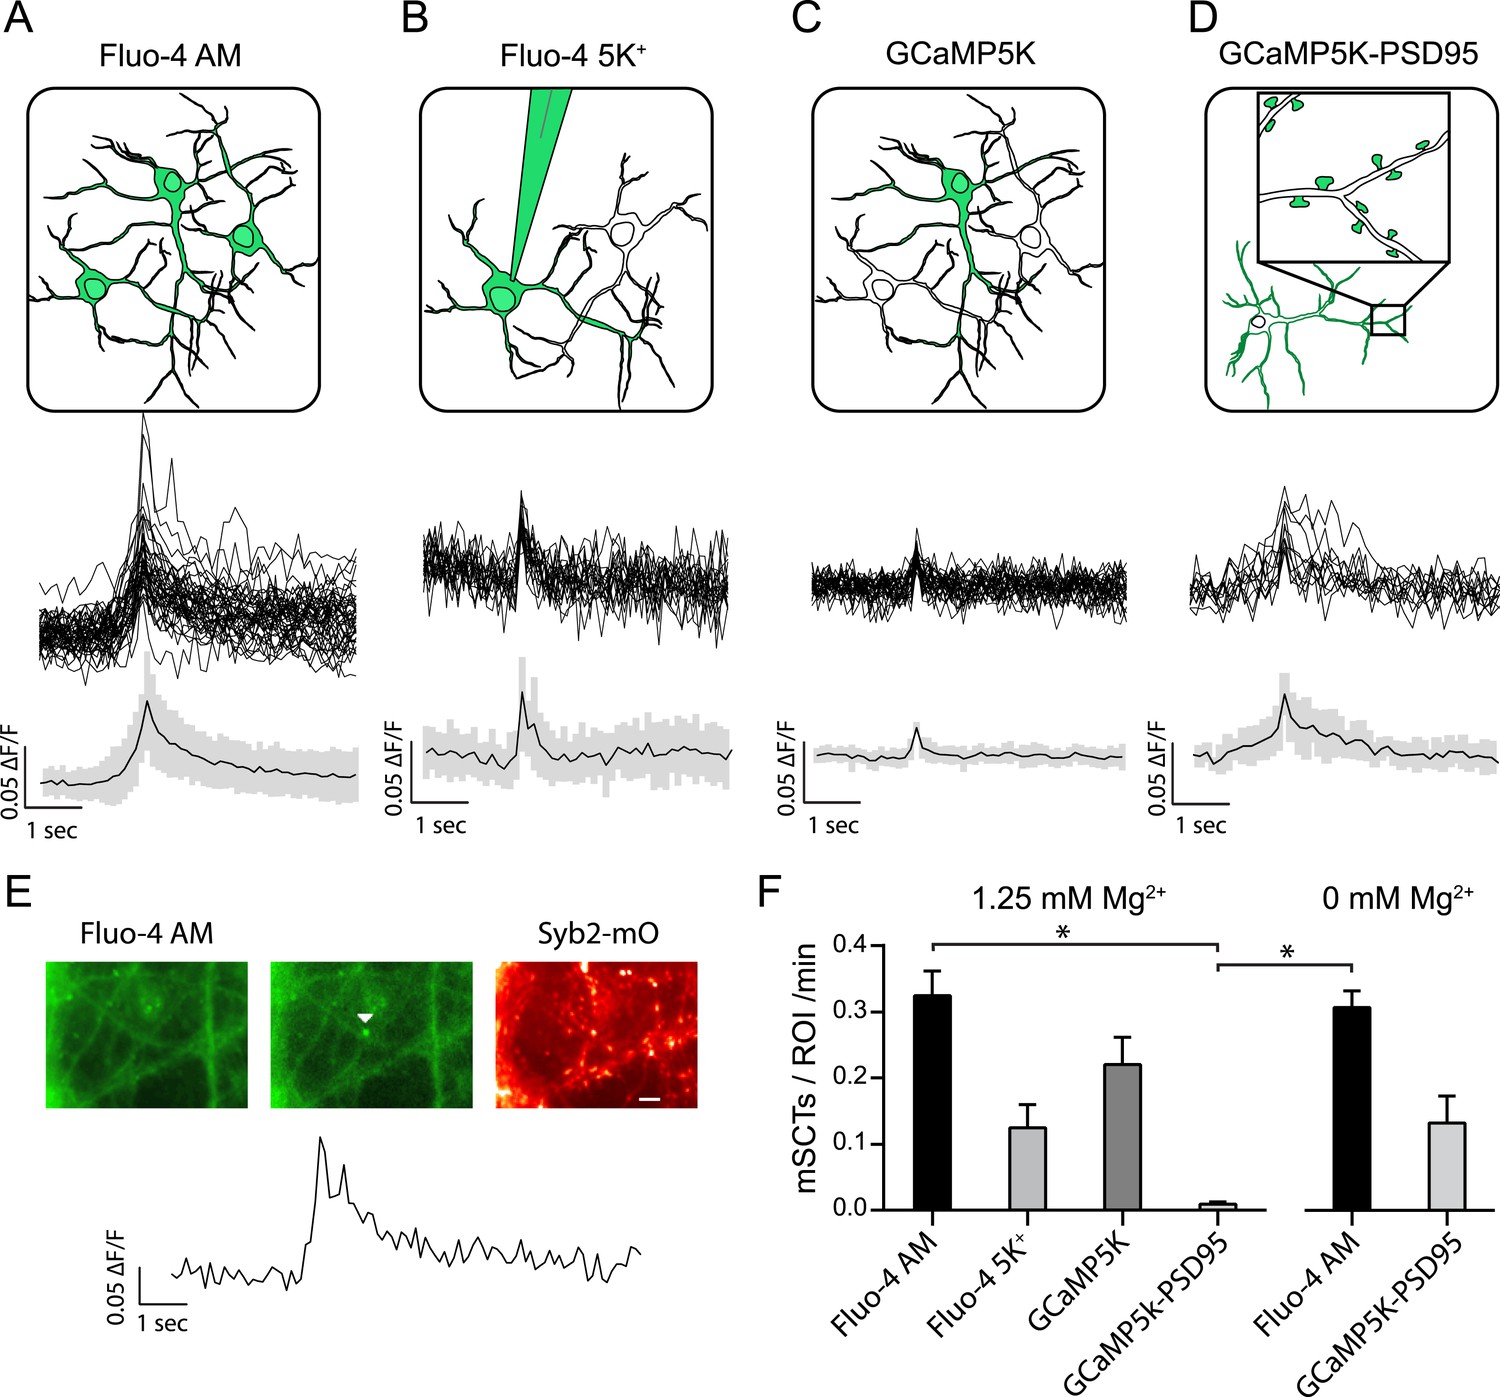
Multiple approaches to detect miniature spontaneous Ca2+ transients (mSCTs) in the presence of TTX and physiological Mg2+.
(A) Loading dissociated rat hippocampal cultures with Fluo-4 AM dye labels all cells on the coverslip (above) and produces the largest signal amplitudes, shown as example traces and an average with standard deviation (below) N = 38 experiments, 7 cultures. (B) Individual neurons were loaded with the salt form of Fluo-4 at the whole cell recording configuration via a pipette containing 200 μM of the dye. N = 4 experiments, 1 culture. (C) Low efficiency lipotransfection with the highly sensitive GCaMP5K variant produces sparse labeling of neurons across the coverslip but low signal (ΔF/F) amplitudes. N = 5 experiments, 1 culture. (D) Lentiviral mediated transfection with GCaMP5K-PSD95 targets the fluorescent construct to the postsynaptic densities of all cells on each coverslip. N = 15 experiments, 4 cultures. (E) Example images and trace of a mSCT visualized with Fuo-4 AM and its corresponding Syb2-mOrange puncta. Panels show baseline and peak fluorescence intensity with the arrow marking peak fluorescence intensity of the mSCT. Scale bar 5 µm. (F) Frequencies expressed as mSCTs per ROI per minute show the highest efficiency of mSCT detection with Fluo-4 AM. Fluo-4 AM based experiments performed with no Mg2+ in the external solution reported no significant changes in mSCT compared to the presence Mg2+. The postsynaptically localized reporter GCaMP5K-PSD95 reports statistically lower frequencies when compared to Fluo-4 AM (Fluo-4 AM 1.25 mM Mg2+ vs GCaMP5K-PSD95 1.25 mM Mg2+ p = 0.0003, Fluo-4 AM 0 mM Mg2+ vs GCaMP5K-PSD95 1.25 mM Mg2+ p = 0.0031, via one-way ANOVA with Holm-Sidak's multiple comparisons) 0 mM Mg2+ Fluo-4 AM N = 16 experiments, 8 cultures. 0 mM Mg2+ GCaMP5kK-PSD95 N = 10 experiments, 4 cultures.
Figure 2 with 1 supplement

Detection and characterization of spontaneous Ca2+ transients in physiological concentrations of Mg2+.
(A) Events detected from Fluo-4 AM traces having rising slope greater than 350 fluorescence units/s and a peak ∆F/Fo greater than 0.035 were counted if the peak fluorescence value was 2 standard deviations greater than the mean of the signal 2 s previous. Gray shaded region indicates the moving average plus/minus two standard deviations and the red line indicates the 0.035 ∆F/Fo threshold. Red trace shows the 2 point slope with the black line as the 350 A.U./second detection threshold. Arrows indicate peaks that satisfy these criteria. (B) Histograms showing rise time (τ), decay time (τ) and amplitudes (∆F/Fo) of mSCTs. N = 306 mSCTs from 6 experiments and 2 cultures. (C, D) Traces from cells (C) and Ca2+ transient frequencies (D) were obtained by imaging first in Tyrode's solution containing no Ca2+, then in Tyrode's containing 2 mM Ca2+ and finally Tyrode's containing 2 mM Ca2+ and the NMDA receptor blocker AP5. Removal of extracellular Ca2+ or block of the NMDA receptor resulted in a significant reduction in Ca2+ transient frequency (2 mM Ca2+ vs 0 mM Ca2+ p = 0.038, 2 mM Ca2+ vs 2 mM Ca2+ + AP5 p = 0.038, via 1-way ANOVA with Holm-Sidak's multiple comparisons test). N = 8 experiments, 2 cultures.
Figure 2—figure supplement 1
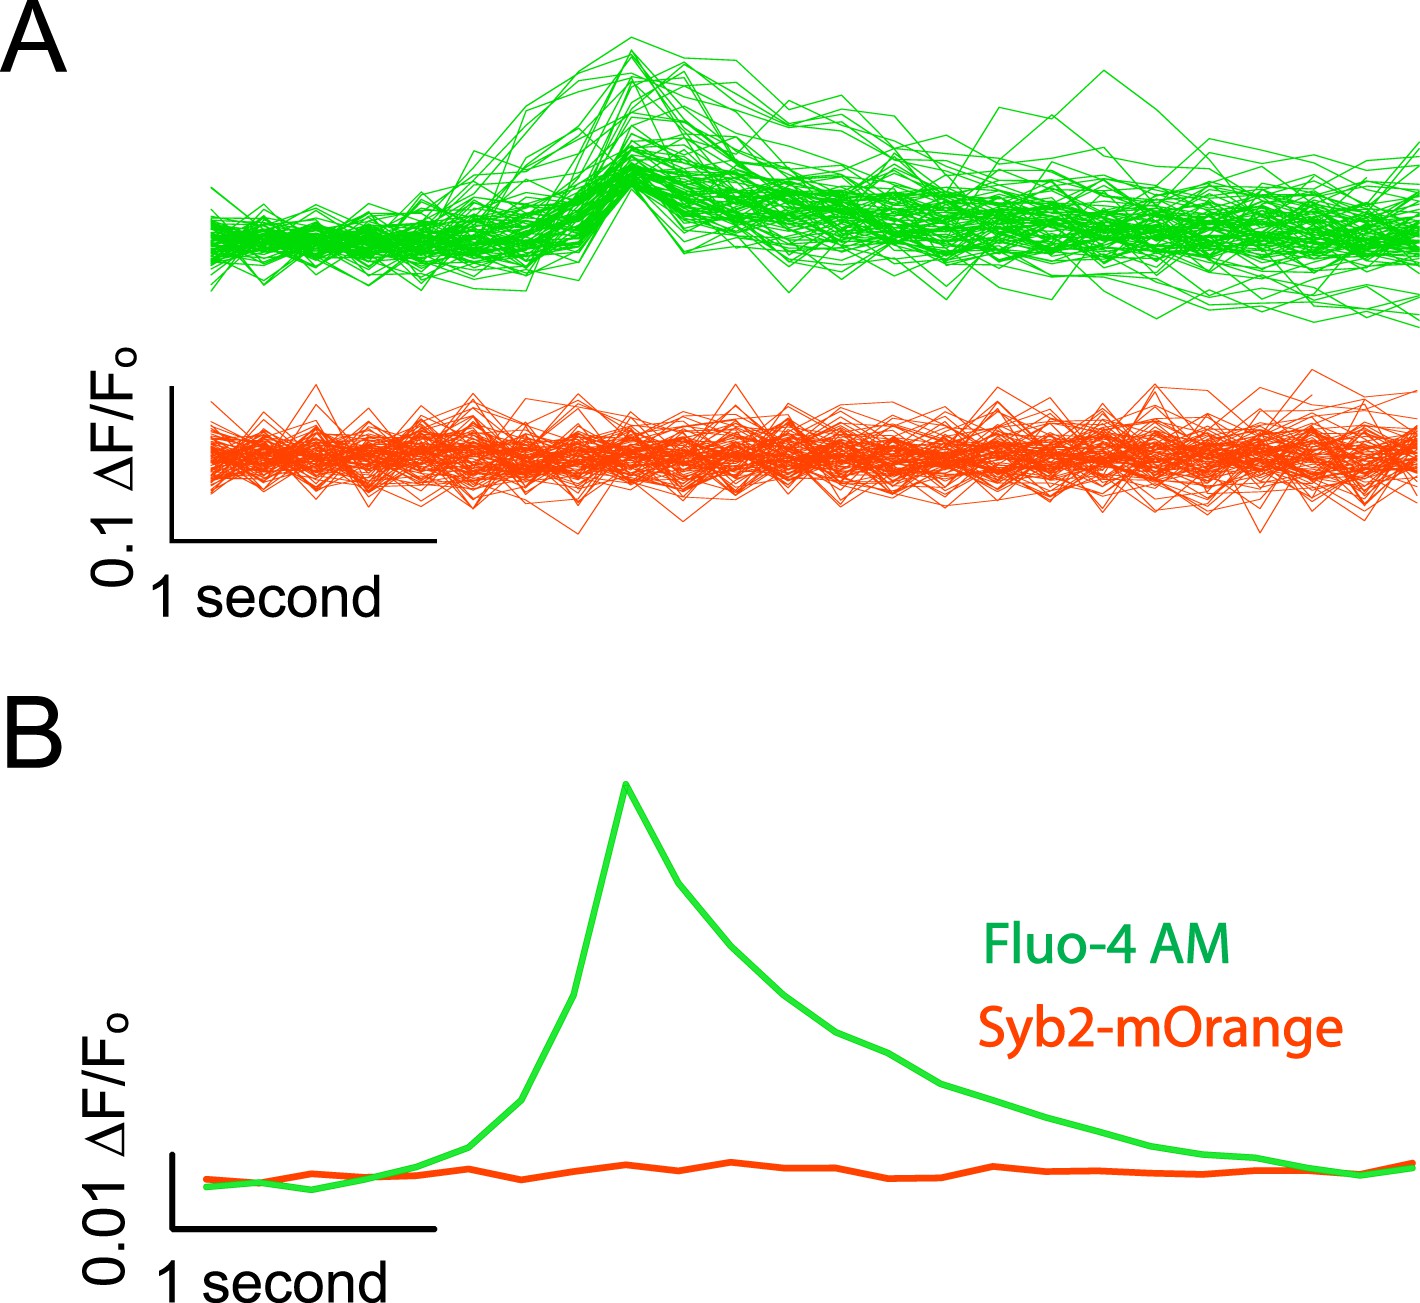
Syb2-mOrange fluorescence does not contaminate Fluo-4 AM signals.
(A) Example traces from simultaneous Fluo-4 AM / synaptobrevin-mOrange imaging. Cells were imaged alternating the excitation between Fluo-4 AM and Syb2-mO for every other frame. Each frame was exposed for 100 ms as described previously and frames were collected at 5 fps per channel. Events were detected as described previously using the Fluo-4 AM channel and the data for both wavelengths was aligned to the peak value in the green channel. Green traces show example evens detected in the channel excited with 470 ± 40 nm light to excite Fluo-4 AM and the red traces show the corresponding data collected with a 548 ± 10 nm excitation filter to excite Syb2-mOrange. (B) Average traces made from 382 detected and aligned events. The average trace in the Fluo-4 AM channel shows a robust Ca2+ transient while the averaged Syb2-mO data shows no appreciable deviation from baseline.
Figure 3
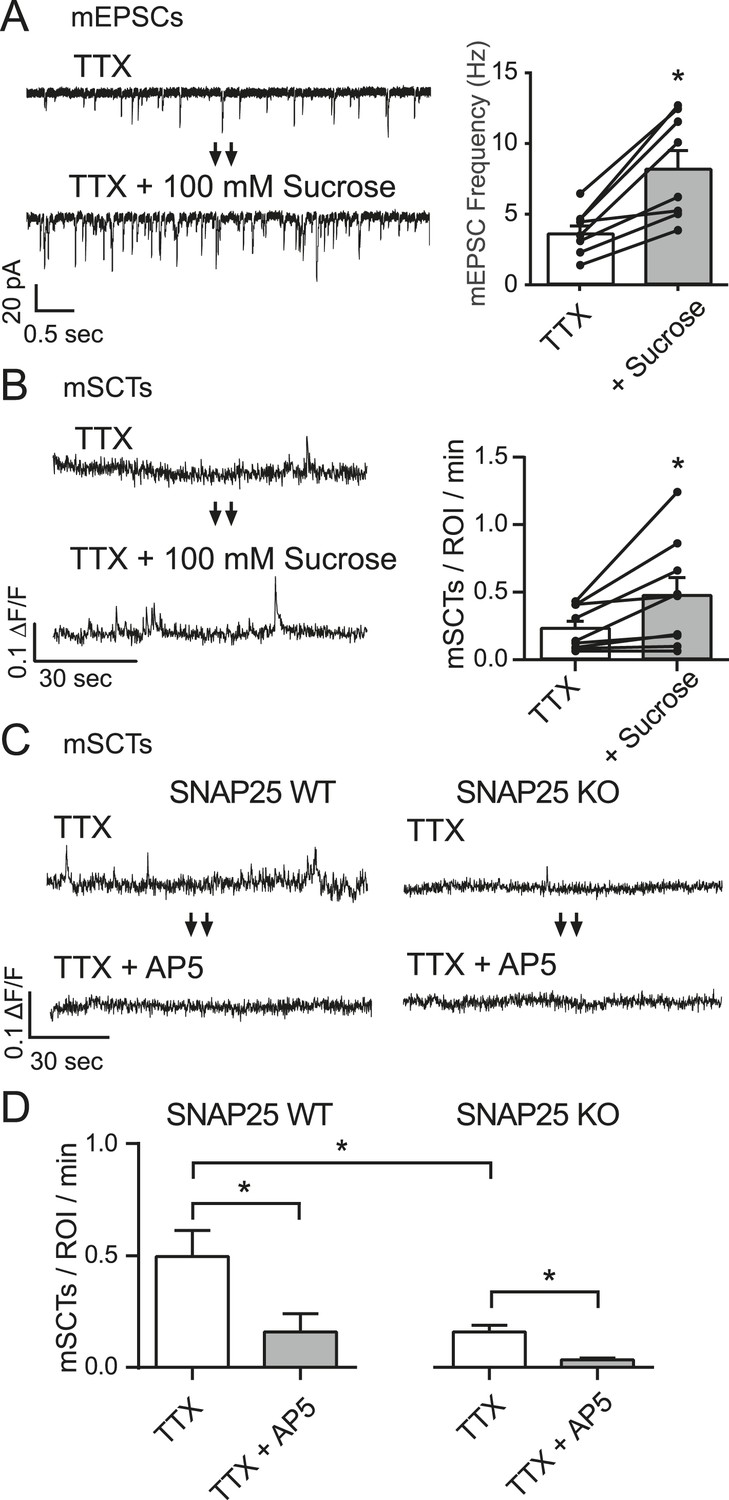
mSCT frequency is correlated with mEPSC frequency.
(A) Whole cell recordings from WT cells (left) show a ∼twofold increase in mEPSC frequency when switched to Tyrode's solution containing 100 mM sucrose (right) (p = 0.002, Student's paired T test, N = 8 cells, from 5 coverslips and 2 cultures). (B) Example traces (left) and quantification of spontaneous Ca2+ transient frequencies measured via imaging show a ∼twofold increase upon application of 100 mM sucrose (right) (p = 0.028, Student's paired T test, N = 9 experiments from 3 cultures). (C) Fluo-4 example traces from both control and SNAP25 KO animals before and after the application of AP5. (D) Fluo-4 imaging in cultures made from SNAP25 KO and littermate control mice reveal that the KO cultures have a substantially decreased mSCT frequency. In this setting, AP5 treatment greatly decreases but does not completely abolish the remaining mSCTs. (WT, TTX vs WT, TTX+AP5 p = 0.010. WT, TTX vs KO, TTX p = 0.008. KO TTX vs KO TTX+AP5 p = 0.003, via 1-way ANOVA with Tukey's multiple comparisons, N = 8 experiments in WT cells and 9 experiments in KO cells from 3 cultures).
Figure 4 with 2 supplements
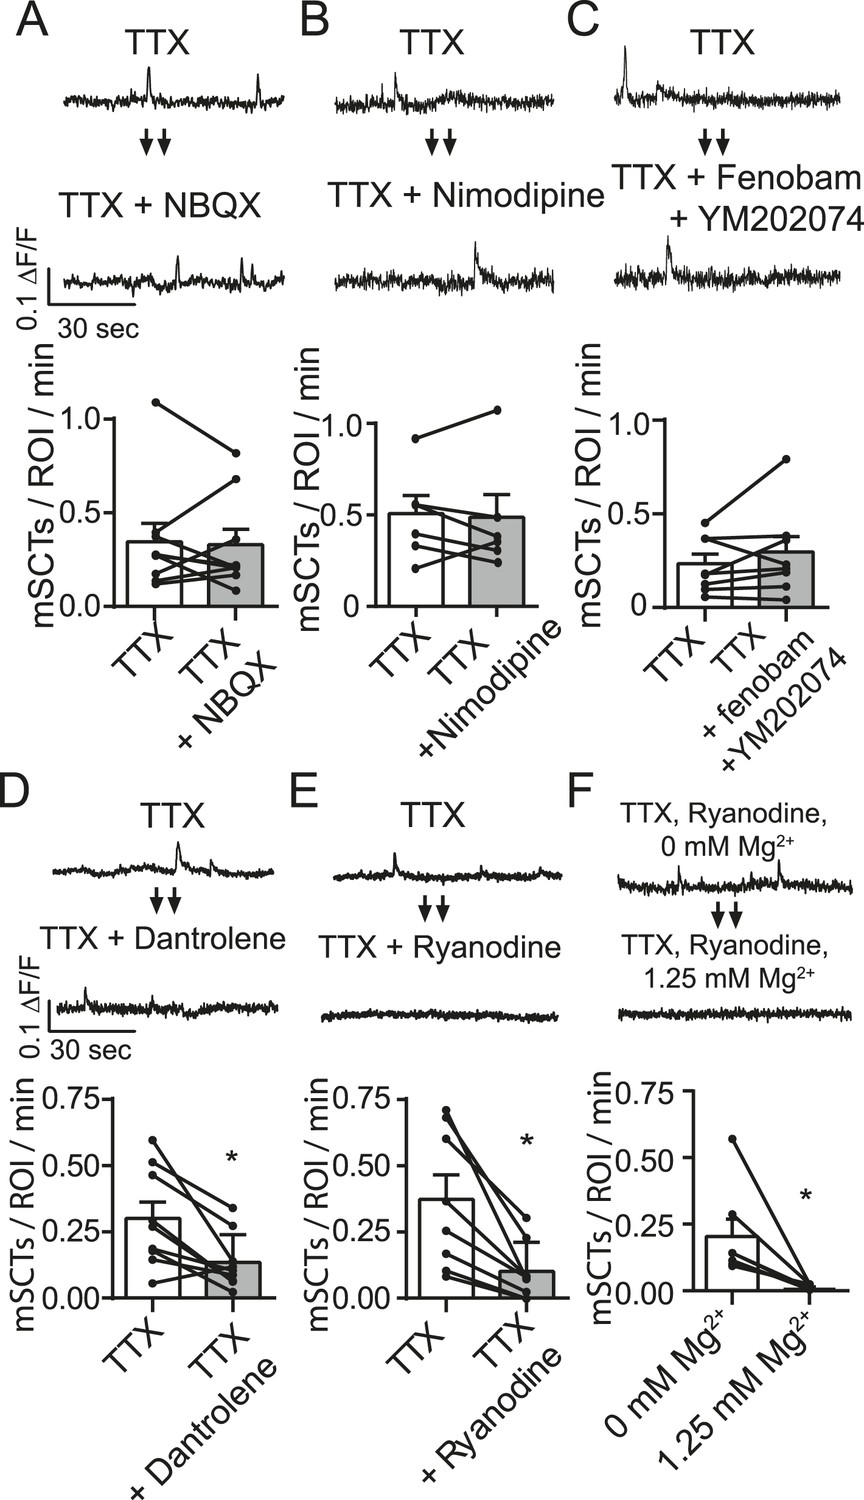
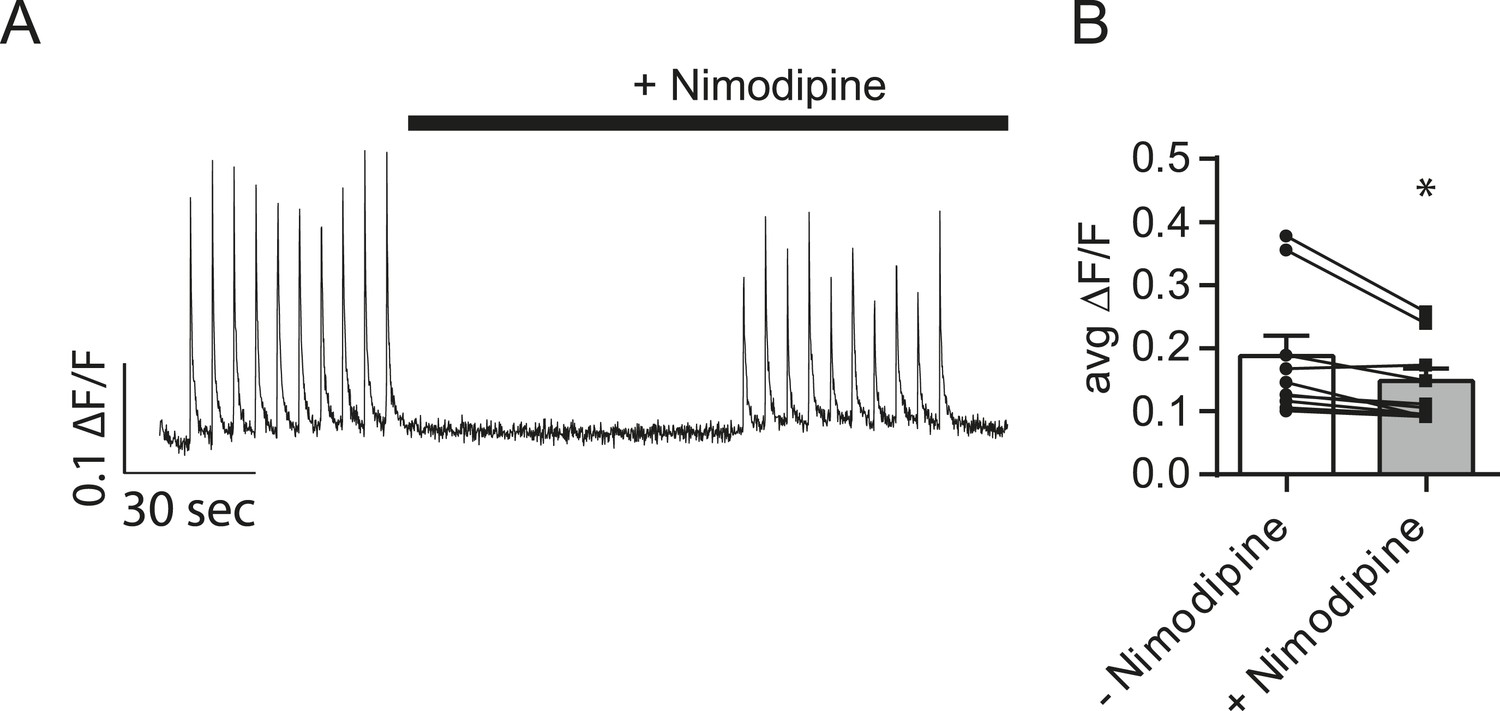
Spontaneous Ca2+ transient generation is decreased by blocking release of Ca2+ release from internal stores but not by blocking the AMPA receptors, L-type Ca2+ channels or group I mGluRs.
(A) Traces (top) from images taken before and after treatment with the AMPA receptor blocker NBQX show no change in Ca2+ transient frequency (bottom) (p = 0.78 with Student's paired t-test, N = 9 experiments, 2 cultures). (B) Imaging in the presence of the specific L-type calcium channel blocker nimodipine (5 µM) does not affect spontaneous Ca2+ transient frequency (bottom) (p = 0.89 with Student's paired t-test. N = 7 experiments 1 culture). (C) Imaging in the presence of mGluR1 and mGluR5 blockers YM202074 and fenobam produce no differences in spontaneous Ca2+ transient frequency (p = 0.26 via Student's t-test. N = 8 cells, 2 cultures). (D) Application of internal Ca2+ store blocker dantrolene produces a significant drop in mSCT frequency in before/after experiments. (p = 0.008, Student's paired t-test, N = 9 experiments, 3 cultures). (E) Fluo-4 AM example traces and frequency quantification from cells recorded in TTX then in TTX + 30 µM Ryanodine. In before/after imaging experiments, 15 min treatment of the use dependent ER Ca2+ channel blocker ryanodine decreased the frequency of observed Ca2+ transients (p = 0.004, N = 8 via Student's paired t-test). (F) Example traces and frequency quantification of cells pre treated with ryanodine and then imaged first in Tyrode's solution containing no Mg2+ followed by Tyrode's solution containing 1.25 mM Mg2+. Ca2+ transients are measured in Mg2+ free solution but not in 1.25 mM Mg2+. (p = 0.024, via Student's unpaired t-test. N = 7 experiments 2 cultures).
Figure 4—figure supplement 1
Nimodipine produces positive results in a separate assay.
(A) Example traces showing Ca2+ influx during action potentials in the absence and presence of nimodipine. Cells were loaded with Fluo-4 AM and imaged in Tyrode's solution containing 1.25 mM Mg2+, 2 mM Ca2+, 50 µM AP5 and 20 µM NBQX. 10 action potentials were evoked via field stimulation at 0.2 Hz. Then, the perfusion was changed to include 5 µM of the L-type calcium channel blocker nimodipine for 1 min before repeating the stimulation. ROIs were 20 µm in diameter placed on the cell soma. (B) Average peak fluorescence from action potential trains before and after the addition of 5 µM nimodipine. The addition of nimodipine restricts Ca2+ influx during the action potential by ∼27%. N = 8 cells, 1 culture. p = 0.019 via Student's paired t-test.
Figure 4—figure supplement 2
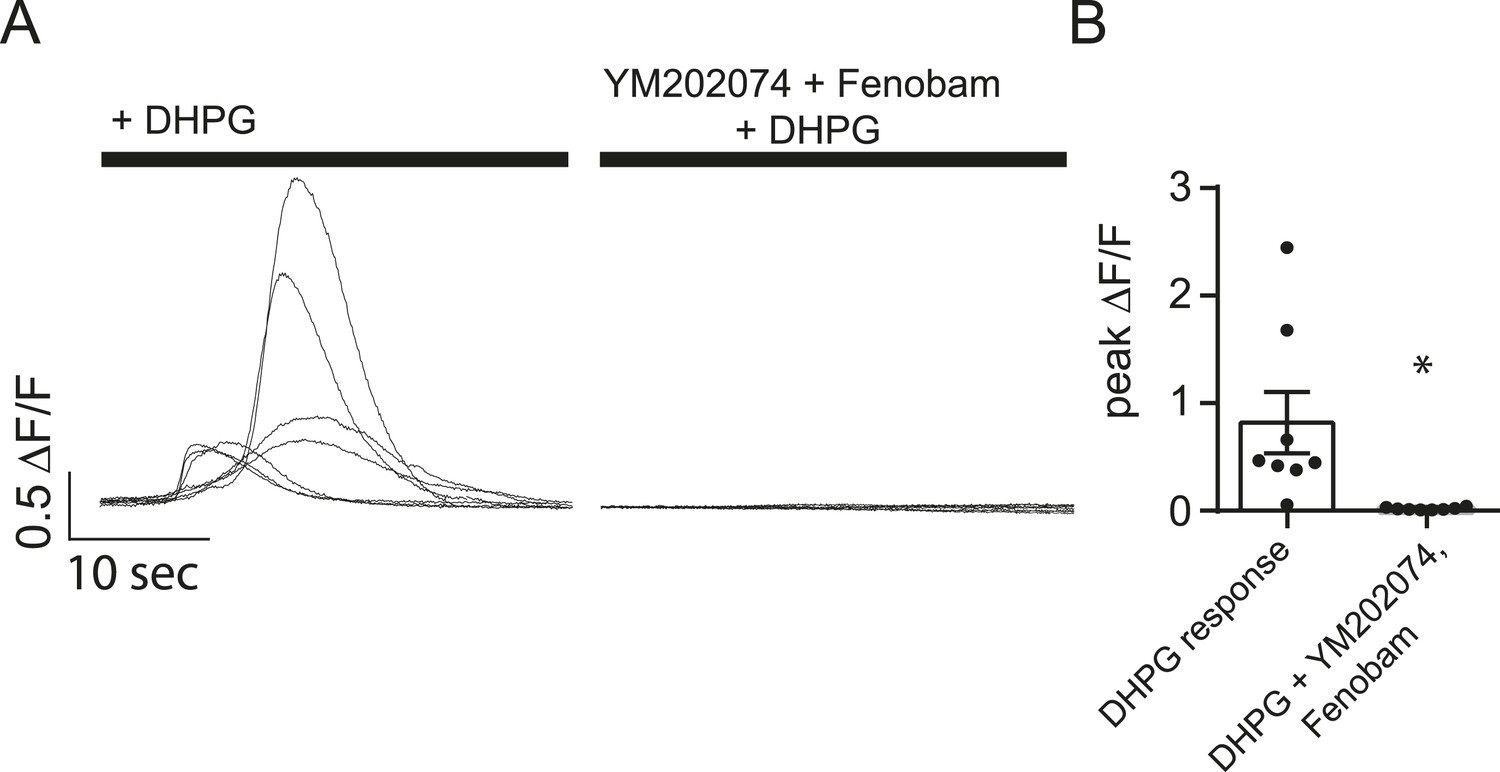
YM202074 and Fenobam produce positive results in a separate assay.
(A) Cells loaded with Fluo-4 AM were imaged in Tyrode's solution containing 1.25 mM Mg2+, 2 mM Ca2+ and TTX with or without the mGluR1/5 blockers YM202074 and fenobam. The solution was then changed to include 100 µM DHPG (a mGluR1/5 agonist) where it elicited large slow Ca2+ influx in the cells no treated with YM202074 and fenobam. (B) Peak ∆F/F measurements for the experiment described in panel A shows marked inhibition of the DHPG response in cells treated with mGluR1/5 antagonists. p = 0.015 via Student's t-test. N = 8 cells per group from 8 coverslips, 1 culture.
Figure 5
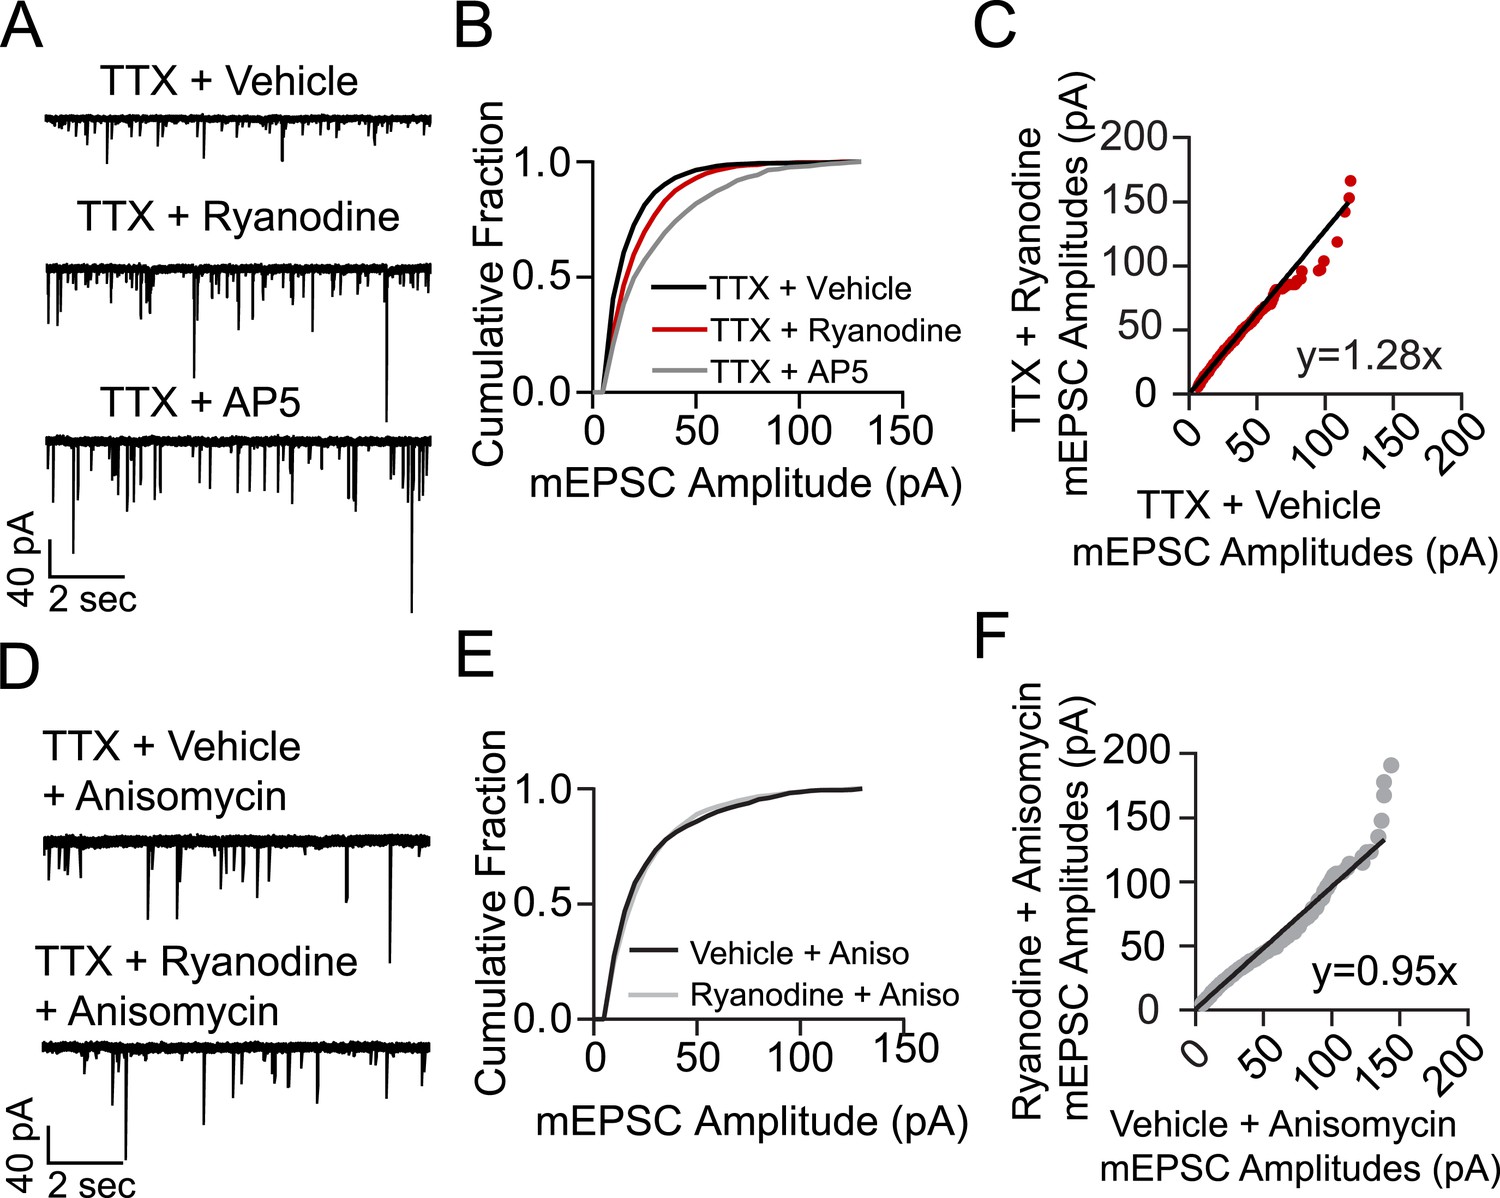
Treating cells with ryanodine + TTX produces a protein synthesis dependent increase in mEPSC frequency and amplitude indicative of homeostatic synaptic scaling.
(A) Example voltage clamp recordings from cells treated with TTX + vehicle (negative control, N = 9 cells from 5 coverslips, 3 cultures), TTX + ryanodine (N = 8 cells from 5 coverslips, 4 cultures) or TTX + AP5 (positive control, N = 6 cells from 4 coverslips, 2 cultures) for 3 hr. (B) Cumulative probability histogram showing significant rightward shifts (increases) in the amplitude of AMPA mEPSCs of cells treated with TTX + ryanodine (red line, p = 1.74 × 10⁻¹⁷, D = 0.151), or TTX + AP5 (p = 8.79 × 10−40, D = 0.255) vs control via Kolmogorov–Smirnov test. (C) Rank order plot of TTX + vehicle mEPSC amplitudes vs TTX + ryanodine showing a multiplicative scaling factor of 1.28. (D) Example voltage clamp recordings from cells pretreated for 30 min with the protein synthesis inhibitor anisomycin and then TTX + vehicle (N = 6 cells from 5 coverslips, 4 cultures) or TTX + ryanodine for 3 hr (N = 7 cells from 5 coverslips, 2 cultures). (E) Cumulative probability histogram of mEPSC amplitudes shows no significant difference between treatment groups when pretreated with anisomycin (p = 0.078, D = 0.052 via Kolmogorov–Smirnov test). (F) Rank order plot of mEPSC amplitudes indicates that anisomycin pretreatment abolishes scaling between treatment groups.
Figure 6

Ryanodine treatment does not trigger homeostatic synaptic scaling in eEF2 kinase knockout neurons.
(A) Example traces from WT littermate mice with and without 3 hr ryanodine treatment. (B) Cumulative probability histogram shows a significant shift in mEPSC amplitude in TTX + ryanodine treated animals (N = 12 cells, from 7 coverslips, 3 cultures) vs TTX + vehicle control (N = 13 cells from 8 coverslips, 3 cultures) (p = 3.32 × 10⁻¹⁴, D = 0.112 via Kolmogorov–Smirnov test). (C) Rank order plot shows a 1.42 fold increase in synaptic strength after ryanodine treatment. (D) Example traces from eEF2 kinase KO animals with and without ryanodine treatment. (E) Cumulative probability histogram shows no shift in the distribution of mEPSC amplitudes in eEF2K KO animals treated with TTX + ryanodine (N = 9 cells, from 6 coverslips, 3 cultures) vs TTX + vehicle (N = 13 cells from 7 coverslips, 3 cultures) (p = 0.066, D = 0.058 via Kolmogorov–Smirnov test). (F) Rank order plot shows no appreciable multiplicative change in synaptic strength in the eEF2 K KO animals with ryanodine treatment.
Author response image 1
Download links
A two-part list of links to download the article, or parts of the article, in various formats.
Downloads (link to download the article as PDF)
Open citations (links to open the citations from this article in various online reference manager services)
Cite this article (links to download the citations from this article in formats compatible with various reference manager tools)
Spontaneous neurotransmission signals through store-driven Ca2+ transients to maintain synaptic homeostasis
eLife 4:e09262.
https://doi.org/10.7554/eLife.09262


