Discrete spatial organization of TGFβ receptors couples receptor multimerization and signaling to cellular tension
- University of California, San Francisco, United States
- Florida State University, United States
Figures
Figure 1 with 1 supplement
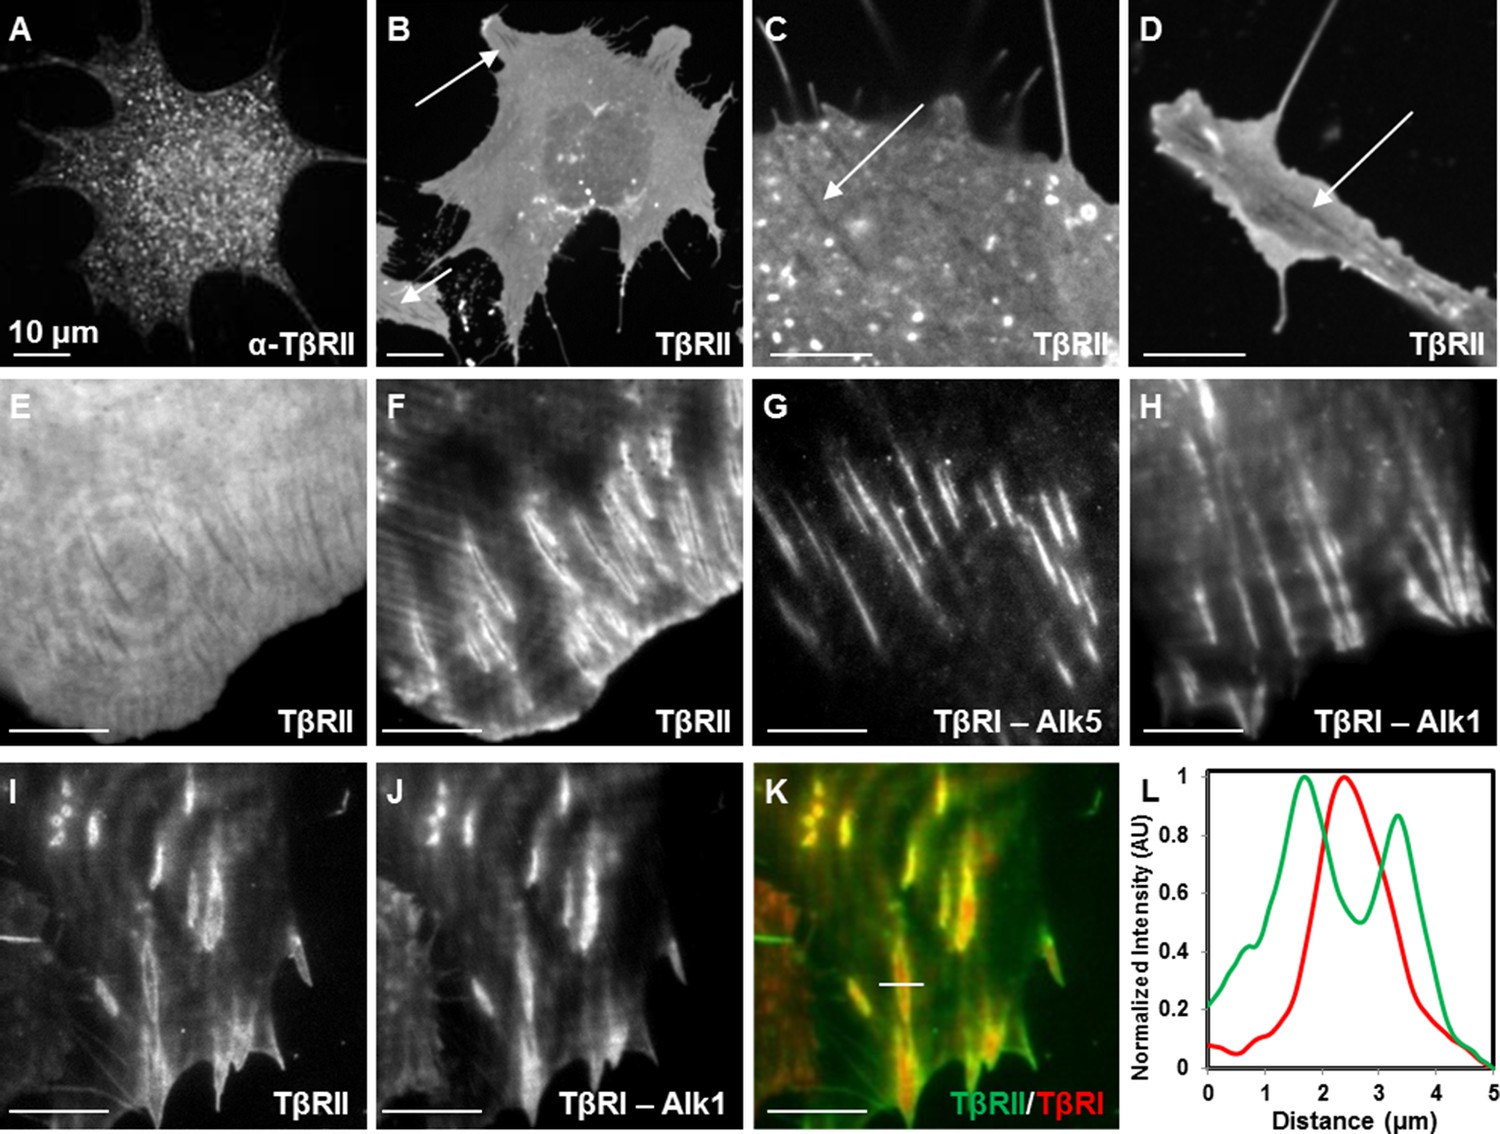
Spatial segregation of TβRII from TβRI.
Spinning disc confocal imaging of endogenous TβRII (A, Figure 1—figure supplement 1) demonstrates punctate staining. Imaging of mEmerald-labeled TβRII (B) reveals TβRII-absent domains in ATDC5 (B,C) and NIH3T3 (D) cells expressing mEmerald-TβRII. Switching from widefield (E) to TIRF mode imaging (F) on the same cell unveils a specific spatial organization of TβRII, which is discrete from that of TβRI (Alk5 and Alk1) (G,H). ATDC5 cells co-expressing mEmerald-TβRII and mCherry-TβRI (Alk1) reveal that TβRII surrounds specific domains of TβRI (I-L). Quantitative profile plot of expression intensity demonstrates separate and distinct localization patterns of TβRI and TβRII (L).
Figure 1—figure supplement 1
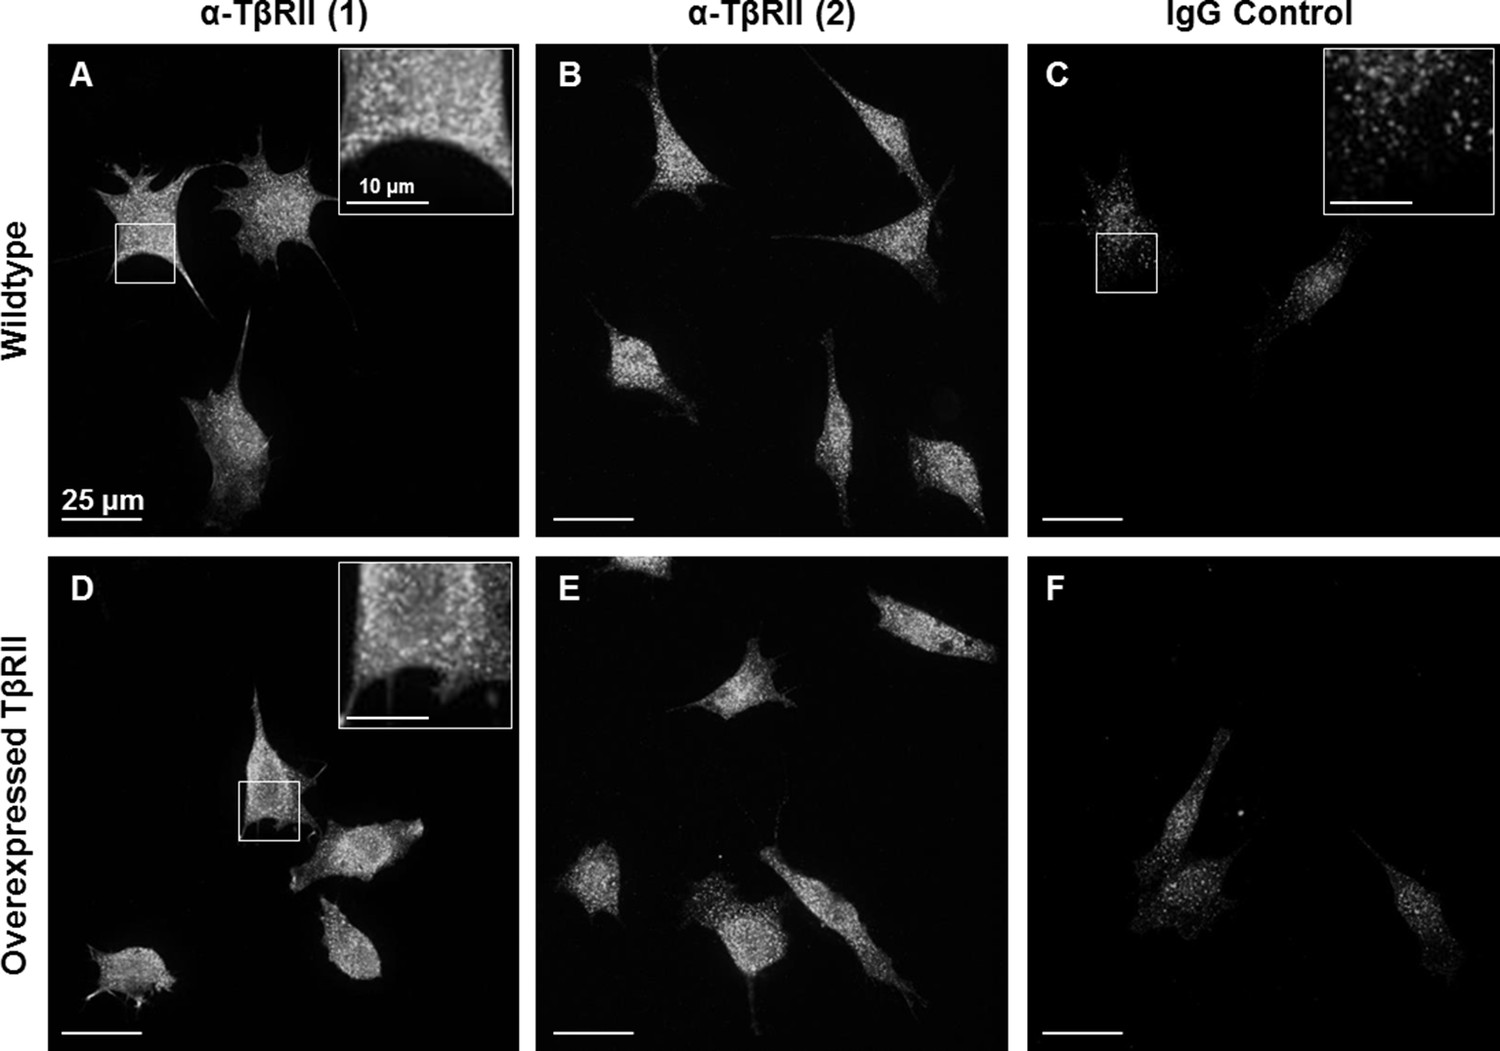
Endogenous staining of TβRII insufficient for spatial organization visualization.
Wildtype ATDC5 cells (A-C) and ATDC5 cells expressing TβRII-mCherry were stained with two different anti-TβRII (A,D and B,E) antibodies and an IgG control (C,F). Staining of TβRII between wildtype and transfected cells differs only in intensity and not structurally, indicating that the observed spatial organization is not due to expression constructs alone. Although TβRII antibodies showed specificity relative to IgG staining, this bright punctate staining is insufficient for visualizing fine structural organization.
Figure 2
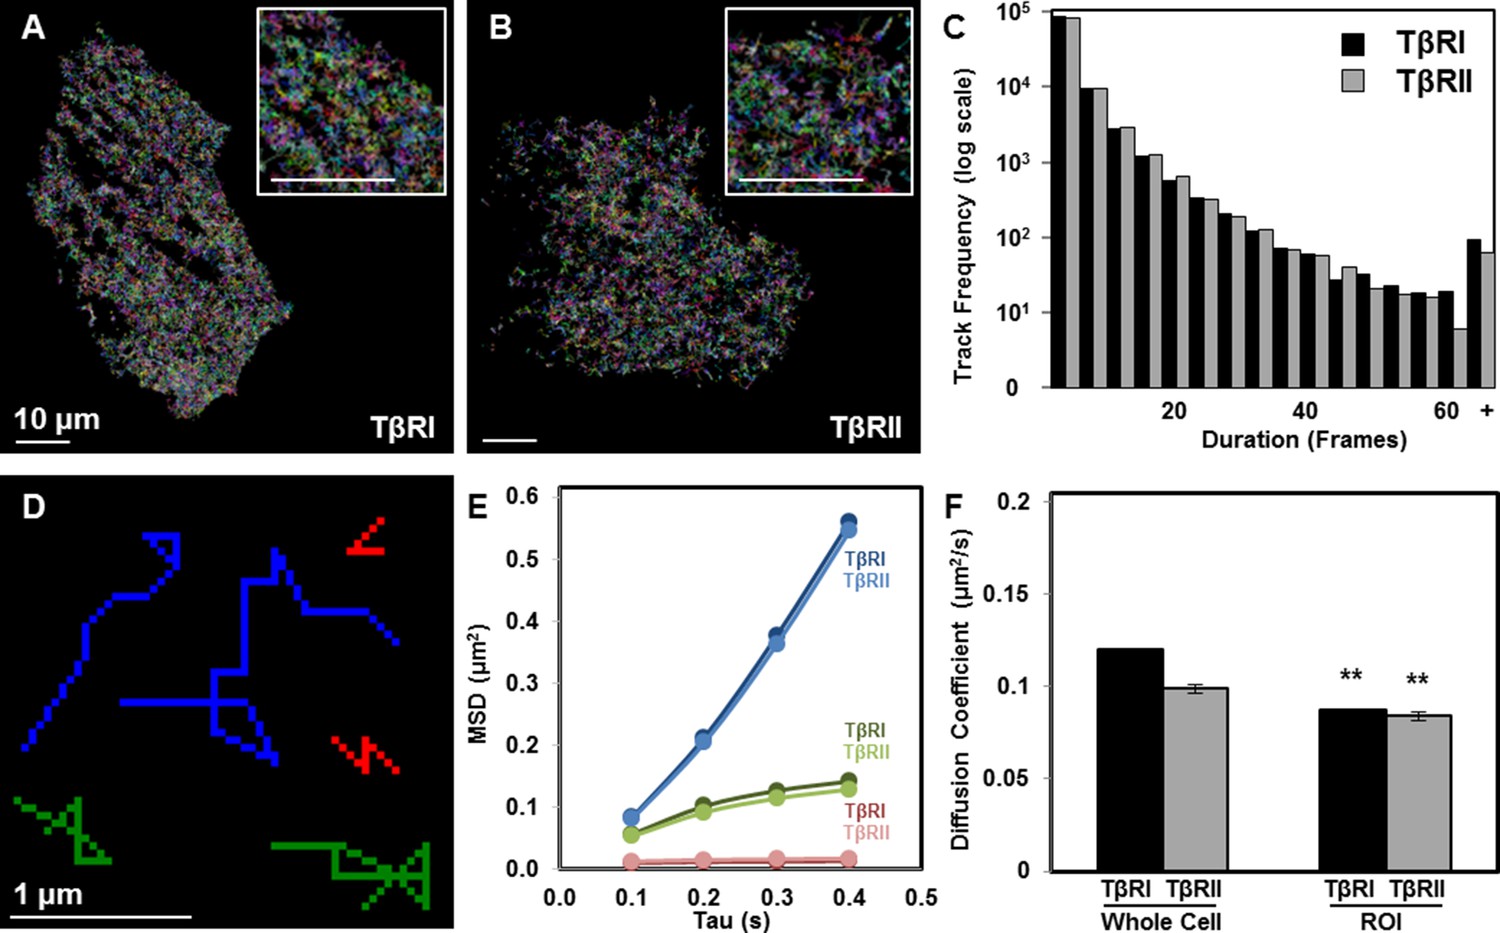
Limited TβRI (Alk5) and TβRII mobility in areas of receptor spatial organization.
All mEos2-tagged TβRI and TβRII sptPALM single molecule trajectories with durations of at least 5 frames (500 ms) are plotted for representative ATDC5 cells, in which each color represents a different track (A,B). Cellular domains outside the imaging plane appear black. The histogram represents the distribution within a single cell of trajectory durations for individual TβRI and TβRII molecules (C). Representative individual TβRI sptPALM single molecule trajectories exhibiting immobile (red), confined (green), and freely diffusive (blue) movement are plotted in (D), with calculated mean squared displacement (MSD) plots for each population of TβRI and TβRII shown in E (mean ± SEM). Comparison of diffusion coefficients for TβRI and TβRII (F, mean ± SEM) in whole cells relative to areas of segregated TβRI/TβRII identify a less mobile population of TGFβ receptors in these regions of interest (ROI). See Source code 1 and Figure 2—source data 1.
-
Figure 2—source data 1
sptPALM single molecule trajectories
- https://doi.org/10.7554/eLife.09300.006
Figure 3 with 1 supplement
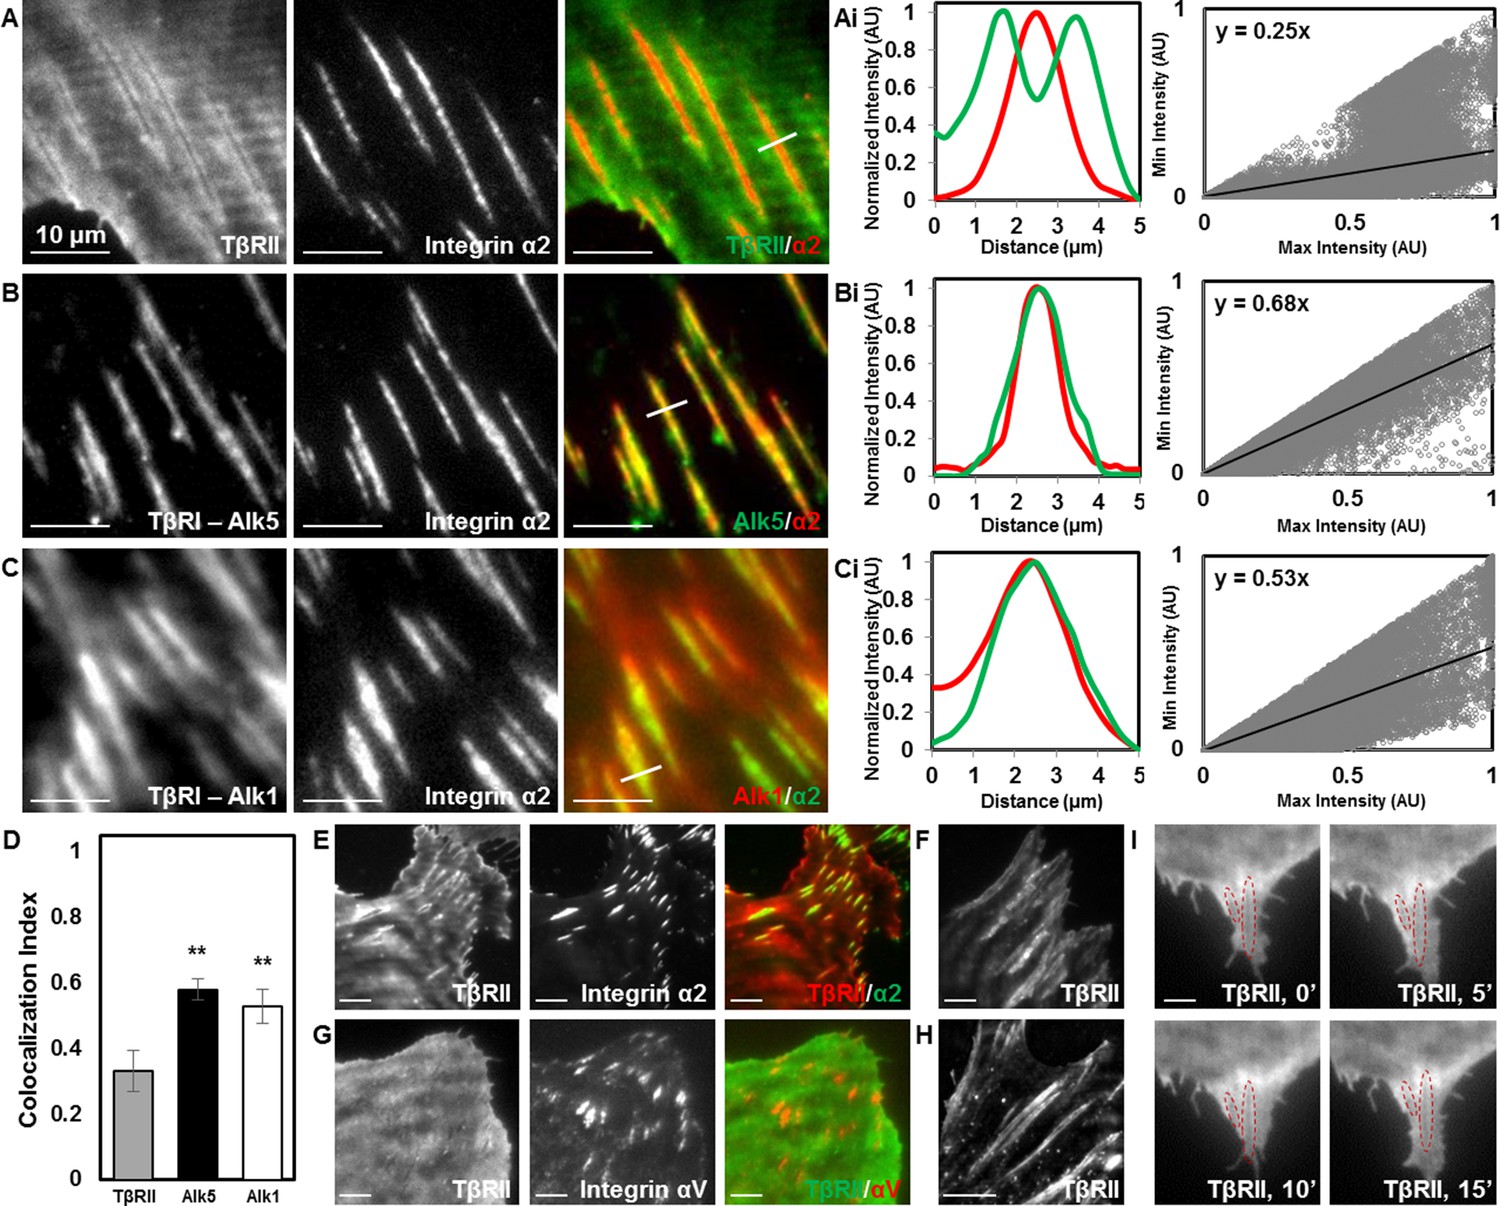
Focal adhesions sequester TβRI from TβRII.
TIRF mode imaging and a custom colocalization analysis were used to evaluate localization of TβRII (A), Alk5 (B), or Alk1 (C) with integrin α2 in ATDC5 cells. TβRII surrounds integrin α2 (A), whereas both subtypes of TβRI, Alk5 (B) and Alk1 (C), are included within integrin-rich focal adhesions, as reflected by profile plots and the slope values of the regression lines (Ai,Bi,Ci). Quantification of colocalization reveals that Alk5 and Alk1 are significantly more colocalized with integrin α2 relative to TβRII (**p < 0.001, mean ± SD, D, Figure 3—source data 1). This organization is also present in ATDC5 cells when the fluorescent labels for TβRII and integrin α2 have been switched (E), in osteosarcoma Saos-2 cells (F), or in epithelial MCF10A cells (G), when labeling focal adhesions with integrin αV (G), and when TβRII is expressed and imaged alone (H). TβRII spatial organization is unaffected by addition of TGFβ, indicated by red outlines in the same cellular region following 15 min of TGFβ treatment (I). See Source code 2.
-
Figure 3—source data 1
Colocalization Index
- https://doi.org/10.7554/eLife.09300.008
Figure 3—figure supplement 1
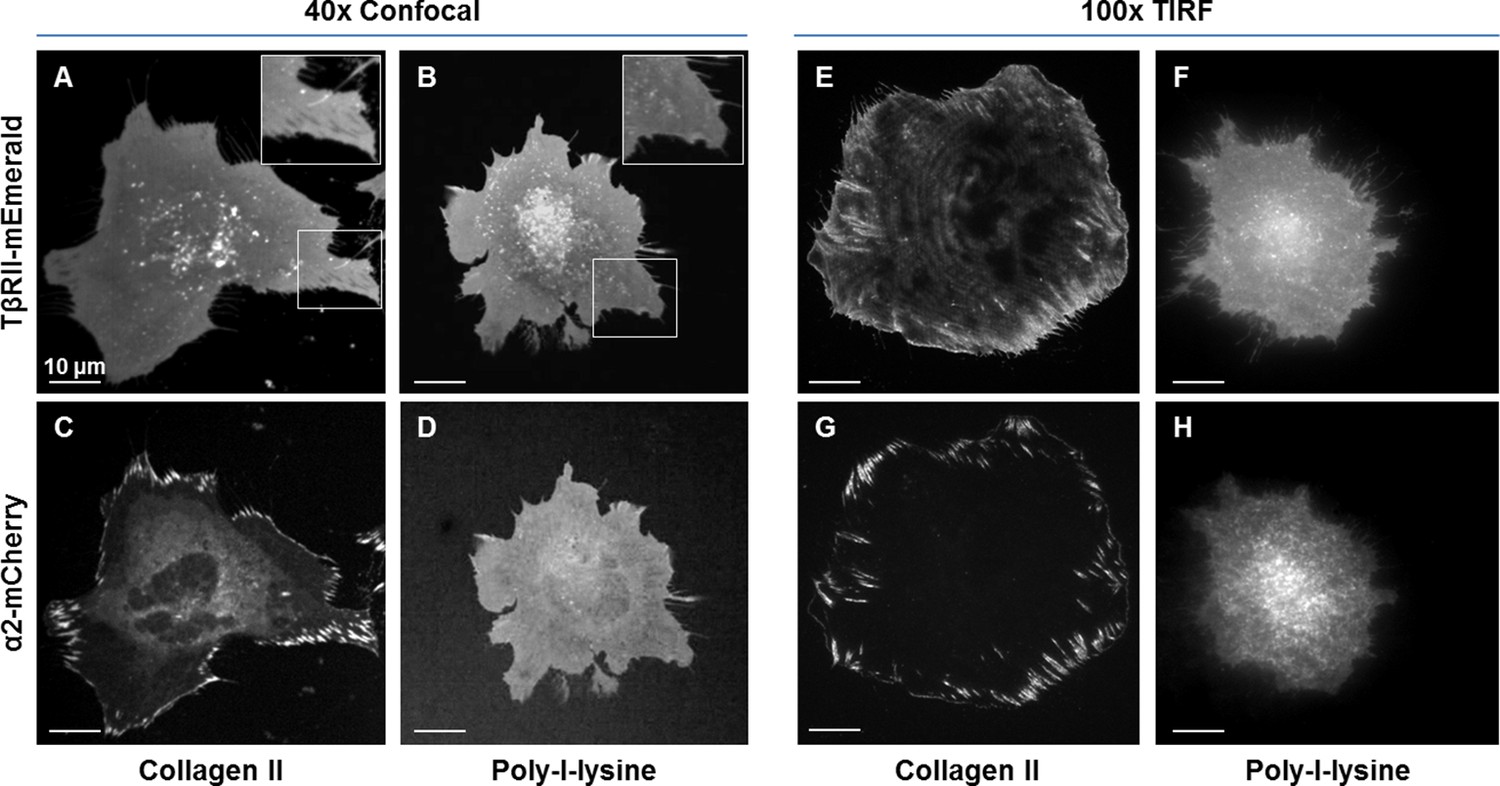
Focal adhesion formation and TβRII spatial organization are dependent on integrin activity.
TβRII spatial organization (A,B,E,F) and focal adhesion formation (C,D,G,H) are absent on poly-l-lysine (B,D,F,H) coated glass substrates relative to collagen II (A,C,E,G). Spinning disc confocal microscopy at 40x (A-D) and TIRF microscopy at 100x (E–H) of ATDC5 cells expressing TβRII-mEmerald and integrin α2-mCherry demonstrate a loss of TβRII depleted regions (A,B), TβRII peripheral ring formations (E,F), and integrin α2 developed adhesions (C,D,G,H) on poly-l-lysine relative to collagen II-coated substrates.
Figure 4
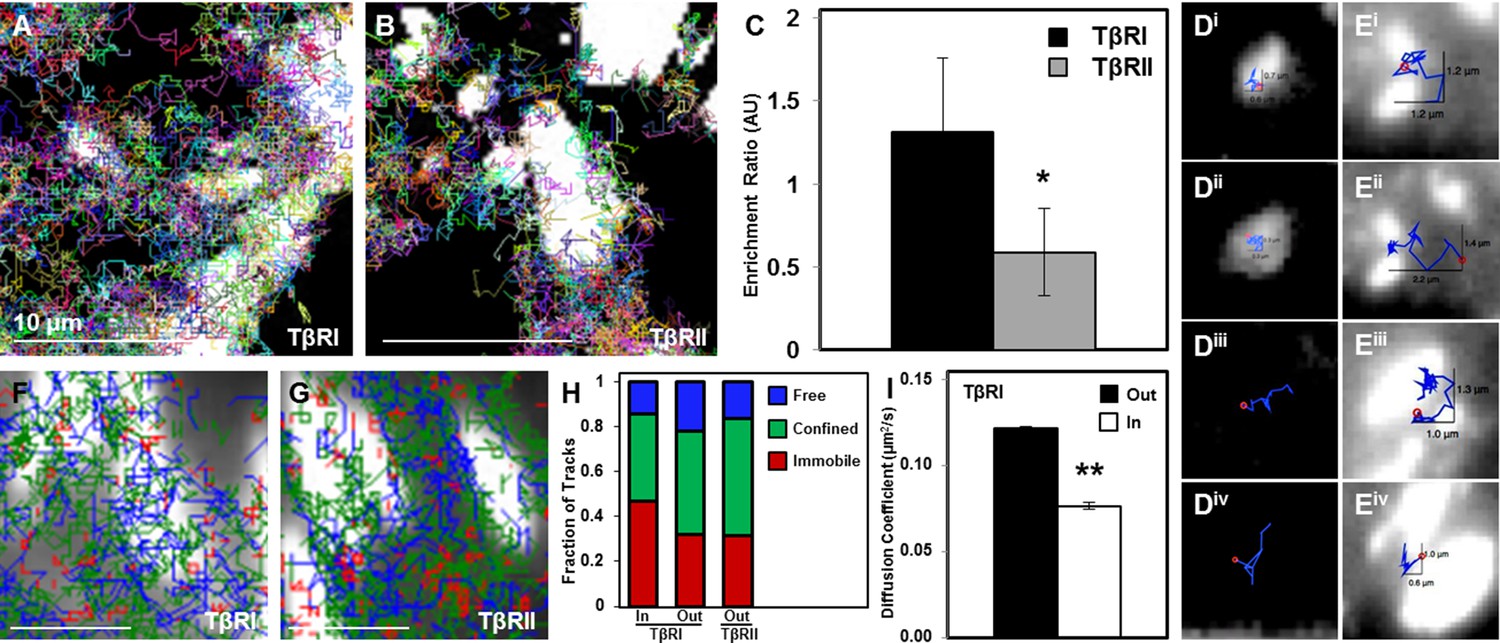
Dynamic interaction of TβRs with integrins facilitate spatial organization.
Representative trajectories for TβRI (Alk5) overlaid with the tagged focal adhesion marker vinculin are consistent with TIRF results showing a colocalization and interaction between integrin-based adhesions and TβRI (A) but not TβRII (B). Quantification of these regions shows that TβRI is preferentially enriched inside adhesions relative to outside, and that TβRII is preferentially excluded at these same sites (*p < 0.01, mean ± SD, C). Representative single molecule trajectories show sequestration of TβRI in focal adhesions (D, i-ii) and free diffusion outside adhesions (D, iii-iv), whereas TβRII bounces around the edges of focal adhesions in a freely diffusive (E, i-ii) or confined (E, iii-iv) manner. Analyzing TβR trajectories at focal adhesions based on diffusion (Red: Immobile, Green: Confined, Blue: Freely Diffusive) shows a higher density of tracks inside adhesions for TβRI (F) compared to TβRII (G), and demonstrates a higher fraction of immobile TβRI tracks inside relative to outside adhesions (H). The diffusion coefficient of TβRI trajectories decreases inside adhesions (mean ± SD, I). See Source code 1 and Figure 4—source data 1.
-
Figure 4—source data 1
Enrichment Ratio and Diffusion Coefficient
- https://doi.org/10.7554/eLife.09300.011
Figure 5
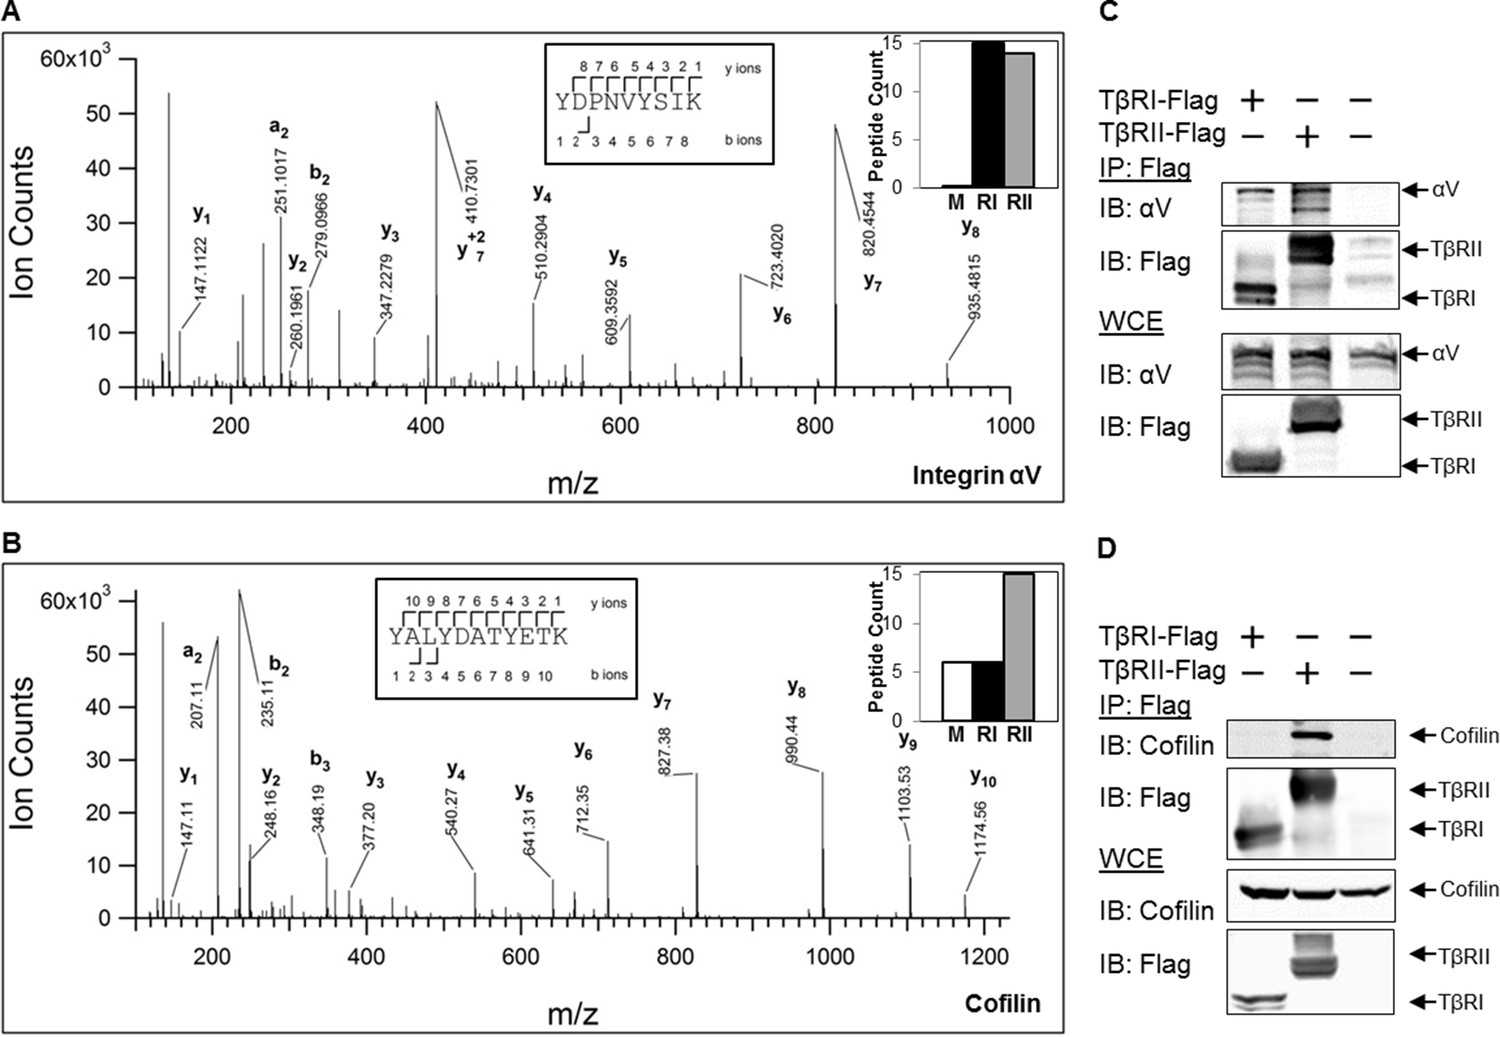
TβRs form complexes with integrin αV and cofilin.
High-energy collision dissociation–tandem mass spectra obtained from precursor ions with mass 549.7775+2 (A) and 669.3185+2 (B) found in tryptic digests of immunoaffinity pulldowns of TβRI/II, corresponding to peptides spanning residues Y153-K165 of human integrin αV (A) and Y82-K92 of human cofilin (B). b- and y- type ion series are labeled in the figure. Insets show the sequences of the peptides as well as representative peptide counts for integrin αV (A) and cofilin (B) for mock (M), TβRI (RI, Alk5), and TβRII (RII) pulldowns. Co-immunoprecipitation of Flag-tagged TβRI and TβRII demonstrate the presence of integrin αV and cofilin in these complexes (C,D).
Figure 6

Tension-sensitive regulation of TβR spatial organization.
Within 15 min of disrupting cellular tension by adding the ROCK inhibitor Y27632 (A,B) or the myosin II inhibitor blebbistatin (C,D), the peripheral ring of TβRII-mEmerald around focal adhesions (A,C) completely collapses (B,D). Colocalization quantification (Ai,Bi,Ci) demonstrates that TβRII is significantly more colocalized with integrin α2 post-treatment (Y27632, blebbistatin) relative to pre-treatment (**p < 0.001, mean ± SD, E, Figure 6—source data 1). Disruption of tension with Y27632 enhances integrin αV association with TβRI but reduces its association with TβRII (F). See Source code 2.
-
Figure 6—source data 1
Colocalization Index (vehicle and treatment)
- https://doi.org/10.7554/eLife.09300.014
Figure 7
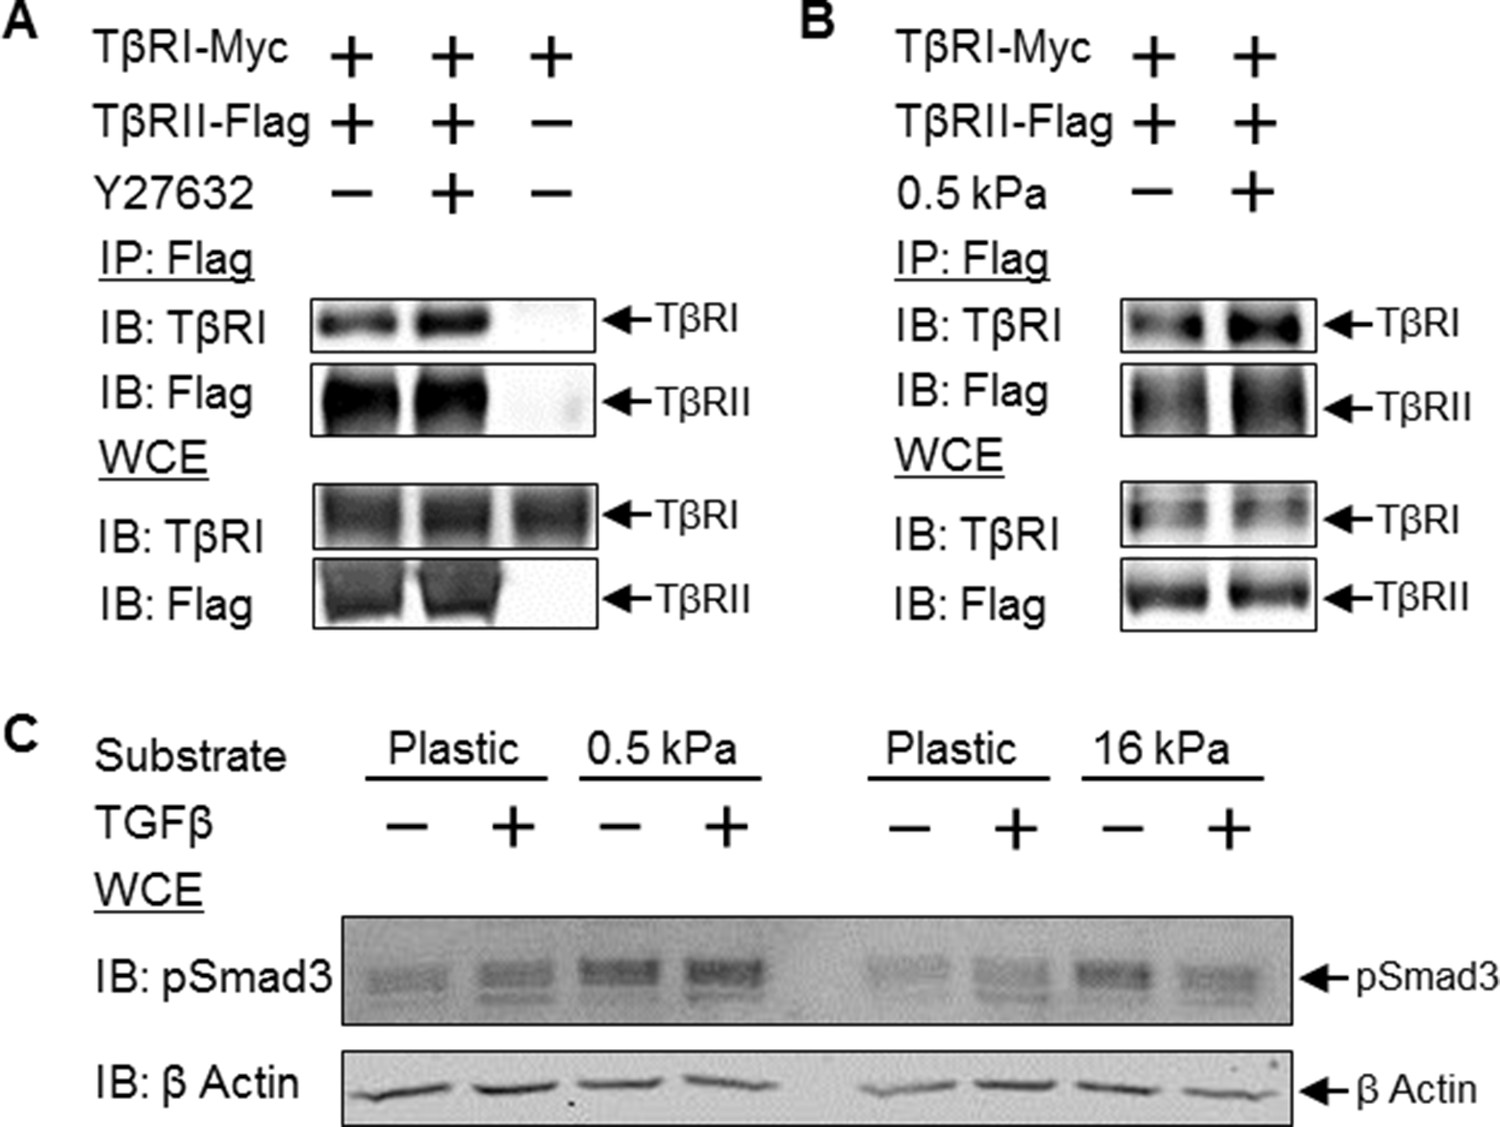
Disruption of tension-sensitive TβR segregation increases TβRI/TβRII multimerization and phosphorylation of Smad3.
ROCK inhibition releases the discrete spatial organization of TβRs at focal adhesions and drives the formation of heteromeric TβRI/TβRII complexes within 15 min of Y27632 exposure (A), as shown by Flag co-immunoprecipitation (IP) and immunoblotting (IB). Likewise, manipulation of cellular tension through culturing cells on collagen II-coated glass or 0.5 kPa PDMS substrates increases co-immunoprecipitation of TβRI with Flag-tagged TβRII (p < 0.05, B). In cells grown on collagen II-coated compliant (0.5 kPa, p < 0.05) or stiff (16 kPa) PDMS substrates, endogenous Smad3 phosphorylation is increased (C). The effect of TGFβ on Smad3 phosphorylation is substrate-dependent, such that maximal TGFβ-inducibility is observed on 0.5 kPa substrates (p < 0.05), consistent with a tension-sensitive calibration of TβR localization and activity (C). See Figure 7 – source data.
-
Figure 7—source data 1
Western Quantitative Analysis
- https://doi.org/10.7554/eLife.09300.019
Videos
Video 1
Disruption of cellular tension leads to dynamic disassembly of TβRII spatial organization at sites of adhesion (Figure 6).
TβRII-mEmerald spatial organization collapses within 15 min of adding ROCK inhibitor Y27632 in ATDC5 cells (45 min, 7 fps).
Video 2
Disruption of cellular tension leads to dynamic disassembly of TβRII spatial organization at sites of adhesion (Figure 6).
Integrin α2-mCherry adhesions disassemble within 15 min of adding ROCK inhibitor Y27632 in ATDC5 cells (45 min, 7 fps).
Video 3
Disruption of cellular tension leads to dynamic disassembly of TβRII spatial organization at sites of adhesion (Figure 6).
Composite of TβRII and integrin α2 (Video 3) demonstrate a tension-sensitive collapse of this discrete spatial organization at sites of adhesion and a reorganization at the cell periphery.
Additional files
-
Source code 1
sptPALM scripts.
- https://doi.org/10.7554/eLife.09300.020
-
Source code 2
Colocalization quantification.
- https://doi.org/10.7554/eLife.09300.021
Download links
A two-part list of links to download the article, or parts of the article, in various formats.
Downloads (link to download the article as PDF)
Open citations (links to open the citations from this article in various online reference manager services)
Cite this article (links to download the citations from this article in formats compatible with various reference manager tools)
Discrete spatial organization of TGFβ receptors couples receptor multimerization and signaling to cellular tension
eLife 4:e09300.
https://doi.org/10.7554/eLife.09300


