A glucose-starvation response regulates the diffusion of macromolecules
- University of California, Berkeley, United States
- ETH Zurich, Switzerland
- New York University School of Medicine, United States
- University of Rennes, France
Figures
Figure 1 with 2 supplements
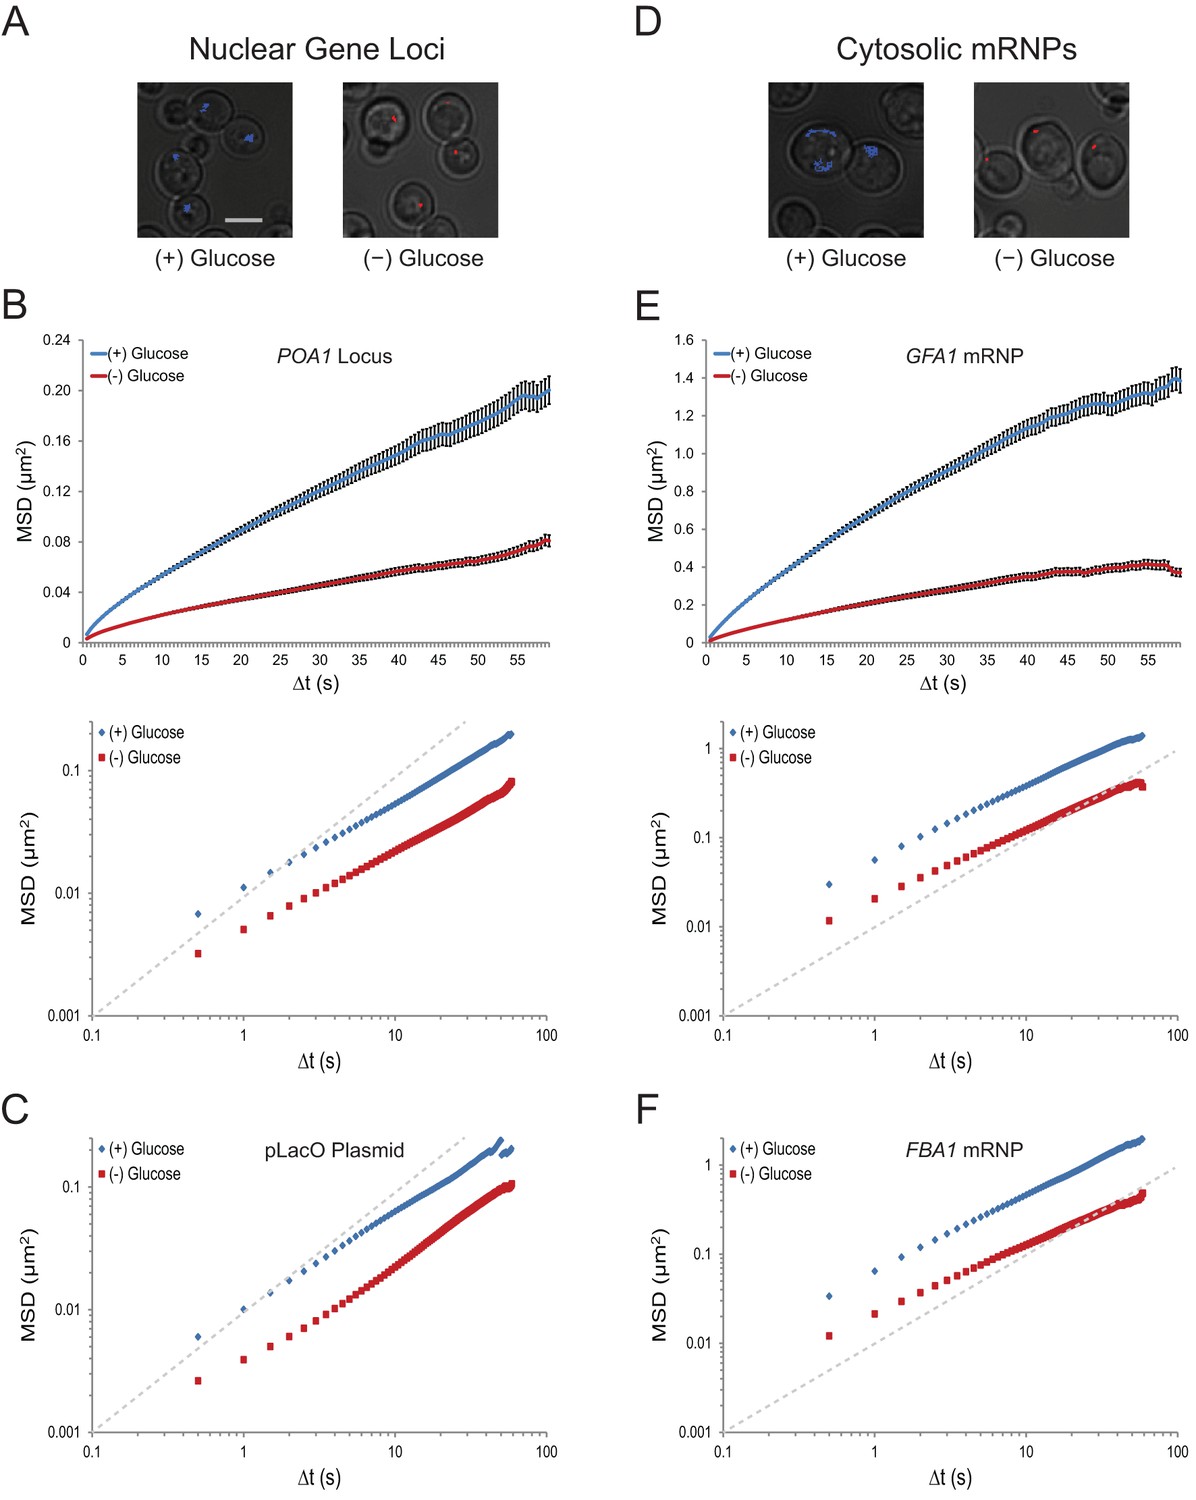
Acute glucose starvation confines macromolecular mobility in the nucleus and cytoplasm (Figure 1—figure supplement 1).
(A) Minute-long trajectories of the POA1 locus from both (+) glucose (blue) and (–) glucose (red) conditions projected on bright field images. Log-growing cells in (+) glucose were acutely starved for glucose, (–) glucose, for 30 min minutes prior to imaging. Scale bar: 4 µm. (B) Mean square displacement (MSD) curves for POA1 mobility. Upper panel: individual MSDs were averaged into an aggregate MSD for each condition. Error bars represent standard error of the mean (SEM). Lower panel: log-log MSD plot of the same data. (C) Log-log MSD plot of the pLacO plasmid during exponential growth and after acute glucose starvation. (D) Minute-long trajectories of GFA1 mRNPs from both (+) glucose (blue) and (–) glucose (red) conditions projected on bright field images. (E) Mean square displacement (MSD) curves for GFA1 mRNP mobility. Upper panel: individual MSDs were averaged into an aggregate MSD for each condition. Error bars represent SEM. Lower panel: log-log MSD plot of the same data. (F) Log-log MSD plot of the FBA1 mRNP during exponential growth and after acute glucose starvation. Dashed gray lines represent a slope of one to guide the eye.
Figure 1—figure supplement 1
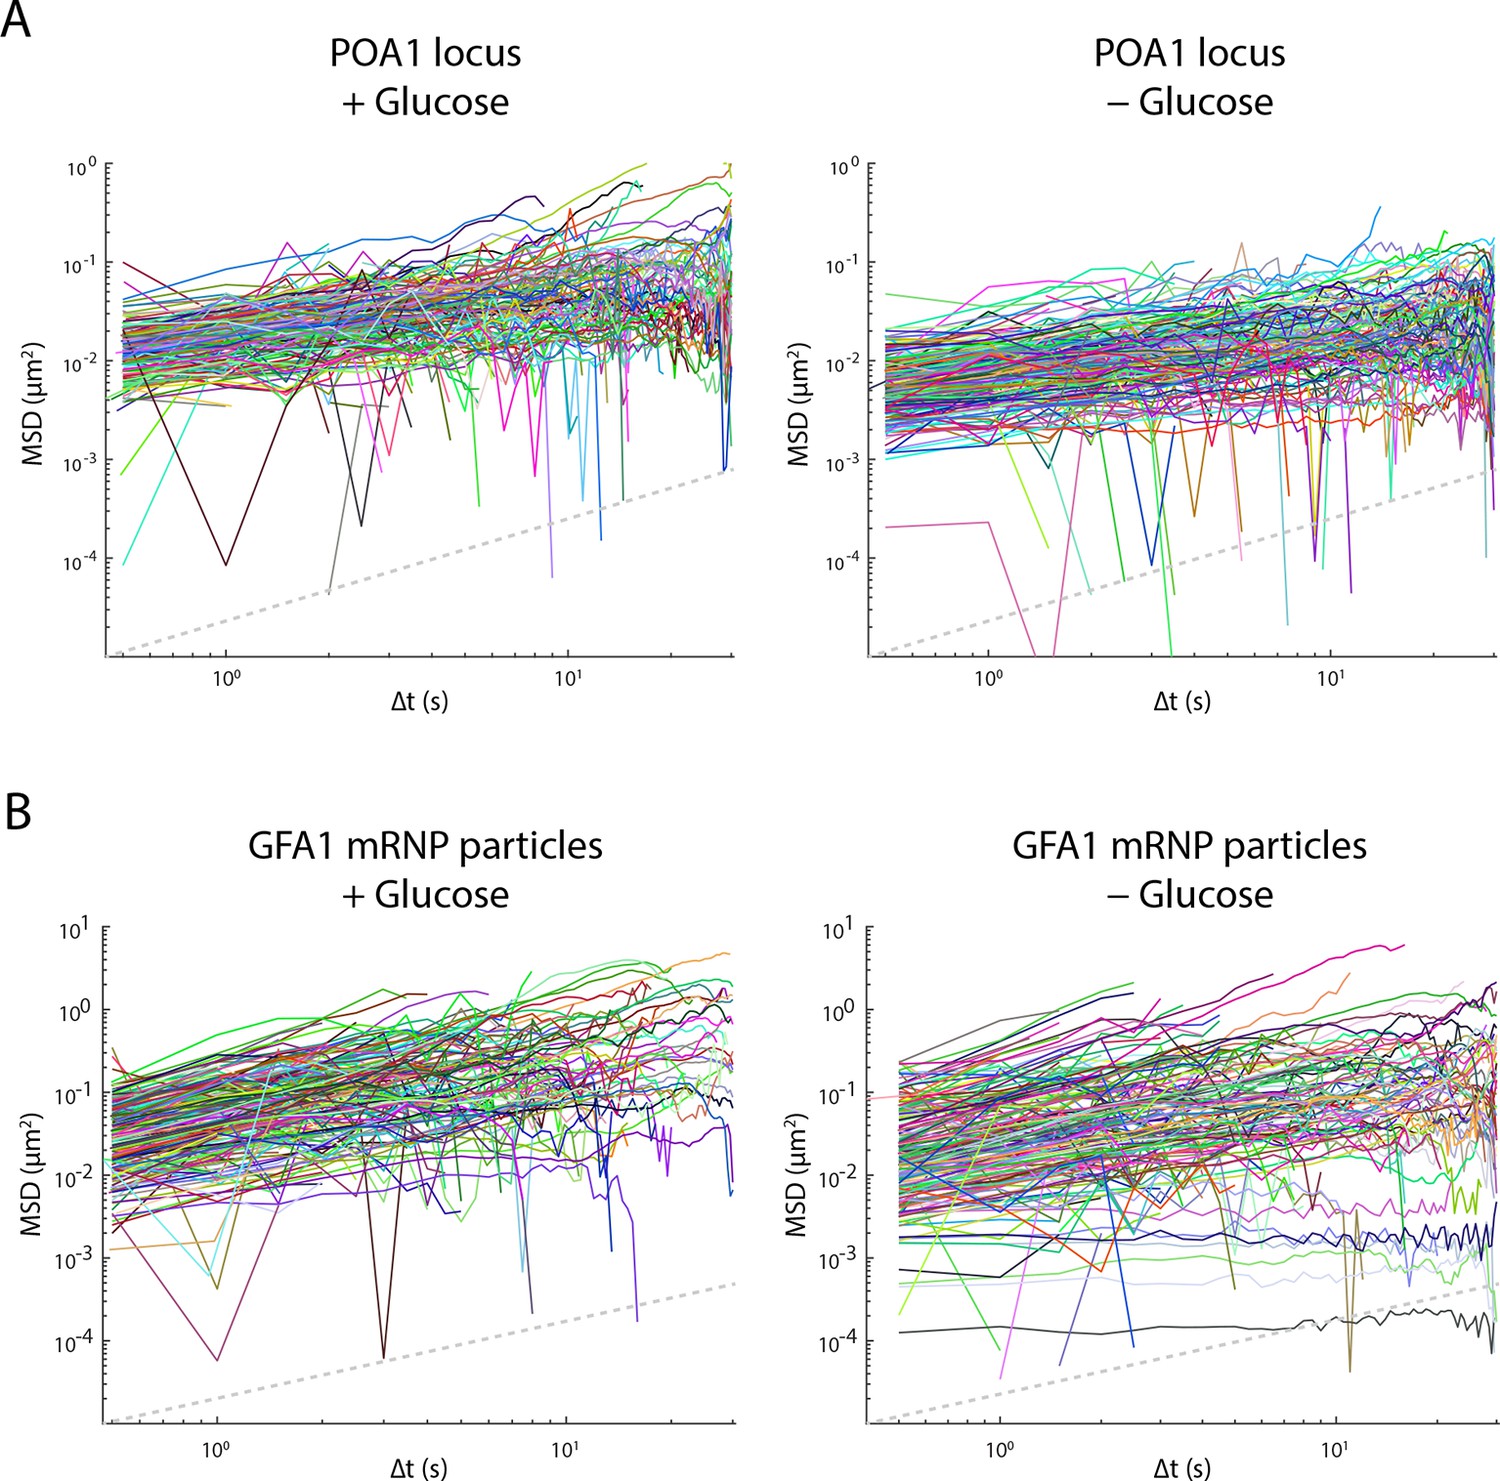
Glucose starvation affects the mobility of nuclear and cytoplasmic objects.
(A) Individual log-log MSD plots of POA1 loci in non-starved (left) and starved (right) cells. (B) Individual log-log MSD plots of GFA1 mRNP particles in non-starved (left) and starved (right) cells. Dashed gray lines represent a slope of one to guide the eye.
Figure 1—figure supplement 2
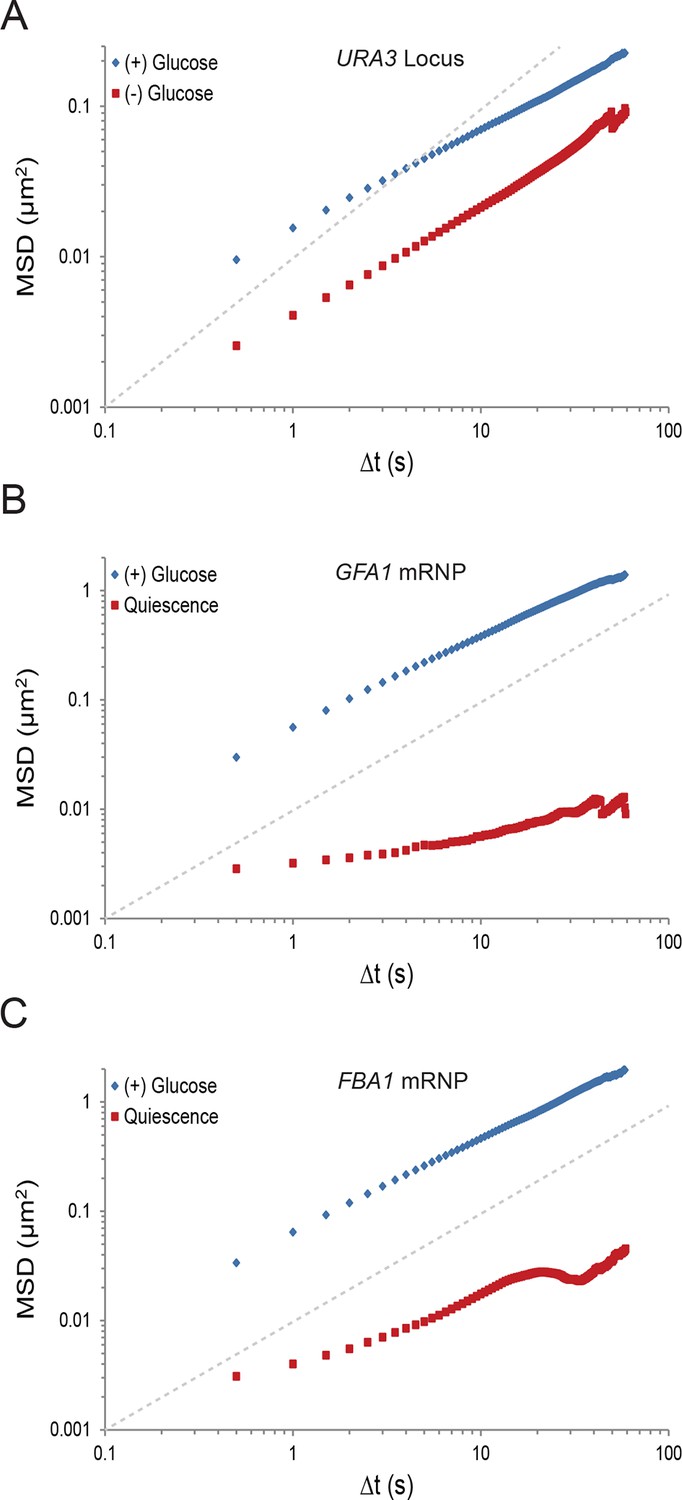
Starvation confines macromolecular mobility.
(A) Log-log MSD plot of the URA3 locus during exponential growth and after acute starvation. (B) Log-log MSD plot of the GFA1 mRNP during exponential growth and quiescence (see 'Materials and methods'). (C) Log-log MSD plot of the FBA1 mRNP mobility during exponential growth and quiescence. Dashed gray lines represent a slope of one to guide the eye.
Figure 2 with 1 supplement
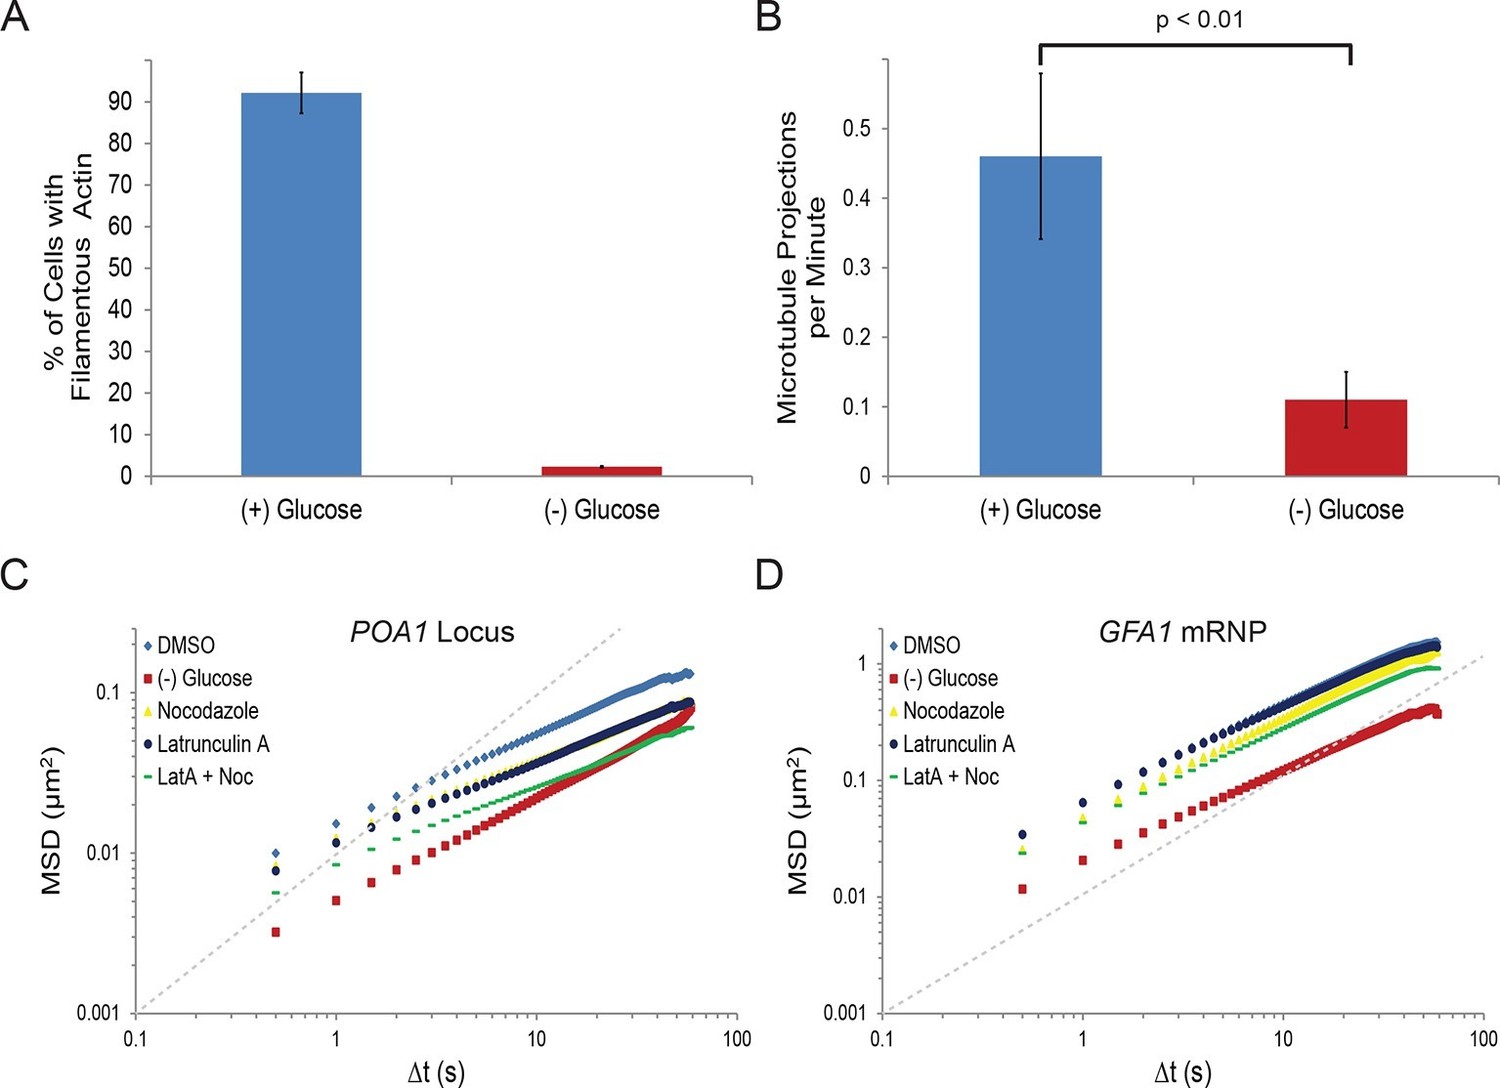
Starvation confines both cytoskeleton-independent macromolecular mobility and mobility influenced by the cytoskeleton (Figure 2—figure supplement 1).
(A) Quantification of filamentous actin during logarithmic growth, (+) glucose, and after acute starvation, (–) glucose. Cells were fixed and stained with phalloidin. Z-stack projections were then processed and cells were classified based on the presence or absence of filamentous actin. Error bars are standard error for three biological replicates (n = 406–709 cells per replicate). (B) Average number of microtubule projections per G1 cell during logarithmic growth, (+) glucose, and after acute starvation, (–) glucose. Error bars are standard deviation (SD) of the mean from three biological replicates (n = 10–1510-15 cells per replicate). The p-value for a two-tailed t-test for unpaired values assuming equal variance is shown. (C) Log-log MSD plot of the POA1 locus after treatment with nocodazole and/or latrunculin-A (LatA) for 20 min prior to imaging. (D) Log-log MSD plot of the GFA1 mRNP after treatment as described in (C). Dashed gray lines represent a slope of one to guide the eye.
Figure 2—figure supplement 1
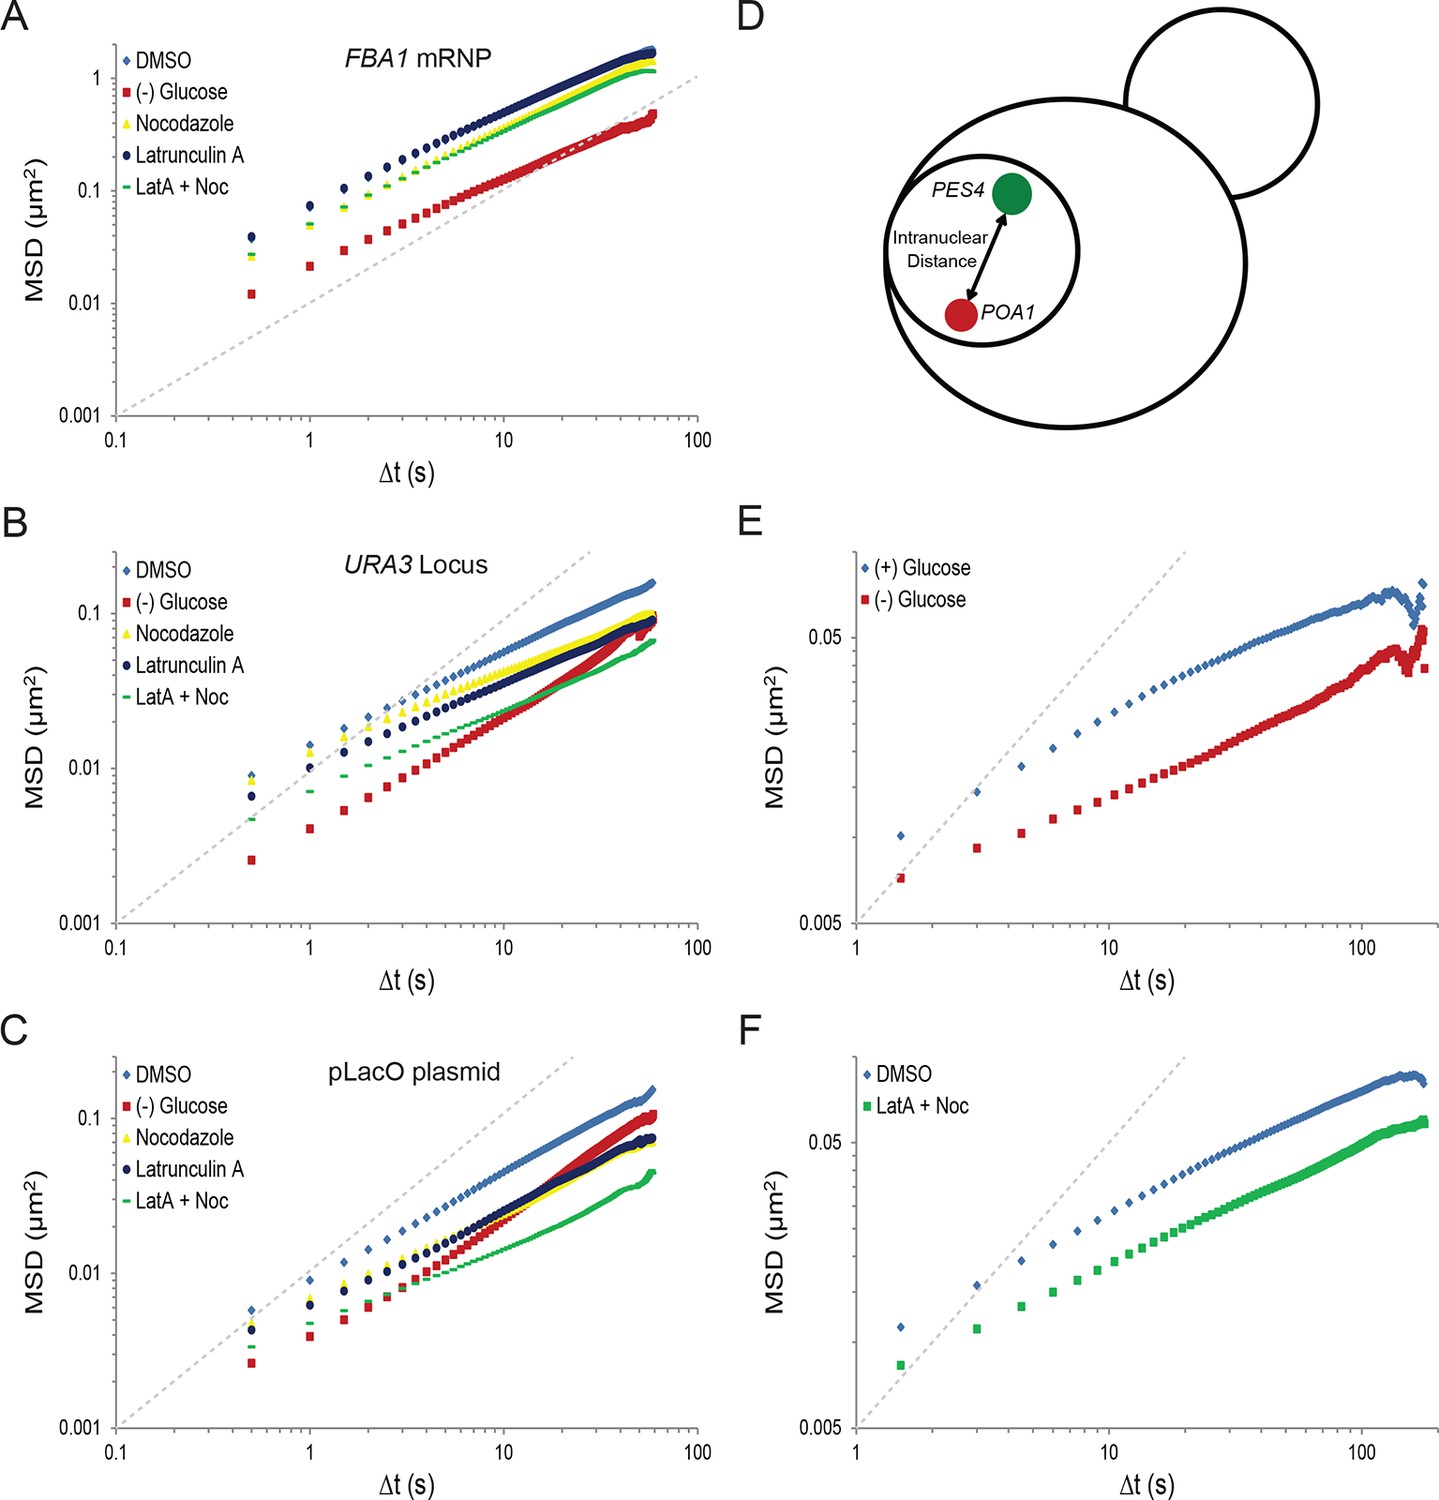
Starvation confines the cytoskeleton-independent mobility of mRNPs and the cytoskeleton-influenced mobility of chromatin.
(A) Log-log MSD plot of the FBA1 mRNP after treatment as described in Figure 2C. (B) Log-log MSD plot of the URA3 locus after treatment as described in Figure 2C. (C) Log-log MSD plot of the pLacO plasmid after treatment as described in Figure 2C. (D) Graphic depicting the quantification of intranuclear displacements between the PES4 locus (green) and the POA1 locus (red). (E) Log-log interchromosomal MSDs quantifying the displacement between POA1 and PES4 during logarithmic growth, (+) glucose, and after acute starvation, (–) glucose. Images were acquired every 1.5 s for a total of 150 s, and the intranuclear displacements between the POA1 locus and the PES4 locus were tracked over time by determining the absolute distance between the two loci. (F) Log-log interchromosomal MSDs quantifying the displacement between POA1 and PES4 after inhibition of the cytoskeleton (nocodazole + LatA) and in a DMSO-treated control. Cells were treated as described in Figure 2C and imaged as in (E). Dashed gray lines represent a slope of one to guide the eye.
Figure 3 with 1 supplement
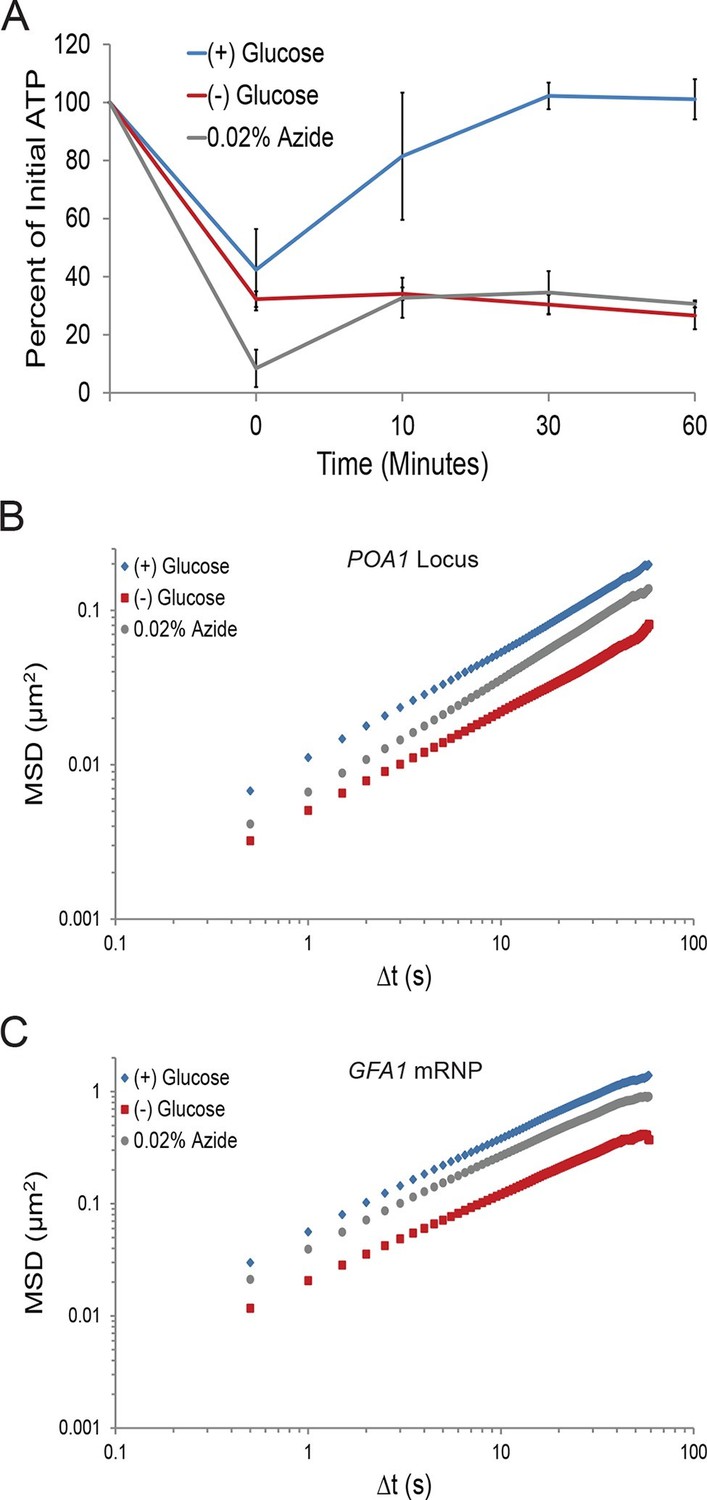
A ~70% reduction of intracellular ATP is insufficient to replicate the macromolecular confinement of glucose starvation (Figure 3—figure supplement 1).
(A) Intracellular ATP concentrations of acutely glucose-starved yeast were back-diluted into media containing 2% dextrose (n = 2 experiments), 2% dextrose + 0.02% azide (n = 2 experiments), or maintained in (–) glucose media (n = 3 experiments). Intracellular ATP concentrations were determined using a luciferase-based ATP assay (Ashe et al., 2000) and normalized to pre-treatment levels. The zero min time point was taken immediately after back-dilution into the described media. Error bars represent SD. (B) Log-log MSD plot of the POA1 locus. Cells were treated with azide as described in (A). The azide treatment fails to replicate the confinement of glucose-starved cells from Figure 1B. (C) Log-log MSD plot of the GFA1 mRNP. Cells were treated with azide as described in (A). The azide treatment fails to replicate the confinement of glucose-starved cells from Figure 1E.
Figure 3—figure supplement 1
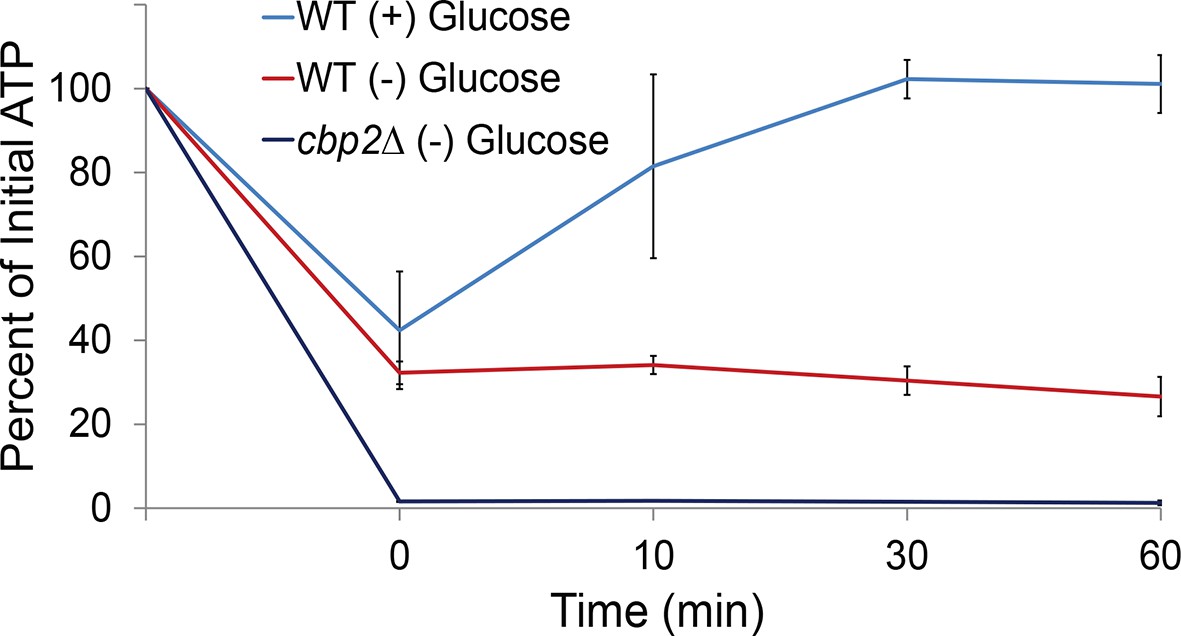
Respiration maintains intracellular ATP concentrations after acute glucose starvation.
Log-growing wild-type (WT) and cbp2∆ yeast cells were acutely starved for glucose and back-diluted into media containing 2% dextrose (WT) or maintained in (–) glucose media. Intracellular ATP concentrations were determined as in Figure 3A. The zero minute time point was taken immediately after back-dilution into the described media. Error bars represent SD (n = 2 experiments).
Figure 4 with 2 supplements
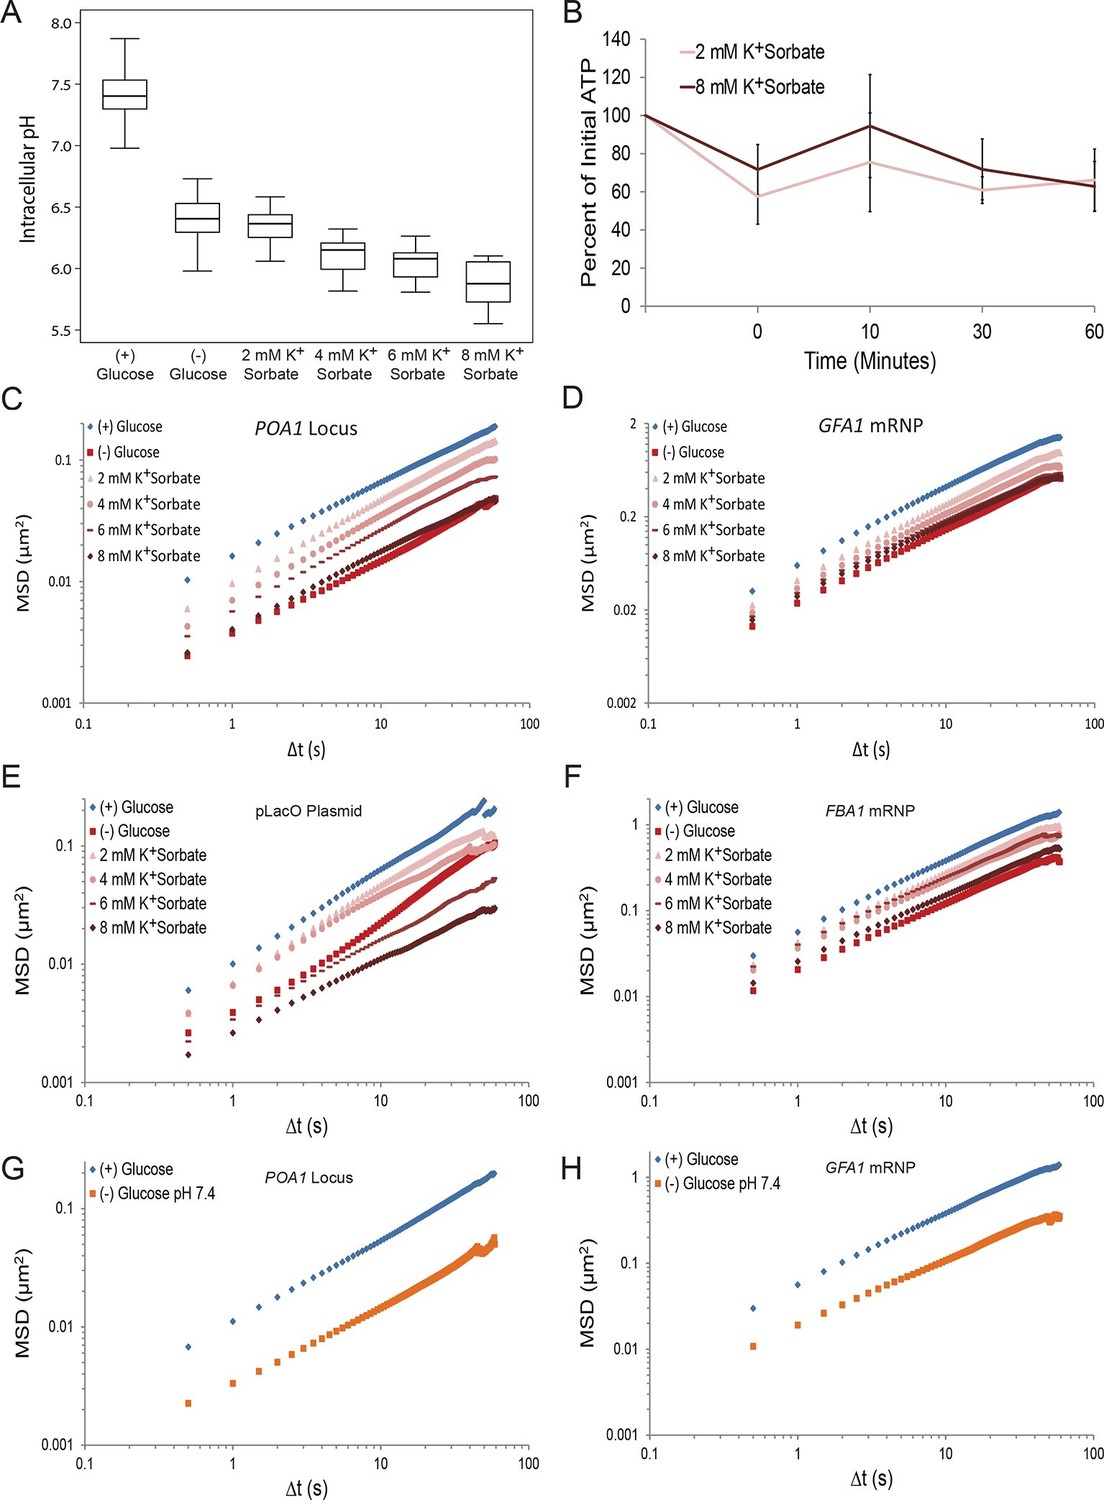
A drop in intracellular pH (pHi) can reduce macromolecular mobility but cannot explain the confinement observed in glucose-starved cells (Figure 4—figure supplements 1 and 2).
(A) Boxplots of the pHi of cells acutely starved for glucose or treated with varying concentrations of potassium sorbate (K+Sorbate). Log-growing yeast cells expressing phluorin (Miesenböck et al., 1998) were acutely starved of glucose or treated with K+Sorbate for 30 min before ratiometric imaging. Intracellular pH was then estimated from a calibration curve (see 'Materials and methods'; Figure 4—figure supplement 1). Values from three biological replicates were pooled and compiled into boxplots. Whiskers represent the minimum and maximum respectively. (B) Intracellular ATP concentrations after treatment with either 2 mM or 8 mM K+Sorbate. Intracellular ATP concentrations were determined as in Figure 3A. The zero minute time point was taken immediately after each treatment. Error bars represent SD (n =2). (C) Log-log MSD plot of the POA1 locus after treatment with K+Sorbate as described in (A). (D) Log-log MSD plot of the GFA1 mRNP after treatment as described in (A). E) Log-log MSD plot of the pLacO plasmid after treatment as described in (A). (F) Log-log MSD plot of the FBA1 mRNP after treatment as described in (A). (G) Log-log MSD plot of the POA1 locus after acute glucose starvation into starvation media (SC) adjusted to pH 7.4. (H) Log-log MSD plot of the GFA1 mRNP after treatment as described in (G).
Figure 4—figure supplement 1
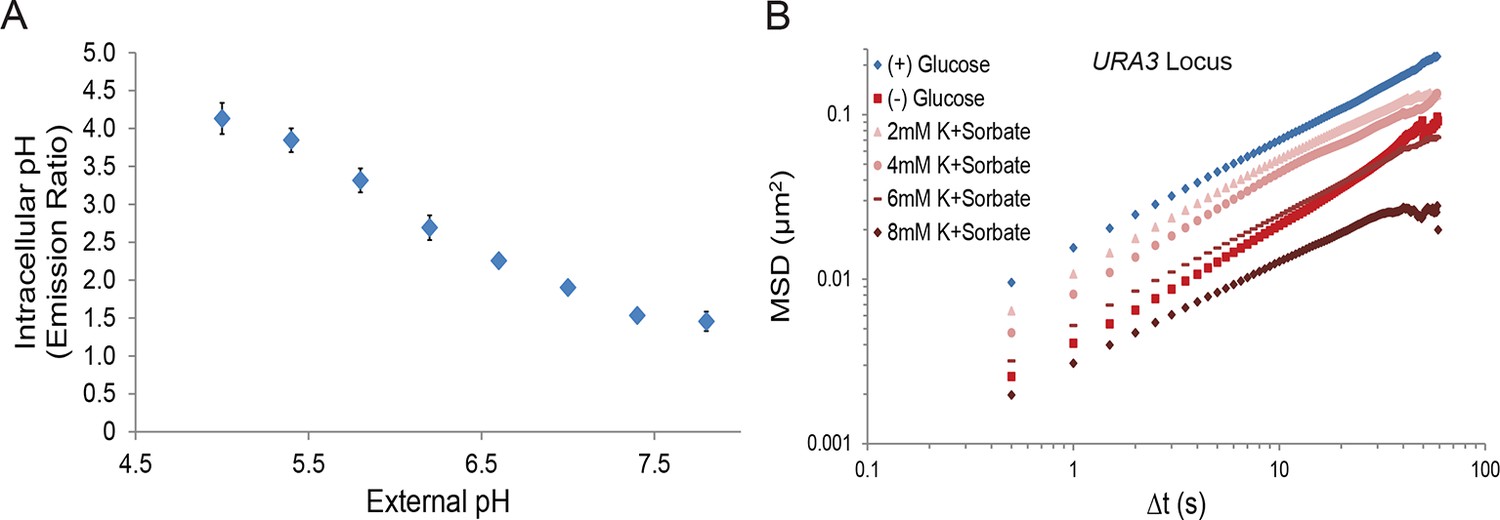
A drop in intracellular pH (pHi) titrates macromolecular mobility.
(A) Intracellular pH calibration curve (Orij et al., 2009) (see 'Materials and methods'). Error bars represent SD. (B) Log-log MSD plot of the URA3 locus. Cells were treated as described in Figure 4A.
Figure 4—figure supplement 2
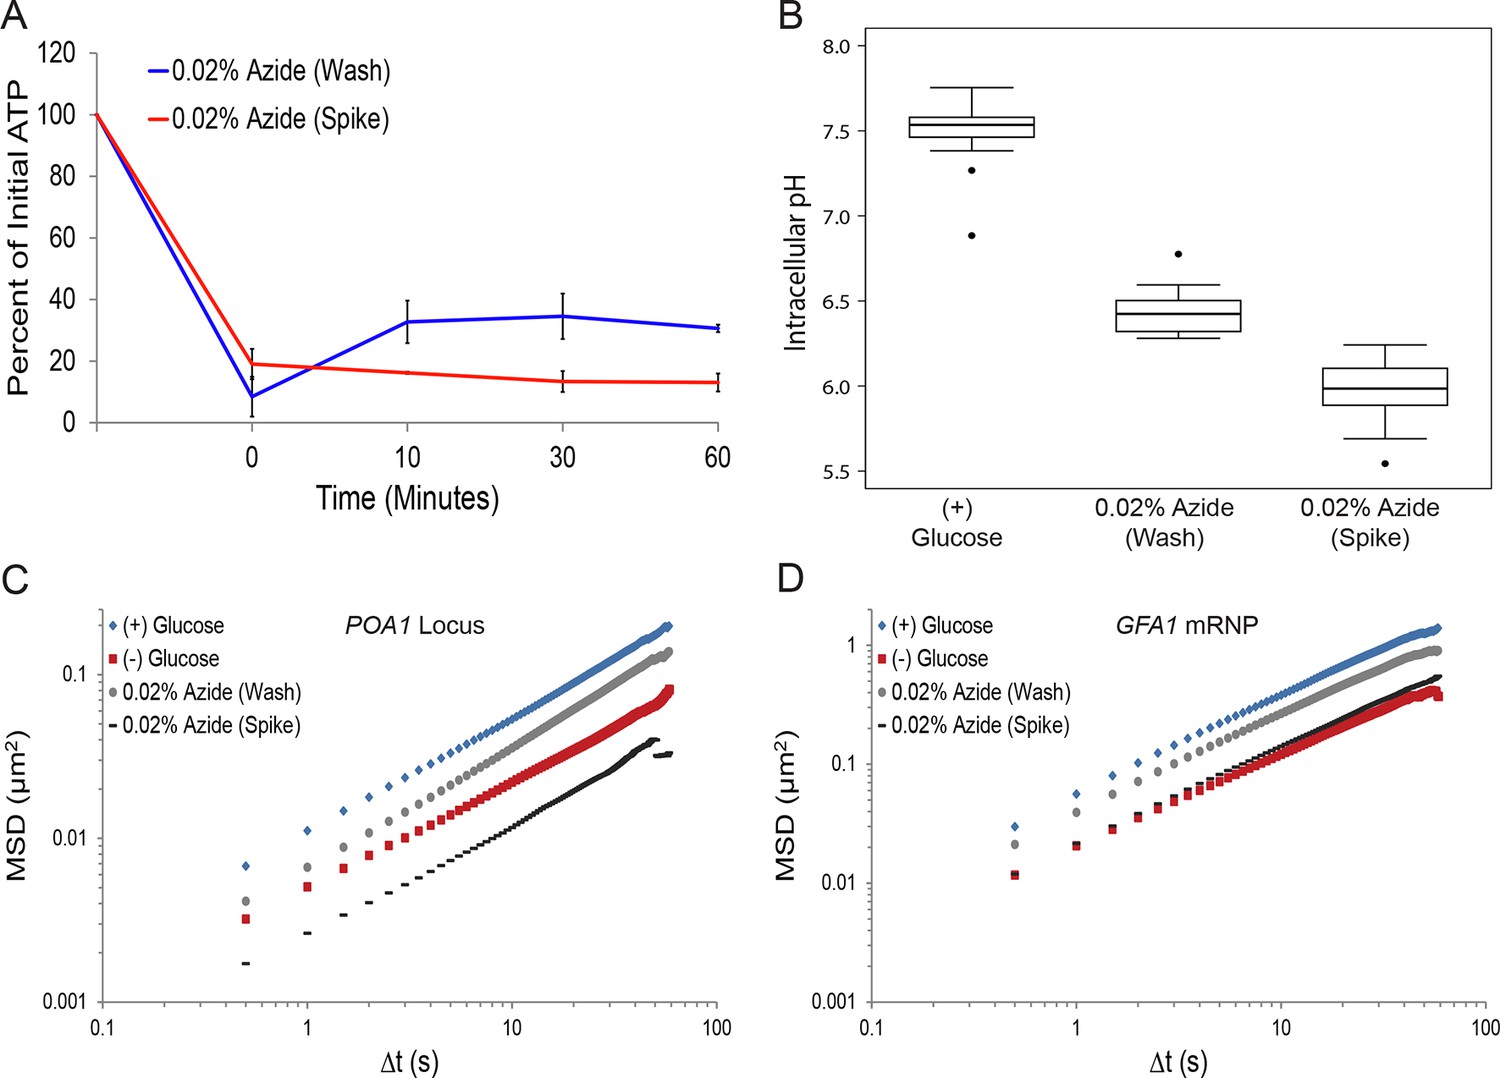
Sodium azide induces a pleiotropic reduction in intracellular pH, which may explain the subsequent confinement of macromolecular mobility.
(A) Intracellular ATP concentrations after differing treatments with 0.02% sodium azide (‘wash’ versus ‘spike’) (see 'Materials and methods'). Intracellular ATP concentrations were determined as in Figure 3A. The zero minute time point was taken immediately after each treatment. Error bars represent SD (n = 2 experiments). (B) Boxplots of the intracellular pH of cells treated as in (A). Log-growing cells were treated as described with sodium azide for 30 min before ratiometric imaging. Values from three biological replicates were pooled and compiled into boxplots. Whiskers represent the minimum and maximum respectively. Outliers (black circles) are defined as points further from the quartile-box than 1.5 times the length of the quartile-box. (C) Log-log MSD plot of the POA1 locus after each treatment described in (A) overlaid from Figure 1B. (D) Log-log MSD plot of the GFA1 mRNP after each treatment described in (A) overlaid from Figure 1E.
Figure 5 with 2 supplements
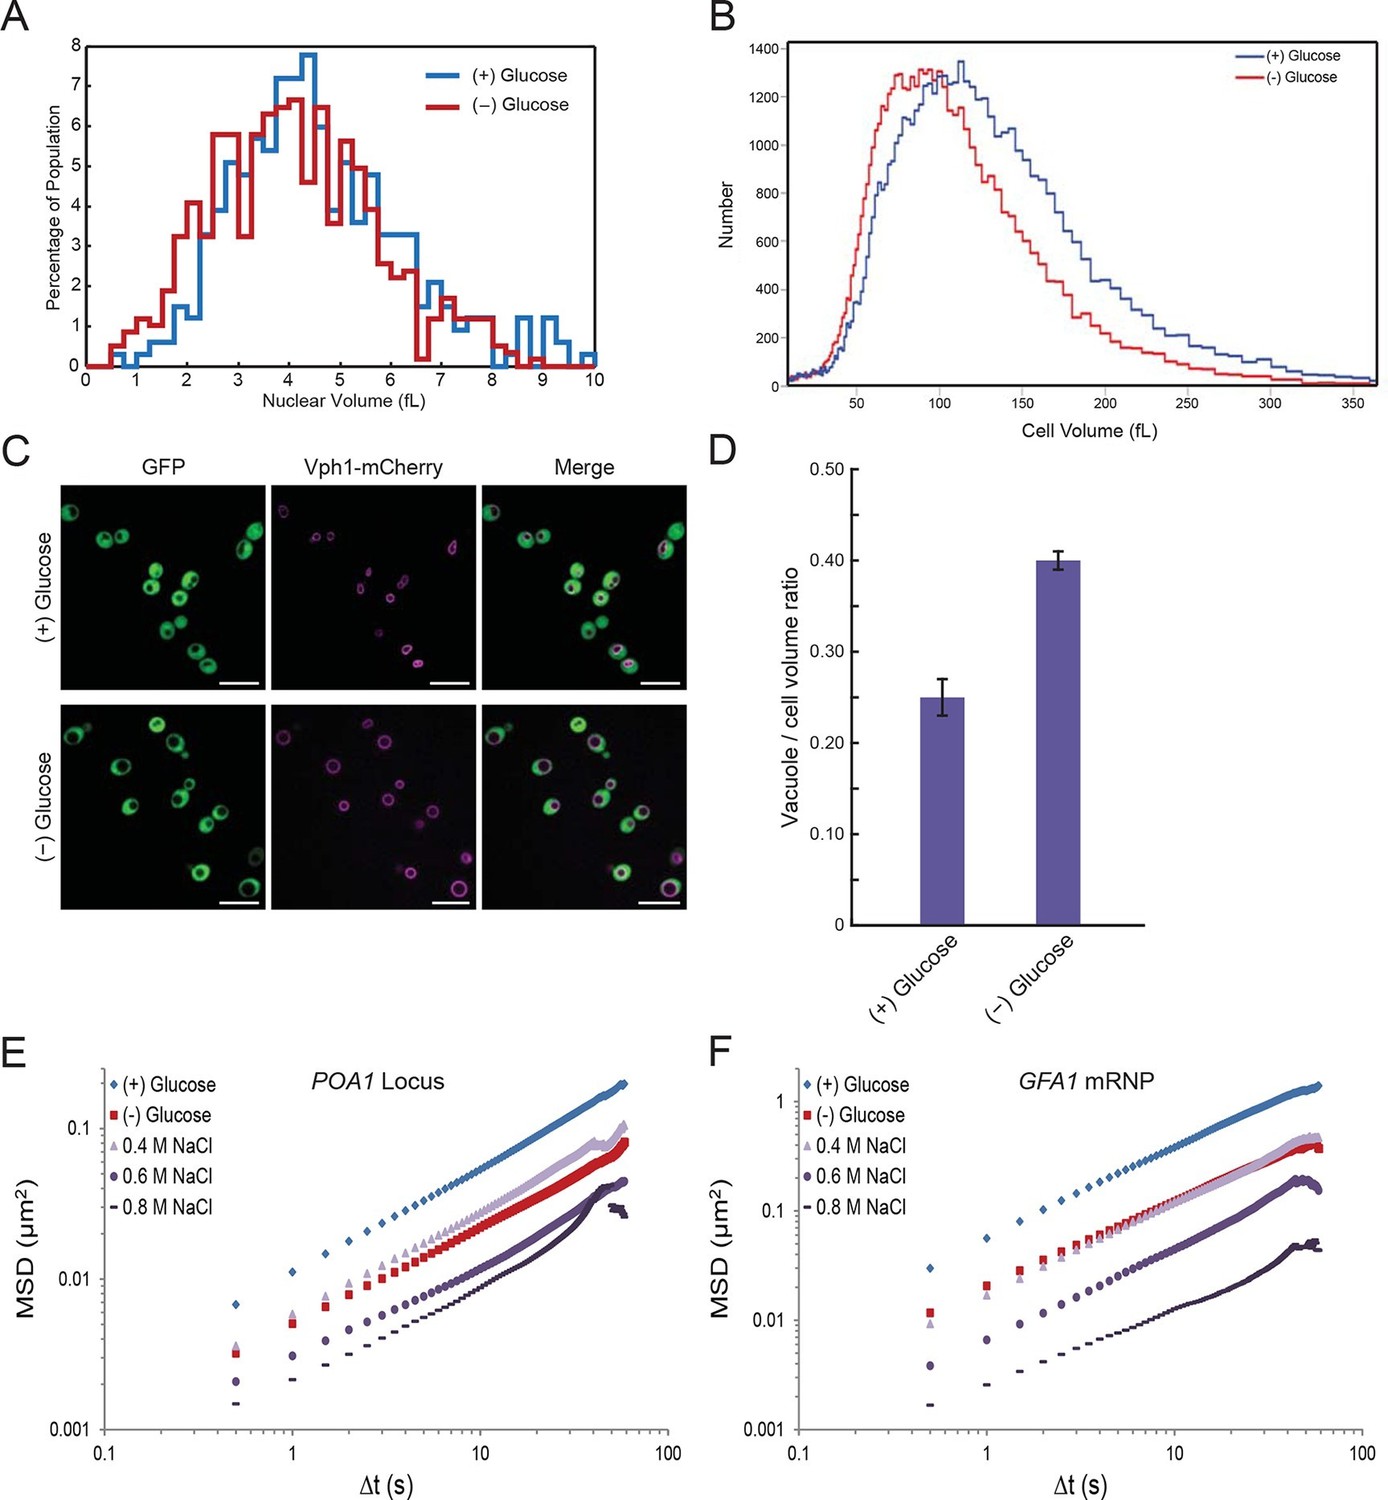
Starvation induces a constriction in cell size and an expansion in vacuolar volume (Figure 5—figure supplements 1 and 2).
(A) Nuclear volume after acute glucose starvation. Histograms of nuclear volumes measured by reconstruction from three-dimensional image stacks using Imaris. The p-value resulting from a two-tailed t-test on the average volume in each condition (unpaired values assuming equal variance) is p<0.001. (B) Histograms of cell volumes of log-growing and acutely starved yeast cells. Log-growing cells, (+) glucose, were acutely starved of glucose, (–) glucose, and cell volume was measured using a Beckman Coulter Multisizer 3 (see 'Materials and methods'). Approximately 50,000 cells were measured for each condition. (C) Cytoplasmic free GFP (green) and vacuolar membrane protein Vph1-mCherry (magenta) fluorescence images. Scale bar: 10 μm. (D) Quantification of vacuole-to-cell volume ratio. Error bars represent standard errors about the mean (N = 3 independent experiments with > 55 cells per experiment). (E) Log-log MSD plot of the POA1 locus after treatment with increasing concentrations of NaCl. Cells were imaged approximately 10 min after hyperosmotic shock. (F) Log-log MSD plot of the GFA1 mRNP after treatment as described in (E).
Figure 5—figure supplement 1
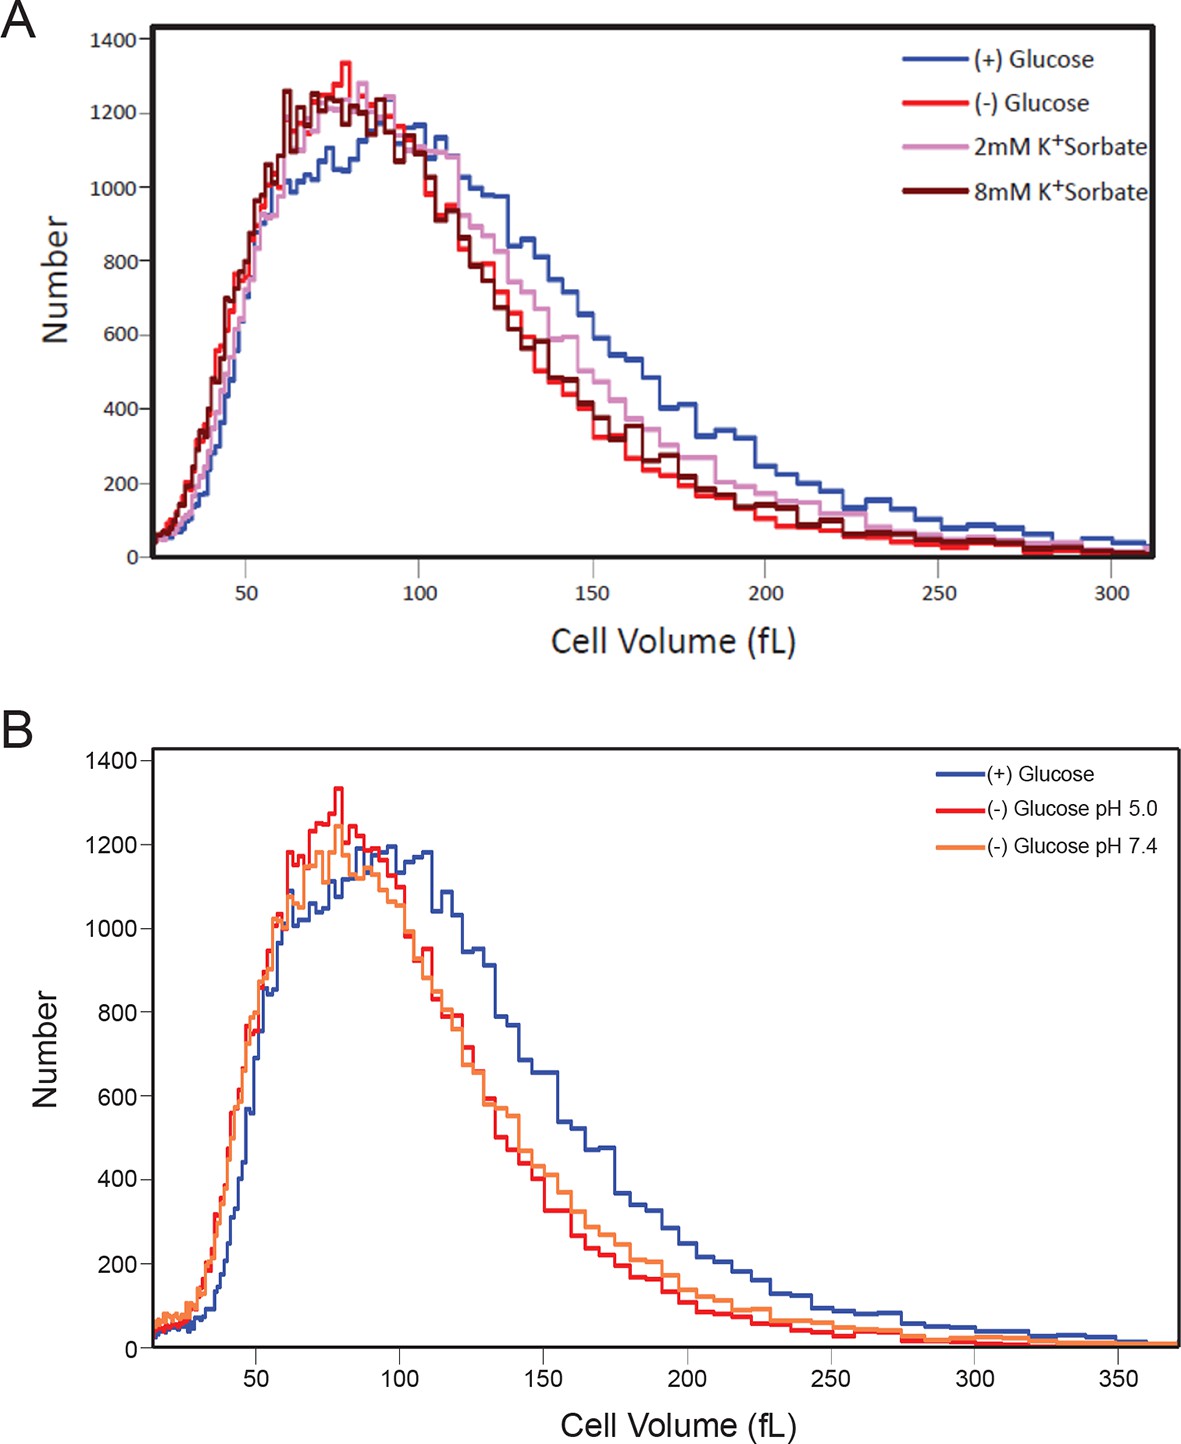
Histograms of cell volumes after various treatments.
(A) Cells were treated with K+Sorbate as in Figure 4 and cell volume measured as in Figure 5B. (B) Cells were starved of glucose in either low or high pH (5.0 or 7.4) and cell volume was measured.
Figure 5—figure supplement 2

Hyperosmotic shock increasingly confines macromolecular mobility without affecting intracellular ATP concentrations or intracellular pH.
(A) Intracellular ATP concentrations after treatment with either 0.4 M or 0.8 M NaCl. Cells were treated as described in Figure 5E and intracellular ATP concentrations were determined as in Figure 3A. The zero minute time point was taken immediately after each treatment. Error bars represent SD (n = 2 experiments). (B) Boxplots of intracellular pH after hyposmotic shock as described in Figure 5E. Cells were treated with hyperosmotic shock media for 10 min before ratiometric imaging. Values from two biological replicates were pooled and compiled into boxplots. Whiskers represent the minimum and maximum respectively. Outliers (black circles) are defined as points further from the quartile-box than 1.5 times the length of the quartile-box. (C) Log-log MSD plot of the pLacO plasmid. Cells were treated as described in Figure 5E. (D) Log-log MSD plot of the FBA1 mRNP. Cells were treated as described in Figure 5E.
Figure 6 with 2 supplements
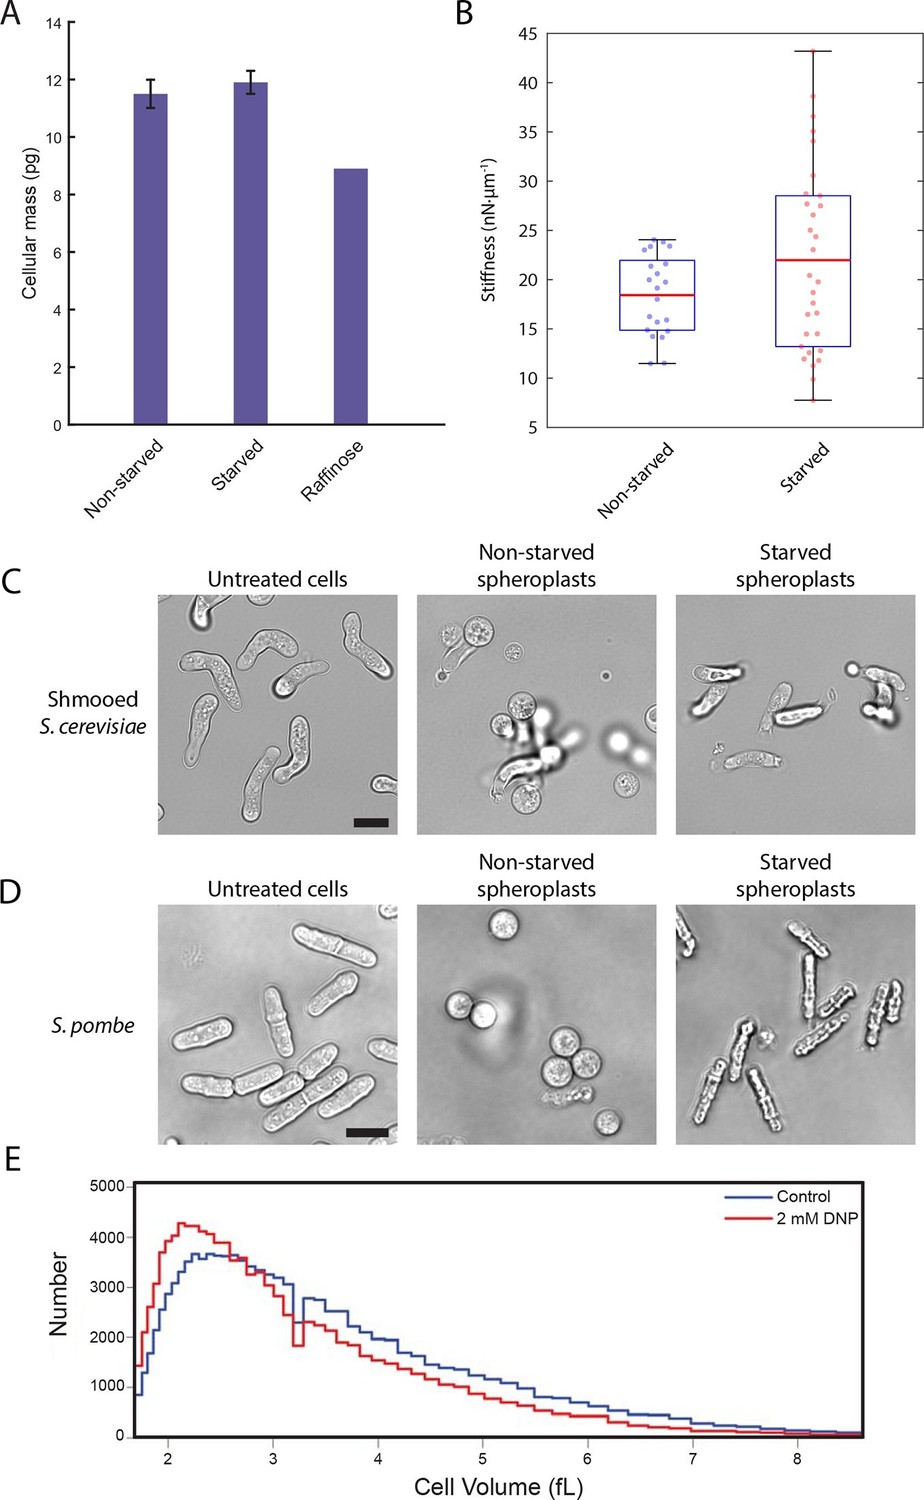
A conserved glucose starvation response alters the mechanical properties of the cytoplasm (Figure 6—figure supplements 1 and 2).
(A) Dry mass measurements of non-starved and starved yeast. Yeast cells in normal glucose, glucose deprivation, and raffinose growth conditions were lyophilized, and their cellular dry masses were determined. Error bars represent standard deviations about the mean (N = 3 independent experiments for non-starved and starved conditions; N = 1 for raffinose growth condition). (B) AFM experiments measure a mean stiffness increase from 18 to 22 nN·μm-1 for non-starved and starved cells, respectively, along with an increase in cell-to-cell variability (Kolmogorov-Smirnov test, p = 0.013). Box plot: red line represents the mean, blue lines represent the 1st and 3rd quartiles, and whiskers represent the minimum and maximum values. Each data point represents the mean value of eight measurement cycles on a single cell (see 'Materials and methods'). (C) Mating pheromone-treated budding yeast cells (shmoos) remain elongated after starvation. Shmooed budding yeast cells prior to spheroplasting (left), non-starved shmooed spheroplasts (center), and starved shmooed spheroplasts (right). Scale bar: 10 μm. (D) Fission yeast cells remain elongated after starvation. Fission yeast cells prior to spheroplasting (left), non-starved spheroplasts (center), and starved spheroplasts (right). Scale bar: 10 μm. Spheroplasting efficiency in the experiments described in (B), (C), and (D) was equally efficient in starved and non-starved cells and assessed via lysis in water. (E) Histograms of cell volumes of log-growing wildtype E. coli after 30 min of treatment with 2 mM DNP or the solvent control (EtOH). Approximately 100,000 cells were measured in each condition using a Beckman Coulter Multisizer 3.
Figure 6—figure supplement 1
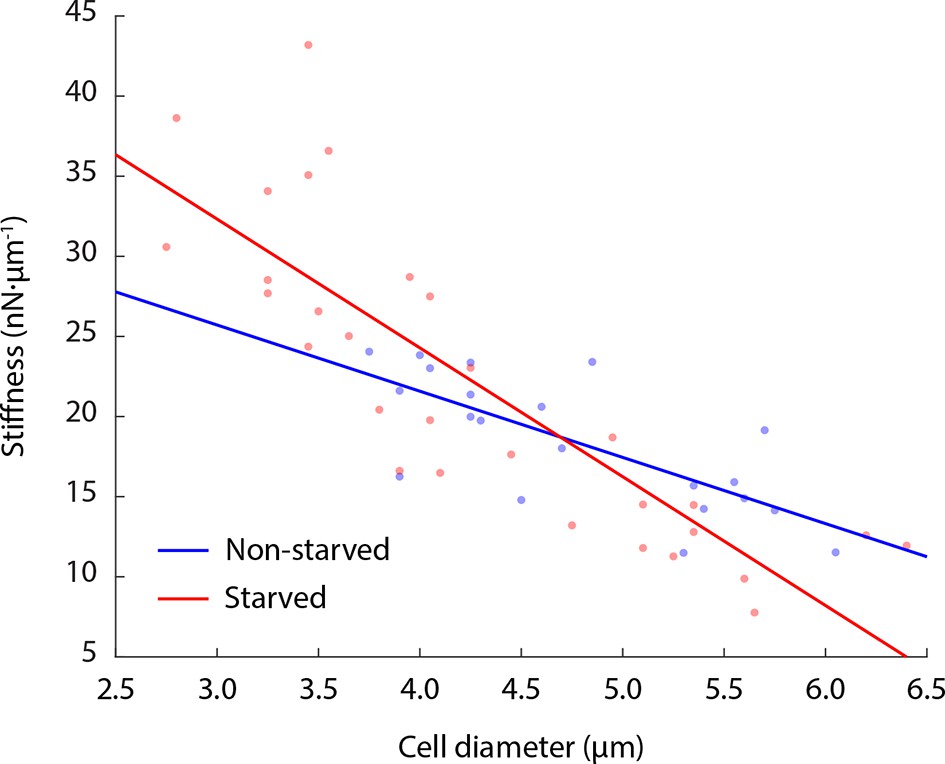
Cell stiffness negatively correlates with cell size.
Both glucose-starved and non-starved budding yeast cells show an anti-correlation of cell stiffness with cell diameter. Linear fitting R2 value for non-starved cell data = 0.54; R2 value for starved cell data = 0.71. Each data point represents the mean value of eight measurement cycles on a single cell (see 'Materials and methods').
Figure 6—figure supplement 2
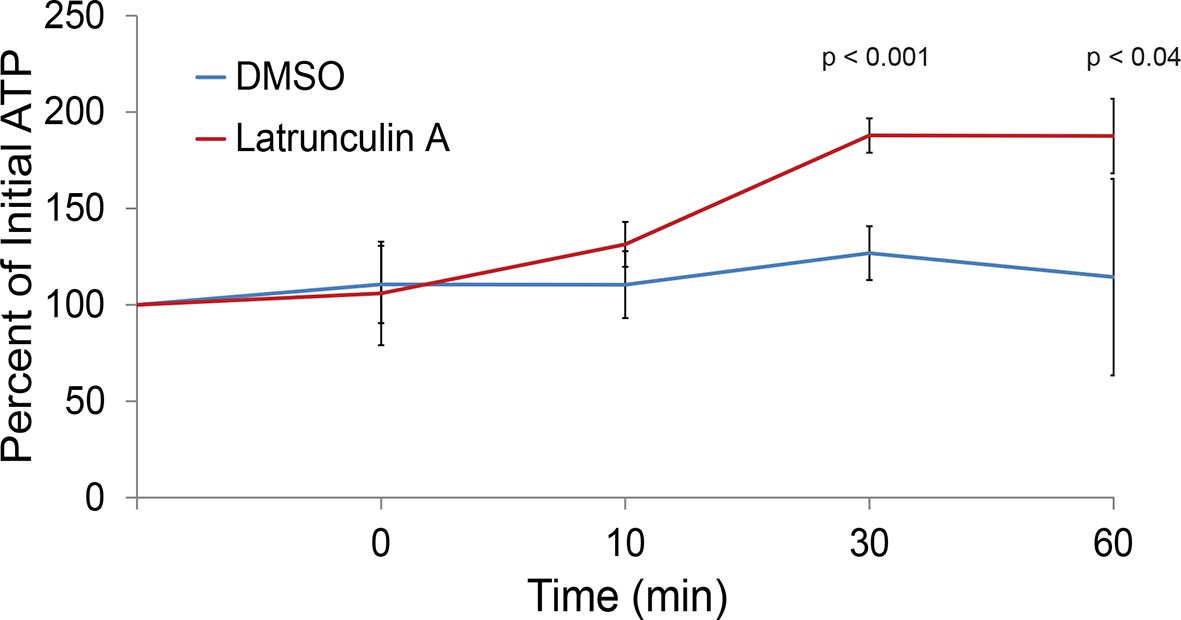
The actin cytoskeleton is a major consumer of intracellular ATP.
Intracellular ATP concentrations of log-growing yeast were determined as in Figure 3A after treatment with latrunculin A or the solvent control DMSO. The zero minute time point was taken immediately after each treatment. Error bars represent SD from four biological replicates. p-Values shown are for a two-tailed t-test for unpaired values assuming equal variance.
Author response image 1
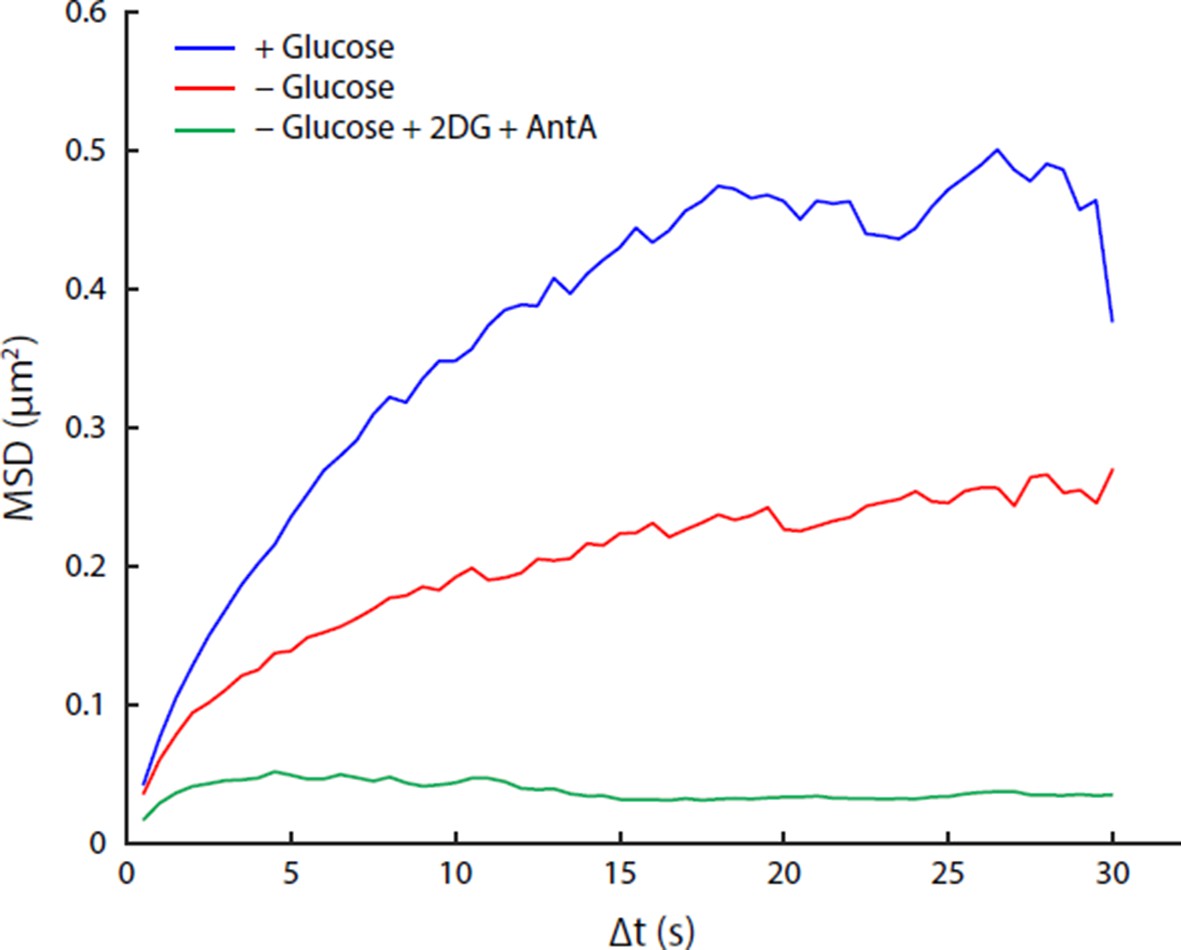
Comparison of acute glucose starvation and 2-deoxyglucose/antimycin A treatments.
(A) MSD curves for GFA1 mRNP particles in non-starved cells (blue), cells acutely starved of glucose (red), and cells acutely starved of glucose additionally treated with 20 mM 2-deoxyglucose (2DG) and 10 µM antimycin A (AntA) (green). (B) Fluorescence intensity histograms for GFA1 mRNP particles in non-starved (blue), acutely starved (red), and 2DG/AntA-treated cells (green).
Videos
Video 1
Spheroplasted budding yeast shmoos.
https://doi.org/10.7554/eLife.09376.020
Video 2
Spheroplasted starved budding yeast shmoos.
https://doi.org/10.7554/eLife.09376.021
Video 3
Re-addition of glucose to spheroplasted starved budding yeast shmoos.
https://doi.org/10.7554/eLife.09376.022
Video 4
Spheroplasted fission yeast.
https://doi.org/10.7554/eLife.09376.023
Video 5
Spheroplasted starved fission yeast.
https://doi.org/10.7554/eLife.09376.024
Video 6
Re-addition of glucose to spheroplasted starved fission yeast.
https://doi.org/10.7554/eLife.09376.025Tables
Table 1
Effective diffusion coefficients (K; µm2/s) and anomalous diffusion exponents (α) for macromolecules in each condition.
| Condition | POA1 Locus | pLacO Plasmid | URA3 Locus | GFA1 mRNP | FBA1 mRNP | |||||
|---|---|---|---|---|---|---|---|---|---|---|
| K | α | K | α | K | α | K | α | K | α | |
| (+) Glucose | 0.0057 | 0.69 | 0.0067 | 0.78 | 0.0076 | 0.65 | 0.0420 | 0.83 | 0.0501 | 0.85 |
| (-) Glucose | 0.0023 | 0.64 | 0.0021 | 0.80 | 0.0022 | 0.73 | 0.0131 | 0.77 | 0.0139 | 0.77 |
| (-) Glucose pH 7.4 | 0.0015 | 0.65 | -- | -- | -- | -- | 0.0120 | 0.75 | -- | -- |
| DMSO | 0.0059 | 0.56 | 0.0046 | 0.70 | 0.0060 | 0.61 | 0.0491 | 0.83 | 0.0541 | 0.83 |
| Nocodazole | 0.0040 | 0.48 | 0.0025 | 0.57 | 0.0046 | 0.51 | 0.0364 | 0.85 | 0.0397 | 0.85 |
| Latrunculin A | 0.0038 | 0.50 | 0.0024 | 0.63 | 0.0038 | 0.55 | 0.0476 | 0.82 | 0.0550 | 0.81 |
| Nocodazole + LatA | 0.0028 | 0.48 | 0.0014 | 0.49 | 0.0026 | 0.52 | 0.0303 | 0.81 | 0.0367 | 0.82 |
| 2 mM K+Sorbate | 0.0056 | 0.73 | 0.0051 | 0.80 | 0.0059 | 0.68 | 0.0402 | 0.82 | 0.0296 | 0.80 |
| 4 mM K+Sorbate | 0.0050 | 0.75 | 0.0044 | 0.72 | 0.0048 | 0.71 | 0.0406 | 0.78 | 0.0242 | 0.79 |
| 6 mM K+Sorbate | 0.0039 | 0.70 | 0.0018 | 0.66 | 0.0027 | 0.66 | 0.0378 | 0.76 | 0.0270 | 0.78 |
| 8 mM K+Sorbate | 0.0023 | 0.64 | 0.0012 | 0.61 | 0.0014 | 0.61 | 0.0340 | 0.76 | 0.0164 | 0.77 |
| 0.4 M NaCl | 0.0030 | 0.69 | 0.0026 | 0.75 | -- | -- | 0.0129 | 0.83 | 0.0146 | 0.85 |
| 0.6 M NaCl | 0.0012 | 0.60 | 0.0011 | 0.58 | -- | -- | 0.0047 | 0.83 | 0.0057 | 0.84 |
| 0.8 M NaCl | 0.0009 | 0.63 | 0.0011 | 0.63 | -- | -- | 0.0013 | 0.67 | 0.0016 | 0.77 |
| Quiescence | -- | -- | -- | -- | -- | -- | 0.0004 | 0.29 | 0.0015 | 0.68 |
| 0.02% Azide (Wash) | 0.0037 | 0.74 | -- | -- | -- | -- | 0.0293 | 0.82 | -- | -- |
| 0.02% Azide (Spike) | 0.0012 | 0.67 | -- | -- | -- | -- | 0.0155 | 0.81 | -- | -- |
Table 2
Yeast strains used in this study.
| Strain | Genotype | Source |
|---|---|---|
| KWY165 | W303; MATa ura3-1 leu2-3 his3-11,15 trp1-1 ade2-1 | This Study |
| KWY1622 | W303; MATα ybr022w::256LacO::LEU2 his3::LacI-GFP::HIS3 trp1::dsRED-HDEL::TRP1 | Green et al., 2012 |
| KWY3541 | KWY 1622, cbp2∆::KANMX | This Study |
| KWY3538 | W303; MATα his3::LacI-GFP::HIS3 trp1::dsRED-HDEL::TRP1 256LacO::URA3 | This Study |
| KWY2848 | W303; MATα his3::LacI-GFP::HIS3 trp1::dsRED-HDEL::TRP1 yel021w::128LacO::URA3 | This Study |
| KWY4586 | W303; MATa ybr022w::112TetO::URA3 yfr023w::256LacO::LEU2 his3::LacI-GFP_TetR-3XmCherry::HIS3 | This Study |
| KWY970 | KWY 165, ura3::pHIS-GFP-TUB1::URA3 | This Study |
| KWY3661 | W303; MATa pHluorin::URA3 | This Study |
| KWY4796 | W303; MATα trp1::dsRED-HDEL::TRP1 leu2::TetR-GFP::LEU2 | This Study |
| KWY4736 | W303 MATa/S288c MATα NDC1/ndc1::NDC1-tdTomato::KANMX GFA1/gfa1::GFA1-24PP7 3xYFP-PP7-CFP::HIS3 | This Study |
| KWY4737 | W303 MATa/S288c MATα NDC1/ndc1::NDC1-tdTomato::KANMX FBA1/fba1::FBA1-24PP7 3xYFP-PP7-CFP::HIS3 | This Study |
| KWY5112 | W303; MATa ura3-1 leu2-3 his3-11,15 trp1-1 ade2-1 VPH1::VPH1-mCherry::KANMX leu2::GFP::CaURA3 | This Study |
| KWY6241 | CAF13 (S. pombe wildtype) | This Study |
| yYB5978 | S288c; MATa his3∆1 leu2∆0 ura3∆0 met15∆0 LYS2 ADE2 TRP1 bar1::kanMX | Caudron and Barral, 2013 |
Table 3
Plasmids used in this study.
| Plasmid | Description | Source |
|---|---|---|
| pKW2734 | pHMX-256LacO (CEN, URA3) | This Study |
| pKW2957 | pYES2-PACT1-pHluorin (CEN, URA3) | Orij et al., 2009 |
| pKW544 | MET25pro-PP7-CP-3xYFP (CEN, HIS3) | This Study |
Download links
A two-part list of links to download the article, or parts of the article, in various formats.
Downloads (link to download the article as PDF)
Open citations (links to open the citations from this article in various online reference manager services)
Cite this article (links to download the citations from this article in formats compatible with various reference manager tools)
A glucose-starvation response regulates the diffusion of macromolecules
eLife 5:e09376.
https://doi.org/10.7554/eLife.09376


