A mitotic kinase scaffold depleted in testicular seminomas impacts spindle orientation in germ line stem cells
- Howard Hughes Medical Institute, University of Washington, United States
- State University of New York Upstate Medical University, United States
- Roswell Park Cancer Institute, United States
- University of Washington, United States
Figures
Figure 1 with 1 supplement

Loss of Gravin correlates with perturbed mitosis in human seminomas and mouse seminiferous tubules.
(A) Immunoblot analysis of tissue lysates from resected seminomas (lanes 2, 4, and 6) and normal adjacent tissue (lanes 1, 3, and 5). Proteins were identified using antibodies against (top) Gravin, (upper-mid) Aurora A, (lower-mid) Plk1, and (bottom) GAPDH loading control. (B) Quantification of immunoblot data (A) by densitometry (n = 3 ± SEM). (C, D) Representative testis sections from (C) a 30-year-old individual and (D) a 26-year-old seminoma patient. Immunofluorescent staining shows Gravin (green), p-H3B (red), and DNA (DAPI, blue). Scale bar, 40 μm. (E, F) Magnified insets from C and D are included. Scale bar, 40 μm. (G) Gravin signal intensity per mitotic cell was quantified from normal and seminoma sections of testis (p-H3B positive, n-values are indicated, ***p < 0.001). The number of cells used in each analysis is indicated. (H) The mitotic index was calculated for (normal; n = 4) and (seminoma; n = 6) tissue sections by determining the percentage of pH3B-positive cells. (*p < 0.05). (I, J) Related experiments were conducted on testis sections from 7-week-old wild-type (I), and Gravin knockout (J) mice. Immunostaining with antibodies against Par3 (green), p-H3B (red), and DAPI (blue) is presented. Scale bar, 40 μm. (K) Calculation of the mitotic index in testis sections from wild-type (gray) and Gravin knockout (orange) mice. The number of tissue sections measured is indicated below each column (*p < 0.05). (L) TUNEL staining was used to monitor apoptosis in seminiferous tubule sections from wild-type (gray) and Gravin knockout (orange) mice. Data are presented as TUNEL-positive cells per seminiferous tubule. The number of sections is depicted below each column. (**p = 0.01).
Figure 1—figure supplement 1
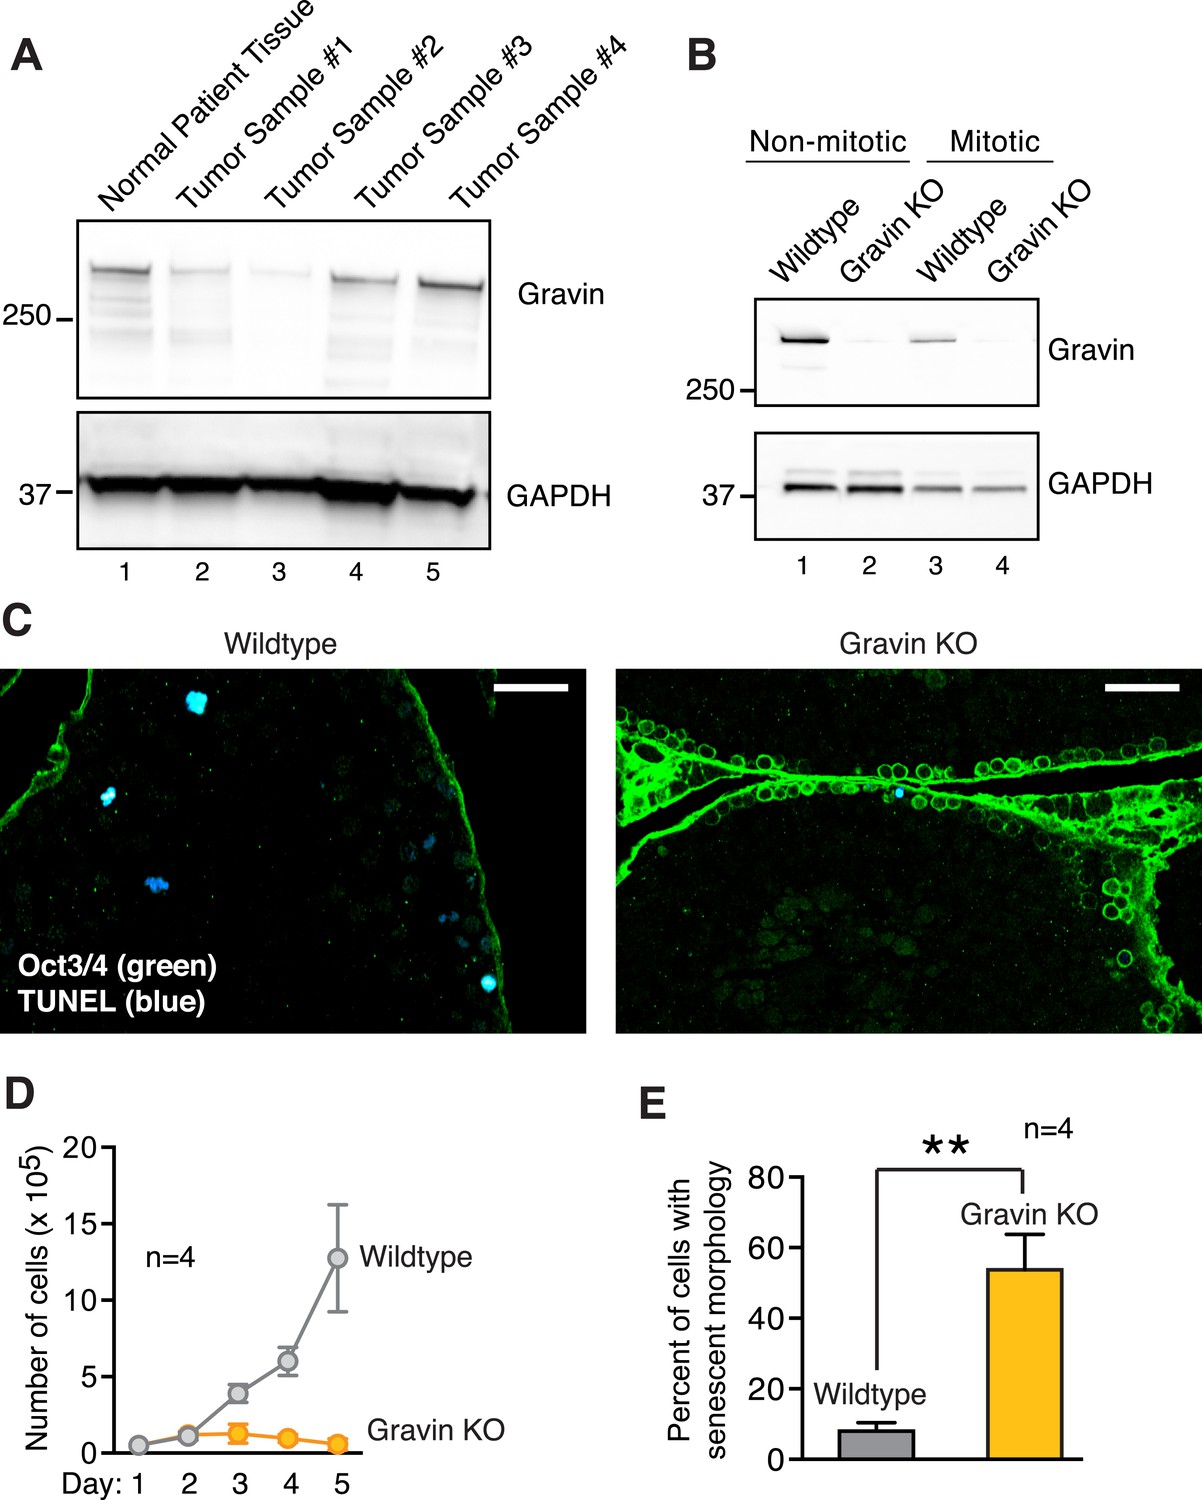
Loss of Gravin in human summons and mouse tissues, and correlation with altered mitosis.
(A) Immunoblot analysis of human testis lysates from normal (lane 1) and seminoma samples (lanes 2, 3, 4, and 5). Antibodies were used to detect (top) Gravin and (bottom) GAPDH loading control. (B) Immunoblot analysis of SV40 immortalized wild-type and Gravin null mouse embryonic fibroblasts (MEFs). Analysis was conducted on asynchronous non-mitotic (lanes 1 and 2) and synchronized mitotic (lanes 3 and 4) cell lysates. Detection of (top) Gravin and (bottom) GAPDH loading control. (C) Testis sections from 7-week-old wild-type and Gravin knockout mice were stained for TUNEL (blue) and the stem cell marker Oct3/4 (green). Scale bar, 40 μm. (D) Growth curves for wild-type (gray) and Gravin null (orange) MEFs from 13-day-old embryos (n = 4 lines from each genotype ± SEM). Cell proliferation rates from day 1 to day 5 are depicted. (E) Wild-type (gray) and Gravin null (orange) MEFs were cultured for four days. Cells were scored for cellular senescence on the basis of a large flat cellular morphology (n = 4 lines from each genotype, **p < 0.01).
Figure 2 with 1 supplement
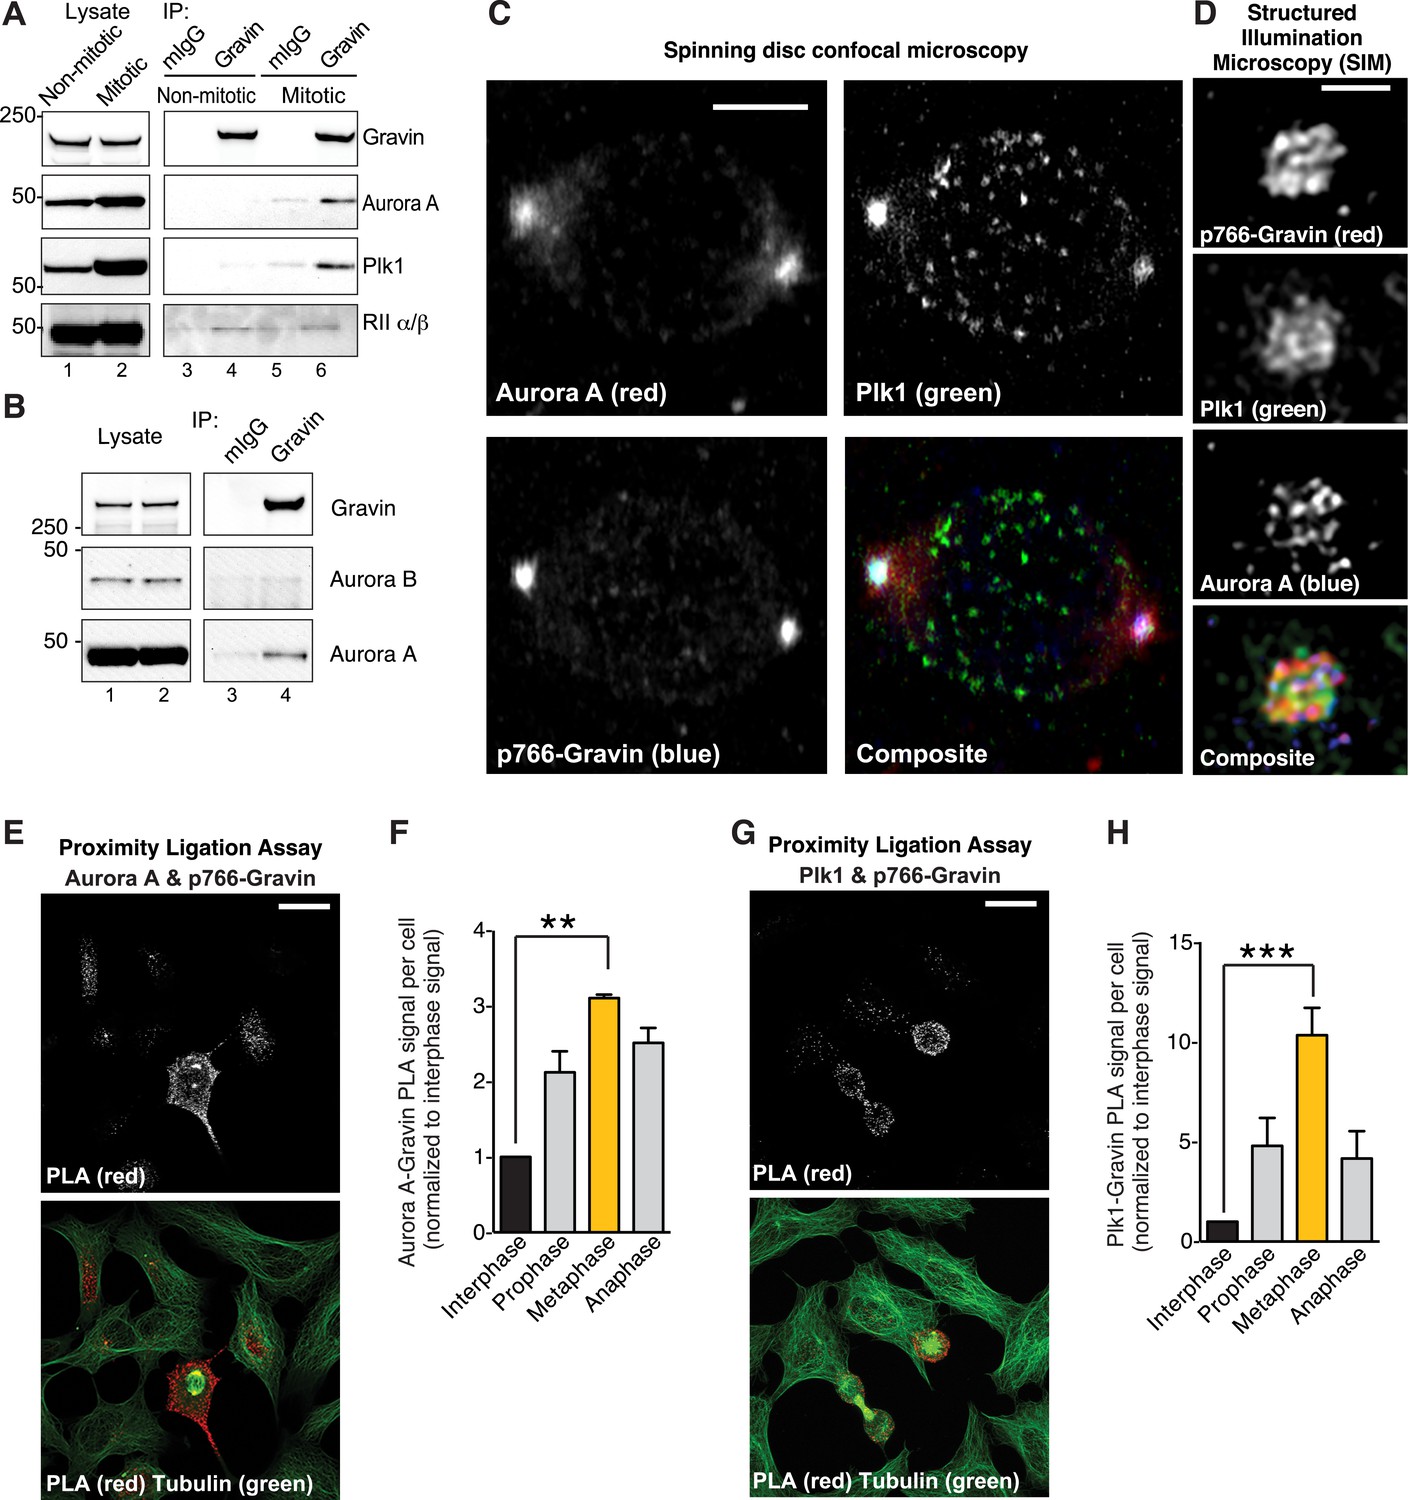
Phospho766-Gravin interacts with Plk1 and Aurora A during mitosis.
(A) Endogenous Gravin complexes were immunoprecipitated from non-mitotic HEK293 cell lysates (lanes 3 and 4) and mitotic cell lysates (lanes 5 and 6). Samples were immunoblotted for (top) Gravin, (upper-mid) Aurora A, (lower-mid) Plk1, and (bottom) RII subunit of protein kinase A (PKA). Control immunoprecipitations (mIgG) are included (lanes 3 and 5). (B) Endogenous Gravin complexes were immunoprecipitated from mitotic lysate (lane 4) and immunoblotted for (top) Gravin, (mid) Aurora B, and (bottom) Aurora A. Control immunoprecipitations (mIgG) are included (lane 3). (C) Metaphase cells were immunostained for Aurora A (red), Plk1 (green), and p766-Gravin (blue). Confocal micrographs are presented as maximum projections. A composite image is included. Scale bar, 5 μm. (D) A structured illumination microscopy (SIM) maximum projection of a single mitotic spindle pole decorated with antibodies to Aurora A (blue), p766-Gravin (red), and Plk1 (green). Scale bar, 1 μm. (E–H) A proximity ligation assay (PLA) was used to detect in situ interaction between (E, F) Aurora A/p766-Gravin and (G, H) Plk1/p766-Gravin during the cell cycle. (F, H) The integrated PLA signal intensity per cell was calculated for different stages of the cell cycle. Each value was normalized to the signal obtained in interphase cells (n = 3 experiments ± SEM). Phospho-Gravin interaction with Aurora A (F, **p < 0.001) and Plk1 (H, ***p < 0.0005) was maximal during metaphase as compared to interphase or other phases of the cell cycle.
Figure 2—figure supplement 1
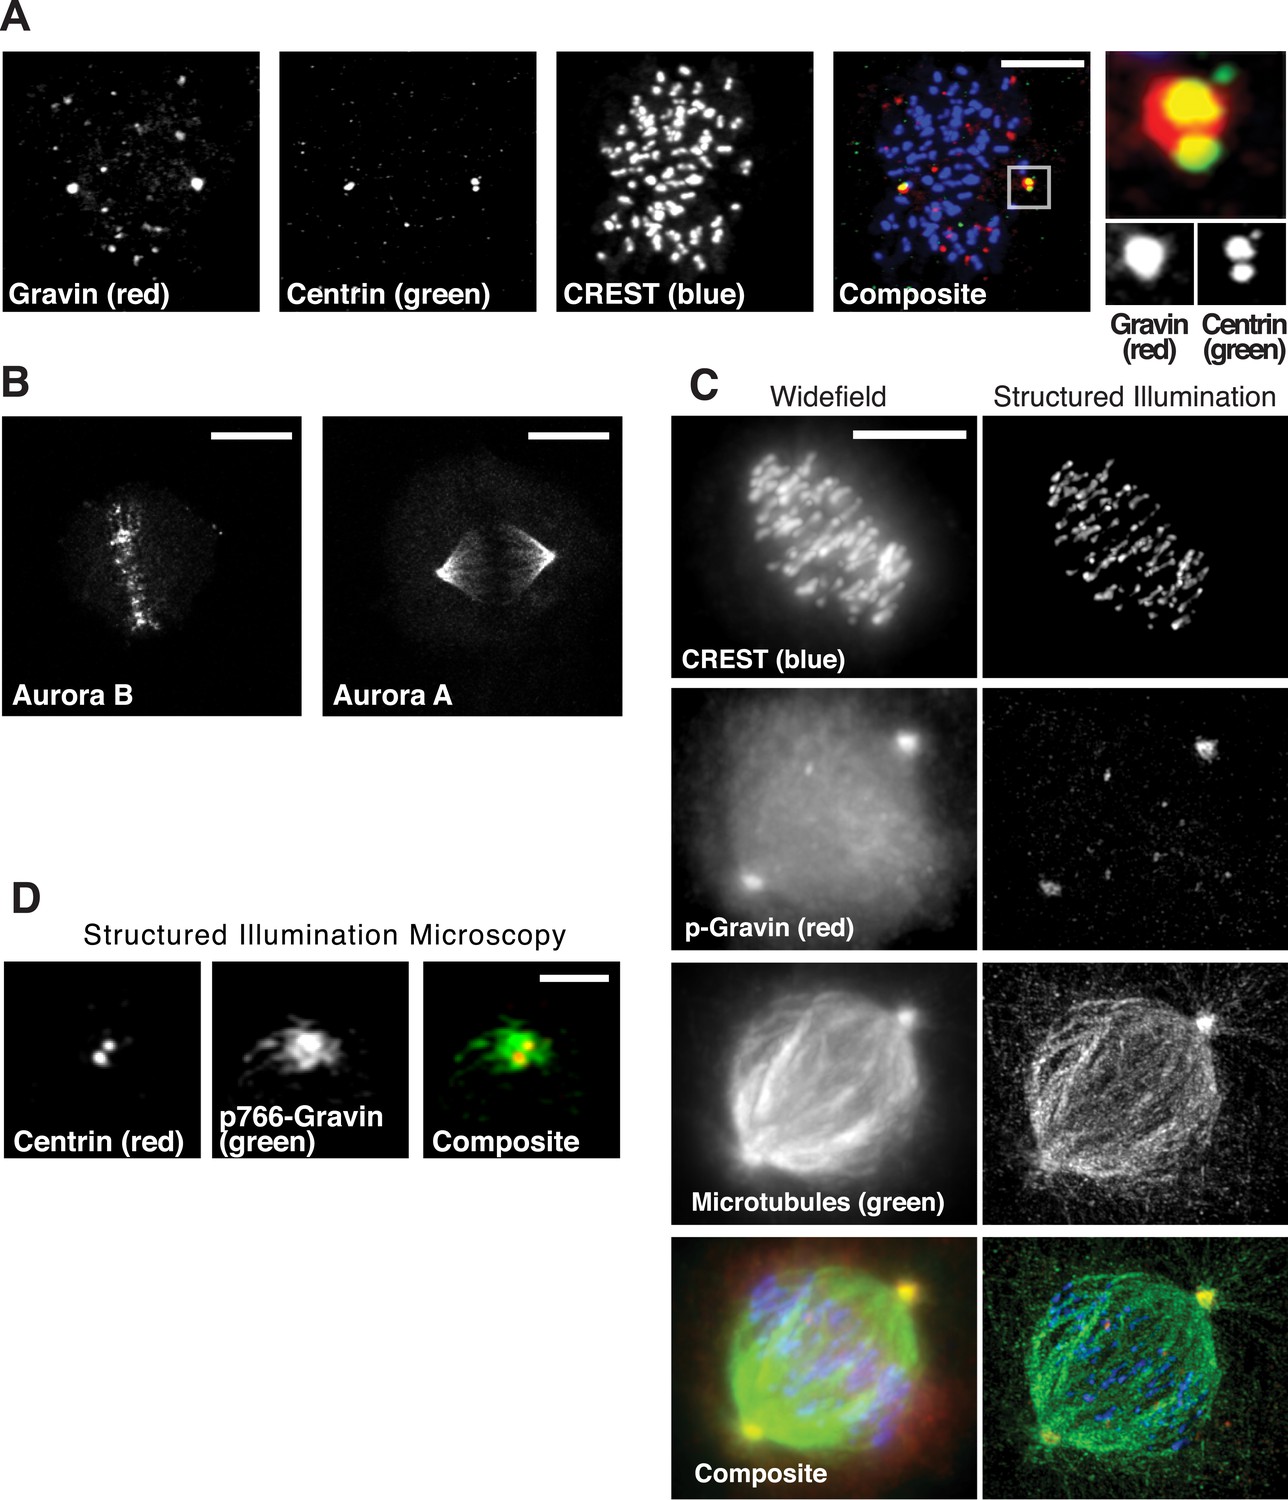
Subcellular location of Gravin complex components during mitosis.
(A) Spinning disc confocal micrograph of a metaphase cell immunostained for total Gravin (red), centrioles (Centrin, green), and kinetochores (CREST, blue) is presented as a maximum projection. Individual and composite images are included. Scale bar, 10 μm. An inset of a single spindle pole is shown on right at greater magnification. (B) Confocal micrographs of metaphase cells immunostained for Aurora B (left) and Aurora A (right) are presented as maximum projection images. Scale bar, 10 μm. (C) A comparison of widefield (left) and super-resolution structured illumination (right) maximum projection images of the same metaphase cell stained for CREST (blue), p-Gravin (red), and microtubules (green). A composite image is included. Scale bar, 10 μm. (D) A structured illumination maximum projection of a single mitotic spindle pole immunostained for centrin (centrioles, red) and p766-Gravin (green). Bar, 1 μm.
Figure 3
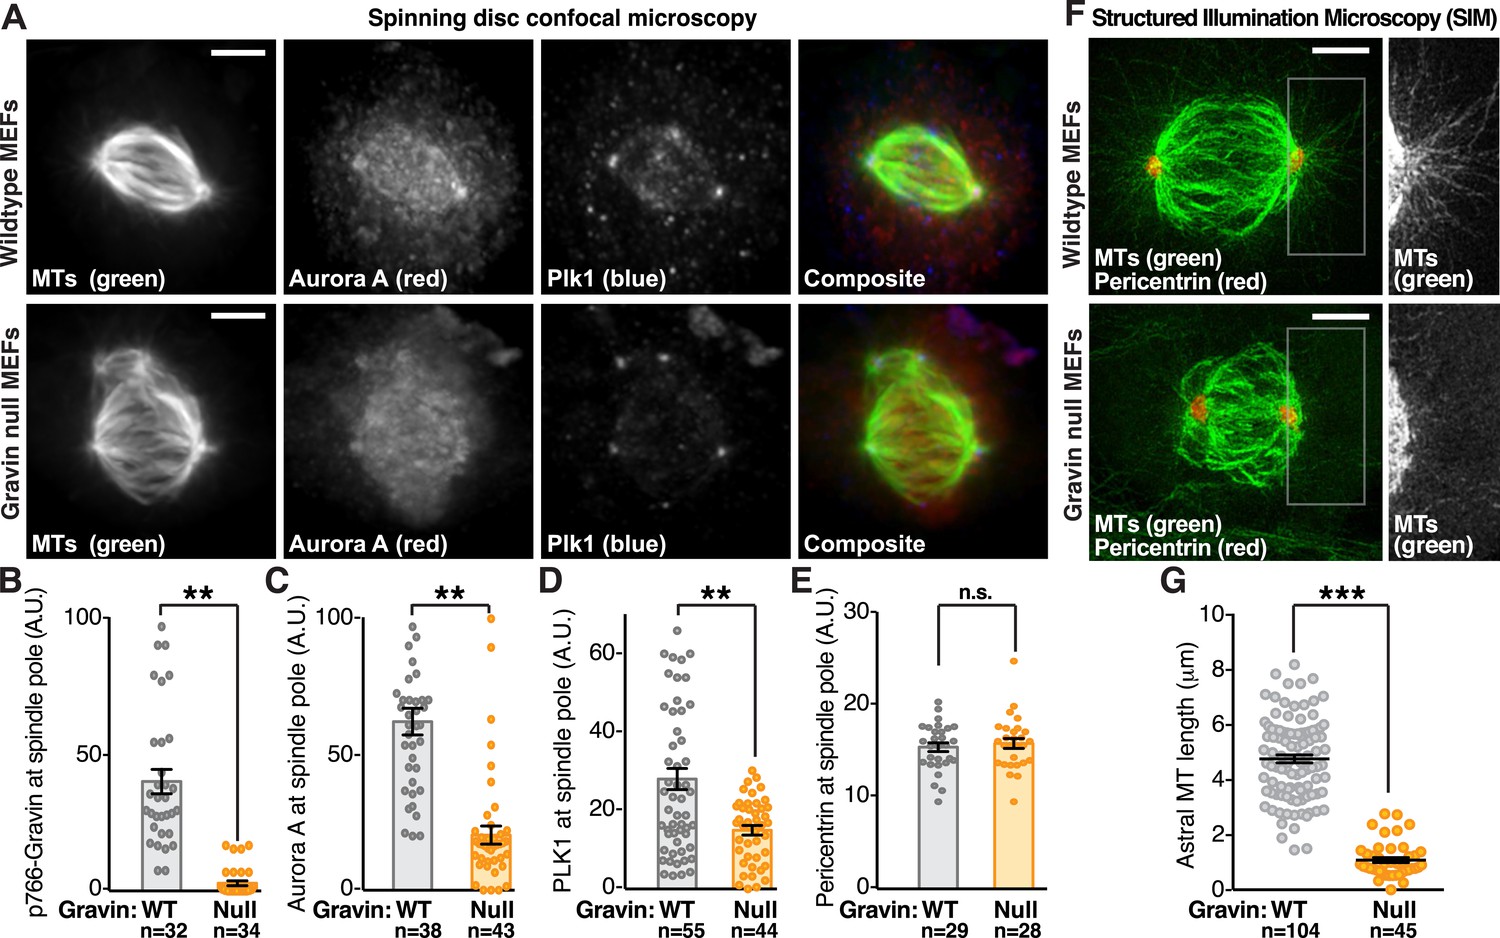
Gravin impacts the protrusion of astral microtubules.
(A) Confocal micrographs of metaphase primary MEFs derived from wild-type (top) and Gravin knockout (bottom) mice are presented as maximum projections. MEFs from each genotype were immunostained for tubulin (MTs, green), Aurora A (red), and Plk1 (blue). Composite images are included. Scale bar, 5 μm. (B–E) Quantification of immunofluorescent signal at mitotic spindle poles in wild-type (gray) and Gravin null (orange) MEFs is presented for (B) p766-Gravin, (C) Aurora A, (D) Plk1, and (E) a spindle pole marker pericentrin. Total cell numbers used in calculation are indicated below each column. Data are from three independent experiments, **p-values <0.01, ±SEM. (F) Astral microtubules are imaged at metaphase using SIM. Maximum projection images of wild-type (top) and Gravin null (bottom) MEFs immunostained with antibodies for tubulin (MTs, green) and pericentrin (red) show microtubules and spindle poles in these cells. Insets depict a magnified view of the astral microtubules protruding from the spindle pole in each genotype. (G) Quantitation of astral microtubule (MT) length in wild-type (gray) and Gravin null (orange) metaphase MEFs. Total cell numbers used in calculation are indicated below each column (***p < 0.0001, amalgamated data from three independent experiments).
Figure 4 with 1 supplement
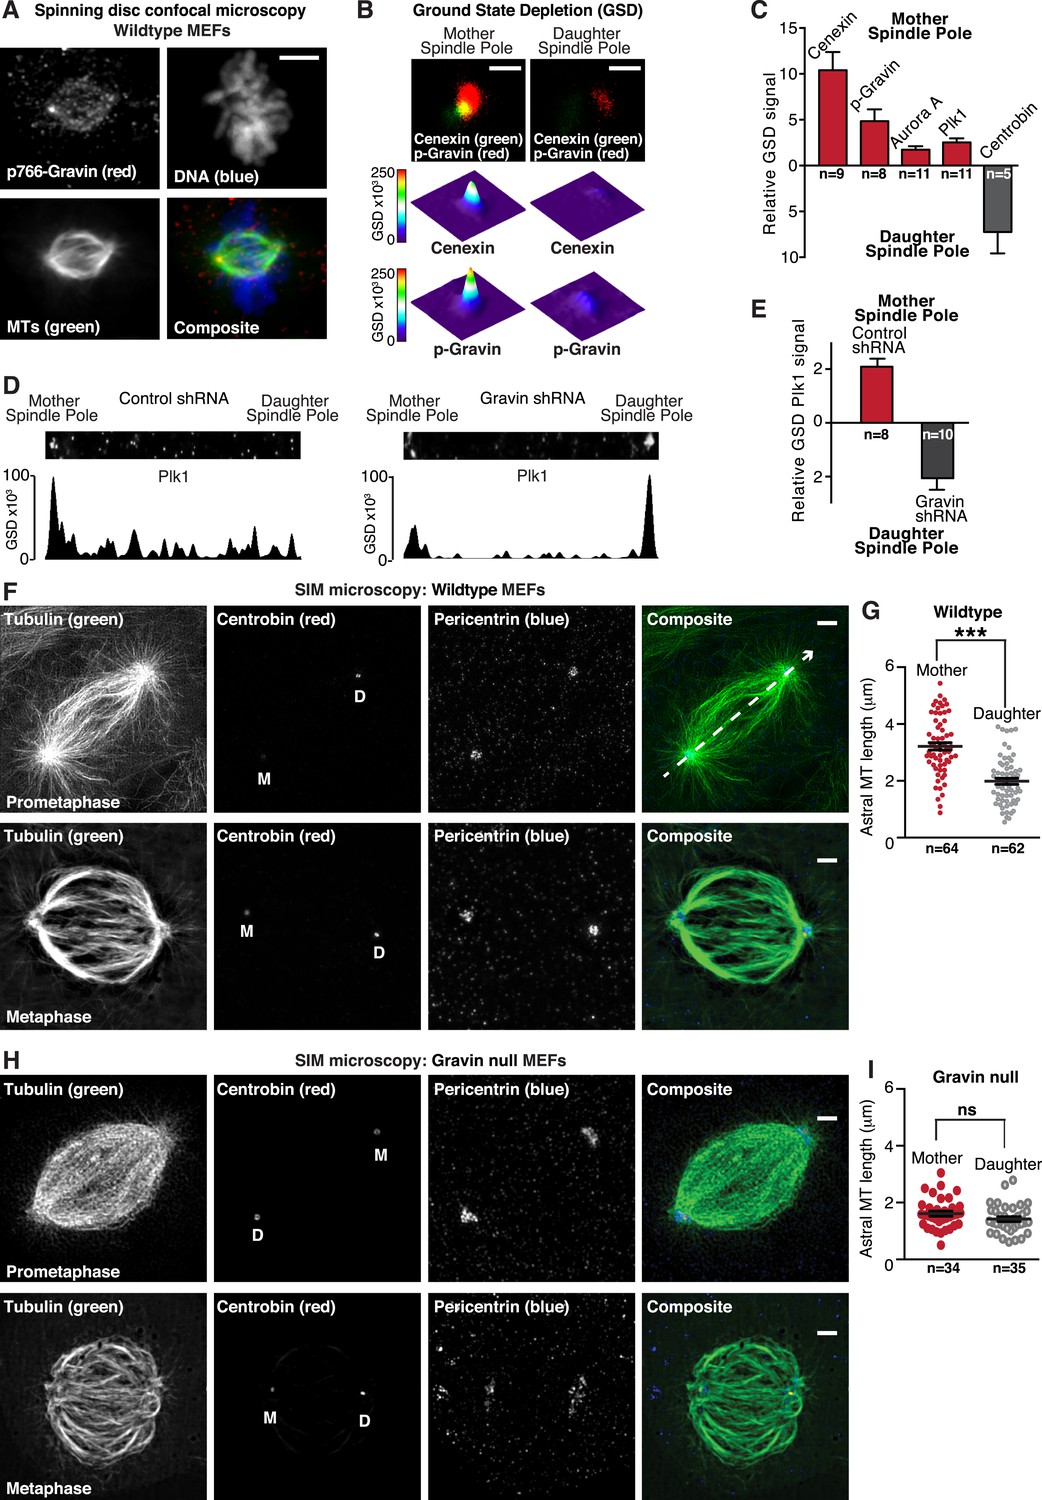
Gravin-Aurora A-Plk1 scaffold is preferentially sequestered at mother spindle poles.
(A) Spinning disc confocal micrograph (maximum projection) of a metaphase wild-type MEF depicts asymmetric enrichment of p766-Gravin (red) at one spindle pole. Counterstaining with tubulin (MTs, green) and DAPI (DNA, blue) are shown. Composite image is shown. Bar, 5 μm. (B) Ground state depletion microscopy (GSDIM) was performed on prometaphase HEK293 cells (top). Cells were immunostained for a mother spindle pole marker, Cenexin (green) and p-Gravin (red). Quantification of these signals is shown below micrographs. Integrated intensity profiles for (top) cenexin and (bottom) p-Gravin at the mother spindle pole (left). Intensity profiles for both proteins at the daughter spindle pole are also presented (right). Scale bar, 1 μm. (C) Relative GSD signals for p766-Gravin, Aurora A, Plk1, and Cenexin at the mother spindle pole (red). Centrobin (gray) was used as a daughter spindle pole marker. Cell numbers used in each calculation are indicated on graph (n = 3 experiments ± SEM). (D) GSDIM micrographs showing the distribution of Plk1 at spindle poles in (top, left) control and (top, right) Gravin-depleted HEK293 cells. Densitometric analyses depict the asymmetric distribution of Plk1 at mother and daughter spindle poles in (bottom, left) control and (bottom, right) Gravin knockdown cells. (E) Amalgamated data are shown in graph. Cell numbers used in each calculation are indicated on graph (n = 3 experiments ± SEM). (F) SIM maximum projection of (top) wild-type and (bottom) Gravin null MEFs at metaphase. Immunostaining for tubulin (green), centrobin (red), and pericentrin (blue) are presented. The daughter spindle pole was decorated with centrobin (red) and marked on the micrograph with D, whereas the mother spindle pole is denoted with M. Composite images are included. Dashed line (white) depicts path of line-scan used to determine which pole contained the most centrobin (see Figure 4—figure supplement 4I and J). Scale bar, 2 μm. (G) Comparison of astral microtubule (MT) length (μm) protruding from the mother (red; n = 64) and daughter spindle poles (gray, n = 62) in wildtype MEFs (n = 5 cells, ±SEM, ***p < 0.0001). (H–I) Quantitation of astral microtubule (MT) length protruding from the mother (red; n = 34) and daughter spindle poles (gray, n = 35) in Gravin null MEFs (n = 5 cells, ±SEM, ns depicts not significant).
Figure 4—figure supplement 1
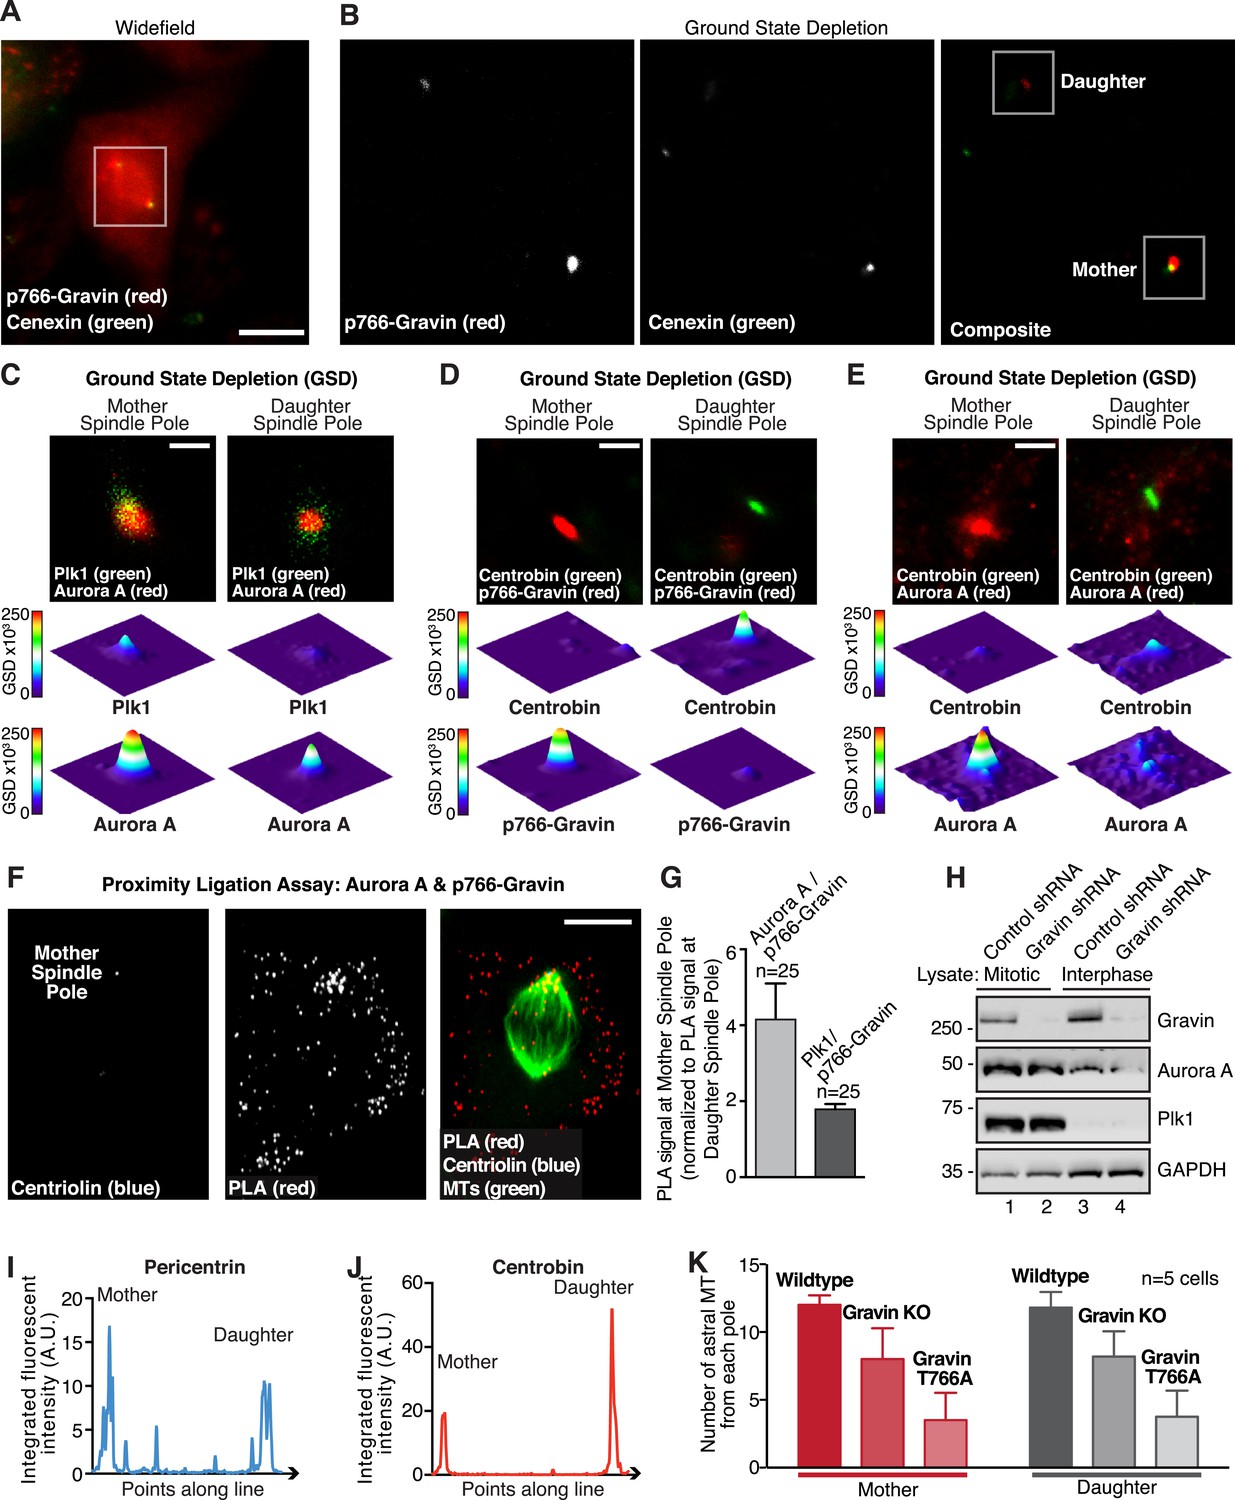
Super-resolution microscopy identifies p-Gravin, Plk1, and Aurora A location and codistribution in mitotic cells.
(A and B) Improved resolution with GSD microscopy. (A) An HEK293 cell in metaphase stained for p-Gravin (red) and Cenexin (green) was imaged by widefield microscopy using the Leica oil-immersion HC PL APO 160×/1.43 NA super-resolution objective on a Leica GSD/TIRF microscope. White box outlines the area in which ground state depletion (GSD) was performed for part (B). Bar, 20 μm. (B) Comparative analysis of the same cell by GSD microscopy. Mother and daughter spindle poles are indicated (white boxes). Analyses of these regions are presented in Figure 4B,C. (C) GSDIM (top) shows cells immunostained for a mother spindle pole marker, Plk1 (green) and Aurora A (red). Quantification of these signals is shown below micrographs. Integrated intensity profiles for (top) Plk1 and (bottom) Aurora A at the mother spindle pole (left). Intensity profiles for both proteins at the daughter spindle pole are also presented (right). Scale bar, 1 μm. (D) GSD microscopy showing the distribution of Centrobin (green) and pT766-Gravin (red) at both spindle poles of an HEK293 cell. Bar, 1 μm. An intensity profile for each signal is included. (E) GSD microscopy showing the distribution of Centrobin (green) and Aurora A (red) at both spindle poles of an HEK293 cell. Bar, 1 μm. Intensity profiles of each signal are included. (F) A PLA (red) was used in U2OS cells stably expressing a mother centriole marker (myc-centriolin)1 to determine which spindle pole predominates for Aurora A/p766-Gravin interaction. The interaction sites are identified by PLA puncta (red), and centriolin (blue), and tubulin (green) are shown. Bar, 10 μm. (G) Quantification of the relative amount of PLA signal at the mother spindle pole compared to the daughter spindle pole is shown for (light gray) Aurora A/p766-Gravin interaction and (dark gray) Plk1/p766-Gravin interaction (total number of cells are indicated, ±SEM, n = 3 experiments). (H) HEK293 cells that stably express control or Gravin shRNA were synchronized in mitosis. Lanes 1 and 2 were loaded with mitotic lysates, whereas lanes 3 and 4 were loaded with control interphase lysates. Immunoblots were probed for (top) Gravin, (upper mid) Aurora A, (lower mid) Plk1, and (bottom) GAPDH as a loading control. (I, J) Line plot analysis of (I, blue line) pericentrin and (J, red line) centrobin showing the integrated fluorescent intensity of each protein (points along a line) across the mitotic spindle (as depicted in Figure 4F). (K) The number of astral microtubule at the mother (red bars) and daughter (gray bars) spindle poles were counted in wild-type and Gravin null MEFs, and cells rescued with the murine Gravin T766A mutant that is unable to interact with Plk1 (n = 5 cells ± SEM).
Figure 5
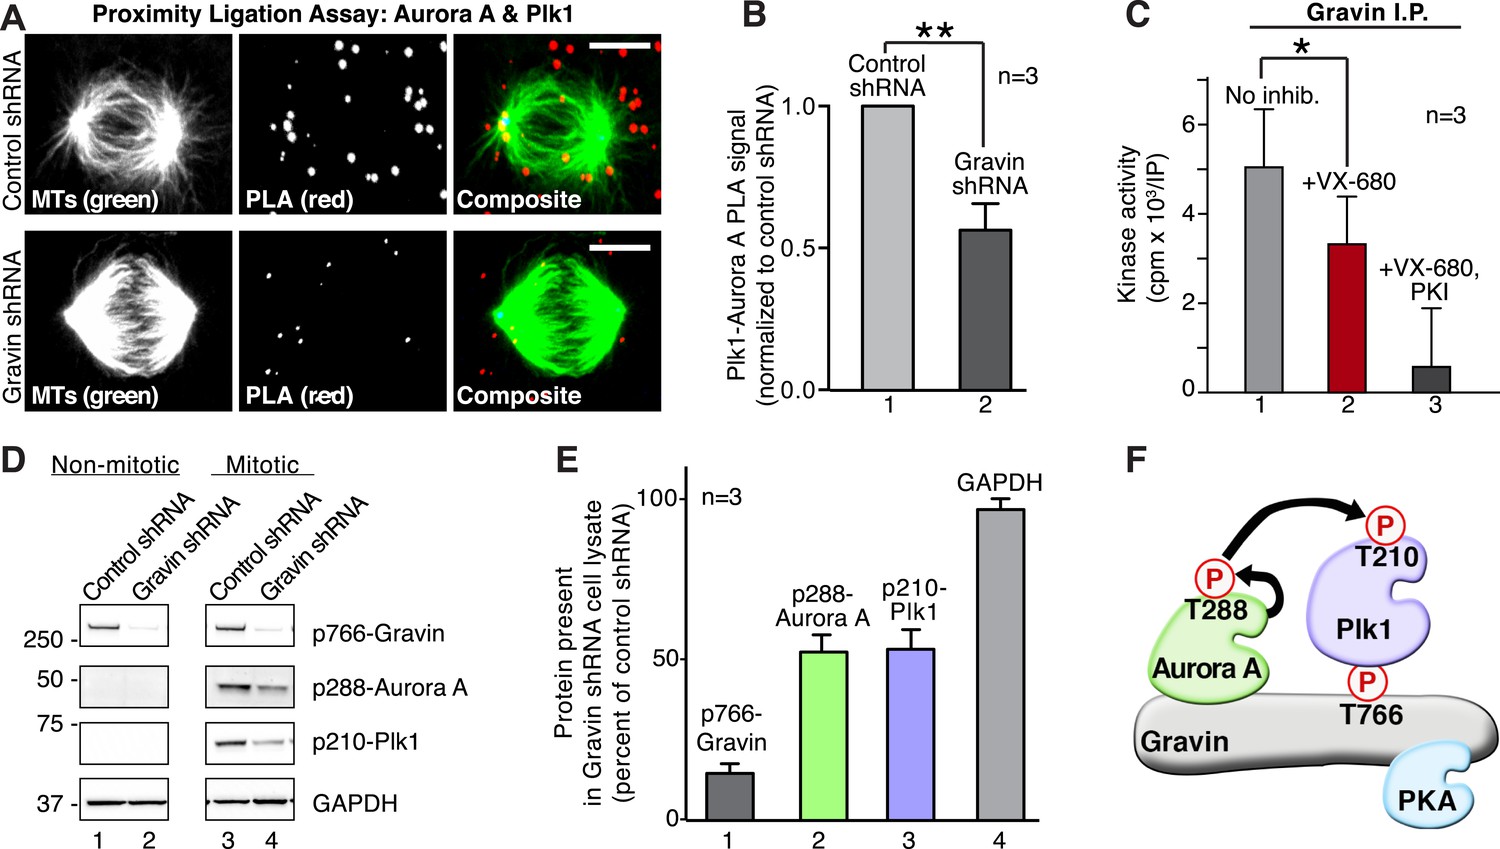
Gravin scaffolds an Aurora A and Plk1 kinase-network.
(A) PLA (red) to identify the frequency and subcellular distribution of the in situ interaction between Aurora A and Plk1 in mitotic HEK293 cells. Staining of microtubules (green) is indicated. (Top) Cells treated with control shRNA, and (bottom) cells treated with Gravin shRNA. Bar, 5μm. (B) Quantitation of PLA signal intensity in (light gray) control and (dark gray) Gravin-depleted cells. One hundred fifty cells were analyzed for each condition from three independent experiments (±SEM, **p < 0.01). (C) Gravin immune complexes isolated from mitotic lysates were assayed for protein kinase activity using Kemptide (300 μM) as a substrate. Quantitation of 32P phosphate incorporation was measured by scintillation counting (n = 3 ± SEM, *p < 0.05). Total kinase activity (gray) is compared to enzyme activity in the presence of the Aurora A inhibitor alone (VX-680, red) or VX-680 and a PKA inhibitor (PKI, black). (D) Phospho-peptide antibodies were used as an index of Aurora A and Plk1 activity in Gravin immune complexes. Immunoblots show levels of (top) p766-Gravin, (mid) p288-Aurora A, and (lower) p210-Plk1 upon shRNA mediated depletion of Gravin from HEK293 cells. (Bottom) GAPDH loading controls are indicated. (E) Densitometric analysis of amalgamated data from three experiments as shown in (D) (±SEM). (F) A model depicting the proposed flow of phosphorylation signals through a Gravin associated Aurora A and Plk1 cascade.
Figure 6 with 1 supplement
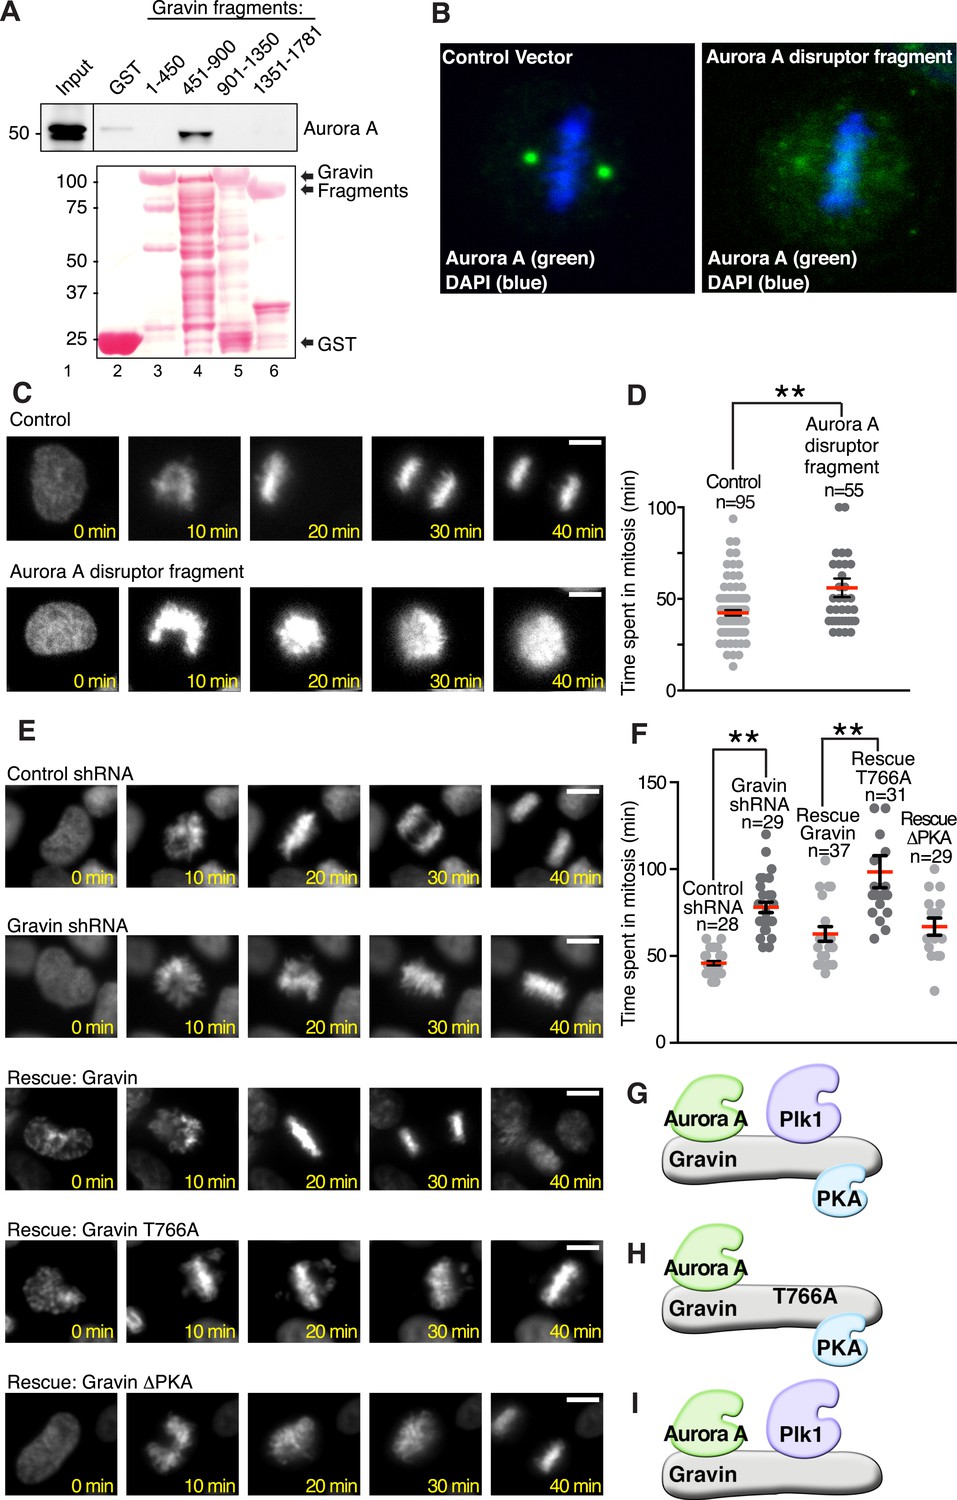
Gravin-scaffolding of Aurora A and Plk1 facilitates metaphase progression.
(A) Direct binding of purified Gravin GST-fusion proteins (first and last amino acid number of each fragment is denoted above each lane) with recombinant V5-tagged Aurora A kinase (generated by in vitro transcription and translation). (Top) Immunoblot detection of Aurora A in complex with GST-Gravin fragments. (Bottom) Ponceau stained blot shows protein expression levels. (B) Spinning disc confocal image (maximum projection) of a metaphase cell (control vector, left) stained for (green) Aurora A and (blue) DNA. The subcellular rearrangement of Aurora A following over-expression of the Aurora A disruptor fragment (right). DNA is shown in blue (DAPI). (C) Live cell imaging of HeLa cells stably expressing H2B-GFP were monitored through mitosis from the time of DNA condensation until anaphase exit. Shown are (top panels) a representative control cell and (bottom panels) a cell expressing the Aurora A disruptor fragment. Bar, 5 μm. (D) Amalgamated data from multiple cells stably expressing H2B-GFP and monitored for time spent in mitosis. Control cells (n = 95 cells) and Aurora A disruptor expressing cells (n = 55 cells) were from three independent experiments (**p < 0.001 ). (E–I) Live cell imaging time courses (0–40 min) of cells stably expressing H2B-GFP transfected with (top) control shRNA and (second) Gravin shRNA. Rescue experiments as indicated with (third) murine Gravin; (fourth) murine Gravin T766A; and (fifth) murine GravinΔPKA. Bar, 5 μm. (F) Amalgamated data from multiple cells treated with control or Gravin shRNA, and rescued with murine Gravin as shown in E. These cells were stably expressing H2B-GFP and monitored for time spent in mitosis. Total cell numbers are indicated on graph (from three independent experiments, **p-values <0.001). (G–I) Models depicting the kinase-binding properties of the Gravin mutants used in time course experiments E and F: rescue with intact Gravin (G), Gravin T766A (H), and GravinΔPKA (I).
Figure 6—figure supplement 1
Biochemical validation of reagents used in analysis of cell cycle progression.
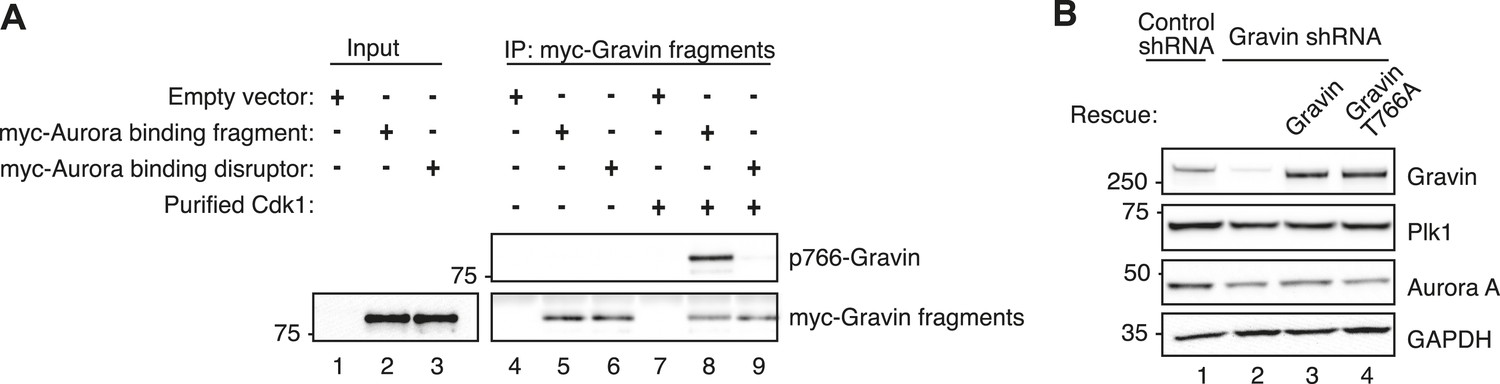
(A) Immunoblot analysis of (lanes 1, 2, and 3) mitotic lysates expressing empty vector, the Aurora-binding fragment myc-Gravin(591–864), or the Aurora-binding disruptor fragment myc-Gravin(591–864)T766A. Also (lanes 4–9) the immunoprecipitated control, myc-Gravin (591–864), or myc-Gravin (591–864)T766A fragments were incubated with purified Cdk1 (lanes 8 and 9). Immunoblots were probed for (top) p766-Gravin and (bottom) anti-myc. Empty vector controls are included (lanes 1, 4, and 7). Cdk1 phosphorylation of expressed myc-Gravin truncations is observed in cells expressing myc-Gravin (591–864) (lane 8) and not in myc-Gravin (591–864)T766A (lane 9). (B) Immunoblot analysis of mitotic cells stably expressing a control shRNA (lane 1) or Gravin shRNA (lanes 2–4) and rescued with murine Gravin (lane 3) or murine Gravin T766A (lane 4). Immunoblot detection with antibodies against (top) Gravin, (upper mid) Plk1, (lower mid) Aurora A, and (bottom) GAPDH loading control.
Figure 7
The Gravin-Aurora A-Plk1 scaffold regulates appropriate spindle orientation.
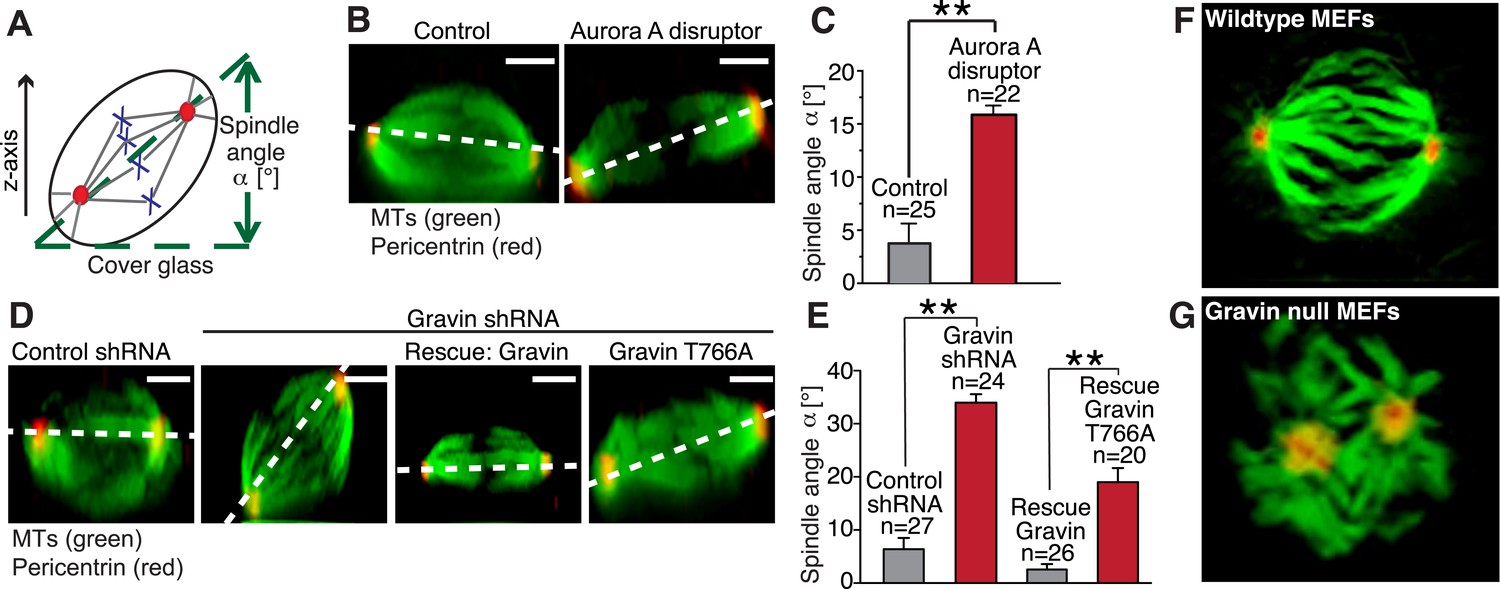
(A) Diagram depicting how spindle angle was calculated for treatments in (B–E). The z-axis of a metaphase cell with a defined spindle angle α [°] in relation to the cover glass. (B) A representative z-axis confocal projection for HeLa cells expressing an empty vector (left) or the Aurora A disruptor fragment. Cells were stained with tubulin (green, MTs) and centrosomes (red, pericentrin). The dashed line connects the two spindle poles and is used to determine the spindle angle relative to the cover glass. Bar denotes 3 μm. (C) Spindle angles between cover glass and line bisecting spindle poles in z-axis projections were measured. The amalgamated data from three independent experiments show mean spindle angles ([°]; total cell numbers are denoted above each column, ±SEM, **p-values <0.001). (D) A representative z-axis confocal projection for HeLa cells treated with control shRNA and Gravin shRNA and rescue experiments with murine Gravin and the murine Gravin T766A. Cells were stained with tubulin (green, MTs) and centrosomes (red, pericentrin). The dashed line connects the two spindle poles and is used to determine the spindle angle relative to the cover glass. Bar denotes 3 μm. (E) Spindle angle quantification for each treatment (cell numbers depicted on graph ± SEM, **p-vales < 0.001). (F, G) Single frames from z-axis confocal 3-dimensional videos of (F) wild-type and (G) Gravin null MEFs in metaphase. Staining with tubulin (green) and pericentrin (red). Full videos are presented in Video 2.
Figure 8
Gravin contributes to spindle orientation of germ line stem cells during spermatogenesis.
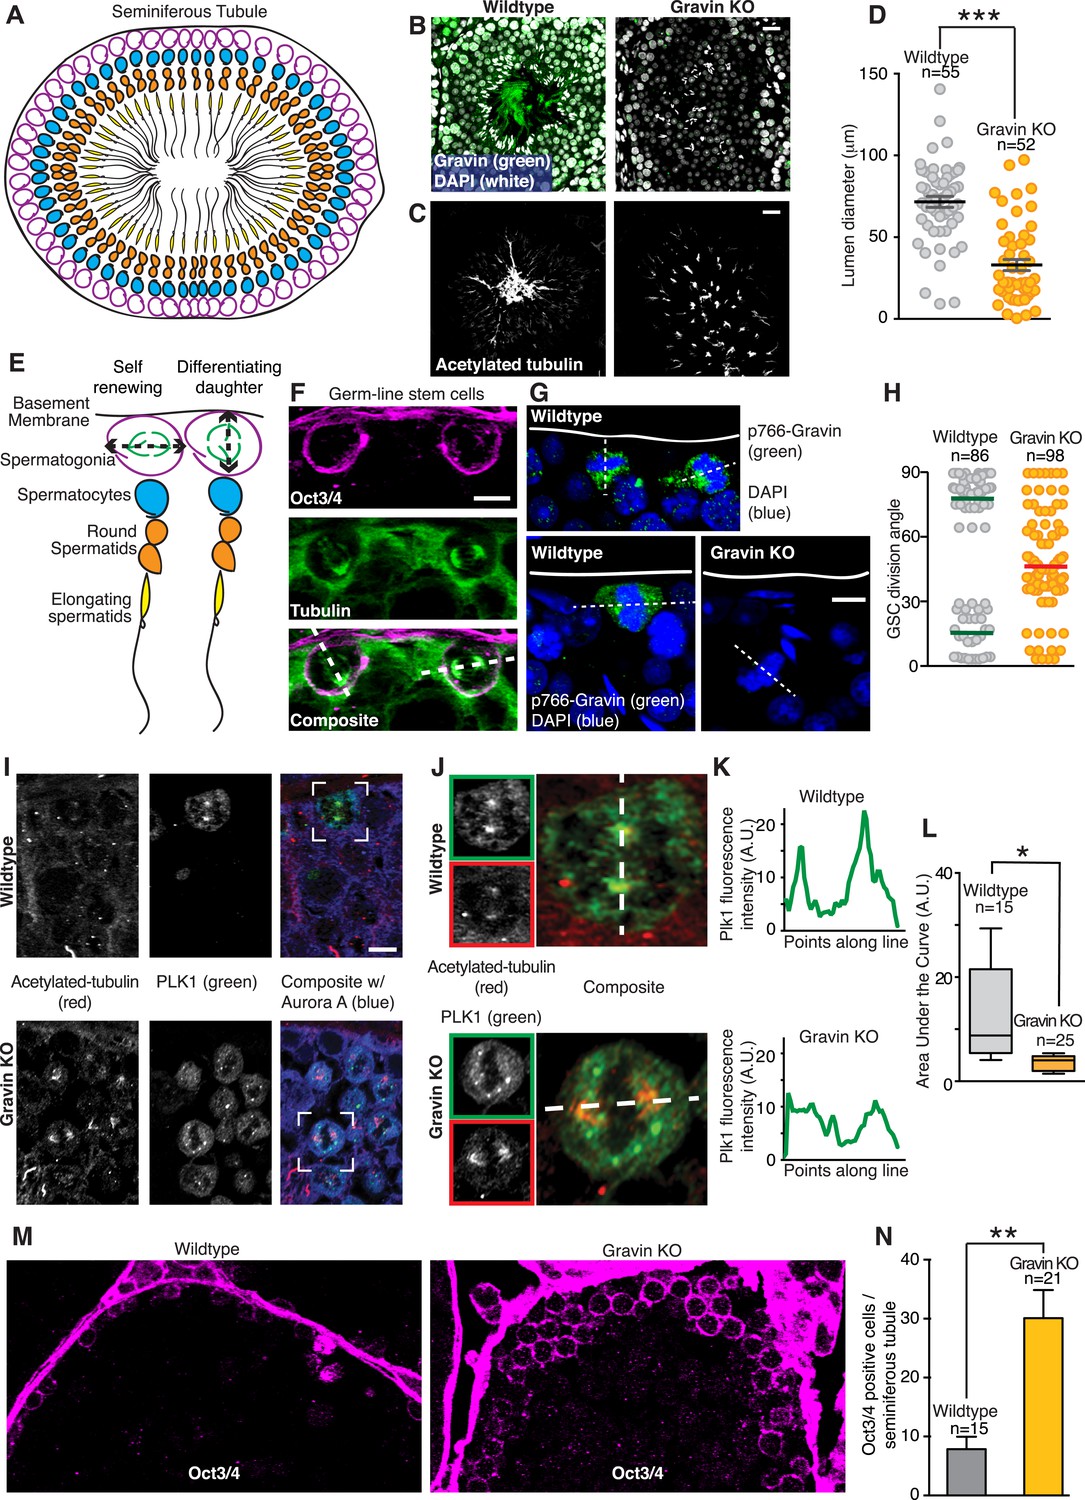
(A) Schematic depicting the cross-sectional topology of a seminiferous tubule. The organization of the basement membrane (black), spermatogonia (magenta), spermatocytes (blue), round spermatids (orange), and elongating spermatids (yellow) is indicated. (B) Testis sections from (left) wild-type and (right) Gravin knockout mice stained for Gravin (green) and DAPI (white). (C) Parallel sections were stained for flagellum (acetylated tubulin) revealing a loss in polarized organization of seminiferous tubules in Gravin knockout mice. Bar denotes 10 μm. (D) Lumen diameter was measured within seminiferous tubules of wild-type and Gravin knockout mice (total number of lumen measured are indicated on graph, and data are from three independent experiments, ***p < 0.001, ±SEM). (E) Close-up of model in A showing germ line stem cells (spermatogonia, magenta) can undergo either self-renewing (parallel spindle angle, left) or differentiating divisions (perpendicular spindle angle, right). (F) Representative cross-section of wild-type mouse seminiferous tubule. Germ line stem cells are stained for Oct3/4 (magenta) and microtubules (green). Dashed line in the composite image that bisects both spindle poles was used to determine spindle angle orientation in relation to basement membrane. Two distinct spindle angle orientations are evident. Bar, 5 μm. (G) Representative images of mouse seminiferous tubule sections stained for p766-Gravin (green) and DNA (DAPI, blue). (Top and bottom left) wild-type and (bottom right) Gravin knockout tissue. Dashed line bisects both spindle poles and was used to identify spindle angle orientation in relation to basement membrane. Bar, 5 μm. (H) Quantitation of spindle angle orientation in germ line stem cell sections from seminiferous tubule (examples presented in F and G). Spindle angles relative to basement membrane were identified for wild-type and Gravin knockout mitotic cells. Wild-type mitotic cells fall into two spindle angle populations between 0 and 30° (self-renewing) and between 60 and 90° (differentiating). However, Gravin null mitotic cells had a more randomized distribution of spindle angles. Total mitotic cell numbers in each genotype are indicated on graph. Experiments were conducted on tissue sections from 3 mice of each genotype. (I) Cross-sections of (top) wild-type and (bottom) Gravin knockout mouse seminiferous tubules were stained for acetylated tubulin (red, left) and Plk1 (green, middle). Composite images (right) are shown. White boxes identify the regions that are magnified in J. Bar, 5 μm. (J–K) Insets from (I) are shown for (top) wild-type and (bottom) Gravin knockout sections at higher magnification. Dashed white line in composite image identifies line-scan measured to determine the distribution of Plk1 intensity at each spindle pole. (K) Line plot graphs show integrated intensity values for Plk1 for (top) wild-type and (bottom) Gravin knockout dividing cells. (L) Amalgamated data presented as area under the curve from line scans of wild-type (n = 15 cells) and Gravin knockout mitotic cells (n = 25 cells). For Box and Whiskers plot, the box extends from the 25th to 75th percentiles using a standard method of computation via Prism software. The line in the middle of the box is plotted as the median. (M) Representative (left) wild-type and (right) Gravin knockout mouse seminiferous tubule sections stained for Oct3/4 (magenta) to identify germ line stem cells. (N) Relative abundance of Oct3/4-positive cells per seminiferous tubule section from (gray) wild-type and (orange) Gravin knockout mice. Number of seminiferous tubules analyzed per genotype is denoted on graph (±SEM, n = 3 mice each genotype, **p < 0.001).
Videos
Video 1
Comparison of mitotic progression in control and Gravin-depleted cells.
Time-lapse video of HeLa cells stably expressing Histone H2B-GFP. Frame by frame comparison of mitotic progression in cells transfected with (left) control shRNA and (right) Gravin shRNA.
Video 2
Comparison of mitotic spindles formed in wild-type and Gravin null MEFs.
Reconstructed z-axis confocal 3-dimensional movies mitotic spindles from (left) wild-type and (right) Gravin null MEFs. The mitotic spindles (tubulin, green) and spindle poles (pericentrin, red) are indicated. Related to Figure 7F,G.
Download links
A two-part list of links to download the article, or parts of the article, in various formats.
Downloads (link to download the article as PDF)
Open citations (links to open the citations from this article in various online reference manager services)
Cite this article (links to download the citations from this article in formats compatible with various reference manager tools)
A mitotic kinase scaffold depleted in testicular seminomas impacts spindle orientation in germ line stem cells
eLife 4:e09384.
https://doi.org/10.7554/eLife.09384


