MHC-compatible bone marrow stromal/stem cells trigger fibrosis by activating host T cells in a scleroderma mouse model
- Keio University School of Medicine, Japan
- Tokyo Medical and Dental University, Japan
- Shimane University, Japan
Figures
Figure 1 with 4 supplements
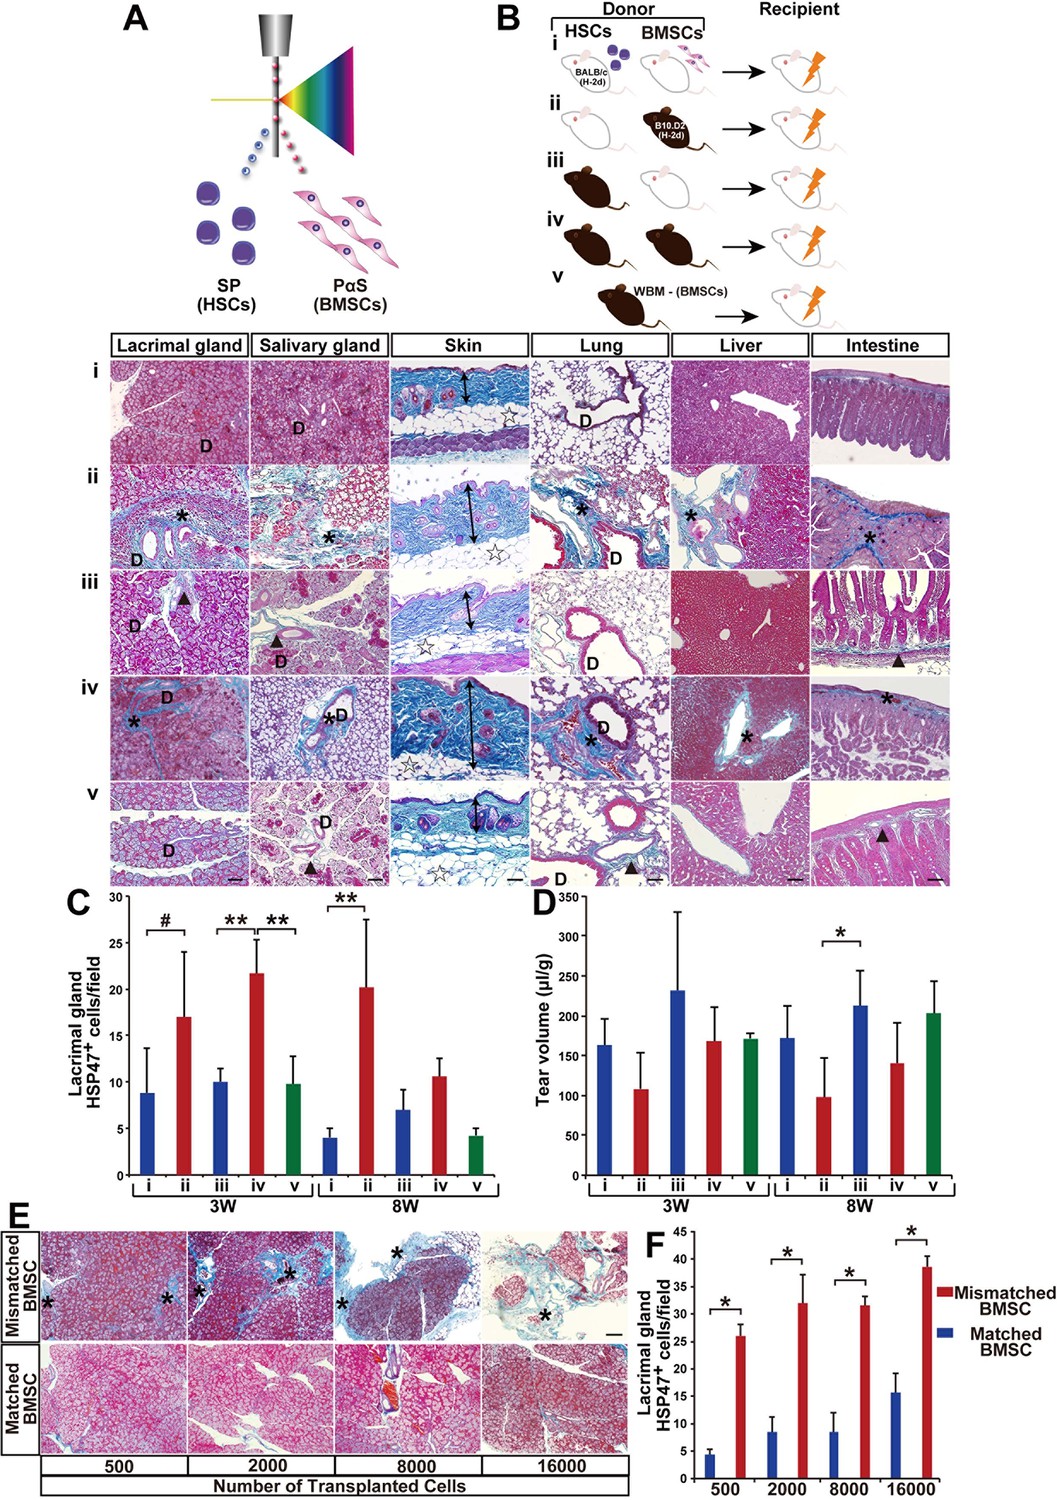
Modified SSc model by co-transplanting isolated HSCs and BMSCs.
(A, B) Transplantation model with different combinations of syngeneic (white) and mismatched (black) HSCs and BMSCs co-transplanted into BALB/c mice. (B, i–v) (i) Negative control, (ii) mismatched BMSC transplantation, (iii) syngeneic BMSC transplantation, (iv) positive control, and (v) mismatched MSC-depleted WBMT. Excessive fibrosis (deep blue, and ∗) in various organs was observed in mismatched BMSC transplanted mice after 3 weeks. Double arrows indicate epidermal and dermal thickness. The fibrotic areas were assessed as the ratio of the blue-stained area per field. D, duct. Minimal Mallory staining areas (▲) in (iii) and (v) are physiological changes and necessary to support the structure of ducts and intestinal walls. Scale bar, 100 μm (50 μm in liver). (C) HSP47+ fibroblasts in the lacrimal glands were significantly higher following mismatched BMSC transplantation (red) compared to syngeneic BMSC (blue), and BMSC-depleted WBM transplantation (green). The number of HSP47+ cells in negative control (i) (blue), and syngeneic MSC transplantation (iii) (blue), and mismatched MSC transplantation (ii) (red), and positive control (iv) (red), and mismatched MSC-depleted WBMT (green). Data are shown as mean ± SD, #p<0.05, *p<0.01, **p<0.001. (D) Tear volume in the same groups described in (C). Data are shown as mean ± SD, n = 2-5 per group, *p<0.05. (E, F) The degree of fibrosis (blue) in the lacrimal glands of mismatched BMSC recipients was dose dependent. Excessive fibrotic areas are shown in deep blue (∗). Data are shown as mean ± SD, n = 3. Scale bar, 100 μm. *p<0.001. BMSCs, bone marrow stromal/stem cells; HSCs, hematopoietic stem cells; SD, standard deviation.
-
Figure 1—source data 1
HSP47+ cells/ field in the lacrimal glands.
Number of HSP47+ cells per field (x200) from 5 to 13 areas from the lacrimal glands 3 and 8 weeks following transplantation. Source data for (C). HSP, heat-shock protein.
- https://doi.org/10.7554/eLife.09394.004
-
Figure 1—source data 2
Tear volume following transplantation.
Source data for graph shown in (D).
- https://doi.org/10.7554/eLife.09394.005
-
Figure 1—source data 3
The number of HSP47+ cells/field in the lacrimal glands after transplantation of 500, 2000, 8000, and 16,000 syngeneic or mismatched BMSCs shown in (F).
HSP, heat-shock protein.
- https://doi.org/10.7554/eLife.09394.006
-
Figure 1—source data 4
Number of HSP47+ cells/ field from in various target organs after whole bone marrow transplantation.
Number of HSP47+ cells per field from 4 to 5 areas in each organ 3 and 8 weeks following WBM for Figure 1—figure supplement 1(C). HSP, heat-shock protein.
- https://doi.org/10.7554/eLife.09394.007
-
Figure 1—source data 5
HSP47+ cells per field in the salivary gland, skin, lung, liver, and intestine shown in Figure 1—figure supplement 3B.
Data for each organ are displayed on separate sheets.
- https://doi.org/10.7554/eLife.09394.008
Figure 1—figure supplement 1
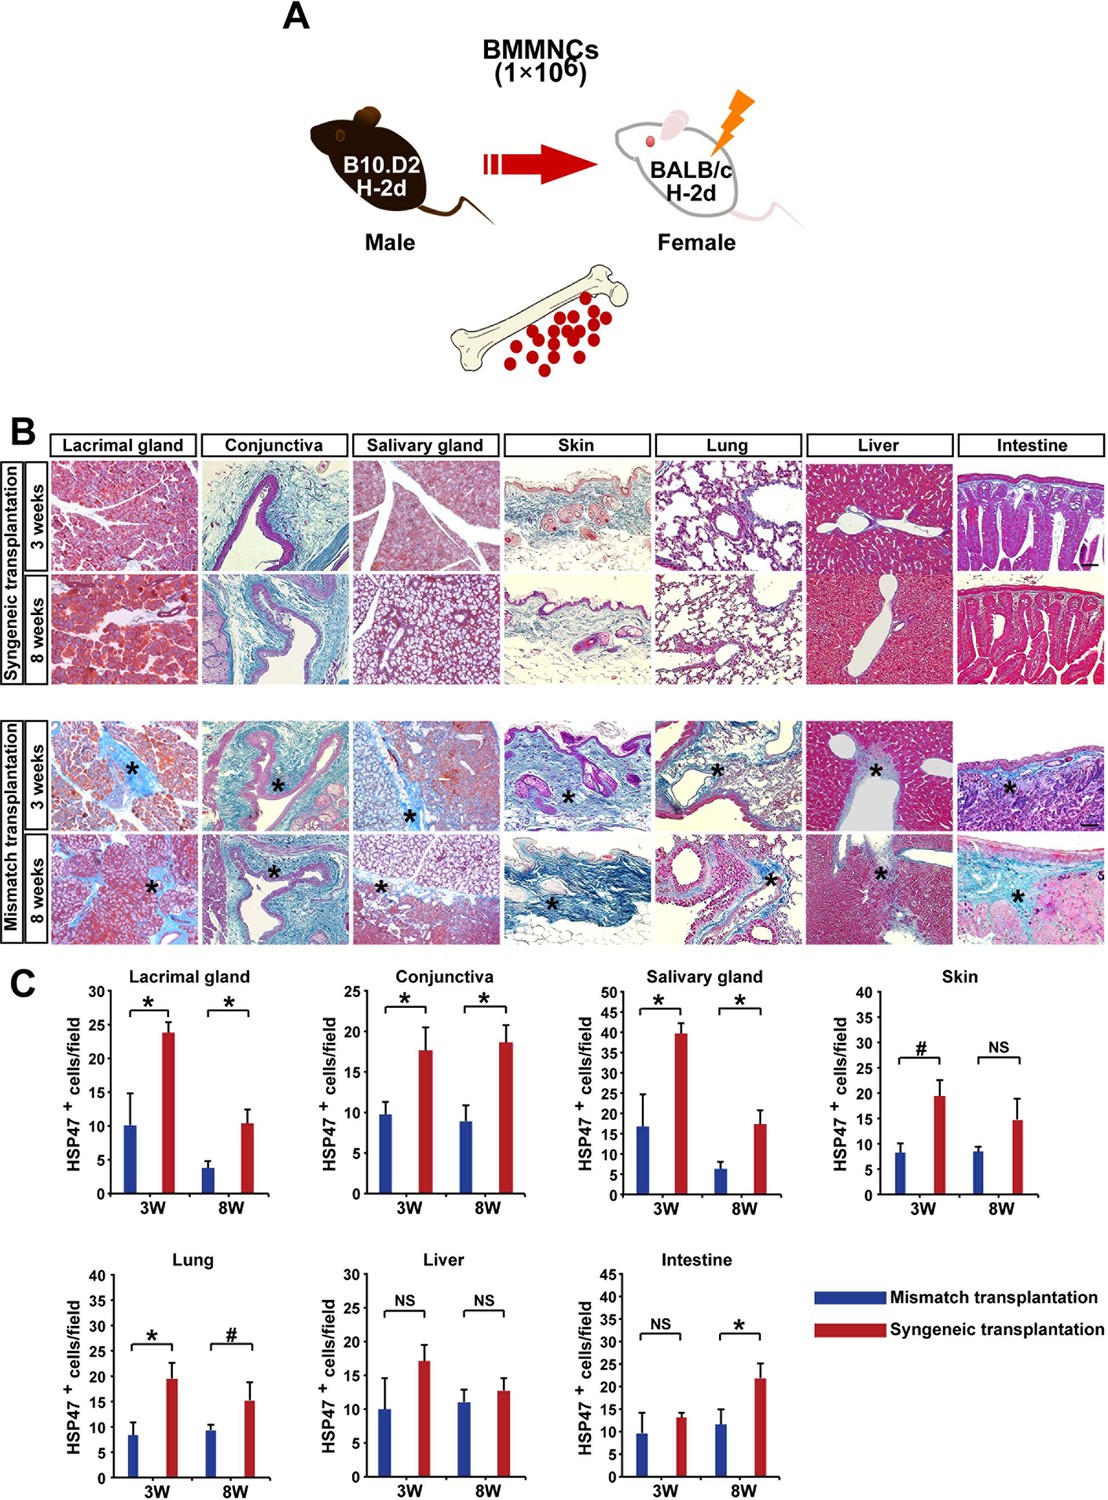
Autoimmune-associated fibrosis following whole bone marrow transplantation in mouse model.
(A) Schematic diagram of MHC-compatible, multiple minor antigen (miHA)–incompatible model of scleroderma. BMMNCs: bone marrow mononuclear cells. (B) Histology of BALB/c recipients transplanted with syngeneic (BALB/c) or mismatched (B10.D2) WBM at 3 and 8 weeks after transplantation. Fibrosis shown by blue Mallory staining is more prominent in target organs of fibrosis. Representative data from 10 independent experiments (n = 4–5 per group) are shown. Scale bar, 100 μm (liver, 50 μm). Excessive fibrotic areas are shown in deep blue (*). (C) HSP47+ fibroblasts in the lacrimal glands, conjuntiva, salivary glands, skin, lung, and intestine were significantly higher following mismatched whole bone marrow transplantation (red) compared to syngeneic whole bone marrow transplantation (blue). Data are shown as mean ± SD. #p<0.05,*p<0.01. HSP, heat-shock protein; SD, standard deviation.
Figure 1—figure supplement 2
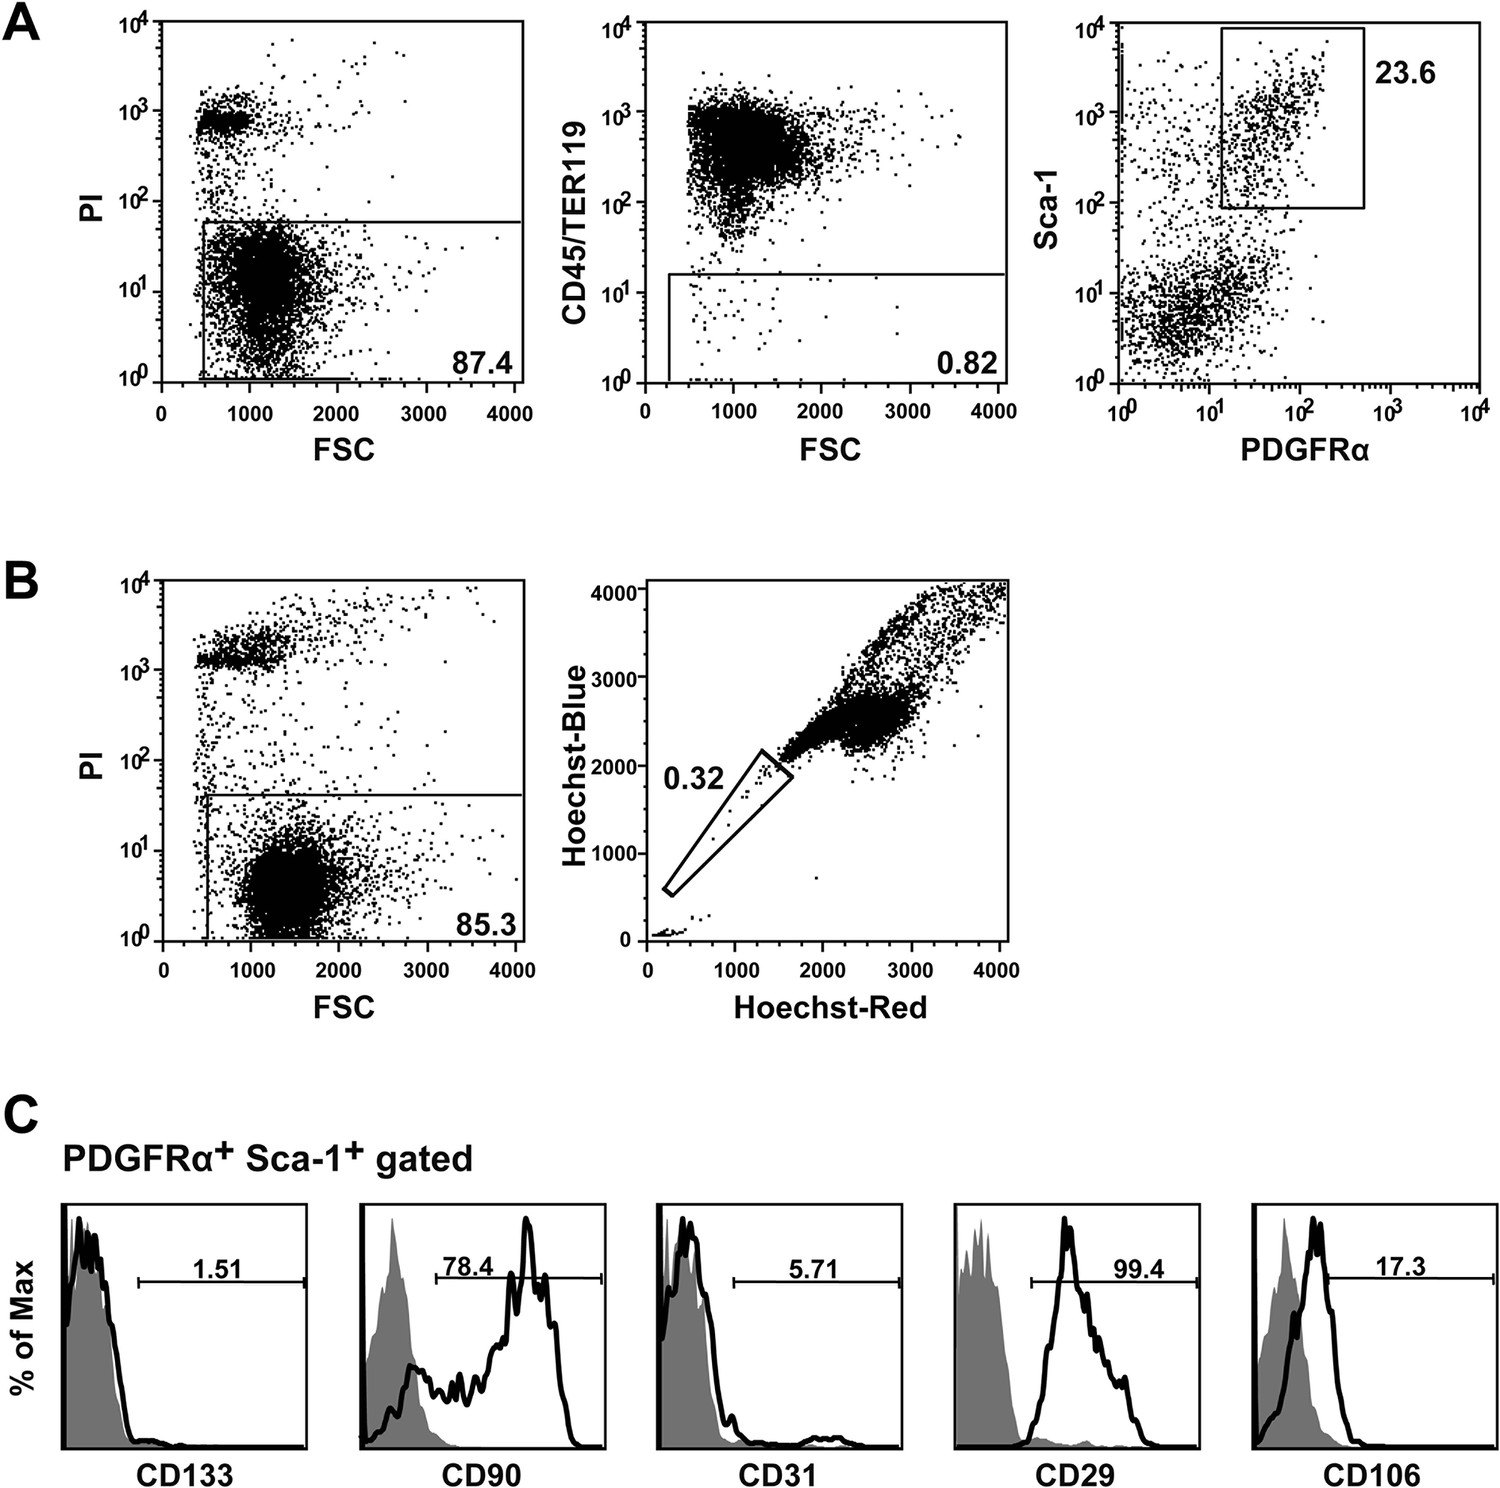
Flow cytometry protocol for Isolating BMSCs and HSCs.
(A, B) PαS-BMSCs (A) and SP-HSCs (B) were isolated from BMMNCs by flowcytometry as shown. (C) Characterization of PαS BMSCs by other BMSCs marker CD29, CD90, and CD106 and endothelial marker, CD31 and CD133 by flowcytometry. BMSCs, bone marrow stromal/stem cells; BMMNC, bone marrow mononuclear cells; HSCs, hematopoietic stem cells.
Figure 1—figure supplement 3
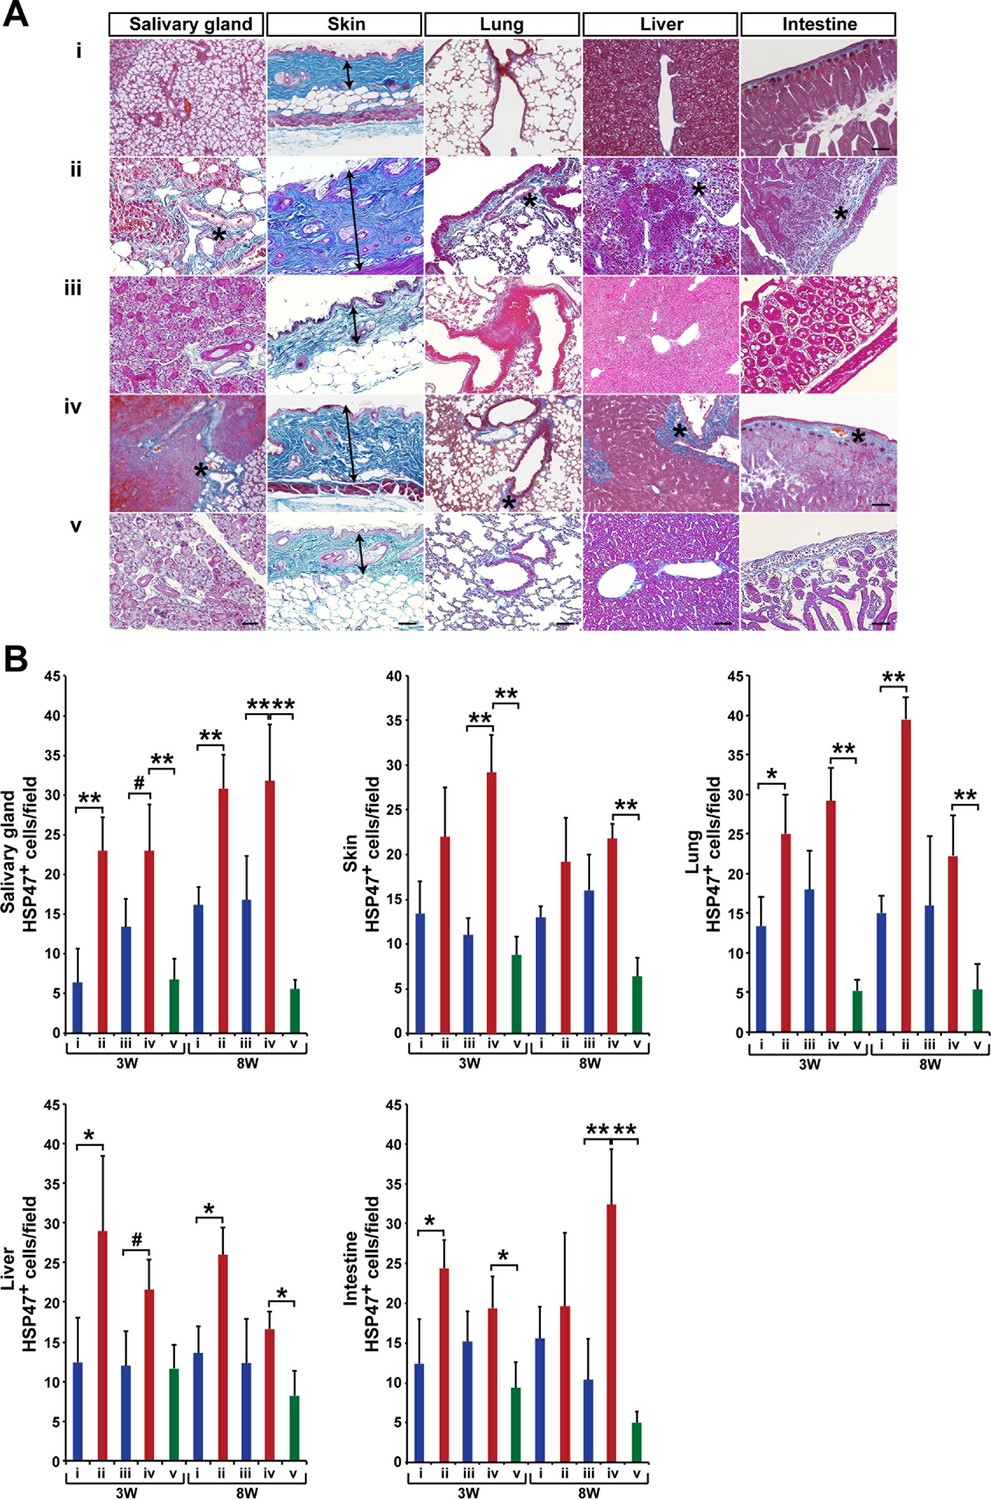
Modified SSc model by co-transplanting isolated HSCs and BMSCs in other target organs.
(A) Mallory staining of the salivary gland, skin, lung, liver, and intestine tissue sections of BALB/c mice that received mismatched (ii) or syngeneic (iii) BMSC transplantation and negative (i) or positive control (iv) at 3 weeks after transplantation. Mismatched BMSCs depletion from WBM transplantation (v). Excessive fibrotic areas are shown in (*). (B) The number of HSP47+ fibroblasts in negative control (i) (blue), and syngeneic BMSC transplantation (iii) (blue), and mismatched BMSC transplantation (ii) (red), and positive control (iv) (red), and mismatched BMSC-depleted WBMT (green). Double arrows in skin indicate the thickness of epidermal region leading to the loss of adipose tissue in the mismatched BMSC group. Error bars indicate SD. #p< 0.05, *p< 0.01, **p< 0.001. Scale bar, 100 μm. BMSCs, bone marrow stromal/stem cells; HSCs, hematopoietic stem cells; HSP, heat-shock protein; SSc, systemic sclerosis.
Figure 1—figure supplement 4
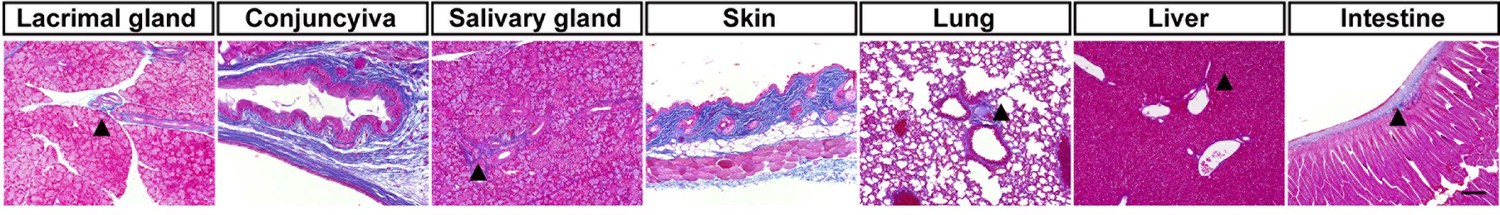
Mallory staining of normal organs.
Minimally blue stained areas by Mallory staining (▲) in normal tissues including the lacrimal gland, conjunctiva, salivary gland, skin, lung, liver, and intestine. Scale bar, 50 μm.
Figure 2 with 1 supplement
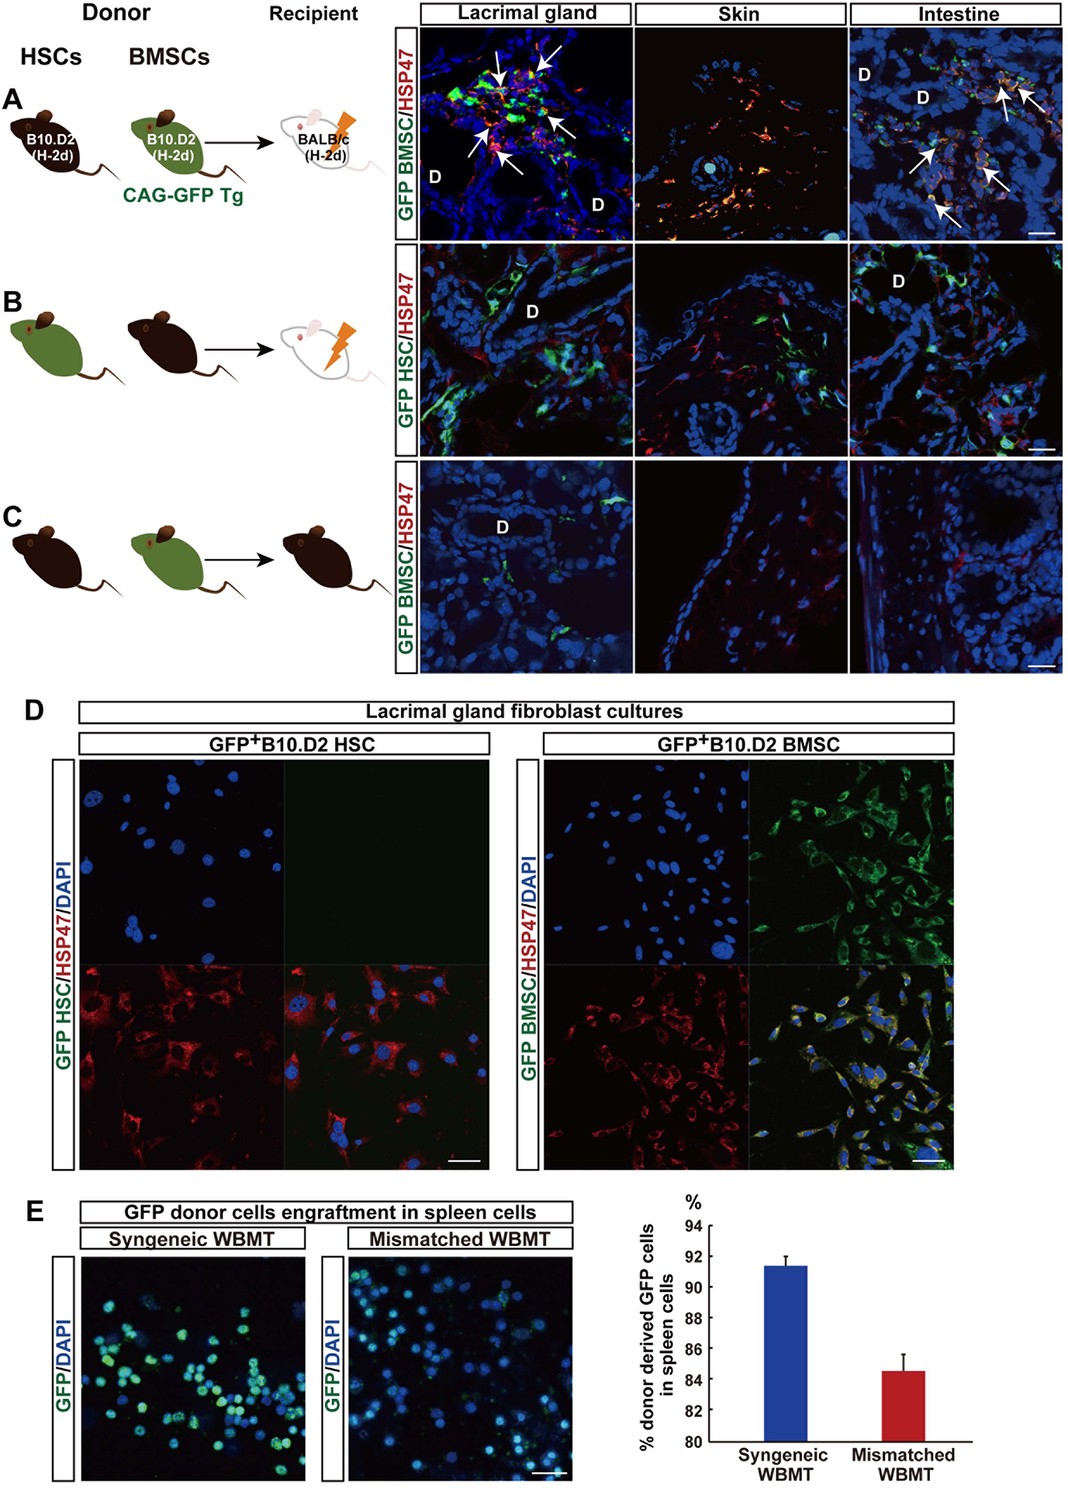
Mismatched donor derived-fibroblasts engrafted in target tissues of fibrosis.
(A, B) Transplantation scheme of EGFP+-labeled B10.D2 PαS-BMSCs (A) or SP-HSCs (B). Each was co-transplanted into wild-type BALB/c mice along with unlabeled SP-HSCs (A) or PαS-BMSCs (B), respectively. Arrows indicate colocalized cells in yellow (GFP-labeled BMSCs expressed HSP47) in the lacrimal gland and intestine. (C) Syngeneic wild-type B10.D2 SP-HSCs and EGFP+-labeled B10.D2 PαS-BMSC co-transplantation into wild B10.D2 mice. HSP47+ (red) fibroblasts observed in mismatched BALB/c recipients were BMSC-derived, and not HSC cells. Nuclei were counter stained with DAPI (blue). The data in Figure 2A–C from two replicate experiments (n = 3 per group). Scale bar, 20 μm. (A–C) D, duct. (D) Cultured HSP47+ lacrimal gland fibroblasts after mismatched EGFP+ HSC transplantation were EGFP- (left), while the majority of fibroblasts after mismatched EGFP+ BMSC transplantation were EGFP+ fibroblasts (right, positive cells in yellow) indicating the donor BMSC origin of fibroblasts. (E) Donor–derived EGFP+ cells were observed in the spleen 3 weeks after syngeneic EGFP+ WBMT (left), while engraftment of donor cells were sparse following mismatched WBMT (right), indicating a number of residual host cells remained after mismatched WBMT. Figure 2D,E from representative data of two replicate experiments (n = 2 or 3 per group). Scale bar, D = 50 μm, E = 20 μm. BMSC, bone marrow stromal/stem cells; HSP, heat-shock protein; HSCs, hematopoietic stem cells
-
Figure 2—source data 1
Percentage of donor–derived EGFP+ cells in the spleen 3 weeks after EGFP+ WBMT.
Source data for graph in right panel of Figure 2E.
- https://doi.org/10.7554/eLife.09394.014
Figure 2—figure supplement 1
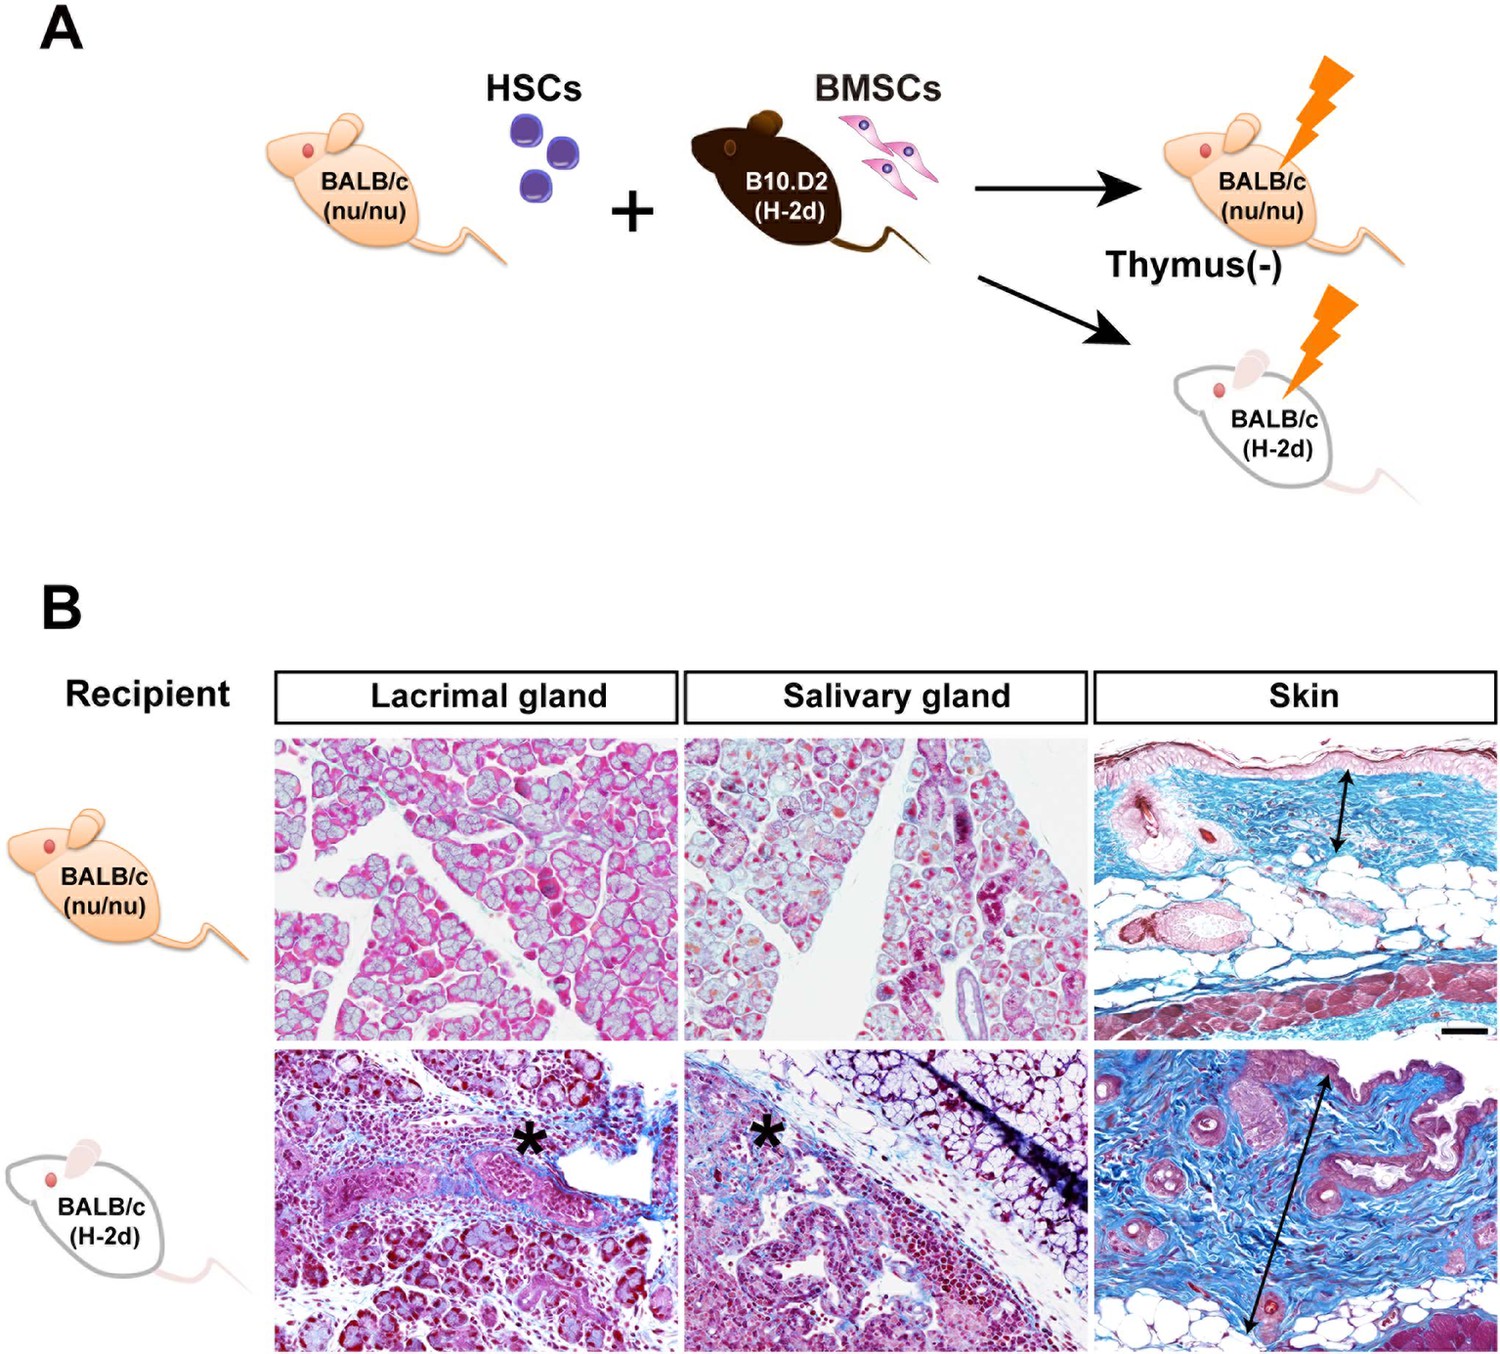
Mismatched PαS-BMSCs do not induce sclerodermatous fibrosis in recipient nude mice.
(A) Transplantation scheme of B10D.2 (Mismatched) PαS-BMSCs and BALB/c-nu/nu (Syngeneic) SP-HSCs into nu/nu or wild type BALB/c. (B) Mallory staining of the lacrimal gland, salivary gland, and skin in BALB/c-nu/nu (top) and wild-type (bottom) recipient mice lacrimal gland and salivary gland at 3 weeks and skin at 8 weeks after transplantation. Data collected from two replicate experiments (n = 3 per group). Scale bar, 50 μm. *, areas of lymphocytic infiltration and excessive fibrosis in deep blue, double arrow; thickness of epidermis. BMSC, bone marrow stromal/stem cells; HSC, hematopoietic stem cells
Figure 3
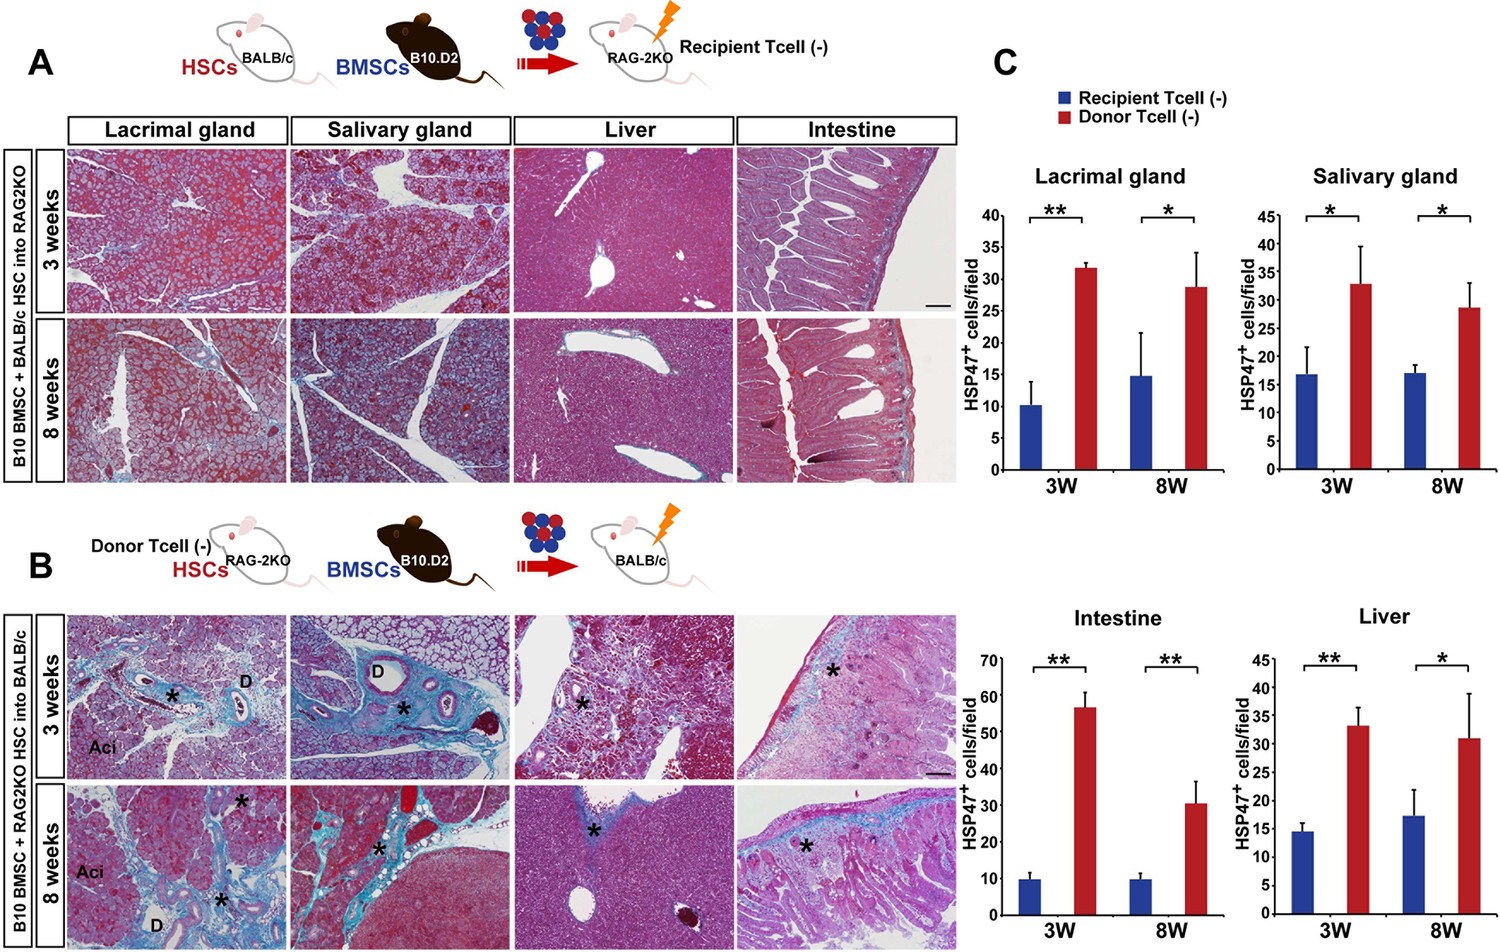
Host T cells are required for the progression of fibrosis.
(A) Mallory staining of recipient RAG2KO organs shows that transplantation of mismatched BMSCs did not induce fibrosis in the absence of recipient T cells. Scale bar, 100 μm. (B) Tissue inflammation and excessive fibrosis in deep blue (*) was observed in BALB/c recipient mice after B10.D2 BMSC and RAG2KO HSC transplantation, despite the lack of donor T cells. Data collected from two replicate experiments (n = 3 per group). Scale bar, 100 μm. (A, B) D, duct; Ac, Acinus. (C): Significantly higher number of HSP47+ fibroblasts was observed in BALB/c recipients after B10 BMSC + RAG2KO HSC transplantation (red) compared to RAG2KO recipients after B10 BMSC + BALB/c HSC transplantation (blue). Data from five different fields in two replicate experiments. Data are shown as mean ± SD. *p<0.01, **p<0.001.
-
Figure 3—source data-1
Number of HSP47+ cells per field from the lacrimal gland, salivary gland, liver, and intestine.
Source data for graphs in (C). HSP, heat-shock protein.
- https://doi.org/10.7554/eLife.09394.017
Figure 4 with 1 supplement
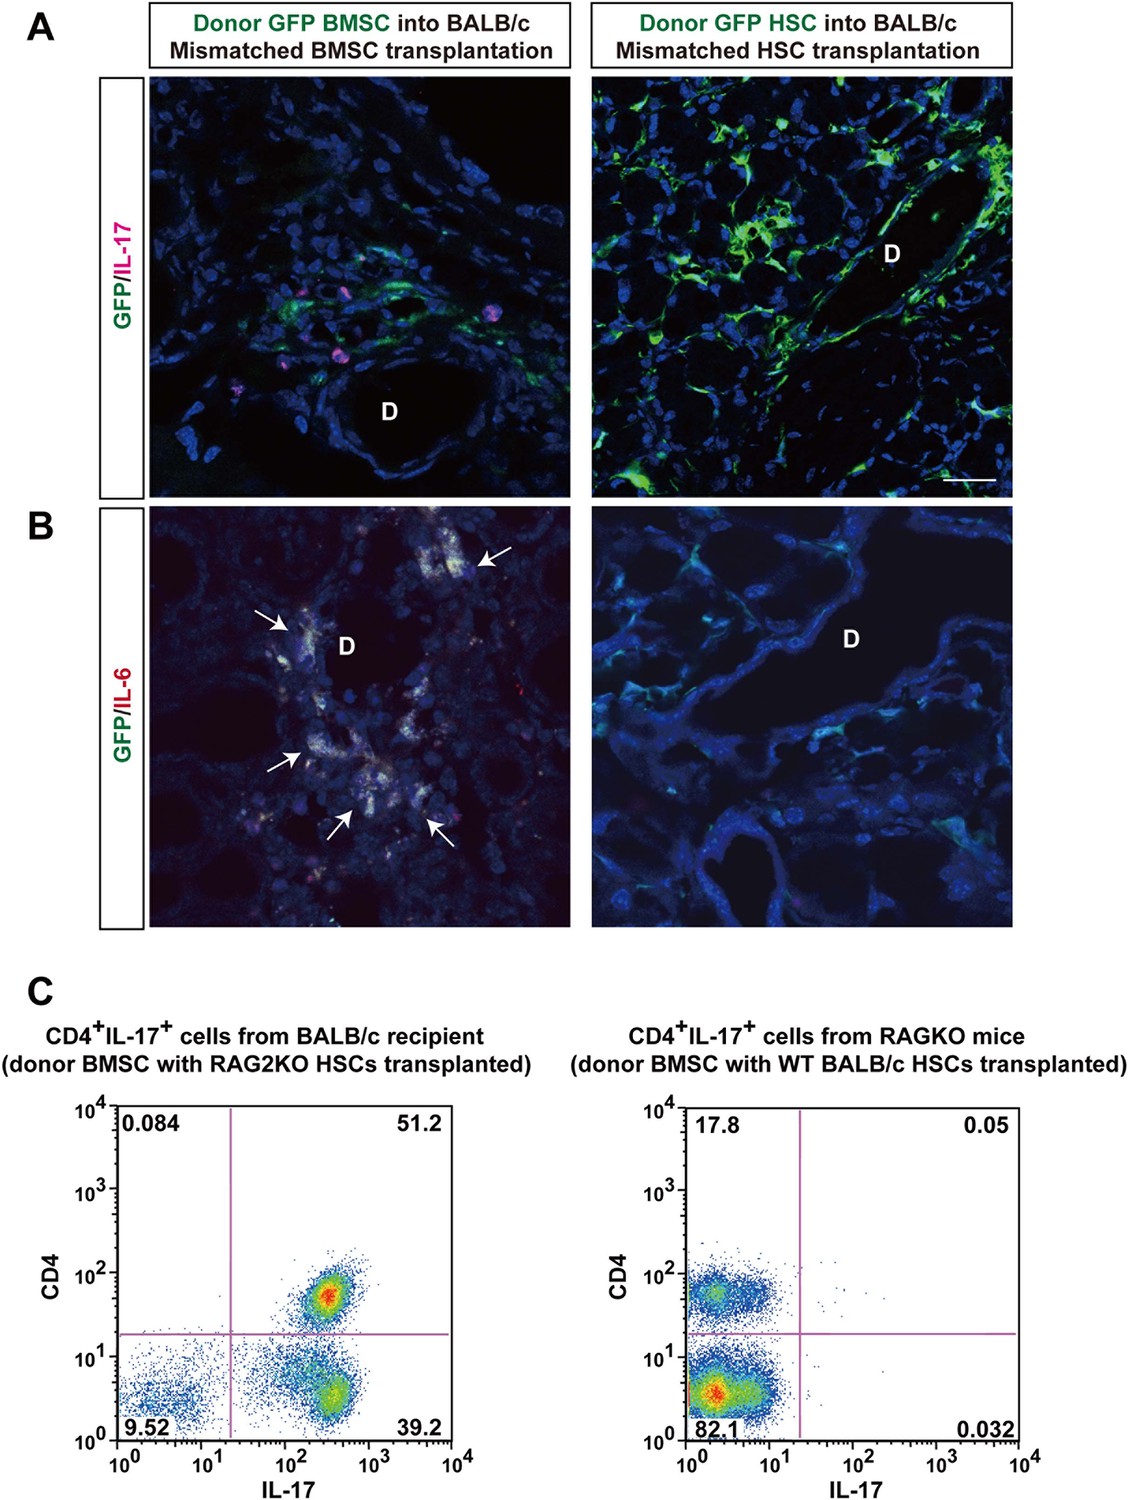
Donor BMSCs interact with recipient Th 17 cells and produce IL-6.
(A, B) Th 17 cells (pink in A) and IL-6-producing cells (yellow in left panel of Figure 4B, arrows) were observed in the lacrimal gland of mismatched BMSC transplanted mice 8 weeks after transplantation. Yellow cells in (B) are due to co-localization of IL-6 (red) and donor BMSCs (GFP), resulting in yellow. Mismatched HSC transplanted mice did not show co-localization of donor cells (green) with IL-6 nor IL-17-producing cells. Representative images from two replicate experiments (n = 3 per group). Scale bar, 20 μm. (C) CD4+IL-17+ cells comprised more than 50% of splenic cells from B10.D2 BMSC + RAG2KO HSCs transplanted BALB/c recipients (left), while the ratio was low in spleens from B10.D2 BMSC + BALB/c HSC transplanted RAG2KO recipients (right). BMSC, bone marrow stromal/stem cells; HSC, hematopoietic stem cells.
Figure 4—figure supplement 1
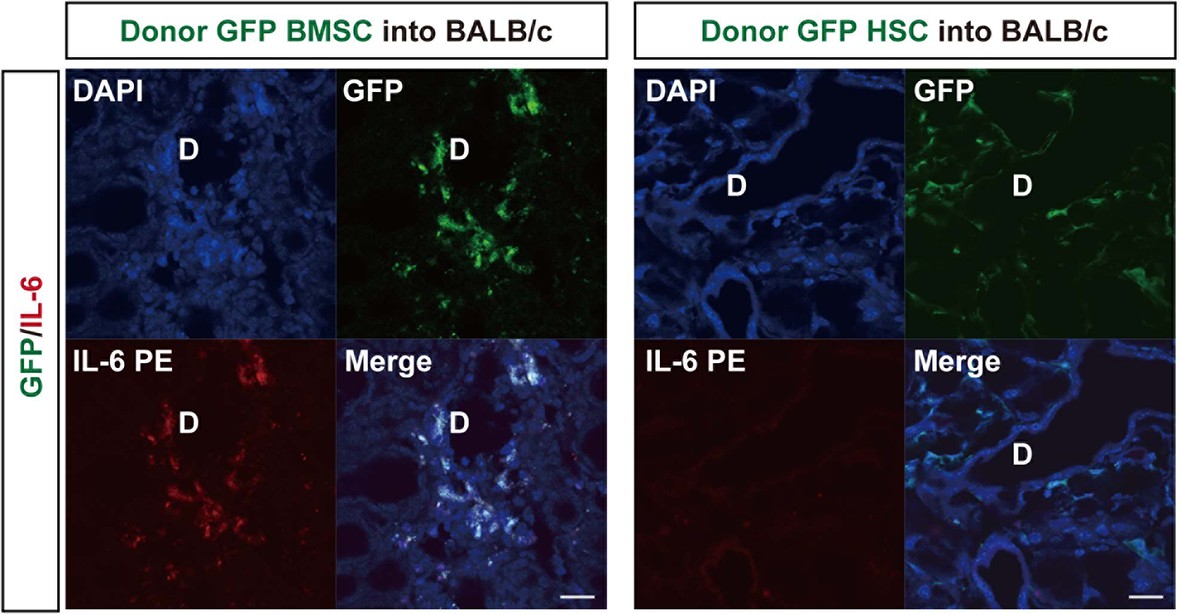
GFP donor MSCs produce IL-6.
Split images of IL-6 immunostaining and GFP+ donor MSC/ HSC into BALB/c Mismatched MSC-transplanted recipient lacrimal gland (left) and mismatched HSC-transplanted recipient lacrimal gland (right) from Figure 4B.
D, Duct. Scale bar, 20 μm. HSC, hematopoietic stem cells
Figure 5 with 1 supplement

Adoptive transfer of recipient T cells from mismatched BMSC- transplanted recipients into BALB/c background Nude mice induce disease.
(A) Adoptive transfer of BALB/c T cells from mismatched BMSC-transplanted mice induced excessive fibrosis accompanied by numerous inflammatory cells in the lacrimal gland of naive nude mice, as shown by Mallory staining (excessive fibrotic area in deep blue [*]). Scale bar, 100 μm. Data collected from two replicate experiments (n = 4 per group). (B) The number of HSP47+ fibroblasts was significantly higher in various target organs following adoptive transfer of BALB/c T cells from mismatched BMSC recipients into nude mice (red), compared to wild-type (WT) nude mice (blue). Data are shown as mean ± SD. *p<0.005, **p<0.001. (C) CD4+ Th 17+ splenic cells were markedly elevated from adoptively transferred nude mice (left), compared to WT BALB/c background nude mice (right) (n = 4 each). (D) 1L-17 concentration in the serum from the same mice of the experiments shown in Figure 4C (n = 4 each). Data from one of two independent experiments (A,D). BMSC, bone marrow stromal/stem cells; HSP, heat-shock protein.
-
Figure 5—source data 1
Number of HSP47+ cells in various target organs following adoptive transfer of BALB/c T cells from mismatched BMSC recipients into nude mice.
Data from the lacrimal gland, conjunctiva, salivary gland, lung, skin, liver, and intestine as shown in (B). BMSC, bone marrow stromal/stem cells; HSP, heat-shock protein.
- https://doi.org/10.7554/eLife.09394.021
-
Figure 5—source data 2
1L-17 concentration in the serum from adoptively transferred nude mice, compared to WT BALB/c background nude mice.
Source data for graph in (D). WT, wild type.
- https://doi.org/10.7554/eLife.09394.022
Figure 5—figure supplement 1
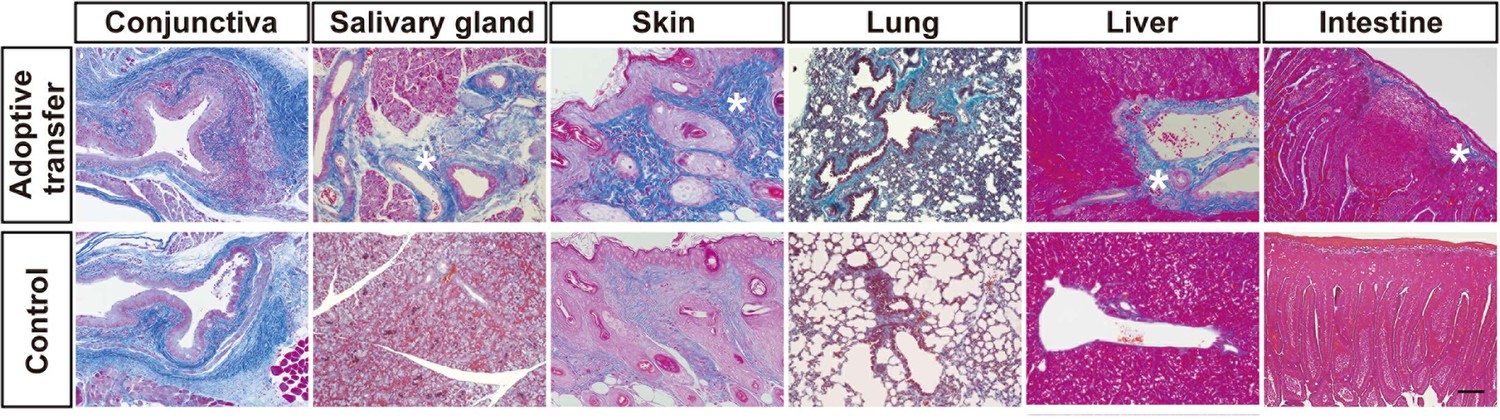
Adoptive transfer of recipient T cells from mismatched BMSC-transplanted recipients into BALB/c background Nude mice induce disease in target organs other than the lacrimal glands.
(A) Mallory staining of the conjunctiva, salivary gland, skin, lung, liver, and intestine tissue sections of BALB/c mice that received adoptive transfer and control. Excessive fibrotic areas are shown in deep blue (∗). BMSC, bone marrow stromal/stem cells
Figure 6
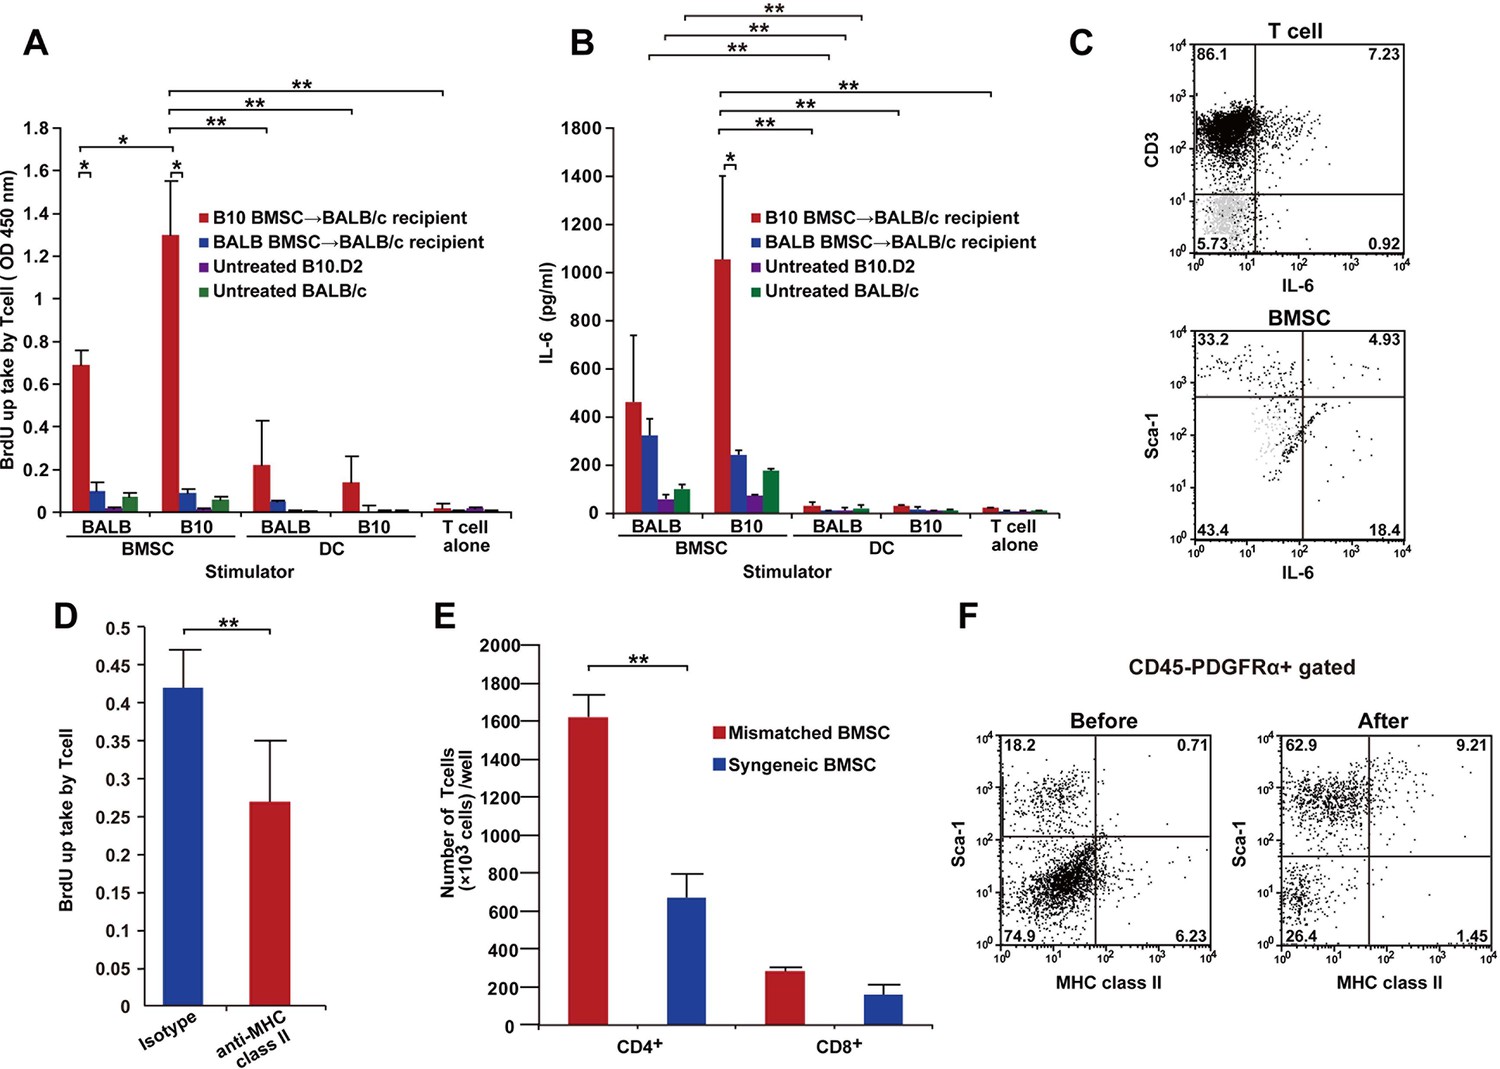
T cells following mismatched BMT are activated by PαS-BMSCs.
(A, B) T cells isolated from mismatched BMSC-transplanted recipients proliferated when co-cultured with donor BMSCs (A), which was significantly blocked by anti-MHC class II antibody treatment (D). (B) Increased IL-6 production was observed following co-culture of T cells from mismatched BMSC-transplanted recipients with donor PαS-BMSCs, but not with splenic dendritic cells (DCs). Color bars indicate source of T cells. Results are from triplicate cultures of two independent experiments in both (A) and (B) and from quintupulicate of two independent experiments in (D). Data are shown as mean ± SD. *p<0.05, **p<0.01. (C) Both CD3+ T cells and Sca-1+ BMSCs produced IL-6 following co-culture described in (A). Dot plots of mismatched BMSCs-transplanted recipient samples are shown in black, and isotype control in light grey. (E) The increase in T cell proliferation under co-culture with mismatched BMSCs (red) was due to the activation of CD4+ and not CD8+ T cells. Data collected from triplicate cultures of two replicate experiments (n = 2 per group). Data are shown as mean ± SD. **p<0.01. (F) MHC class II expression was upregulated in BMSCs after co-culture with T cells from mismatched BMSC-transplanted recipients. BMT, bone marrow transplantation; BMSC, bone marrow stromal/stem cells; SD, standard deviation.
-
Figure 6—source data 1
T cell proliferation after co-culturing of donor or recipient BMSCs and splenic dendritic cells (DC).
Sheet 1 shows the OD source values for each group in (A). Sheet 2 shows collective data and SD for graph in (A). BMSC, bone marrow stromal/stem cells.
- https://doi.org/10.7554/eLife.09394.025
-
Figure 6—source data 2
IL-6 production following co-culture of T cells from various sources with donor or recipient BMSCs and splenic dendritic cells (DCs).
Sheet 1 shows the concentration of IL-6 in each group shown in (B). Sheet 2 shows raw OD values prior to conversion to concentrateon.
- https://doi.org/10.7554/eLife.09394.026
-
Figure 6—source data 3
T cells proliferation blocked by anti-MHC class II antibody treatment.
Source data for graph in (D).
- https://doi.org/10.7554/eLife.09394.027
-
Figure 6—source data 4
CD4+ T cells and CD8+T cells proliferation under co-culture with syngeneic or mismatched BMSCs.
Source data for graph in (E).
- https://doi.org/10.7554/eLife.09394.028
Figure 7
Autoimmune phenotype following mismatched BMSC transplantation.
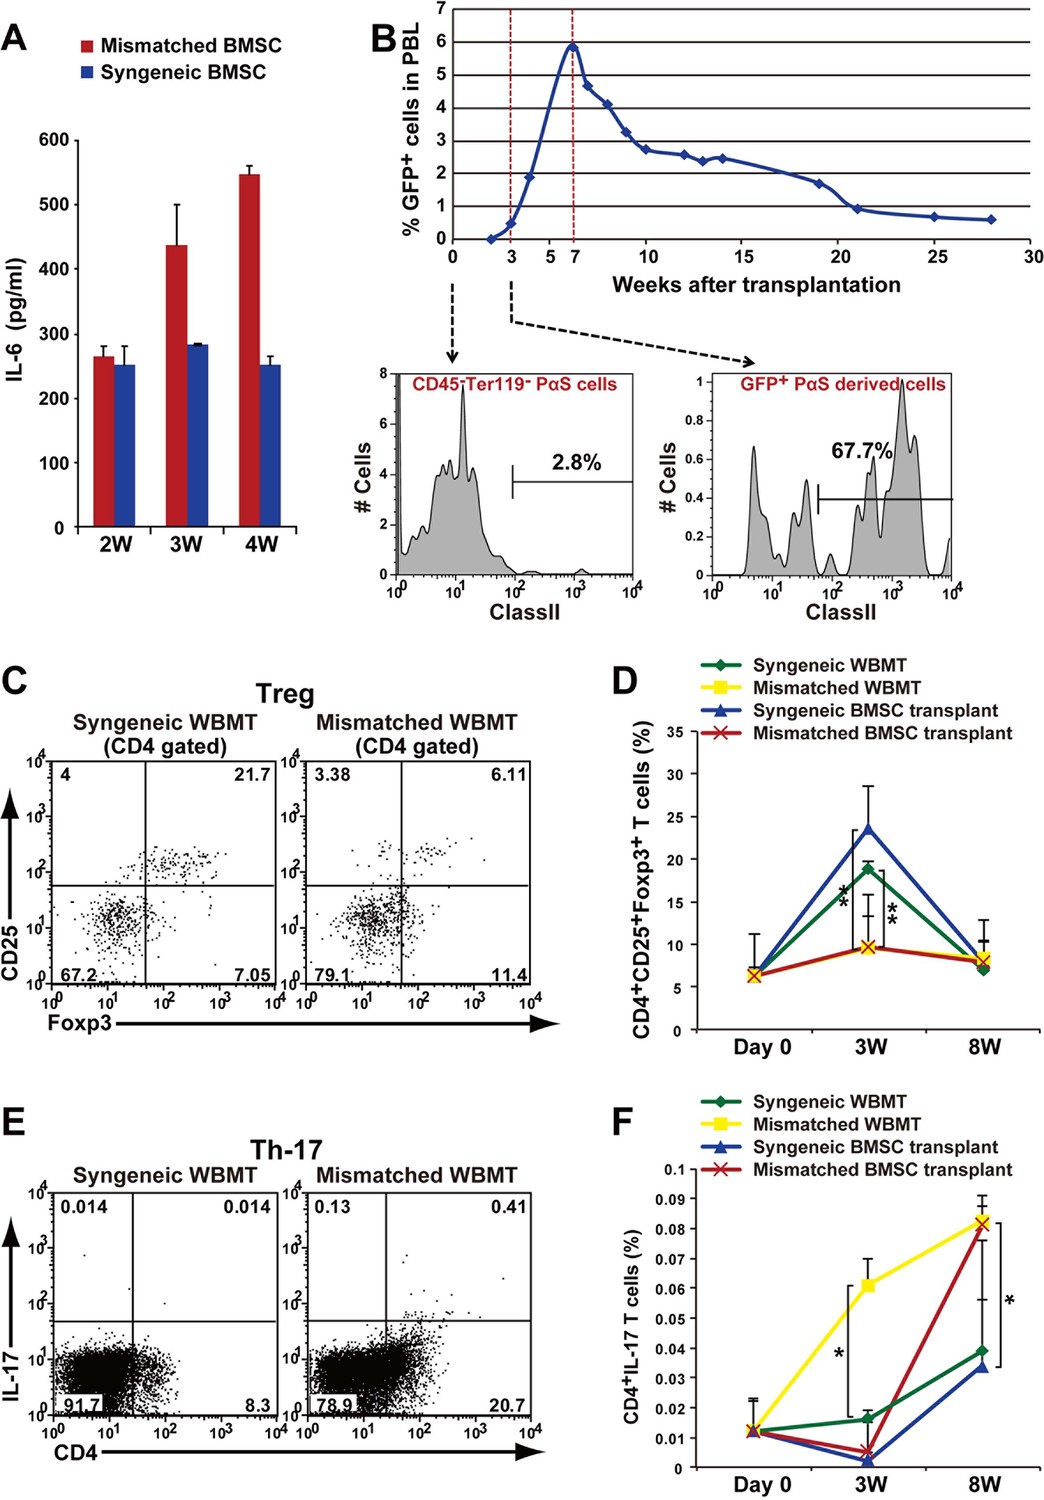
(A) Serum IL-6 concentration increased after mismatched BMSC transplantation (red) compared to syngeneic control (blue). Duplicate experiments. Data are shown as mean ± SD, n = 2. (B) GFP+ donor BMSCs appear in peripheral blood mononuclear cells after mismatched BMSCs transplantation, and peaks at approximately 7 weeks. The percentage of BMSCs expressing MHC class II antigen increases following transplantation. (C) CD4+ CD25+ Foxp3+ Tregs were suppressed in the spleen after mismatched WBMT transplantation (right) compared to syngeneic control (left). (D) CD4+CD25+Foxp3+ Tregs were suppressed in both mismatched WBMT (yellow) and mismatched BMSC transplantation (red) compared to syngeneic WBMT (green) or syngeneic BMSCs transplantation (blue). Data are shown as mean ± SD, triplicate experiments, n = 3–5, **p<0.01. (E, F) The ratio of CD4+ IL-17+ T cells in the spleen was significantly higher following mismatched WBMT (yellow) or mismatched BMSC transplantation (red) compared to syngeneic control (green and blue). Data are shown as mean ± SD, triplicate experiments, n = 3–5, *p<0.05. BMSCs, bone marrow stromal/stem cells; SD, standard deviation.
-
Figure 7—source data 1
Serum IL-6 concentration after mismatched BMSC transplantation compared to syngeneic BMSC transplantation.
Data are from 2, 3, and 4 weeks after mismatched and syngeneic BMSC transplantation shown in (A).
- https://doi.org/10.7554/eLife.09394.030
-
Figure 7—source data 2
Serial changes of CD4+CD25+Foxp3+ Tregs in spleen cells.
Raw data and average values for statistical analysis use in (D) are shown.
- https://doi.org/10.7554/eLife.09394.031
-
Figure 7—source data 3
The ratio of CD4+ IL-17+ T cells in the spleen cells.
Raw data and average values for statistical analysis used in (E) are shown.
- https://doi.org/10.7554/eLife.09394.032
Download links
A two-part list of links to download the article, or parts of the article, in various formats.
Downloads (link to download the article as PDF)
Open citations (links to open the citations from this article in various online reference manager services)
Cite this article (links to download the citations from this article in formats compatible with various reference manager tools)
MHC-compatible bone marrow stromal/stem cells trigger fibrosis by activating host T cells in a scleroderma mouse model
eLife 5:e09394.
https://doi.org/10.7554/eLife.09394


