Precise let-7 expression levels balance organ regeneration against tumor suppression
- University of Texas Southwestern Medical Center, United States
- The First Affiliated Hospital of Sun Yat-Sen University, China
- Boston Children's Hospital and Dana Farber Cancer Institute, United States
- Harvard University, United States
- Harvard Medical School, United States
- Howard Hughes Medical Institute, Boston Children’s Hospital, United States
- University of Pittsburg, United States
- Genome Institute of Singapore, Singapore
Figures
Figure 1 with 1 supplement
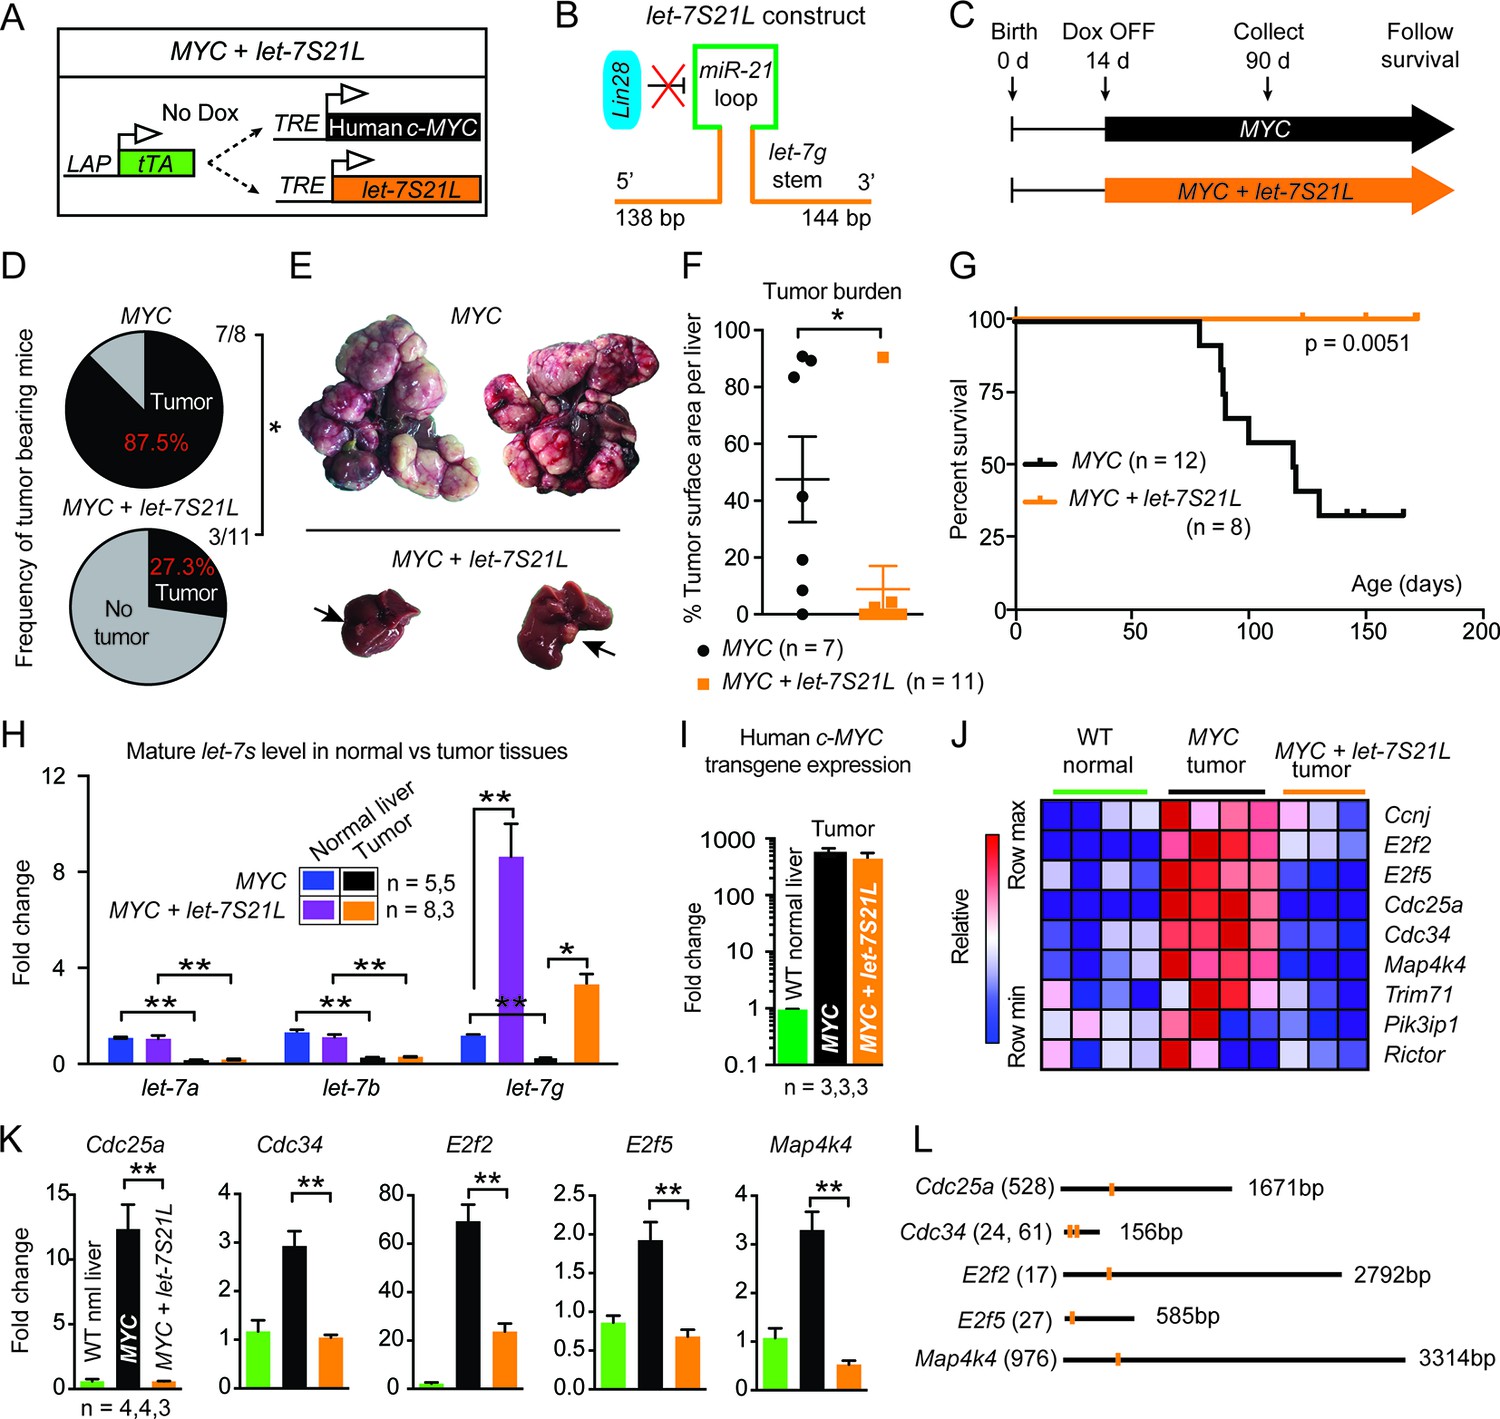
let-7g inhibits the development of MYC-driven hepatoblastoma.
(A) Schema of the liver-specific inducible LAP-MYC +/- let-7S21L cancer model. (B) let-7S21L is a chimeric construct containing the let-7g stem, miR-21 loop, and let-7g flanking sequences. (C) Schema showing that LAP-MYC +/- let-7S21L mice were induced at 14 days of age, tissues were collected at 90 days of age, and survival was followed. (D) Ninety-day old mice bearing tumors in the LAP-MYC (87.5%, 7/8) and LAP-MYC + let-7S21L (27.3%, 3/11) mouse models. (E) Livers showing tumors from the above mice. (F) Liver surface area occupied by tumor. (G) Kaplan-Meier curve of LAP-MYC alone and LAP-MYC + let-7S21L mice. (H) Mature let-7 expression levels in as determined by RT-qPCR. (I) Human c-MYC mRNA expressionin tumors as determined by RT-qPCR. (J) Heat map of let-7 target gene expression in WT normal livers, MYC tumors, and MYC + let-7S21L tumors as measured by RT-qPCR. Red is higher and blue is lower relative mRNA expression. (K) Gene expression plotted as bar graphs to show relative changes. (L) Evolutionarily conserved let-7 target sites within 3’UTRs (Targetscan.org). All data in this figure are represented as mean ± SEM. *p < 0.05, **p < 0.01.
Figure 1—figure supplement 1
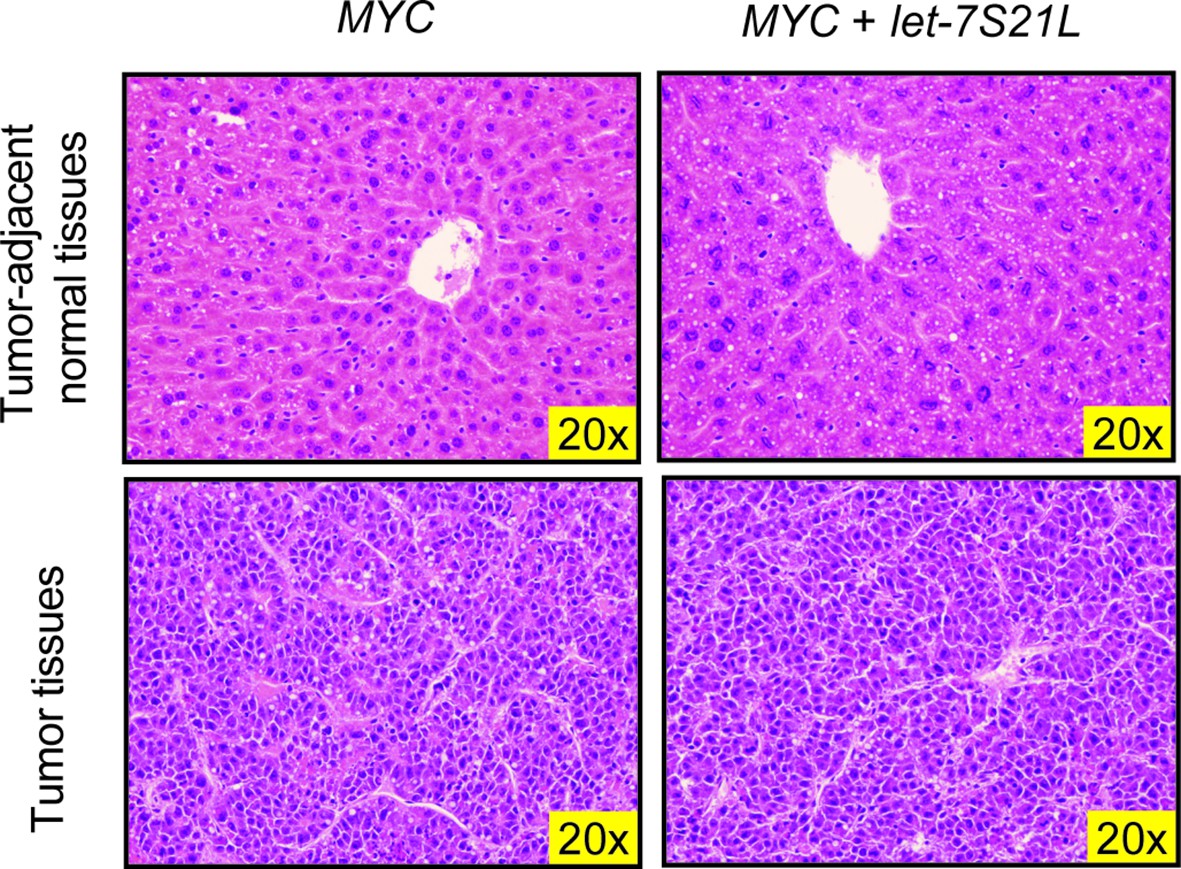
H&E staining of LAP-MYC and LAP-MYC + let-7S21L tumor-adjacent normal tissues and tumor tissues.
https://doi.org/10.7554/eLife.09431.004
Figure 2 with 1 supplement
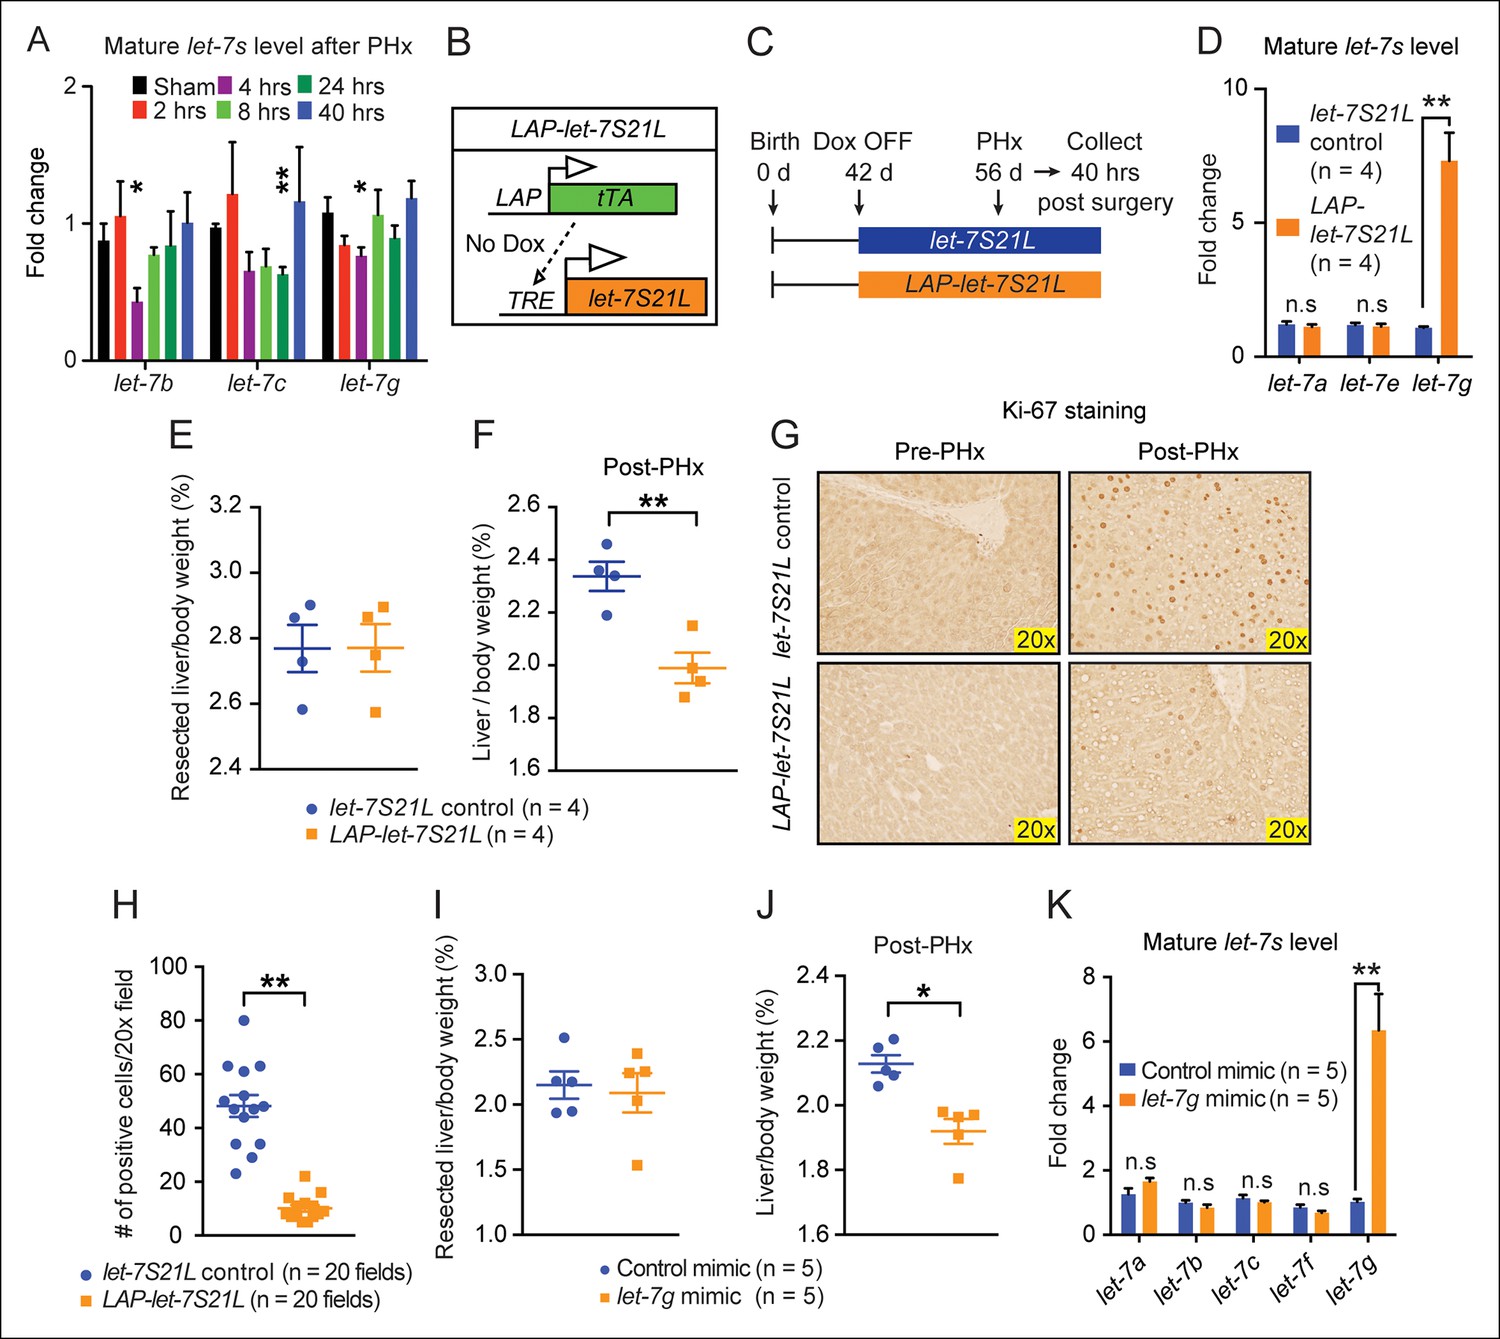
let-7g overexpression inhibits liver regeneration after partial hepatectomy.
(A) Mature endogenous let-7 expression levels in WT C57Bl/6 mice at different time points after PHx as determined by RT-qPCR (n=4 and 4 for each time point). (B) Schema of the LAP-let-7S21L dox-inducible model. LAP-tTA single transgenic mice served as the controls. (C) Schema showing that let-7S21L control and LAP-let-7S21L mice were induced at 42 days of age, PHx was performed after 14 days of induction, and tissues were collected 40 hr post PHx. (D) Mature let-7 expression levels in let-7S21L and LAP-let-7S21L livers after 14 days of induction (n=4 and 4). (E) Resected liver/body weight ratios of LAP-tTA Control and LAP-let-7S21L mice at the time of PHx (n=4 and 4). (F) Liver/body weight ratios 40 hr after PHx (n=4 and 4). (G) Ki-67 staining on resected and post-PHx liver tissues. (H) Quantification of Ki-67-positive cells (n=2 and 2 mice; ten 20x fields for each mouse were quantified). (I) Resected liver/body weight ratios 2 days after intravenous injection of 0.5 mg/kg negative control or let-7g microRNA mimics packaged in C12-200 LNPs (n=5 and 5). (J) Liver/body weight ratios 40 hr after PHx (n=4 and 4). (K) Mature let-7g expression levels in mimic treated livers (n=5 and 5). All data in this figure are represented as mean ± SEM. *p<0.05, **p<0.01.
Figure 2—figure supplement 1
Data associated with Figure 2.
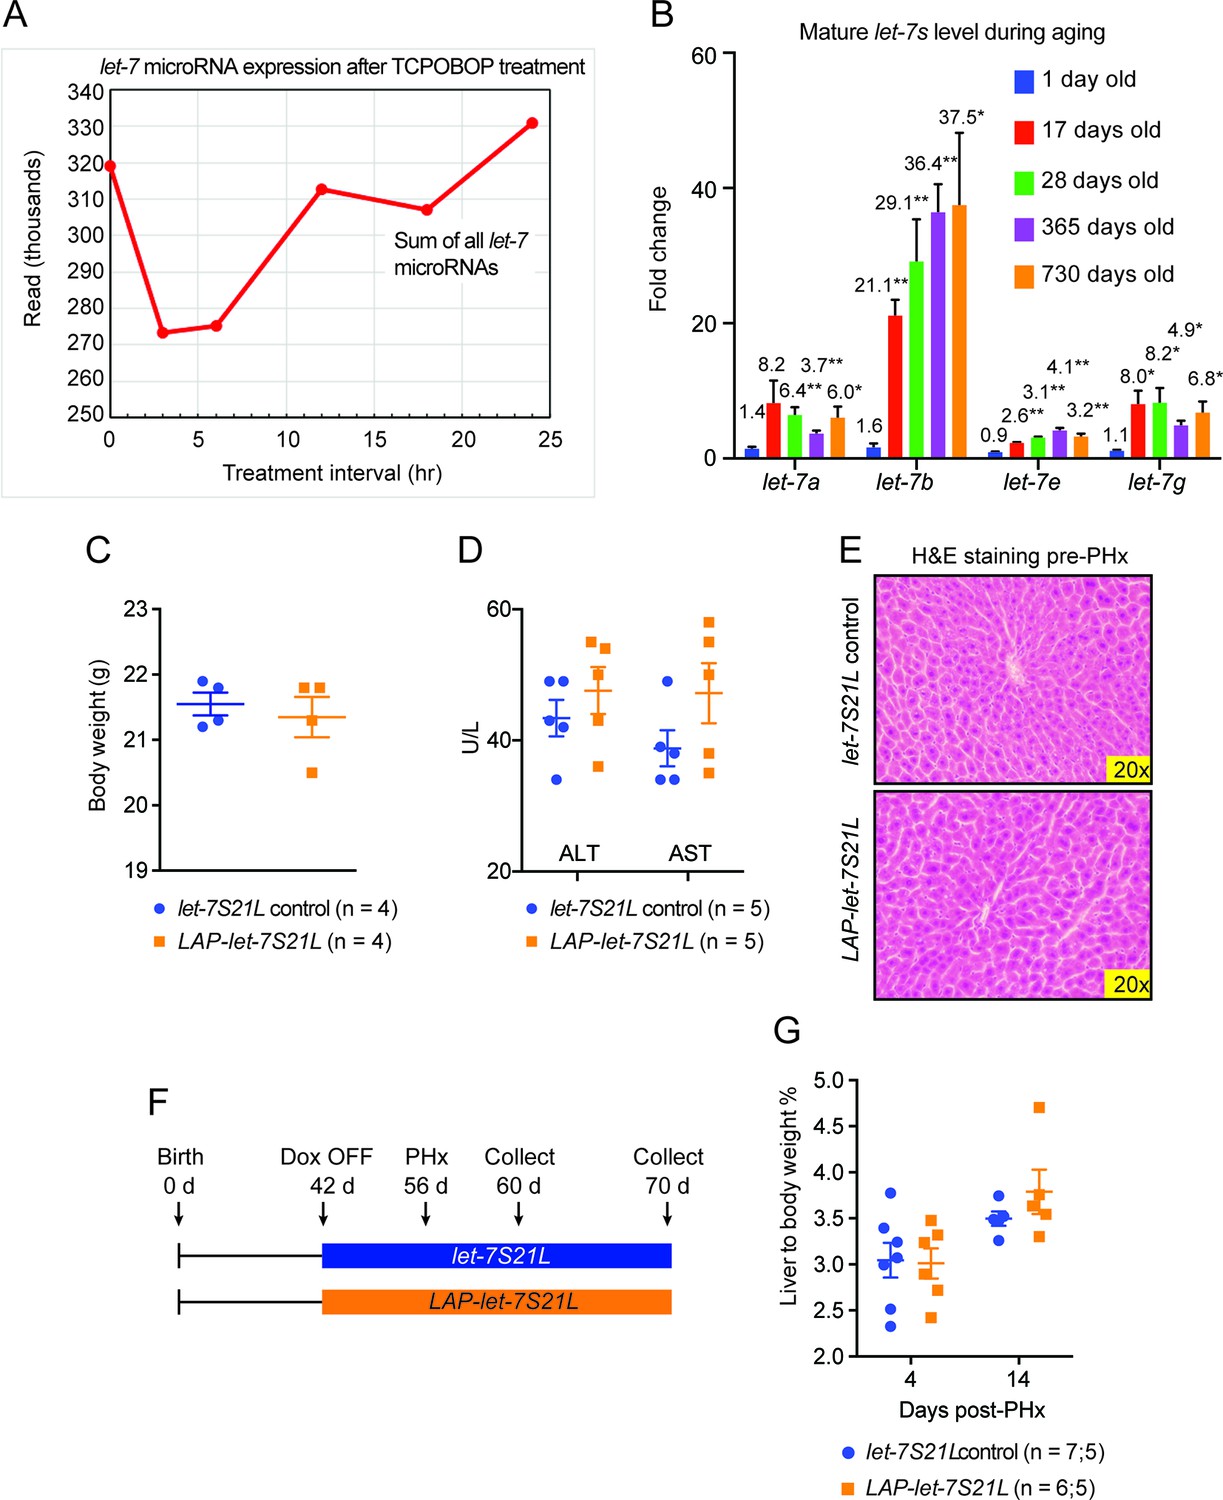
(A) Sum of the absolute sequencing reads for mature let-7 microRNA family members after TCPOBOP treatment, as measured by small RNA sequencing. (B) Mature let-7 microRNA family expression in WT mouse livers at different ages as determined by RT-qPCR. Numbers over bars indicate the fold change normalized to that of 1 day old mice. (C) Body weights of let-7S21L alone and LAP-let-7S21L mice pre-PHx (n=4 and 4). (D) Liver function tests: ALT (U/L) and AST (U/L) of let-7S21L alone and LAP-let-7S21L mice pre-PHx (n=5 and 5). (E) H&E staining of let-7S21L alone and LAP-let-7S21L mice pre-PHx. (F) Schema showing that let-7S21L control and LAP-let-7S21L mice were induced at 42 days of age, PHx was performed after 14 days of induction, and tissues were collected 4 and 14 days after PHx. (G) Liver to body weight ratio of let-7S21L alone and LAP-let-7S21L mice 4 and 14 days after PHx (n=5 and 5). All data in this figure are represented as mean ± SEM. *p<0.05, **p<0.01.
Figure 3 with 2 supplements
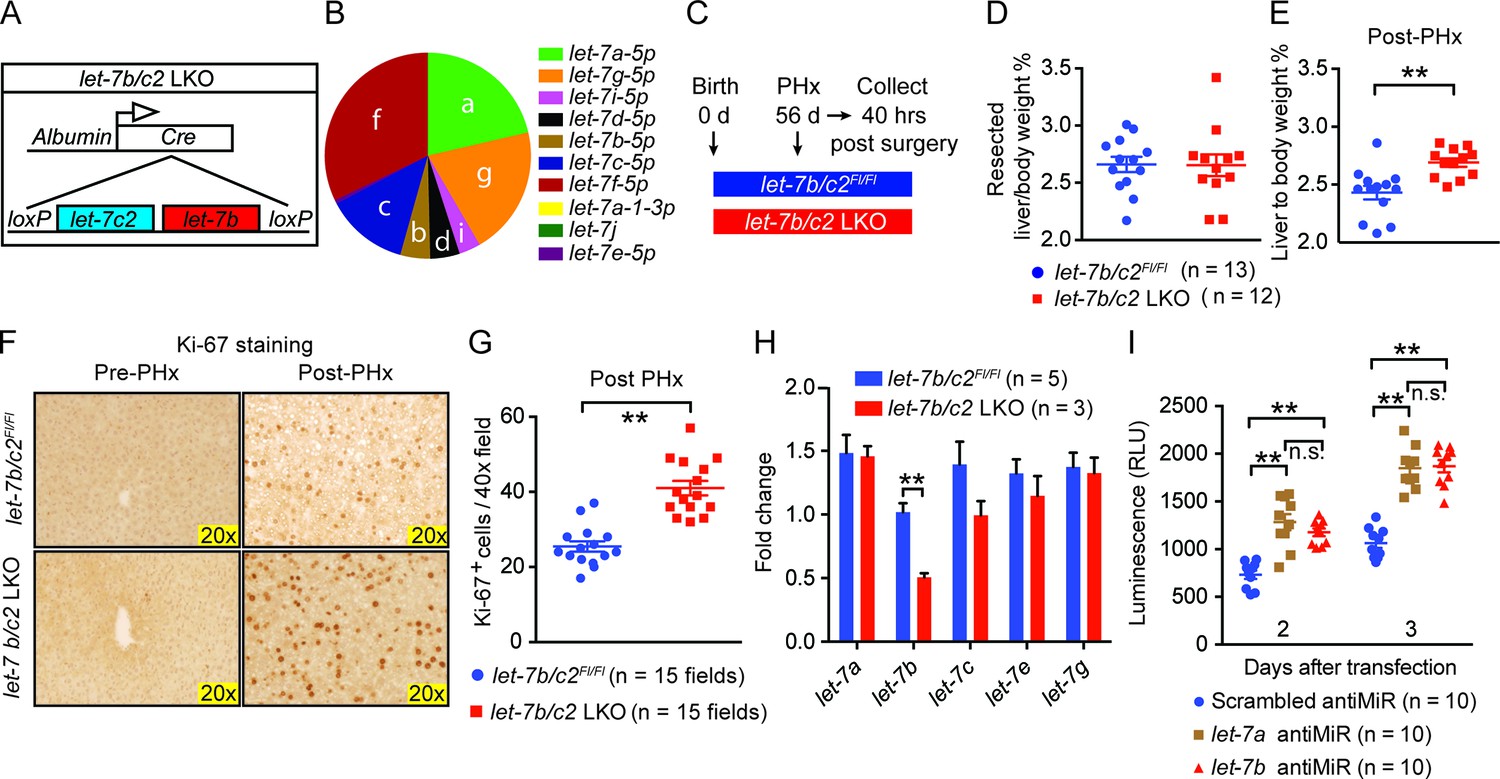
Loss of let-7b and let-7c2 is sufficient to enhance liver regeneration.
(A) Schema of liver-specific let-7b and let-7c2 knockout mice (let-7b/c2 LKO). Albumin-Cre excises loxPs in the embryonic liver of let-7b/c2Fl/Fl mice. Mice without Cre serve as the controls. (B) Small RNA sequencing showing the distribution of 10 let-7s in WT mice (n=2) (Data obtained from Xie et al. 2012). (C) Schema showing that PHx was performed on let-7b/c2Fl/Fl and let-7b/c2 LKO mice at 56 days of age and tissues were collected 40 hr post PHx. (D) Resected liver/body weight ratios at the time of PHx, and (E) Liver to body ratios of let-7b/c2Fl/Fl (n=11) and let-7b/c2 LKO mice (n=10) 40 hr after PHx. (F) Ki-67 staining and (G) Quantification of Ki-67-positive cells on resected and 40 hr post-PHx liver tissues (n=3 and 3 mice; total of five 40x fields/mouse were used for quantification). (H) RT-qPCR on let-7 family members from let-7b/c2Fl/Fl and let-7b/c2 LKO mice pre- and 40 hr post-PHx. (I) Viability of H2.35 immortalized human hepatocytes treated with either scrambled, let-7a, or let-7b antiMiRs, measured at two and three days after transfection (n=10 each). All data in this figure are represented as mean ± SEM. *p<0.05, **p<0.01.
Figure 3—figure supplement 1
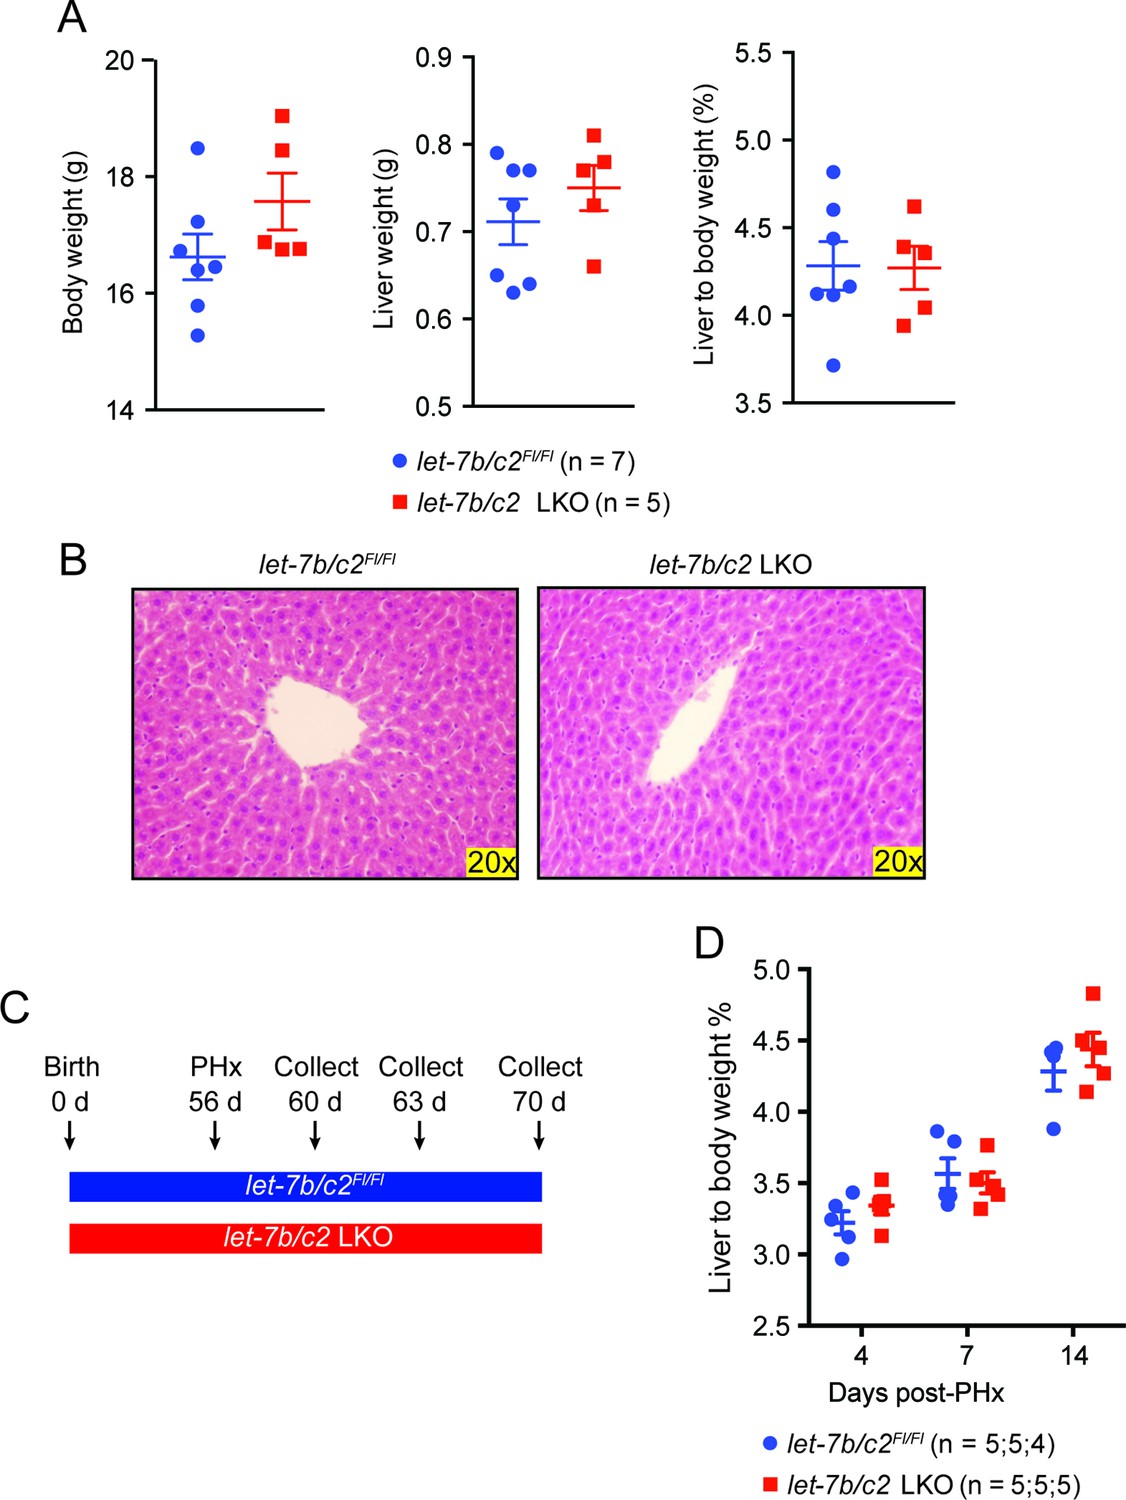
Characterization of let-7b/c2 LKO mice.
(A) Body weight, liver weight, and liver to body weight percent of let-7b/c2Fl/Fl (n = 7) and let-7b/c2 LKO mice (n=5) at 56 days of age. (B) H&E staining of let-7b/c2Fl/Fl (n=3) and let-7b/c2 LKO livers (n=3). (C) Schema showing that PHx was performed on let-7b/c2Fl/Fl and let-7b/c2 LKO mice at 56 days of age and tissues were collected at 4, 7, and 14 days post PHx. (D) Liver to body weight percent of let-7b/c2Fl/Fl (n=11) and let-7b/c2 LKO mice (n=10) 4, 7, and 14 days after PHx. All data in this figure are represented as mean ± SEM. *p<0.05, **p<0.01.
Figure 3—figure supplement 2
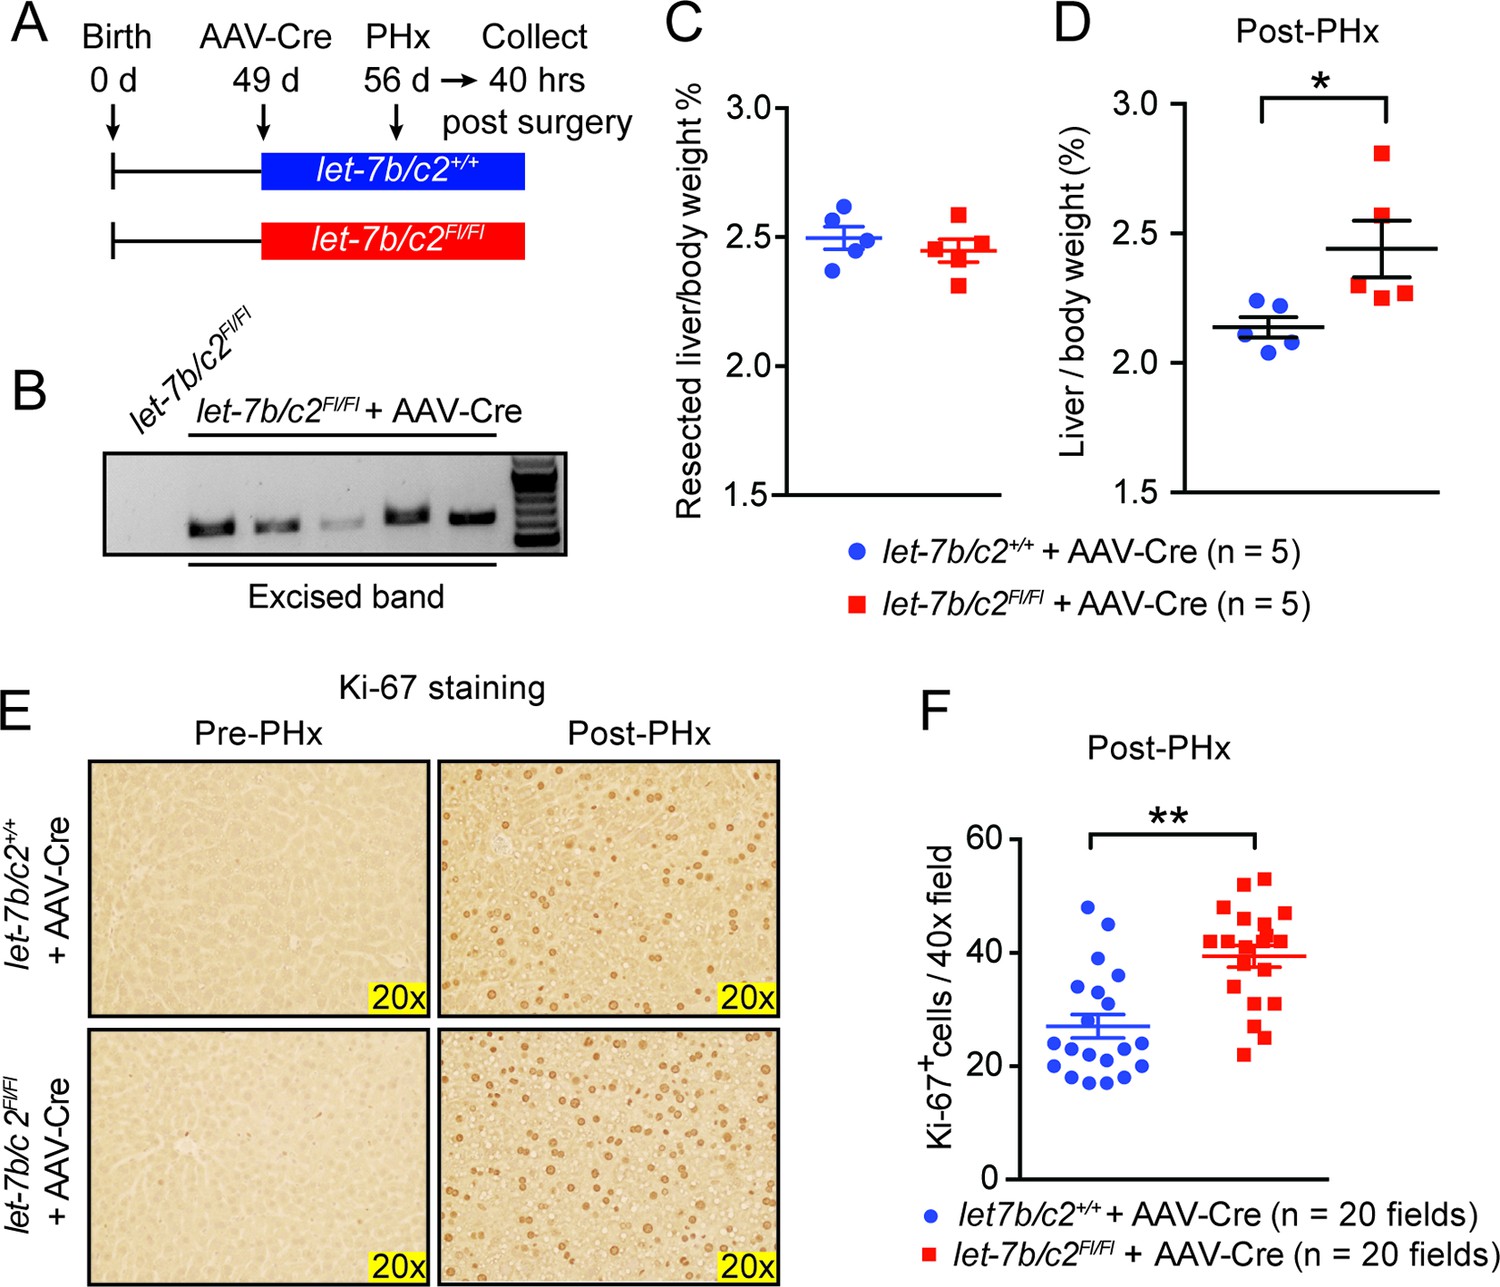
Post-natal deletion of let-7b/c2 also enhances liver regeneration.
(A) Schema showing that let-7b/c2 +/+ and let-7b/c2Fl/Fl mice were injected with AAV-Cre at 49 days of age, PHx was performed 7 days after viral injection, and tissues were collected 40 hr post PHx. (B) DNA gel showing excised let-7b/c2 band in let-7b/c2Fl/Fl + AAV-Cre mice (n=5) but not in let-7b/c2 +/+ + AAV-Cre mice. (C) Percentage of resected liver/body weight ratios of let-7b/c2 +/+ + AAV-Cre (n=5) and let-7b/c2Fl/Fl + AAV-Cre mice (n=5) at the time of PHx. (D) Liver/body weight ratios of the above mice 40 hr after PHx. (E) Ki-67 staining on resected and 40 hr post-PHx livers from the above mice (n=3 and 3). (F) Quantification of Ki-67-positive cells (n=2 and 2 mice; total of ten 40x fields/mouse were used for quantification). All data in this figure are represented as mean ± SEM. *p<0.05, **p<0.01.
Figure 4
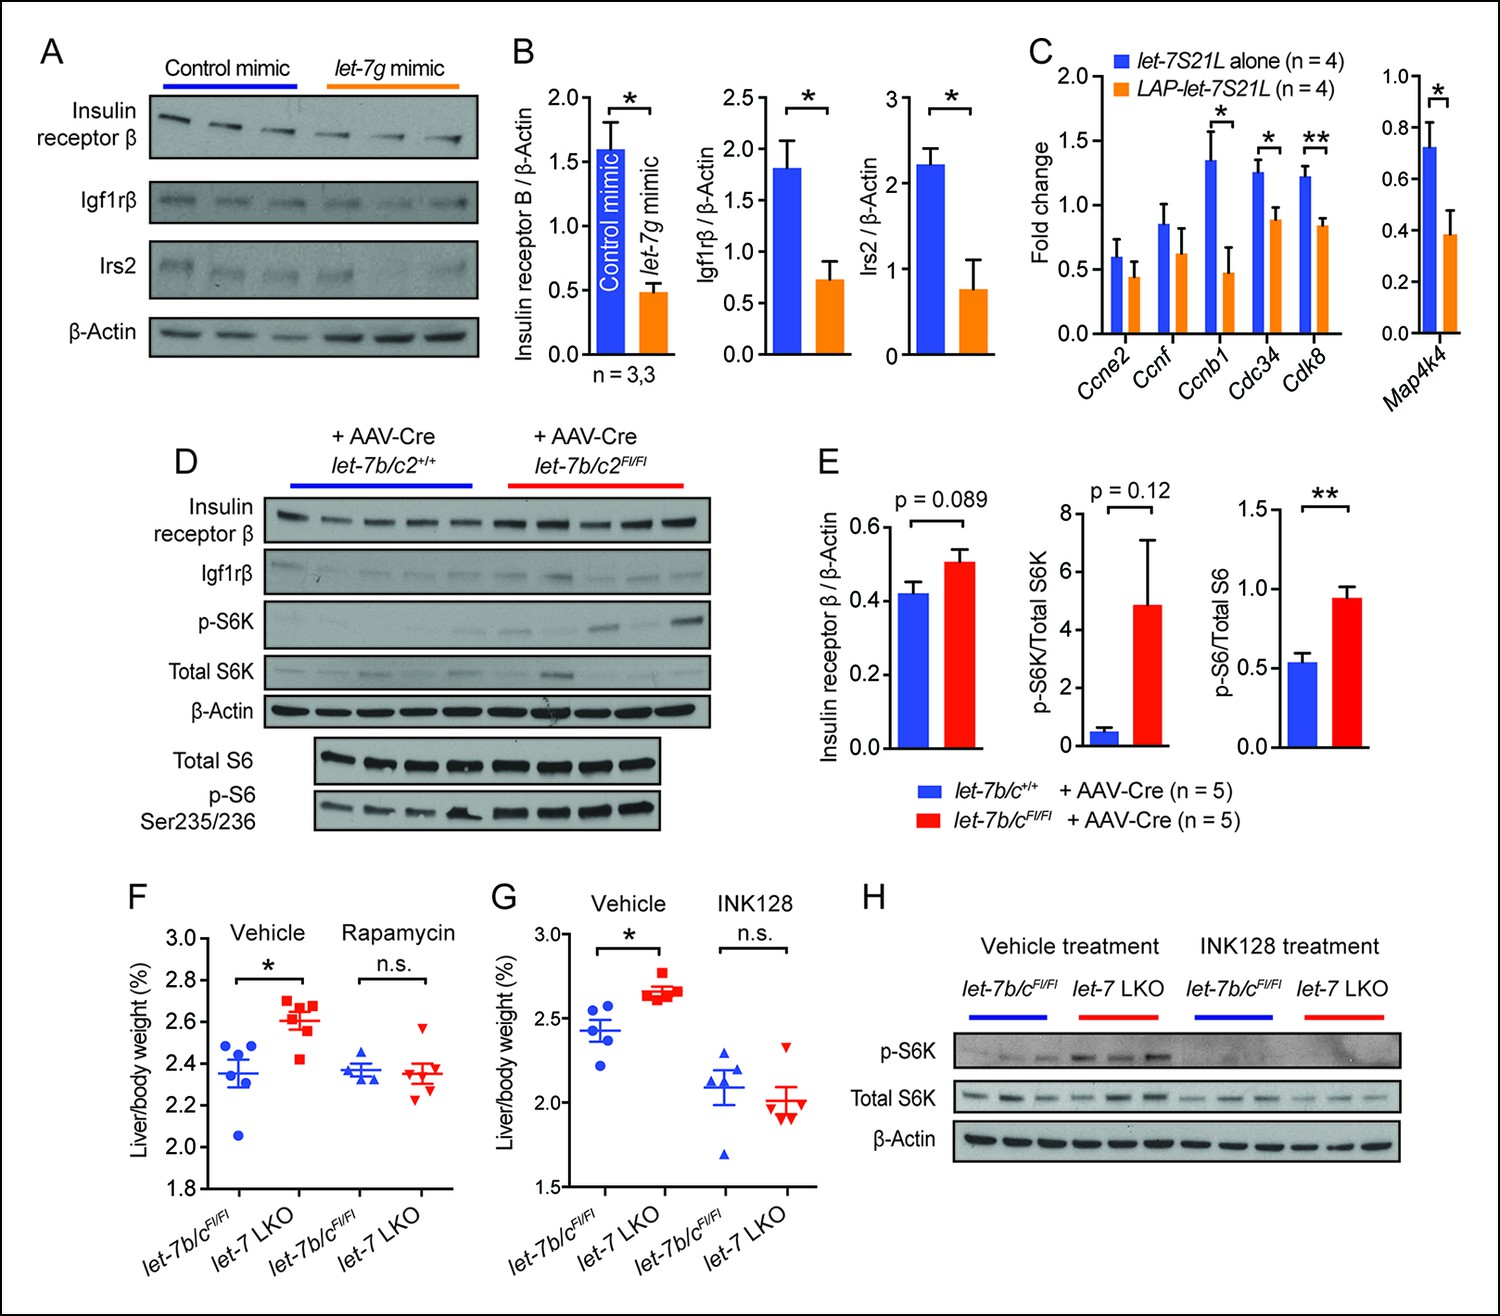
let-7g suppresses liver regeneration through insulin-PI3K-mTOR.
(A) Western blots of insulin receptor β, Igf1rβ, Irs2, and β-Actin in negative control or let-7g microRNA mimic treated liver tissues 40 hr after PHx. (B) Quantification of intensity of insulin receptor β, Igf1rβ, Irs2 (Image J). (C) Cell cycle gene expression in let-7S21L alone (n=4) and LAP-let-7S21L (n=4) livers before and 40 hr after PHx as determined by RT-qPCR. (D) Western blots of insulin receptor β, Igf1rβ, p-S6K, total S6K, β-Actin, p-S6 (Ser235/236), and total S6 in AAV-Cre treated let-7b/c2 +/+ and let-7b/c2Fl/Fl livers (n=5 and 5). (E) Quantification of intensity of insulin receptor β/β-Actin, p-S6K/total S6K, and p-S6/total S6, 40 hr after PHx (Image J). (F) Rapamycin treatment during and after PHx in let-7b/c2Fl/Fl control and let-7b/c2 LKO mice. Shown are liver weights 40 hr post PHx. (G) INK128 treatment during and after PHx in let-7b/c2Fl/Fl control and let-7b/c2 LKO mice. Shown are liver weights 40 hr post PHx. (H) Western blots of p-S6K, total S6K, and β-Actin in let-7b/c2Fl/Fl control and let-7b/c2 LKO livers treated with either vehicle or INK128 at 40 hr post PHx. All data in this figure are represented as mean ± SEM. *p<0.05, **p<0.01.
Figure 5 with 1 supplement
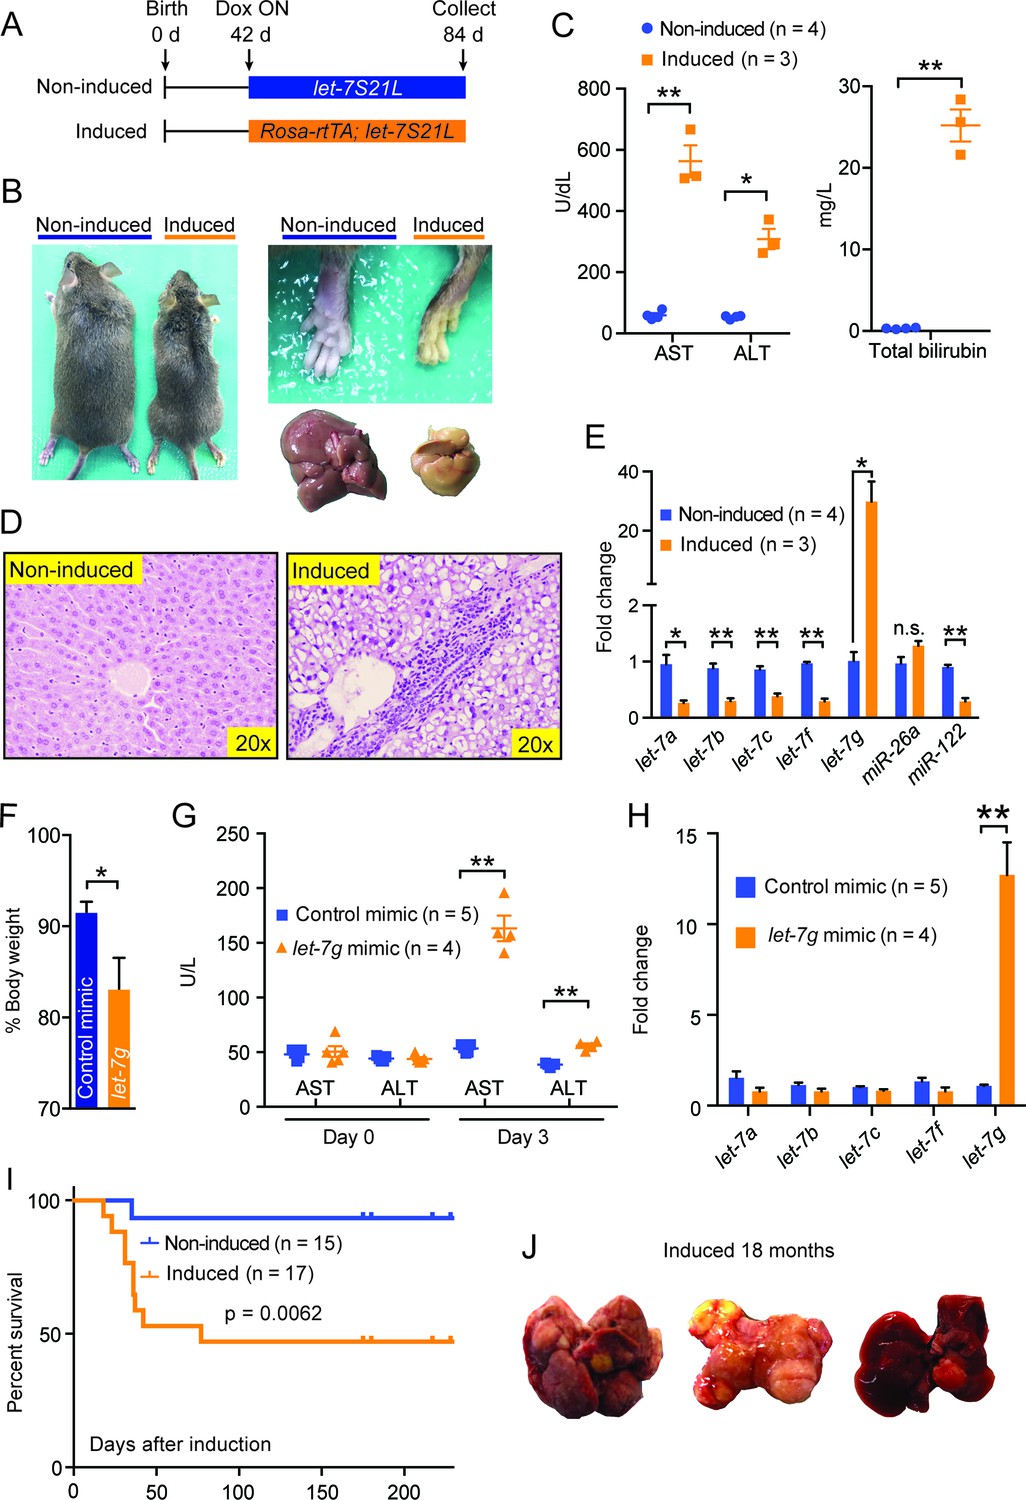
Chronic high-dose let-7g causes hepatotoxicity and liver carcinogenesis.
(A) Schema showing that let-7S21L control and Rosa-rtTA; let-7S21L mice were induced at 42 days of age and collected at 84 days. (B) Images showing the whole body, extremities, and livers of Rosa-rtTA (n=4) and Rosa-let-7S21L mice (n=3) given 1 mg/mL dox between 42 and 84 days of age. (C) Liver function tests: AST (U/L), ALT (U/L), and total bilirubin (mg/L) in these mice. (D) H&E staining of livers. (E) RT-qPCR of mature let-7s and other microRNAs in let-7g overexpressing mice (n=4 and 3). (F) Body weight 3 days after injection of 2.0 mg/kg negative control or let-7g microRNA mimics packaged in C12-200 LNPs relative to pre-injection weight (n=5 and 4). (G) Liver function tests: AST (U/L) and ALT (U/L) in WT C57Bl/6 mice before and 3 days after mimic injection (n=5 and 4). (H) Mature let-7 levels in wild-type C57Bl/6 mice treated with mimics as determined by RT-qPCR (n=5 and 4). (I) Kaplan-Meier curve for Rosa-let-7S21L induced with 1.0 g/L dox at 6 weeks old (n=15 and 17). (J) Gross images of the liver of Rosa-let-7S21L mice induced for 18 months. All data in this figure are represented as mean ± SEM. *p<0.05, **p<0.01.
Figure 5—figure supplement 1
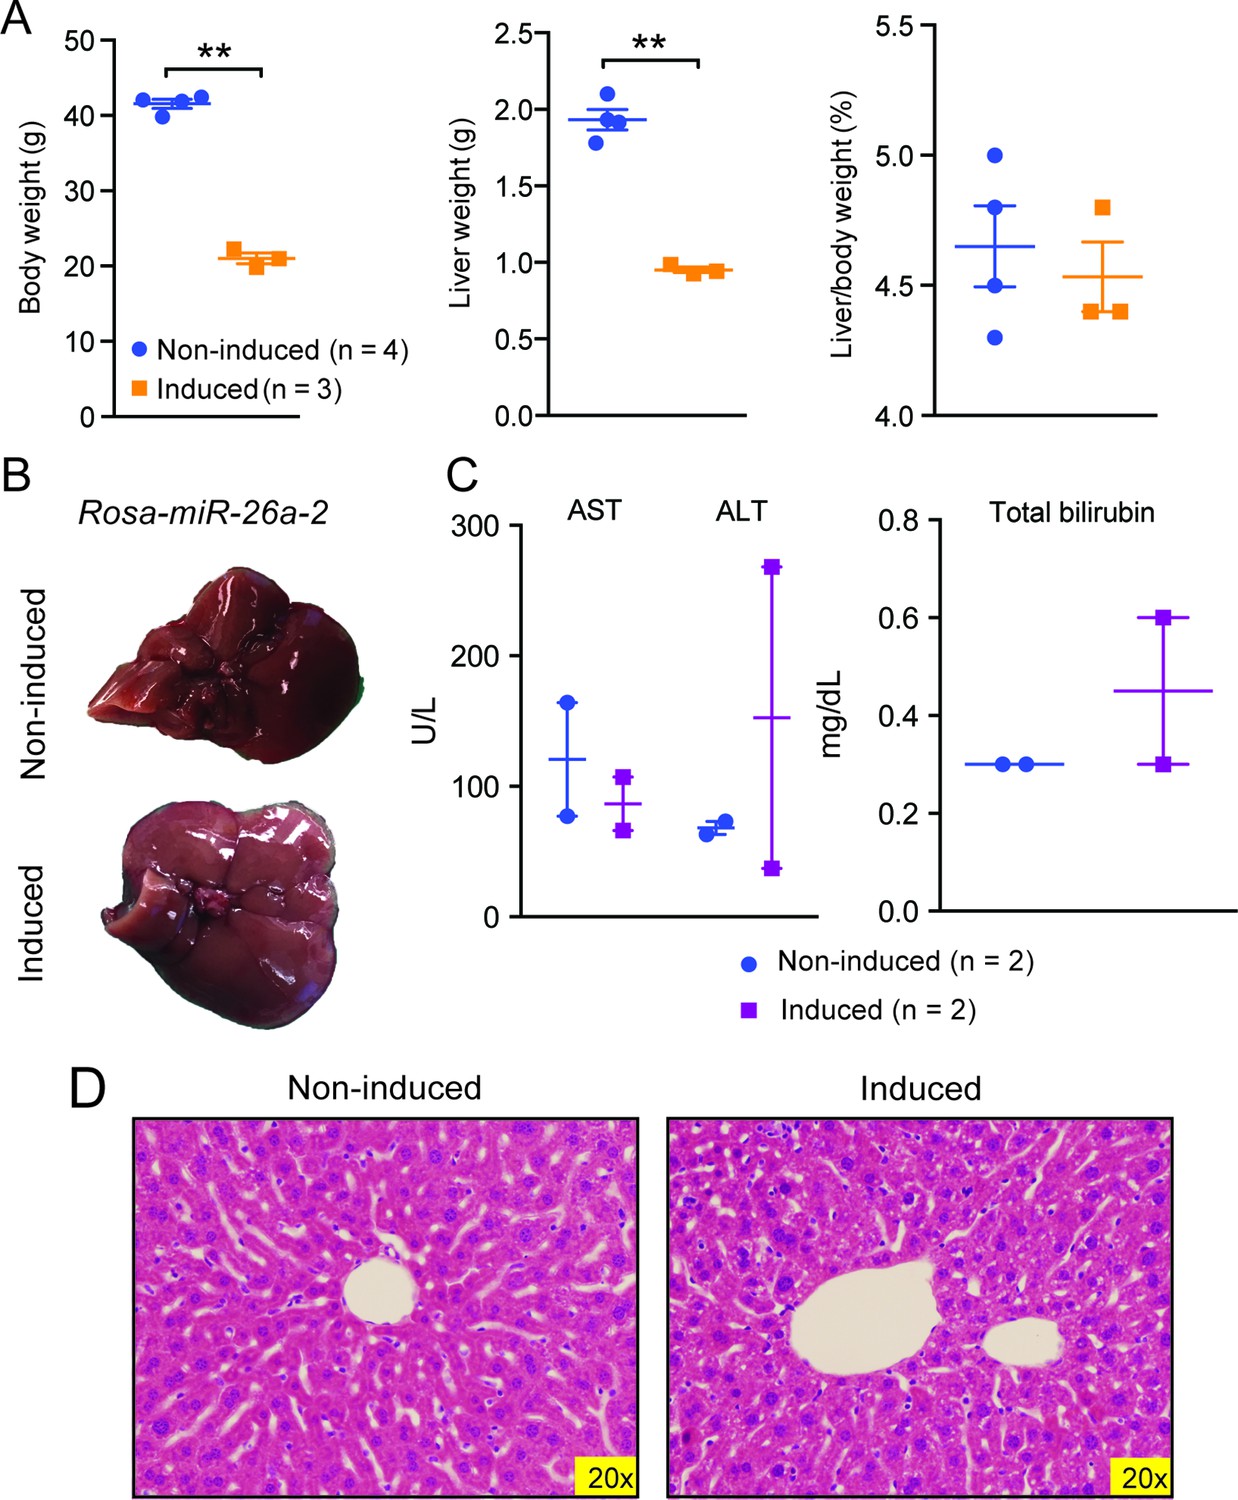
Data associated with Figure 5.
(A) Body, liver, and liver/body weight ratios of control (n=4) and Rosa-let-7S21L (n=3) mice after 42 days of induction. (B) Gross image of Rosa-rtTA (non-induced) and Rosa-miR26a-2 (induced) mice under 1.0 g/L dox for 42 days. (C) Liver function tests: AST (U/L), ALT (U/L), and total bilirubin (mg/L) (n=2 and 2) after induction. (D) H&E staining of Rosa-rtTA (non-induced) and Rosa-miR26a-2 (induced) mice after induction. All data in this figure are represented as mean ± SEM. *p<0.05, **p<0.01.
Download links
A two-part list of links to download the article, or parts of the article, in various formats.
Downloads (link to download the article as PDF)
Open citations (links to open the citations from this article in various online reference manager services)
Cite this article (links to download the citations from this article in formats compatible with various reference manager tools)
Precise let-7 expression levels balance organ regeneration against tumor suppression
eLife 4:e09431.
https://doi.org/10.7554/eLife.09431


