Unified pre- and postsynaptic long-term plasticity enables reliable and flexible learning
- University of Edinburgh, United Kingdom
- McGill University, Canada
- University of Oxford, United Kingdom
- New York University School of Medicine, United States
- New York University, United States
Figures
Figure 1 with 3 supplements
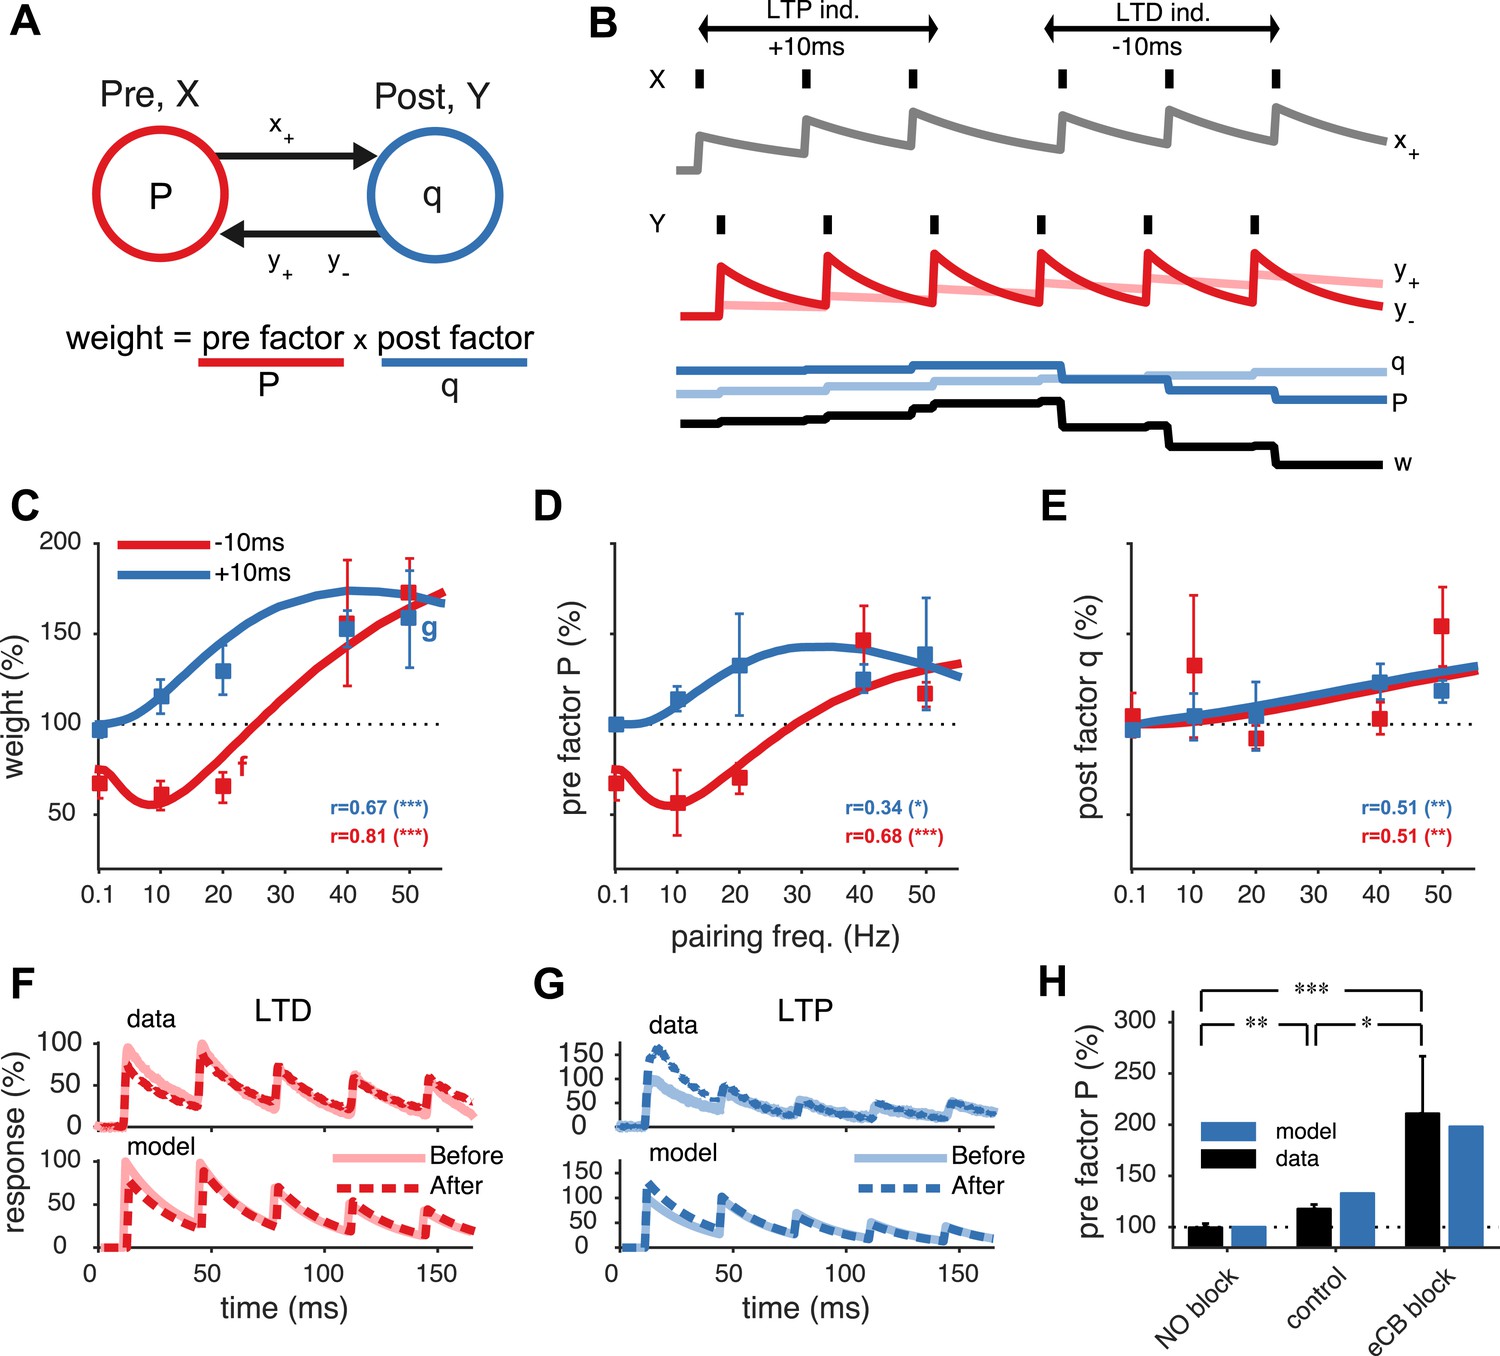
Unified model of pre- and postsynaptically expressed STDP.
(A) The synaptic weight is the product of a presynaptic factor P and a postsynaptic factor q. Long-term modifications in P and q are governed by interactions between the pre- and postsynaptic spike trains. (B) Model example in which the postsynaptic neuron first spikes three times at 20 Hz (Y) Δt = +10 ms after the presynaptic neuron (X), leading to LTP by increasing both q and P. Next, when the relative timing Δt is reversed, long-term depression (LTD) results as P weakens strongly, even though q still slightly strengthens. (C) The model fits the rate dependence of synaptic plasticity (squares, (Sjöström et al., 2001)) for both positive (blue: +10 ms) and negative timings (red: −10 ms). (D, E) The changes in the pre- and postsynaptic factors P and q match experimental data (reanalyzed from Sjöström et al., 2001; see ‘Materials and methods’ and Figure 1—figure supplement 2). (F, G) As in experiments (top), short-term depression in the model is reduced after LTD (20 Hz, Δt = −10 ms) and increased after LTP (50 Hz, Δt = +10 ms) (bottom). Experimental traces from Sjöström et al. (2003) (F) and from Sjöström et al. (2007) (G). (H) Model (blue) is consistent with LTP experiments (black) (Sjöström et al., 2007) in control conditions, NO blockade, and eCB blockade. NO and eCB antagonists abolish and promote presynaptic LTP, respectively (Sjöström et al., 2007).
Figure 1—figure supplement 1
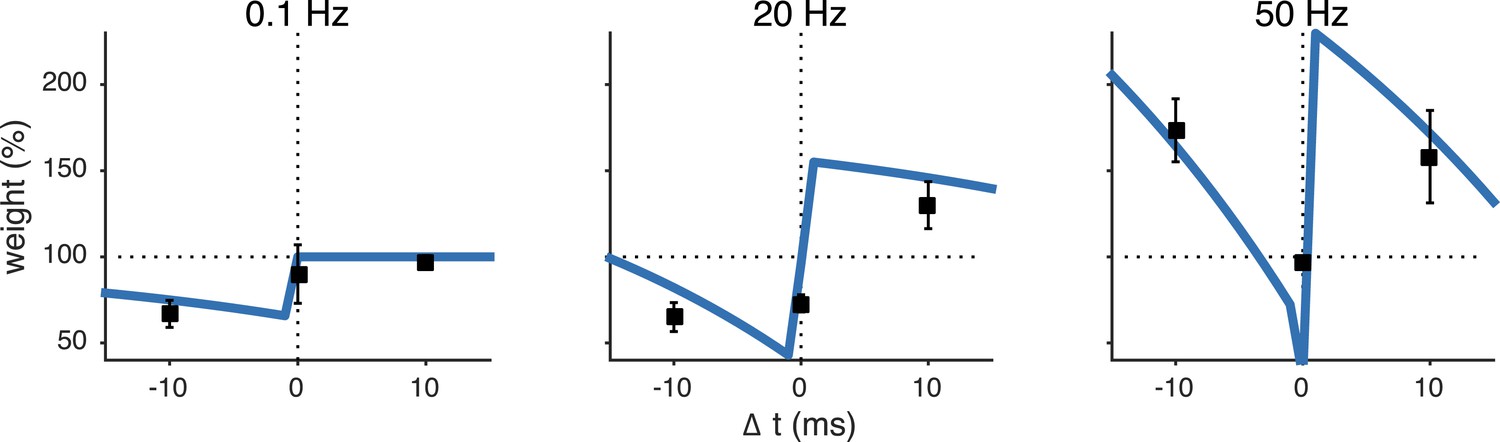
The unified pre- and postsynaptic spike-timing-dependent plasticity (STDP) model (blue solid line) captured the characteristic temporal asymmetry of experimental STDP (black squares represent data from Sjöström et al. (2001)).
Relative timing was defined as . Pairing frequency was 0.1 Hz (left), 20 Hz (middle) and 50 Hz (right).
Figure 1—figure supplement 2
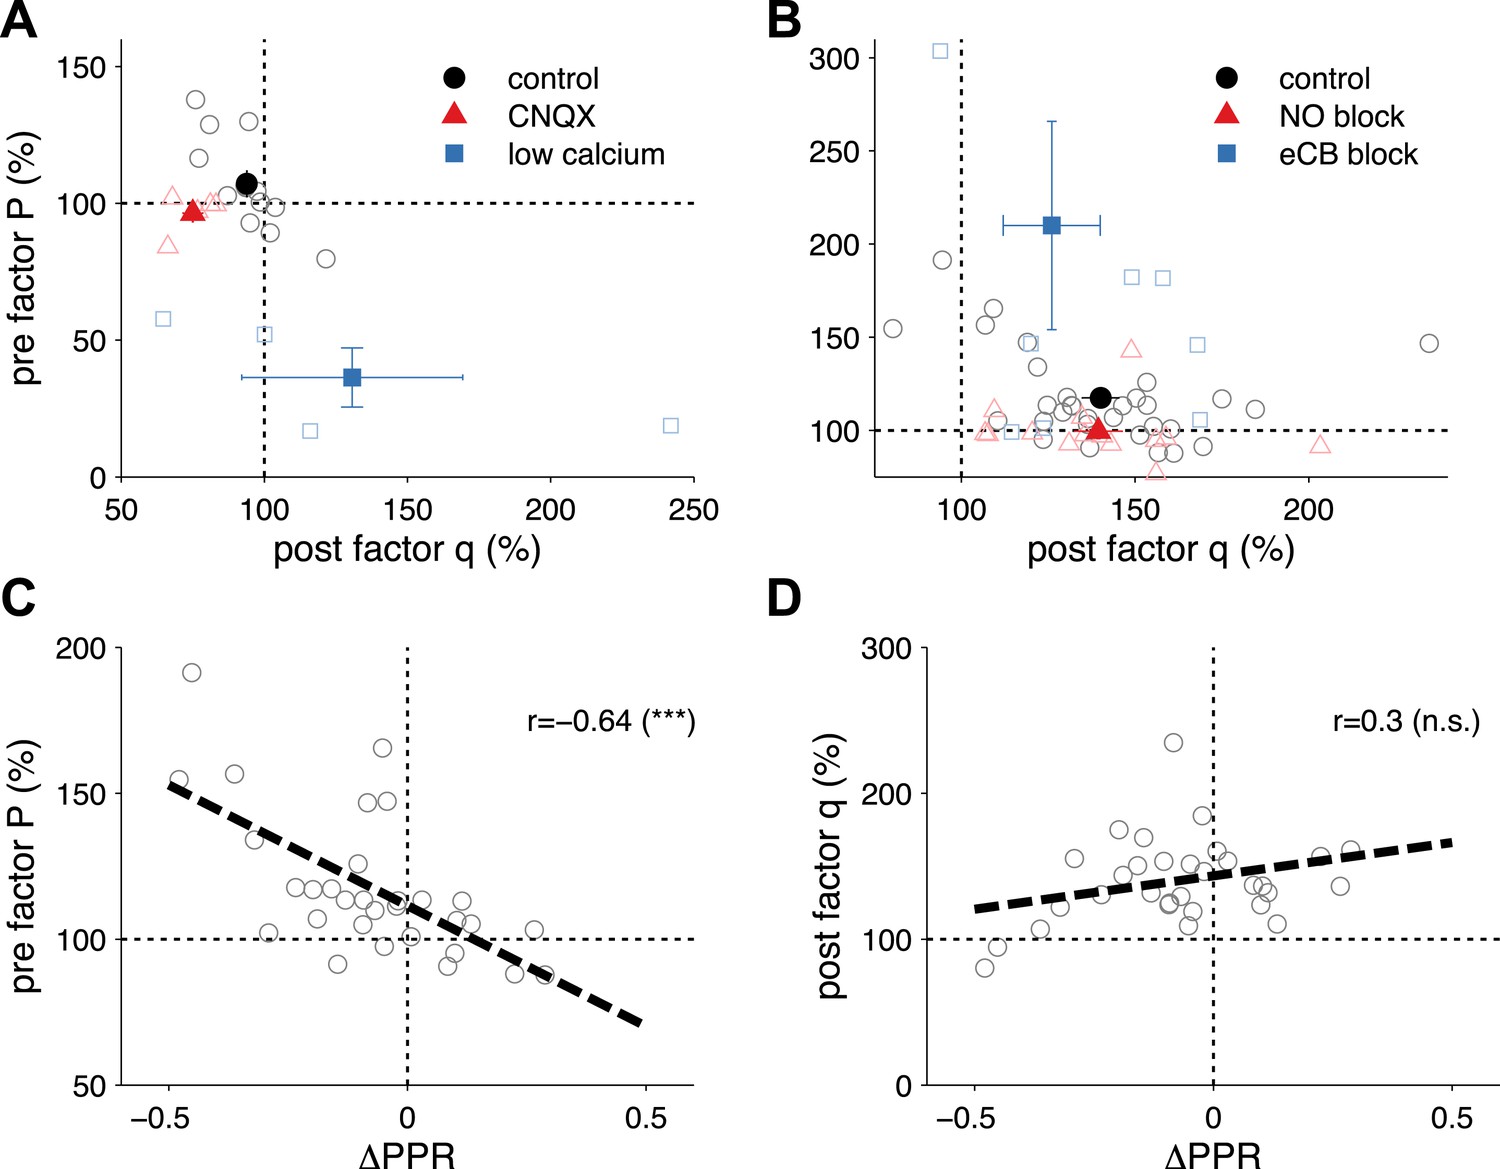
Extraction of P and q from synaptic plasticity data from slice paired recordings using pharmacology and high frequency pairing (based on a long-step current injection plasticity protocol).
(A) The AMPA/kianate antagonist CNQX decreased q (p < 0.01), but not P (p = 0.32; red symbols), while low bath calcium decreased P (p < 0.01), but not q (p = 0.48; blue symbols). Control experiments did not yield changes in either component: P (p = 0.15); and q (p = 0.1; black symbols) (data reanalyzed from Sjöström et al., 2003). (B) Extraction of P and q after long-term potentiation (LTP) induction and blockade of plasticity traces with nitric oxide (NO) and endocannabinoids (eCB). LTP induction (control; black symbols) yielded an increase in both P (p < 0.001) and q (p < 0.001). eCB blockade increased the presynaptic factor P (p < 0.01), but did not change q (p = 0.1; blue symbols), while LTP induction under NO blockade increased q (p < 0.001), but did not change P (p = 0.27; red symbols) (data reanalyzed from Sjöström et al., 2007). (C, D) Changes in presynaptic factor P (C), but not postsynaptic factor q (D) correlated with changes in paired-pulse ratio. Dashed line represents a linear regression on the individual data points (open circles). Data shown was normalized to baseline (before plasticity induction). Open symbols represent individual experiments, while solid symbols in (A) and (B) represent averages. Error bars represent SEM.
Figure 1—figure supplement 3
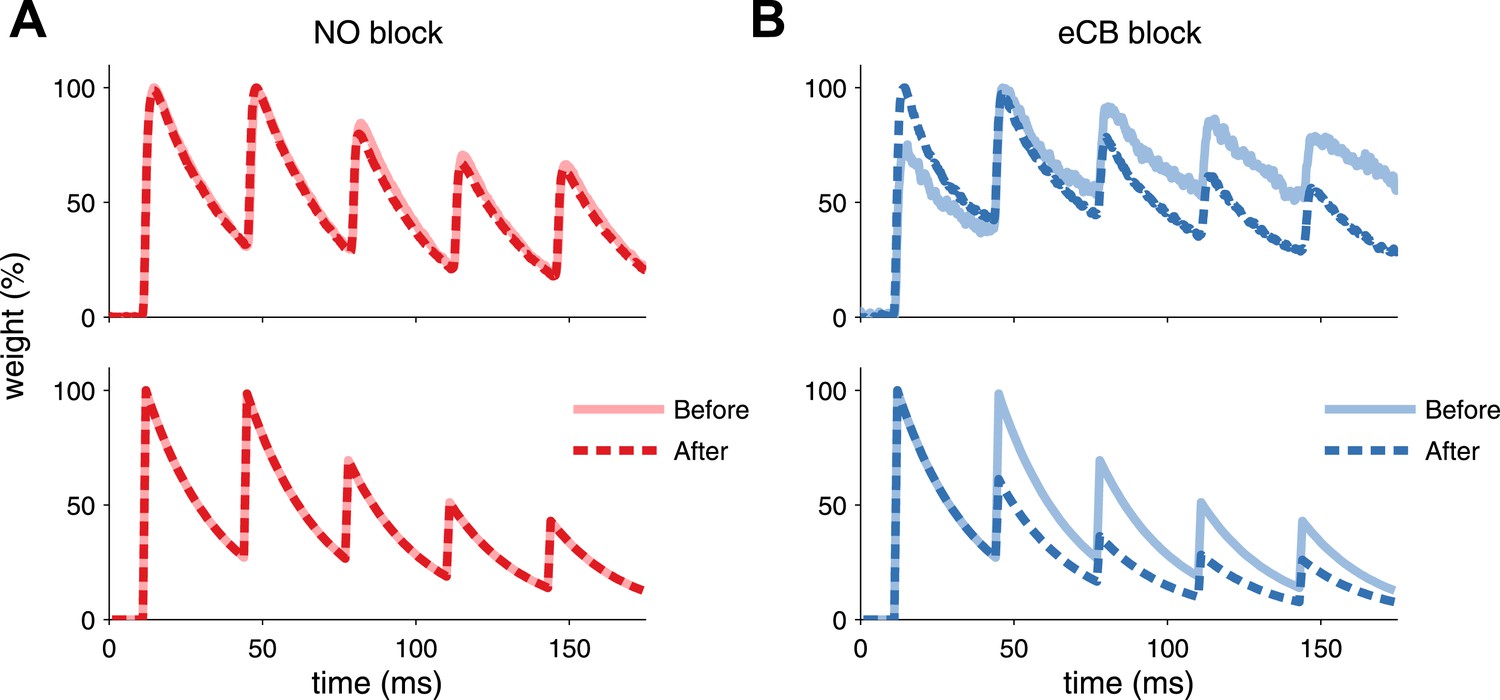
Model is consistent with modifications of synaptic dynamics after pharmacological blockade of plasticity traces.
(A) After LTP induction under NO blockade (top), no changes in synaptic dynamics were observed when blocking NO retrograde signalling, in keeping with the model results (bottom). (B) Strong depression is revealed after eCB blockade (top), similar to the model (bottom). Data was reproduced from Sjöström et al. (2007). Data shown was normalized to the maximum amplitude before and after plasticity induction to highlight changes in the synaptic dynamics.
Figure 2 with 3 supplements
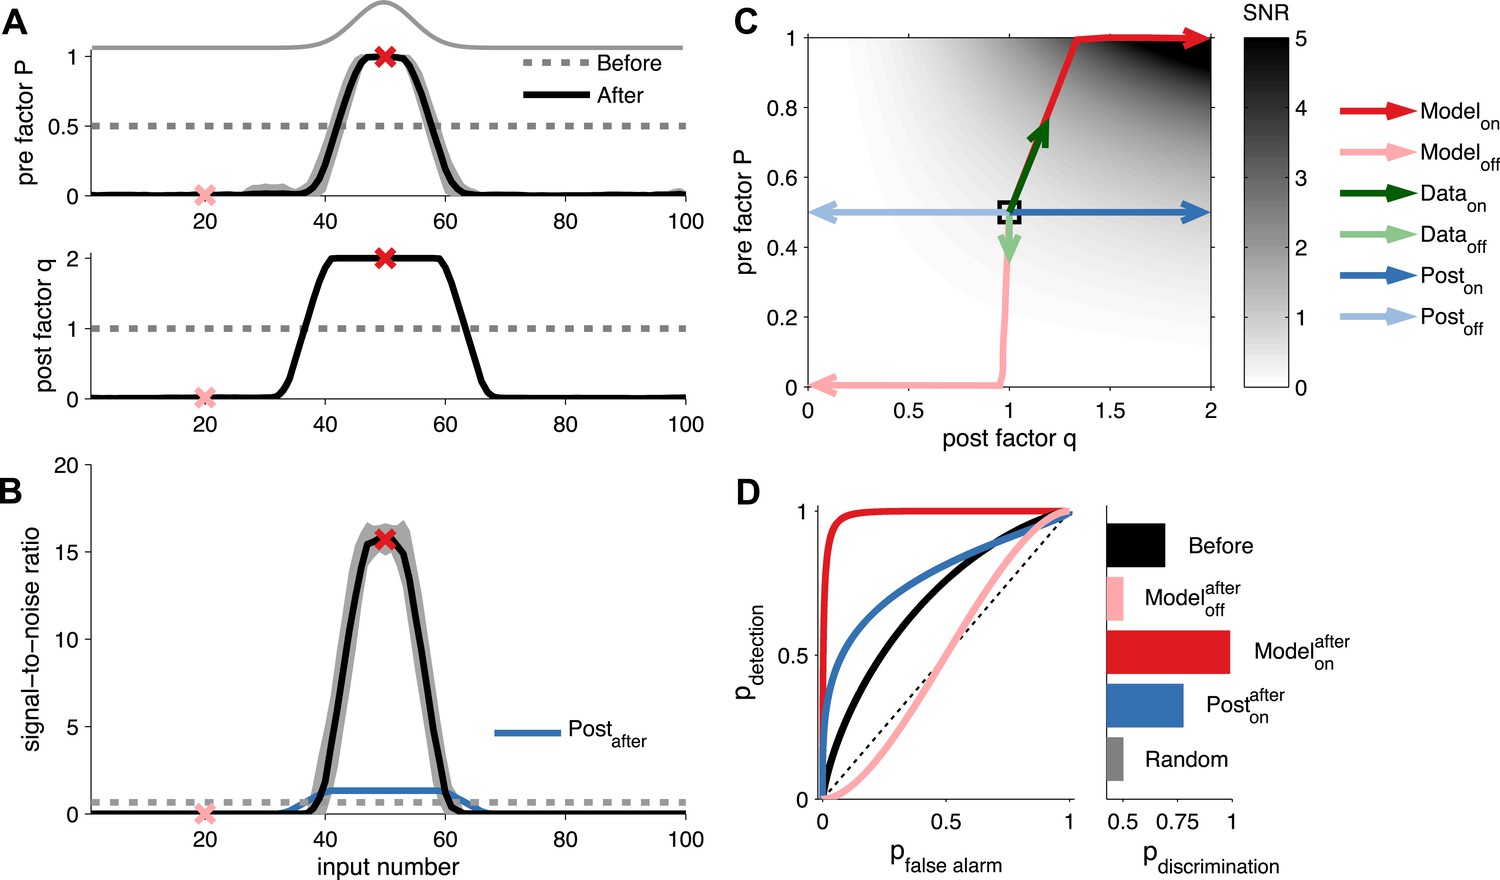
Unified pre- and postsynaptic plasticity improves receptive field discriminability.
(A) Synaptic input rates follow a Gaussian spatial profile (solid grey line). Initially, the presynaptic factor P (top) and the postsynaptic factor q (bottom) are uniformly distributed (dashed lines). After learning, P (top) and q (bottom) both follow the input profile. Dark and light red crosses define examples of on and off receptive field positions, respectively. (B) After learning, the SNR is increased for on and decreased for off neurons. Postsynaptic plasticity alone leads to a smaller improvement (blue line). (C) While on neurons obtain higher SNR for postsynaptic-only potentiation (dark blue arrows), unified pre- and postsynaptic potentiation yields considerably better SNR (dark red arrows). Off neurons get lower SNR in both scenarios (light blue and light red arrows). Modifications of in vivo synaptic responses to a tone from on and off receptive field positions (dark and light green arrows, respectively; reanalyzed from Froemke et al. (2013), see ‘Materials and methods’) are consistent with unified pre- and postsynaptic expression but not with postsynaptic expression alone. The black square represents starting condition. Arrows represent the plasticity trajectory, where the model trajectories are plotted every 50 ms. (D) Only on positions with both pre- and postsynaptic plasticity yield near-perfect discrimination (dark red). Shown for comparison, the discrimination before development (black), after development for off neurons (light red), and after development for on neurons with postsynaptic expression only (blue).
Figure 2—figure supplement 1
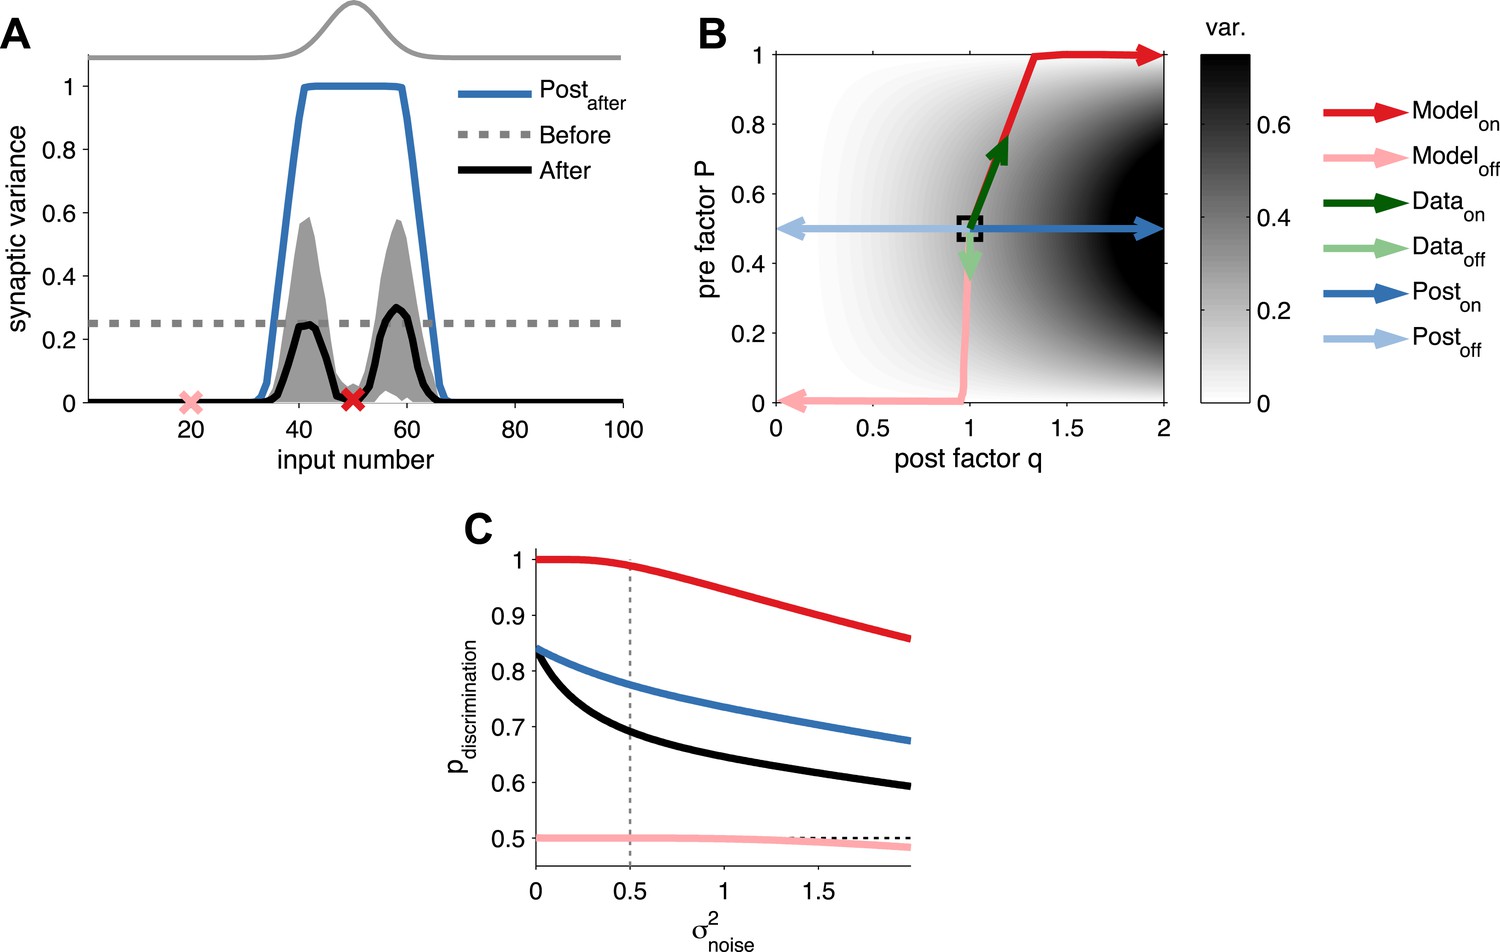
Long-term pre- and postsynaptic plasticity reduces response variability of receptive fields.
(A) After receptive field development synaptic variance dropped for both on and off neurons. (B) Synaptic variance as a function of P and q (grey colour map). Black square represents initial condition. As in (A), after development on and off neurons yielded low synaptic variance (dark and light red arrows, respectively). In vivo plasticity results measuring synaptic responses from on and off receptive fields are in agreement with modelling predictions (data from Froemke et al., 2013—green arrows). For comparison, the results for a learning rule where only the postsynaptic factor is modified for on and off neurons (dark and light blue arrows, respectively). (C) Probability of discrimination (area under the curve in Figure 2D) for different background noise levels. Solid black line represents the initial condition. Black dashed line represents a random classifier, while vertical grey dashed line represents the background noise level used in Figure 2.
Figure 2—figure supplement 2
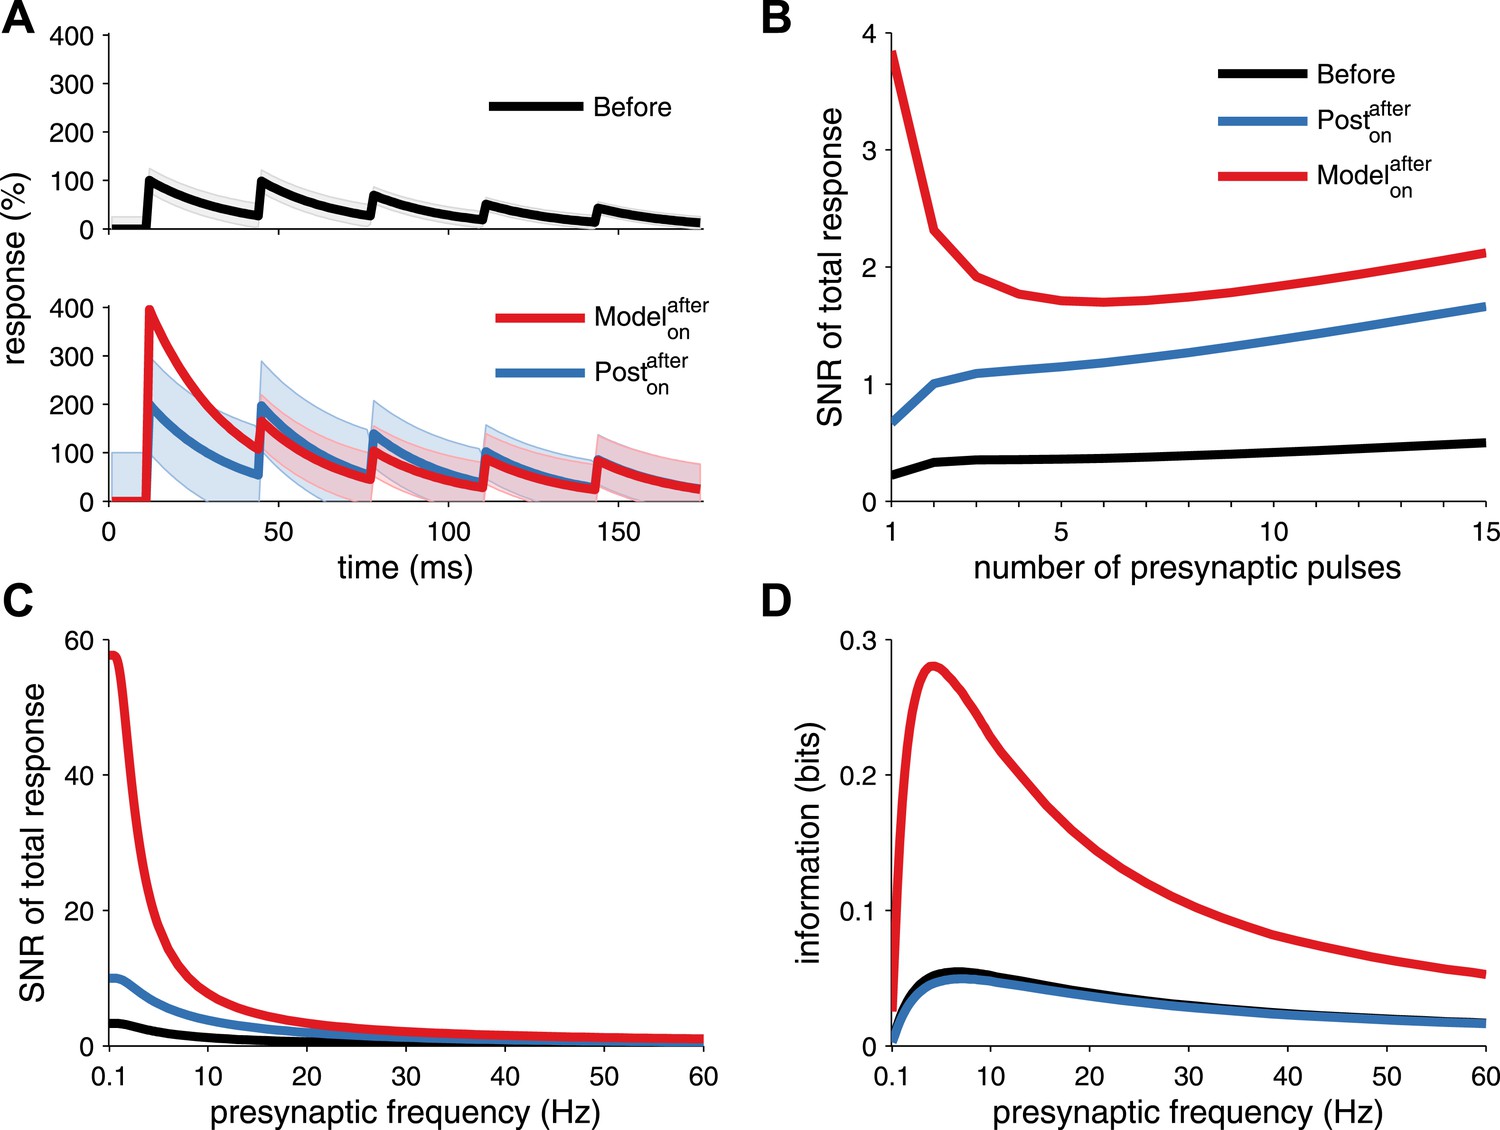
Long-term pre- and postsynaptic plasticity improves signal-to-noise ratio (SNR) and information transmission in dynamic synapses.
(A) Model with both pre- and postsynaptic plasticity reduces synaptic transmission variability with dynamic synapses (top, red line), while postsynaptic plasticity alone increases variability (bottom, blue line). Black line represents initial condition as in Figure 2C. Shaded area represents the variance of the postsynaptic response. (B) The SNR of the sum of multiple pulses is improved in the unified model (red line), compared to postsynaptic plasticity alone (red line; see ‘Materials and methods’). The presynaptic firing rate is 30 Hz in (A) and (B). (C) In analogy with the SNR of the first response (Figure 2C), the SNR of the sum of the first 15 responses across different presynaptic frequencies is better for the unified model compared to postsynaptic plasticity alone. (D) Synaptic information transmission (Fuhrmann et al., 2002; Testa-Silva et al., 2014) for the unified model across different presynaptic frequencies is better than with postsynaptic plasticity alone.
Figure 2—figure supplement 3
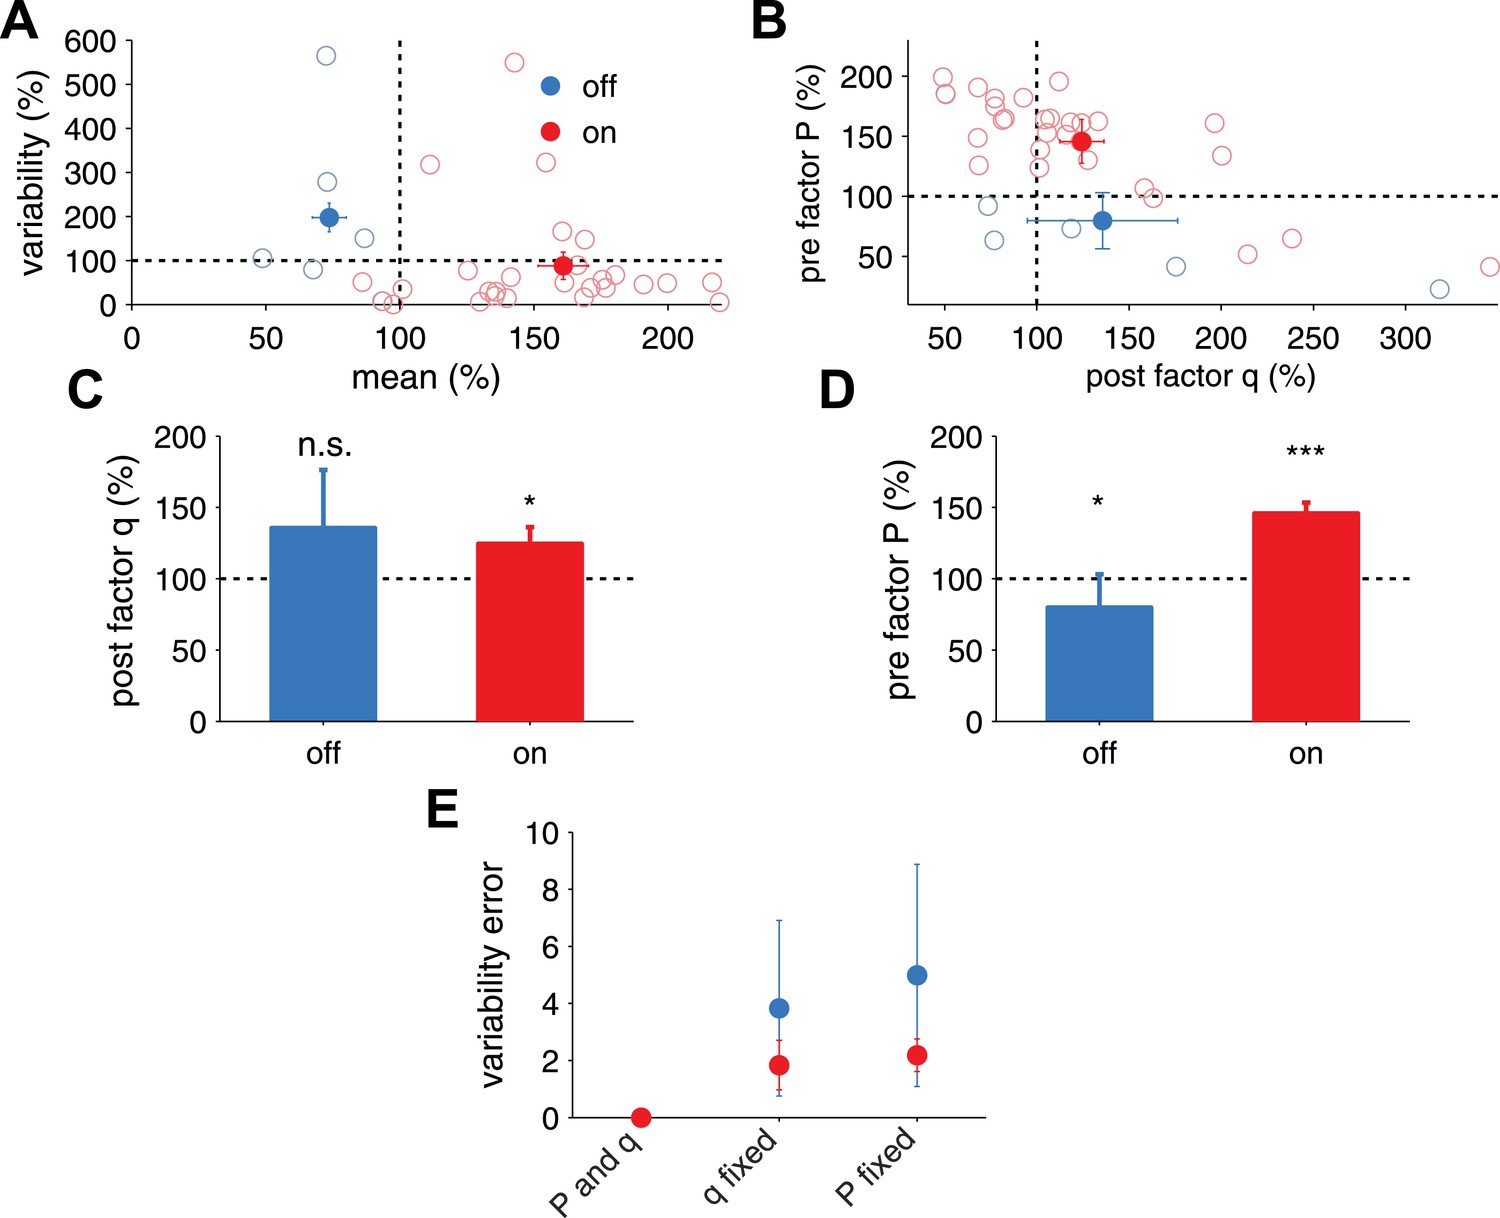
Extraction of effective P and q from in vivo receptive field plasticity experiments (data reanalyzed from Froemke et al. (2013).
(A) Modification of variability and mean as reported in Froemke et al. (2013) after stimulation of nucleus basalis. Data is shown for both unpaired (referred to as off the receptive field) frequencies (mean: blue filled circles, single experiments: light blue circles) and paired (referred to as on the receptive field) frequencies (mean: red filled circles, single experiments: light red circles) receptive fields. (B) Modification in P and q for on and off positions, obtained using a standard binomial release model on the synaptic responses recorded by Froemke et al. (2013) (see ‘Materials and methods’). (C) After receptive field plasticity q did not change in off positions (p = 1), but was upregulated in on (p < 0.05) positions. (D) P was also downregulated and upregulated for off (p < 0.05) and on (p < 0.001) positions, respectively, after receptive field plasticity. (E) An estimator where both P and q change yielded the lowest variability estimation error, compared to estimators where P or q were fixed.
Figure 3

Unified pre- and postsynaptic STDP displays rapid relearning of previously experienced stimuli.
(A) The presynaptic factor P follows the switching between two stimuli (red and blue profiles, arrows indicate switching time-points). (B) The postsynaptic factor q, however, is not erased and a trace of previously learned information remains, which decays slowly only due to synaptic homeostasis. The neuron was initially tuned to the red stimulus. The initial learning of the blue stimulus (at 1 s) was slow, but much faster the second time (at 101 s). (C) The neuron's tuning follows the two stimuli, as indicated by the alternating stimulus-specific spiking. Previously experienced stimuli are forgotten by the postsynaptic neuron, but a hidden trace remains. (D) Relearning occurs faster than learning. (E) Relearning was an order of magnitude faster than initial learning (time to reach 99% performance).
Tables
Table 1
Unified pre- and postsynaptic spike-timing-dependent plasticity (STDP) model parameters
| Parameter | d− | τy− (ms) | d+ | τy+ (ms) | c+ | τx+ (ms) |
|---|---|---|---|---|---|---|
| Young rat visual cortex | 0.1771 | 32.7 | 0.1548 | 230.2 | 0.0618 | 66.6 |
-
The model was fitted to data from young rat visual cortex (Sjöström et al., 2001).
Table 2
Comparison between unified pre- and postsynaptic STDP model and different versions of the triplet model (for simplicity we removed the function arguments) (Pfister and Gerstner, 2006)
| LTD | LTP1 | LTP2 | |
|---|---|---|---|
| pre-post STDP | X d−y−y+ | X d+y+x+ | Y c+x+y− |
| minimal HC Triplet | |||
| minimal VC Triplet | – |
Download links
A two-part list of links to download the article, or parts of the article, in various formats.
Downloads (link to download the article as PDF)
Open citations (links to open the citations from this article in various online reference manager services)
Cite this article (links to download the citations from this article in formats compatible with various reference manager tools)
Unified pre- and postsynaptic long-term plasticity enables reliable and flexible learning
eLife 4:e09457.
https://doi.org/10.7554/eLife.09457


