Area-specific development of distinct projection neuron subclasses is regulated by postnatal epigenetic modifications
- University of Nice Sophia Antipolis, France
- Institut national de la santé et de la recherche médicale, France
- Institut de Biologie Valrose, France
- University of Geneva, Switzerland
- Weill Medical College of Cornell University, United States
- Laboratoire J.A. Dieudonné, France
Figures
Figure 1 with 1 supplement

Temporal and areal distribution of Ctip2/Satb2+ neurons in the neocortex.
(A). Coronal sections from prospective (pS) and primary (S1) somatosensory areas of E14.5, E16.5, P0, P7, and P21 cortices immunolabeled for Ctip2 and Satb2. (B). Percentage of Satb2+, Ctip2+, and double Ctip2/Satb2 (C/S+) neurons on the total number of DAPI+ neurons in the cerebral cortex at different ages. The counting was performed in the cortical plate (CP) from E14.5 to E16.5 and only in lower layers (LL) from P0 to P21. (C). Number of C/S+ neurons calculated as a percentage of DAPI+, Satb2+, and Ctip2+ cortical neurons at different ages. (D). Immunostaining for Satb2 and Ctip2 on P0 brain coronal sections from frontal/motor (F/M) and pS areas. Top right panels represent high-magnification views of boxes in layer V depicted in left panels. Arrowheads indicate C/S+ neurons. In bottom right panels, quantification and laminar distribution of double C/S+ neurons. (E). Immunostaining for Satb2 and Ctip2 on P7 brain coronal sections from primary motor (M1) and S1 cortices. Top right panels represent high-magnification views of boxes in layer V depicted in left panels. Arrowheads indicate C/S+ neurons. In bottom right panels, quantification and laminar distribution of double C/S+ neurons. Data are represented as means ± SEM. *p≤0.05, **p≤0.01, ***p≤0.001. SEM, standard error of the mean; UL, upper layers.Scale bars: A,D, E, 100 µm.
Figure 1—figure supplement 1
Time- and area-specific variations in the number and distribution of Ctip2/Satb2+ cells in early postnatal brains.
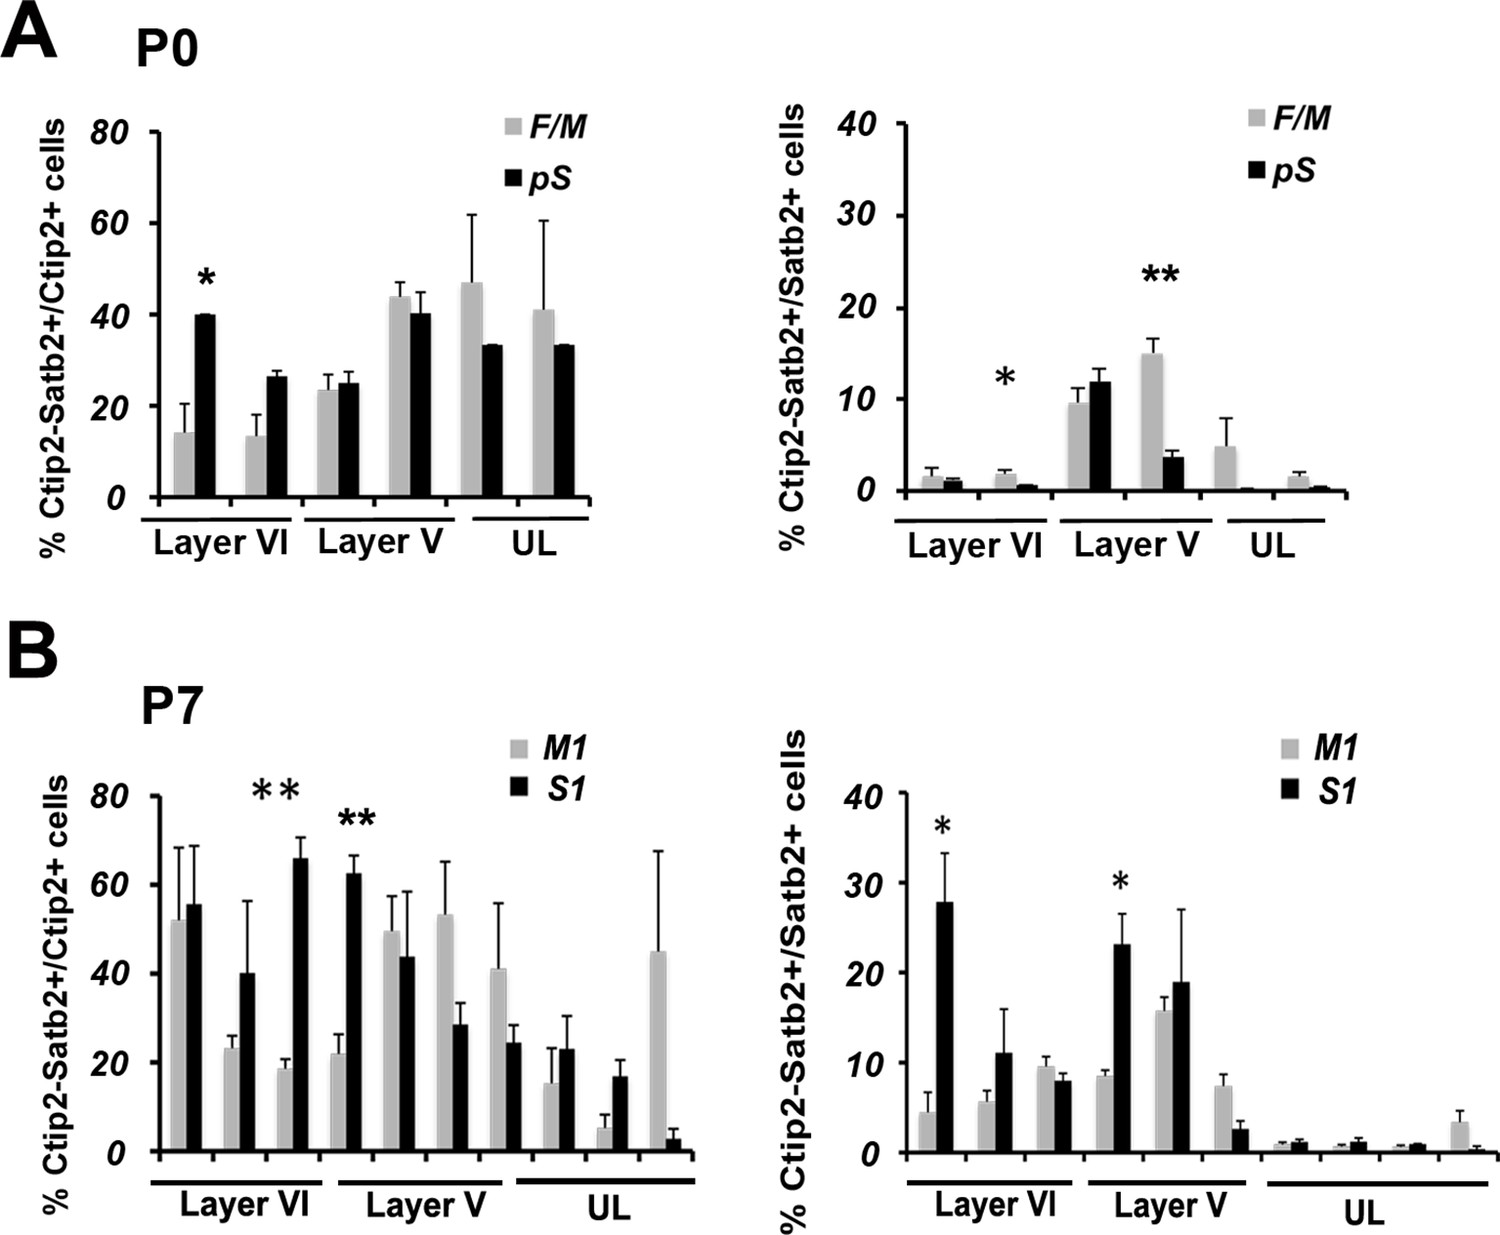
(A). Quantification and laminar distribution of double C/S+ neurons on the total of Ctip2+ or Satb2+ populations in frontal/motor (F/M) and prospective somatosensory (pS) cortices. (B). Quantification and laminar distribution of double C/S+ neurons on the total of Ctip2+ or Satb2+ populations in primary motor (M1) and somatosensory (S1) areas. Data are represented as means ± SEM. *p<0.05, **p<0.01, ***p<0.001. SEM, standard error of the mean; UL, upper layer neurons.
Figure 2 with 1 supplement
Ctip2 and Satb2 co-localization describes subgroups of cortico-brainstem and callosal projection neurons
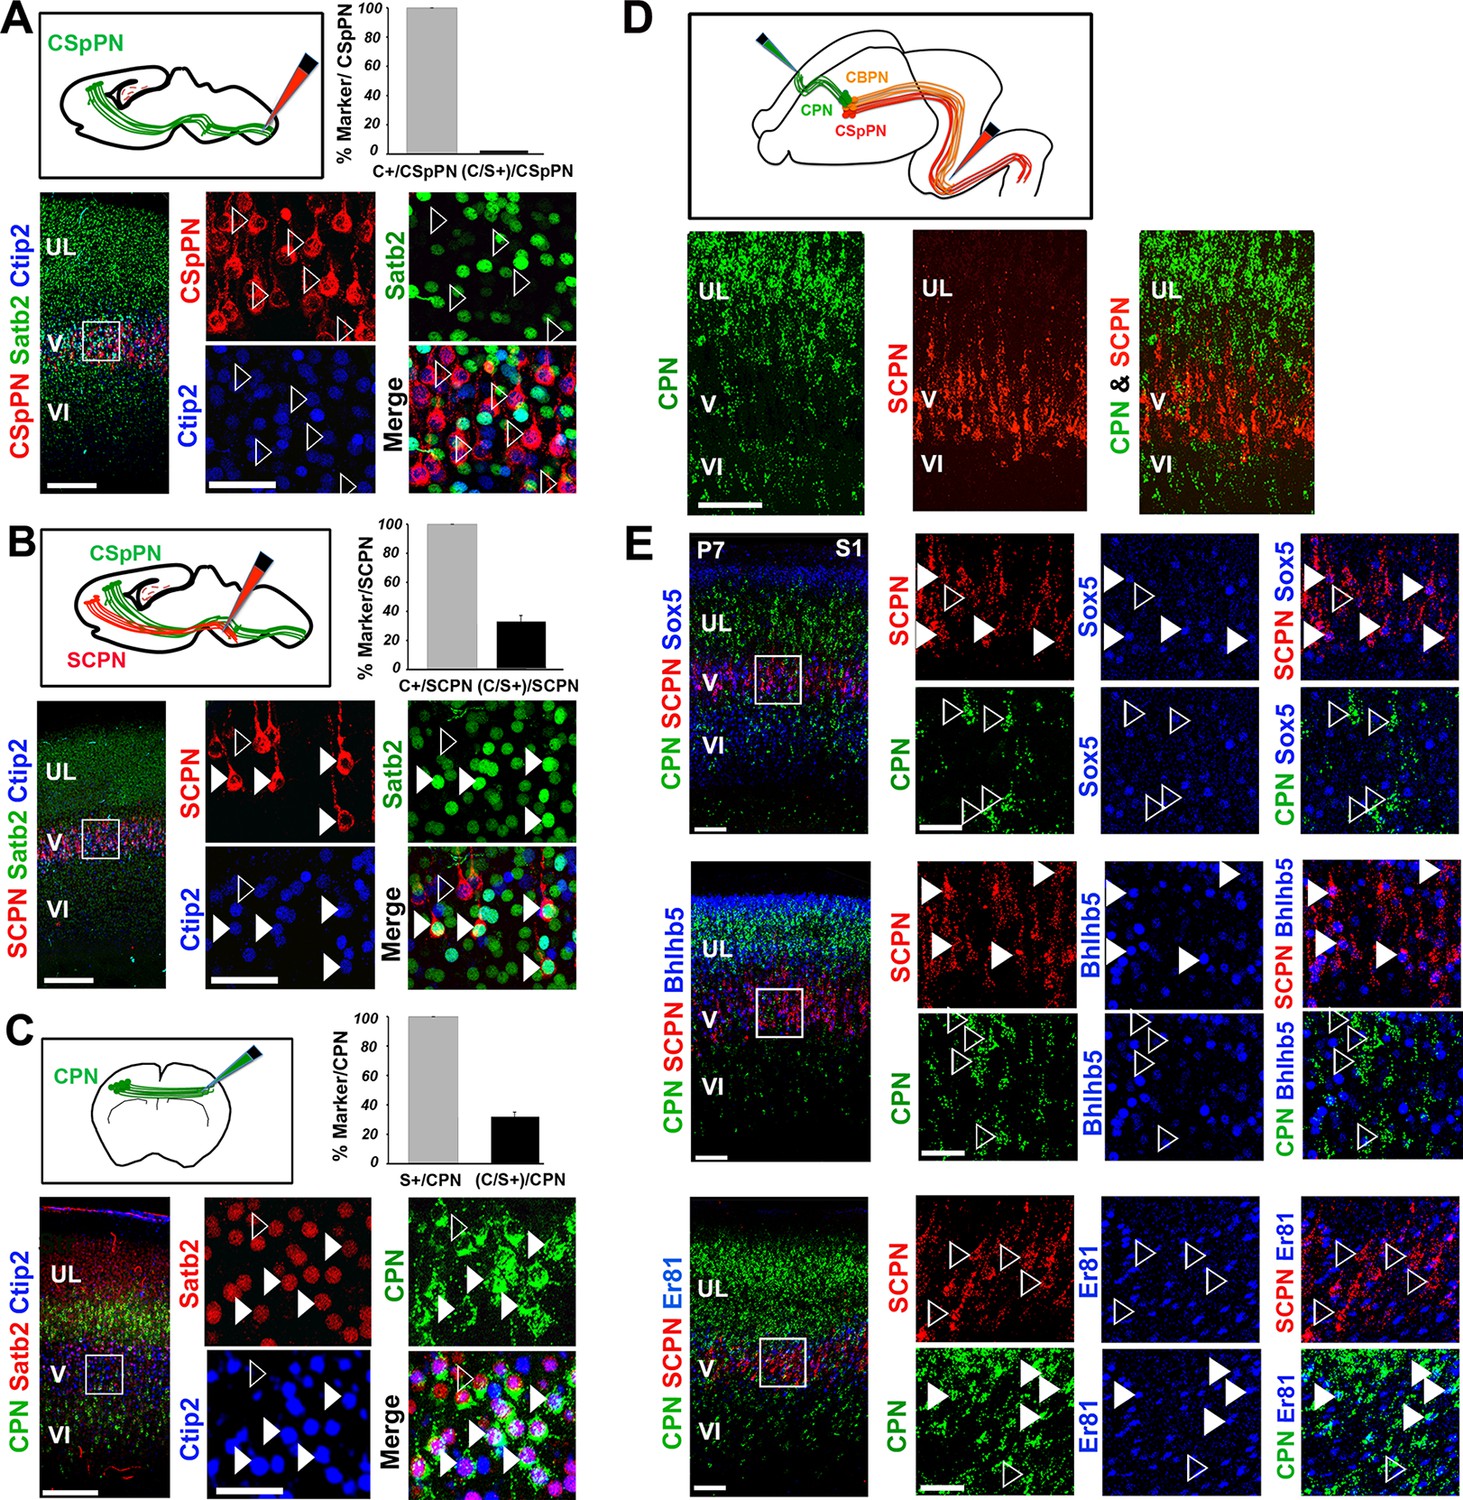
(A-C). Top left, schematic representations of cholera toxin subunit B (CTB) injections at cervical level to trace corticospinal projection neurons (CSpPNs) alone (A), at the midbrain/hindbrain junction to label subcerebral projection neurons (SCPN) including CSpPNs (B), and in the contralateral somatosensory cortex (S1) to label callosal projection neurons (CPN. (C). On bottom left of (A-C), immunostaining for Satb2 and Ctip2 on retrogradely labeled PNs of P7 S1 coronal sections. Squared panels in (A-C) represent high magnification views of boxes in layer V depicted in left panels. Filled arrowheads indicate retrogradely labeled neurons double labeled for Satb2 and Ctip2, while empty arrowheads indicate retrogradely labeled neurons labeled either for Ctip2 or Satb2. On top right of (A-C), quantification of Ctip2+ and double Ctip2/Satb2+ (C/S+) retrogradely labeled neurons on the total number of retrogradely labeled PNs in layer V. (D). On the top, schematic representation of the labeling paradigm to simultaneously double-label SCPN and CPN. Red retrobeads or Green IX retrobeads were injected into the midbrain/hindbrain junction at P2 and into the contralateral S1 at P3, respectively. On the bottom, panels representing labeled CPN (green) and SCPN (red) on P7 S1 coronal sections. (E). Left panel columns represent coronal sections traced for CPN and SCPN and immunostained for Sox5, Bhlhb5, and Er81. Panels on the right represent high-magnification views of boxes in layer V depicted in left panels. Filled white and yellow arrowheads indicate CPN or SCPN positive for the used marker, whereas empty arrowheads indicate negative staining. Scale bars: A,B,C, low-magnification images, 200 μm; D, E, low-magnification images, 100 μm; A,B,C,E, high magnifications, 50 µm. Data are represented as mean ± SEM. SEM, standard error of the mean.
Figure 2—figure supplement 1
Analysis of the molecular code of postnatal Ctip2/Satb2+ neurons.
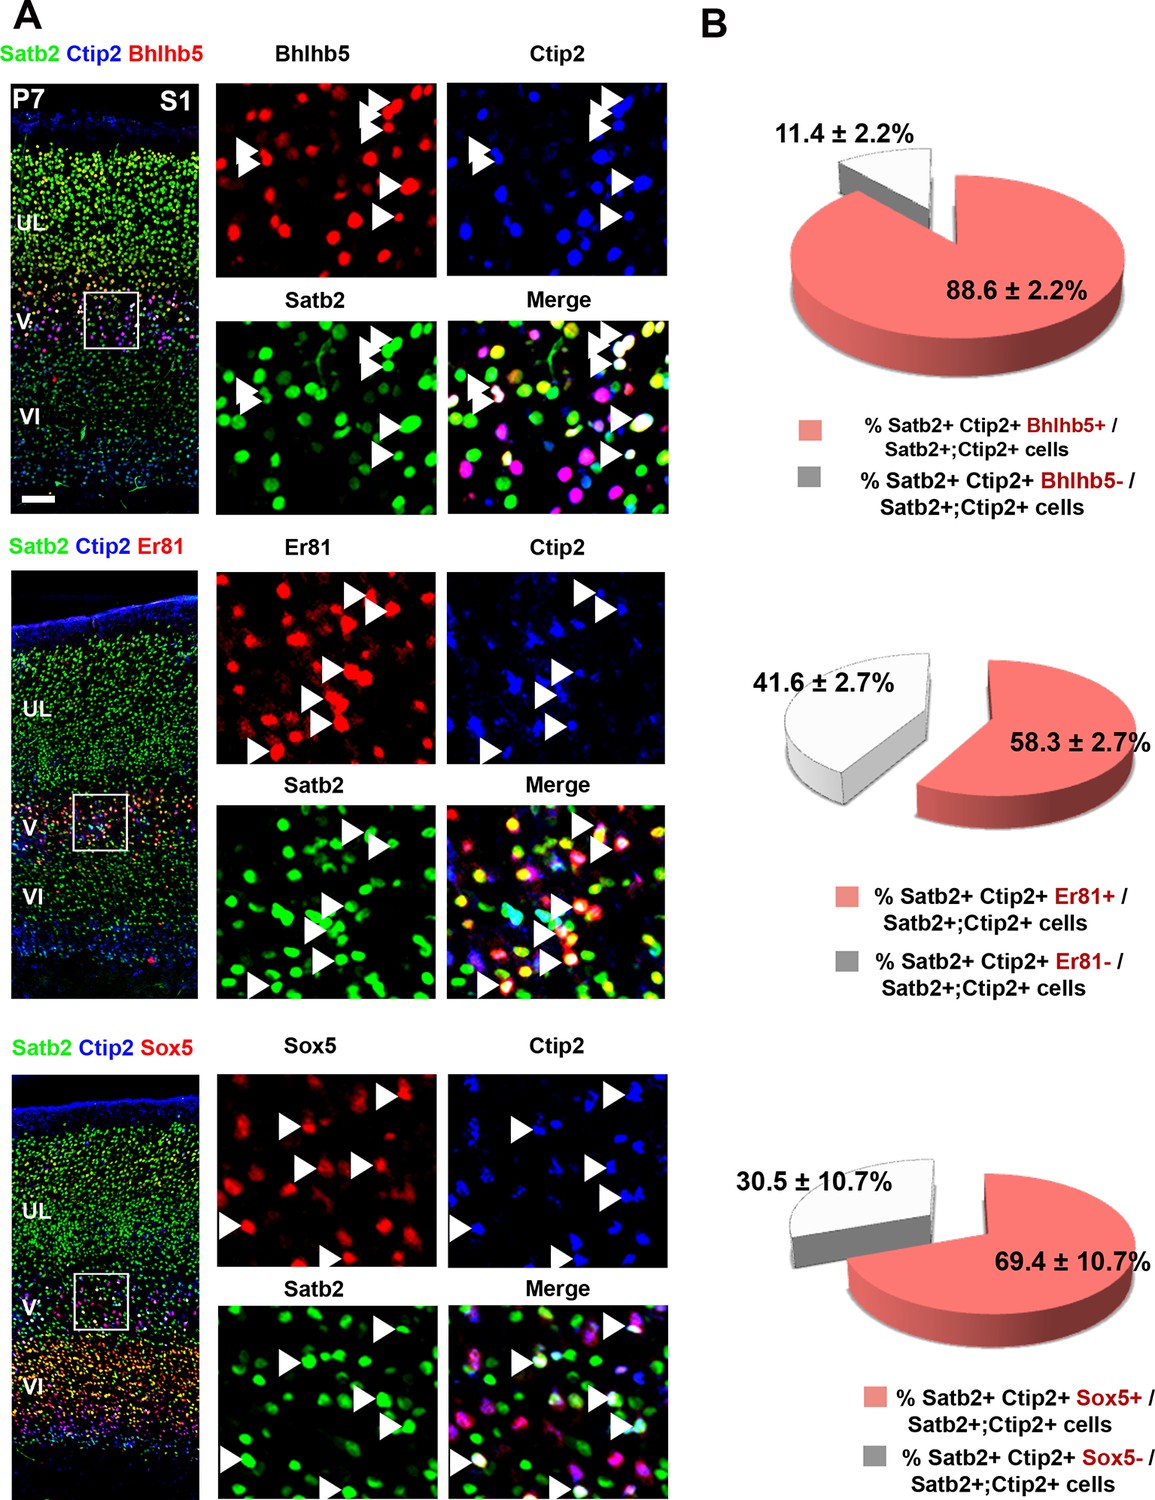
(A). To the left, detailed primary somatosensory area (S1) coronal sections from P7 brains co-immunolabeled for Ctip2, Satb2 and either Bhlhb5, Er81 or Sox5. On the right, squared panels represent high-magnification views of boxes depicted in left panels. Arrowheads indicate triple labelled cells. (B) Quantification of triple-positive cells in layer V of S1. Data are represented as means ± SEM. Scale bar: 100 µm. SEM, standard error of the mean.
Figure 3 with 2 supplements
Morphometric and electrophysiological characterization of Thy1-eYFP-H layer V neurons.
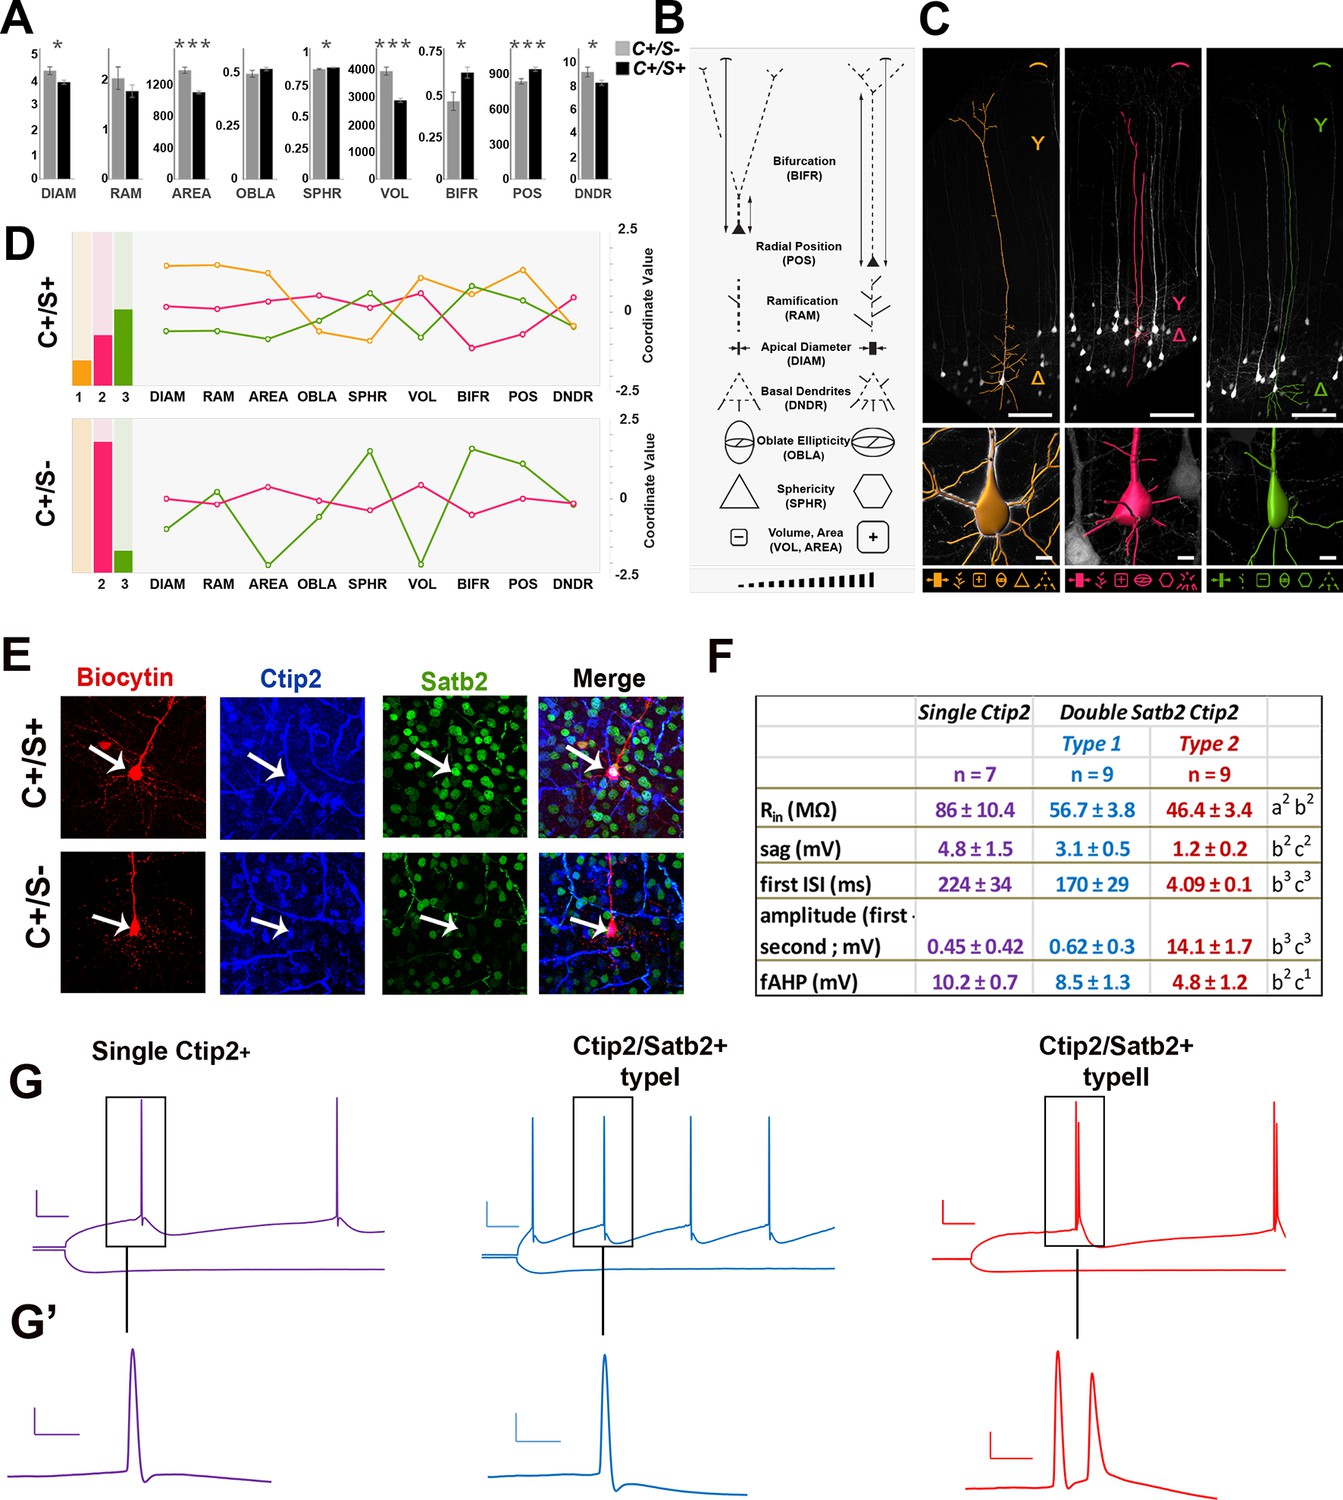
(A). The bar charts represent comparisons between double C/S+ (black) and single Ctip2+ (grey) neurons for different morphological features in YFP+ cells of P21 Thy1-e-YFP-H transgenic brains. The asterisks indicate statistical significance. *p≤0.05, **p≤0.01, ***p≤0.001. (B). Pictograms used to schematically illustrate morphological features and qualitative differences among YFP+ neurons. (C). 3D reconstructions of representative neurons of the three distinct morphological profiles. Upper part of the image illustrates length (expressed as soma distance from the pial surface) and bifurcation of the apical dendrite. The bottom part of the images indicates soma reconstruction and basal dendrite data. (D). The bar charts on the left represent the relative number of cells belonging to the morphological profiles identified by K-mean clustering analysis performed separately on each of the two molecular classes (double C/S+ and single Ctip2+ cells). The line graphs on the right represent morphological features for profile 1 (orange), unique to double C/S+ cells, profile 2 (magenta) and 3 (green), shared by both groups. (E). Immunofluorescence for Satb2, Ctip2, and biocytin on S1 coronal sections from P21 Thy1-eYFP-H transgenic cortices. (F). Table showing the input resistance (Rin reflecting the membrane resistance), the sag (difference of voltage between peak and steady-state potentials), the first interspike interval (ISI) and the difference of amplitude between the first and second action potential (AP), and the fast after-hyperpolarization (fAHP) of the three identified subpopulations. (G). Traces showing the variation in membrane potential when a hyperpolarizing current was injected (-0.2 nA; bottom) and the trains of action potentials when a depolarizing current was injected to the cell to reach the AP threshold (top). (G’). Magnifications of first and/or second APs. Scale bars: G, 20 mV - 50 ms; G’, 20 mV - 5ms. Statistics (Mann-Whitney): a = difference between Ctip2+ and C/S+ type 1 cells; b = difference between Ctip2+ and C/S+ type 2; c = difference between C/S+ type 1 and type 2 cells. Data are represented as means ± SEM. 1p<0.05; 2p<0.01; 3p<0.001. SEM, standard error of the mean. Scale bars: C, 10x mag., 100 µm; E, 40x mag., 10 µm.
Figure 3—figure supplement 1
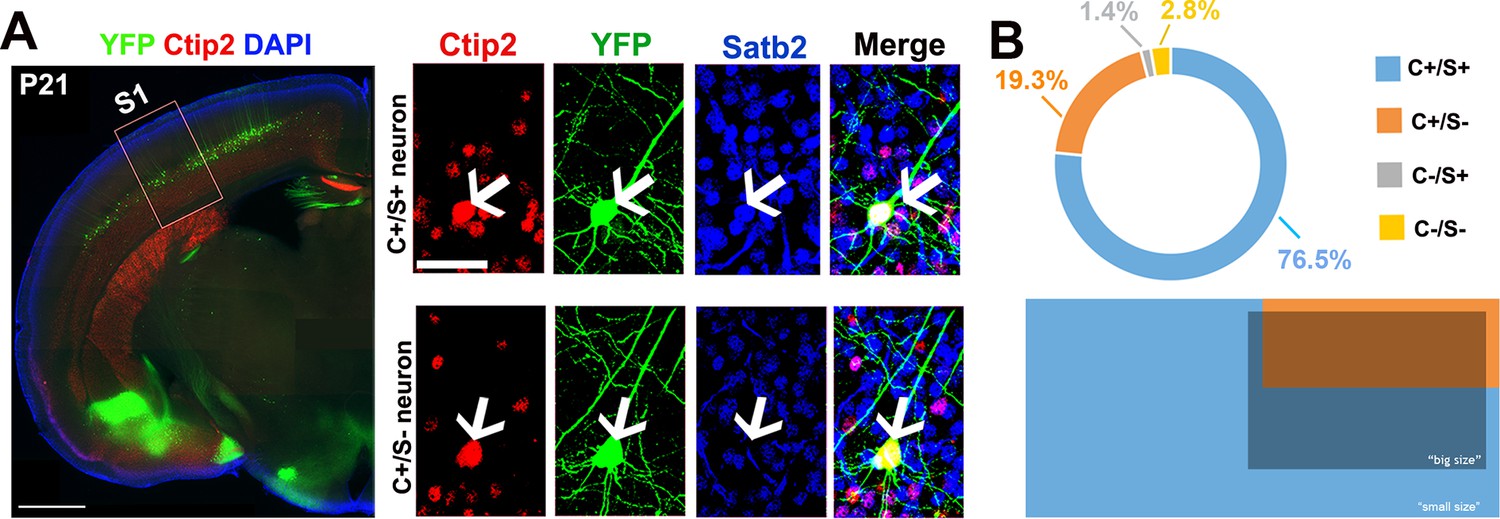
Morphometric properties of YFP-positive neurons from the Thy1-eYFP-H transgenic line.
(A). To the left, coronal section corresponding to the primary somatosensory area (S1) of a P21 Thy1-eYFP-H transgenic brain immunolabeled for YFP, Satb2, and Ctip2. To the right, square panels representing high-magnification views of neurons residing in the cortical region delimited by the red box in the left panel. These neurons are either positive for Ctip2 alone or for Ctip2/Satb2 (C/S+). (B). Distribution of C+/S+ (light blue), C+/S- (orange), C-/S+ (grey), and C-/S- (yellow) neurons among YFP+ cells. Light blue depicts neurons with small soma size (majority of C+/S+), whereas orange and dark blue indicate neurons with a big soma size (almost all Ctip2+ and a small percentage of C+/S+ YFP+ neurons). Scale bars: A, left panel, 1 mm; A, right panel, 50 µm.
Figure 3—figure supplement 2
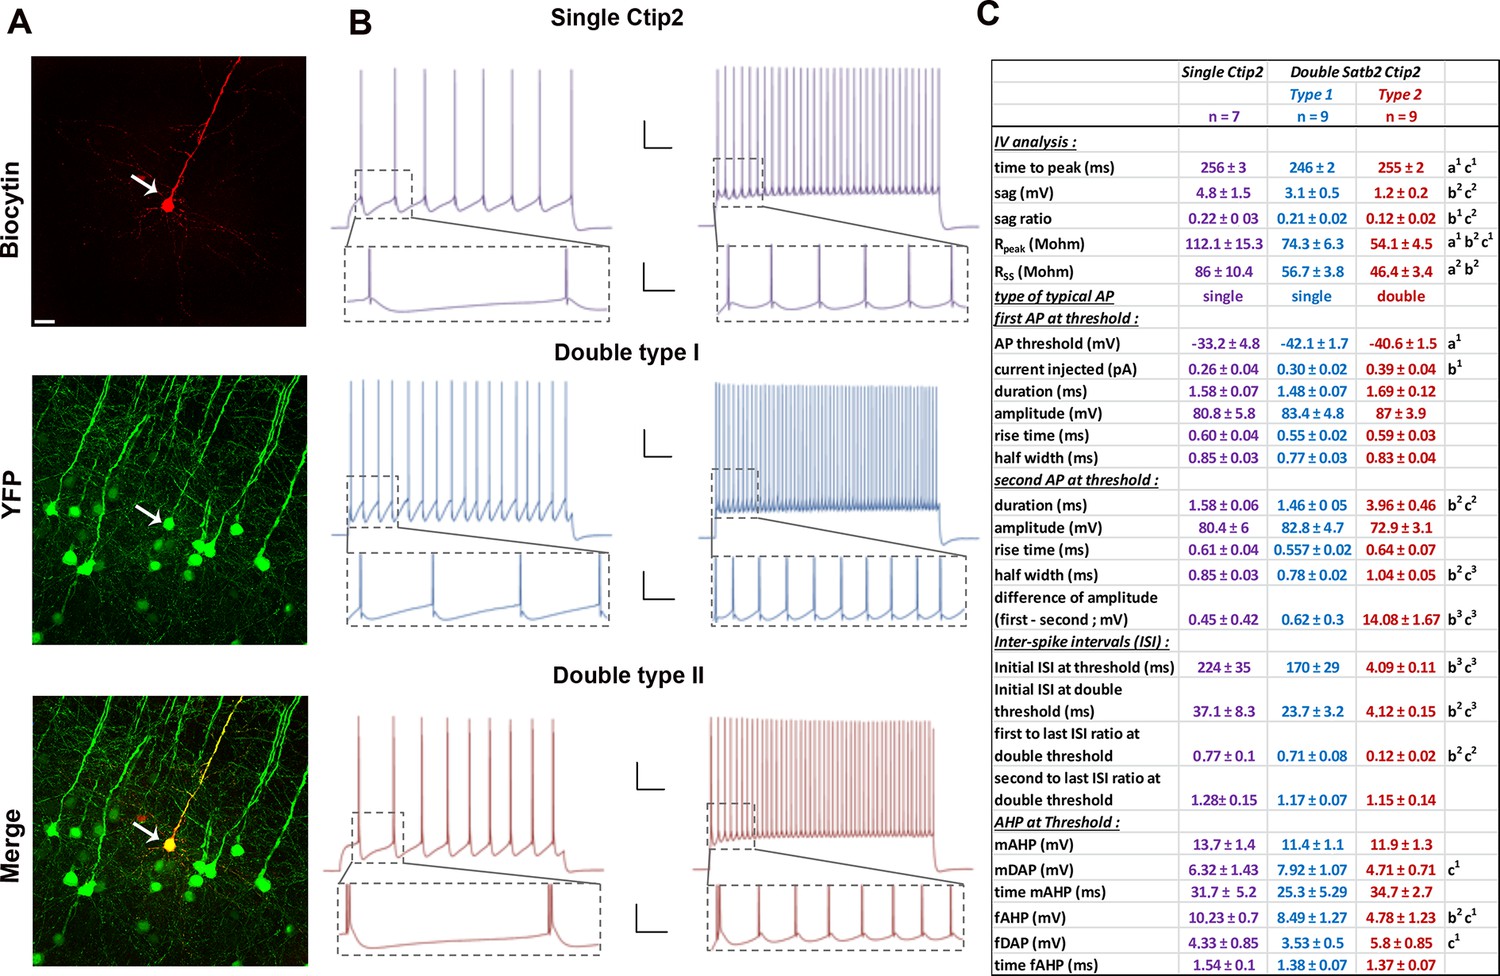
Electrophysiological analyses of YFP-positive neurons from the Thy1-eYFP-H transgenic line.
(A). Immunofluorescences for GFP and biocytin performed on YFP+ cells from Thy1-eYFP-H transgenic brains. (B). Trains of action potentials (AP) triggered by a depolarizing current injected for 2 s to reach the threshold of AP (left) or twice this threshold (right) in cells expressing Ctip2 only (top) or both Ctip2 and Satb2. Scale bars: 20 mV – 250 ms for top panels and 20 mV – 50 ms for bottom panels (insets). (C). Table showing the main features analyzed in C/S+ and single Ctip2+ cells. Statistics (Mann-Whitney): a = difference between Single Ctip2 and Double Satb2 Ctip2 type 1 cells; b = difference between Single Ctip2 and Double Satb2 Ctip2 type 2; c = difference between Double Satb2 Ctip2 type 1 and type 2. Data are represented as means ± SEM. 1p<0.05; 2p<0.01; 3p<0.001. SEM, standard error of the mean. Scale bar: A, 100 µm.
Figure 4 with 2 supplements
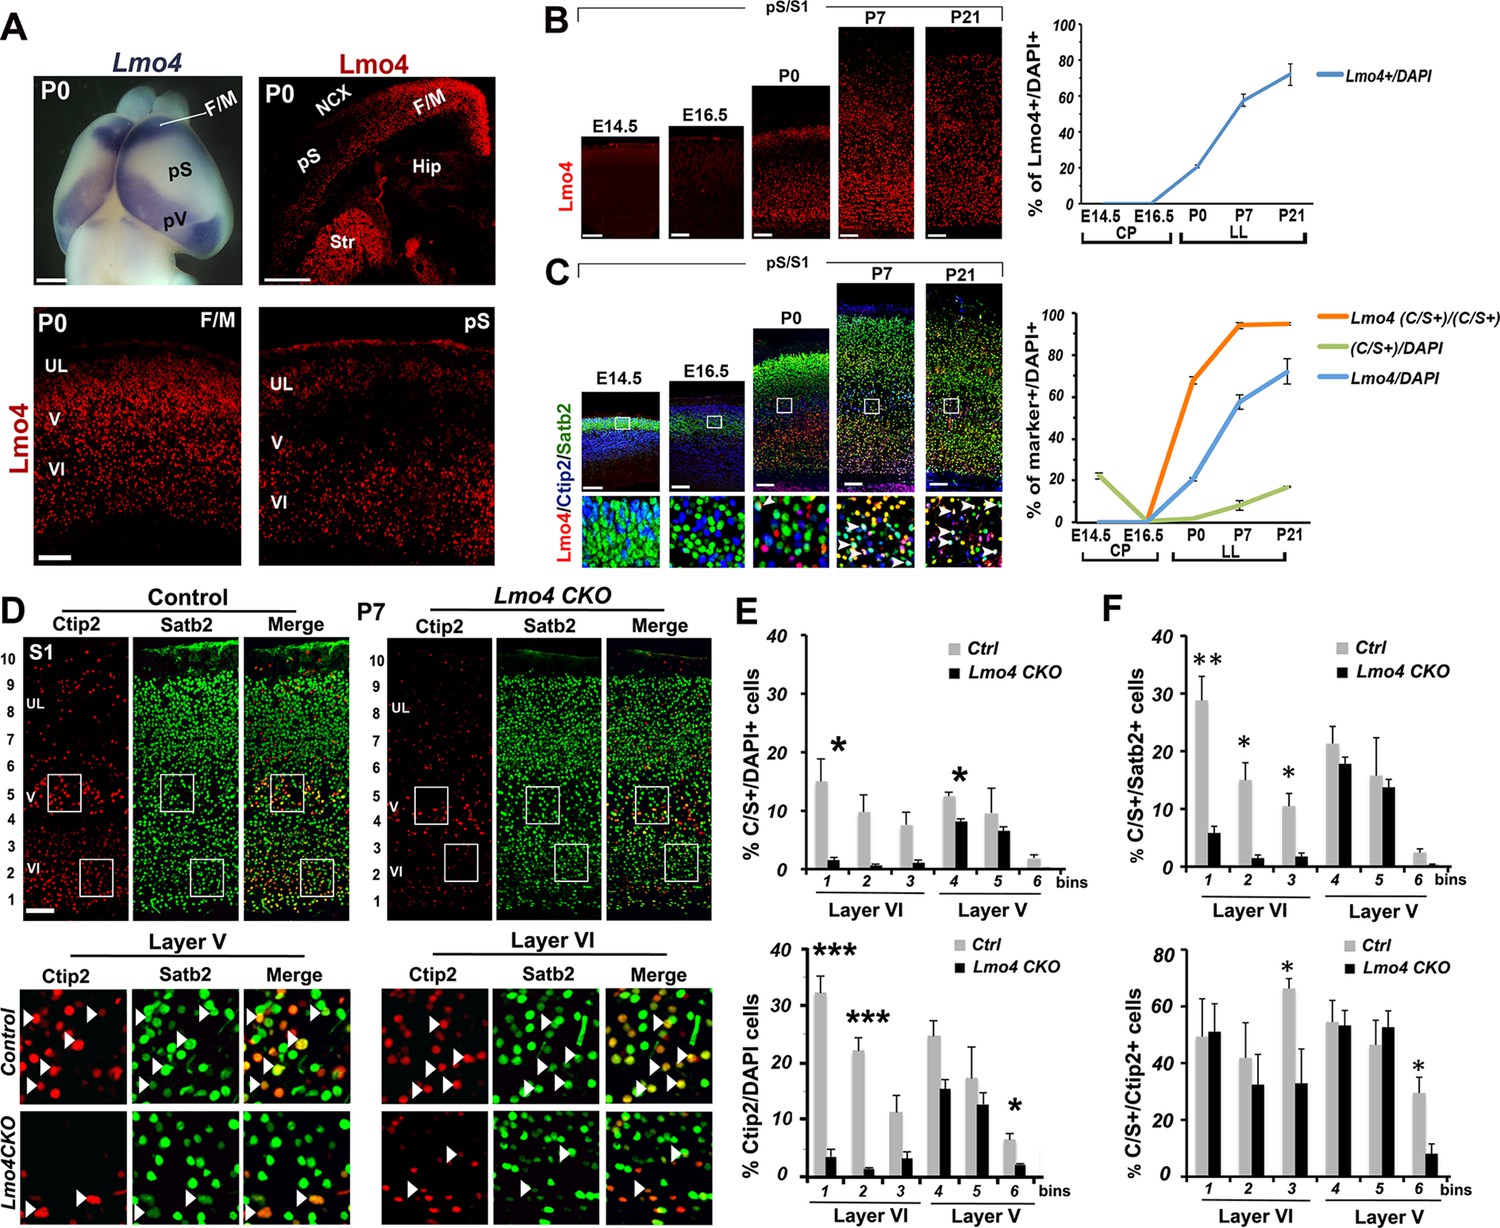
Lmo4 controls the number of Ctip2+ and double C/S+ neurons in the somatosensory cortex.
(A). Whole-mount in situ hybridization for Lmo4 on P0 brain (top left panel) and immunofluorescence for Lmo4 on coronal sections. (Below) Expression of Lmo4 in high-magnification views of frontal motor (F/M) and prospective somatosensory (pS) coronal sections. (B). Coronal sections from pS and primary somatosensory area (S1) of brains from E14.5 to P21 immunostained for Lmo4. On the right, time course of the percentage of Lmo4+ neurons on the total of DAPI+ cells (cortical plate -CP- for prenatal brains and lower layers –LL- for postnatal brains). (C). Triple immunostaining for Lmo4/Ctip2/Satb2 on coronal sections from pS and S1 E14.5 to P21 brains. Bottom squared panels represent high-magnification views of boxes in layer V depicted in top panels. On the right, quantification of Lmo4+ (blue line) and Ctip2/Satb2+ (C/S+) cells (green line) on the total of DAPI+ cortical cells, and of triple Lmo4/C/S+ cells (orange) on the total number of C/S+ neurons. (D). Double immunofluorescence for Satb2 and Ctip2 on coronal sections of P7 control and Lmo4 CKO somatosensory (S1) areas. Bottom squared panels represent high-magnification views of boxes in layers V and VI of top panels. Arrowheads point to double C/S+ neurons. (E and F) Quantification and layer distribution of double C/S+ or single Ctip2+ neurons on the total of DAPI+ cells (E), and of double C/S+ on the total of Satb2+ (top panel F) or Ctip2+ (bottom panel F) neurons. NCX: neocortex, pV: prospective visual, Hip: hippocampus, Str: striatum, UL, upper layer neurons. Scale bars: B, C, D and lower panels of A, 100 μm, upper panels of A, 1mm. Data are represented as means ± SEM. *p≤0.05, **p≤0.01, ***p≤0.001. SEM, standard error of the mean.
Figure 4—figure supplement 1
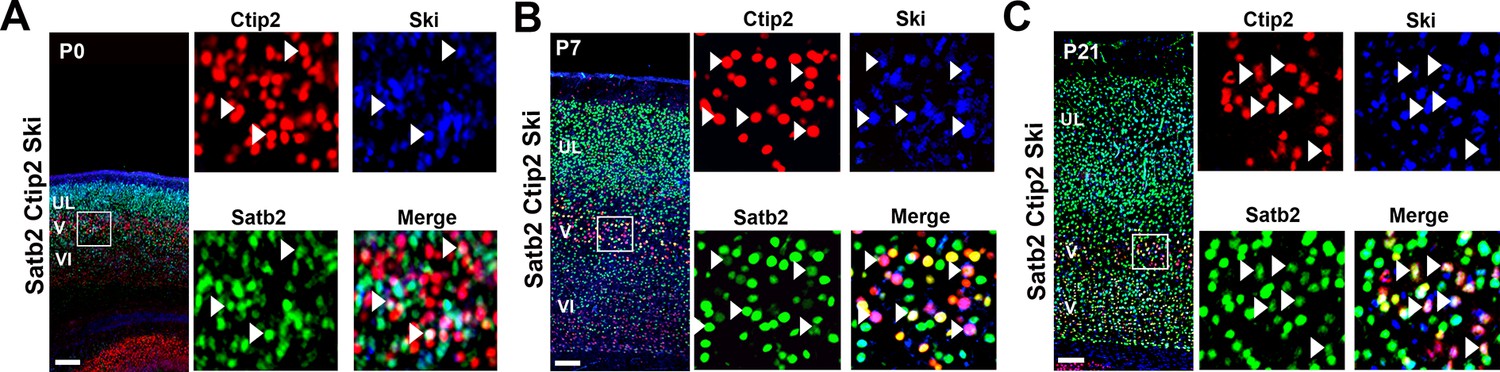
Ski is expressed by several C/S+ neurons at postnatal stages.
(A-C). Left panel, coronal sections of S1 from P0 (A), P7 (B), and P21 (C) triple immunolabeled for Satb2, Ctip2, and Ski. Square panels on the right in (A-C) represent high-magnification views of boxes depicted in left panels. Arrowheads indicate triple-positive cells for Satb2/Ctip2/Ski. Scale bars: A-C, 100 µm.
Figure 4—figure supplement 2
Unaltered distribution of Satb2+ neurons in the absence of Lmo4.
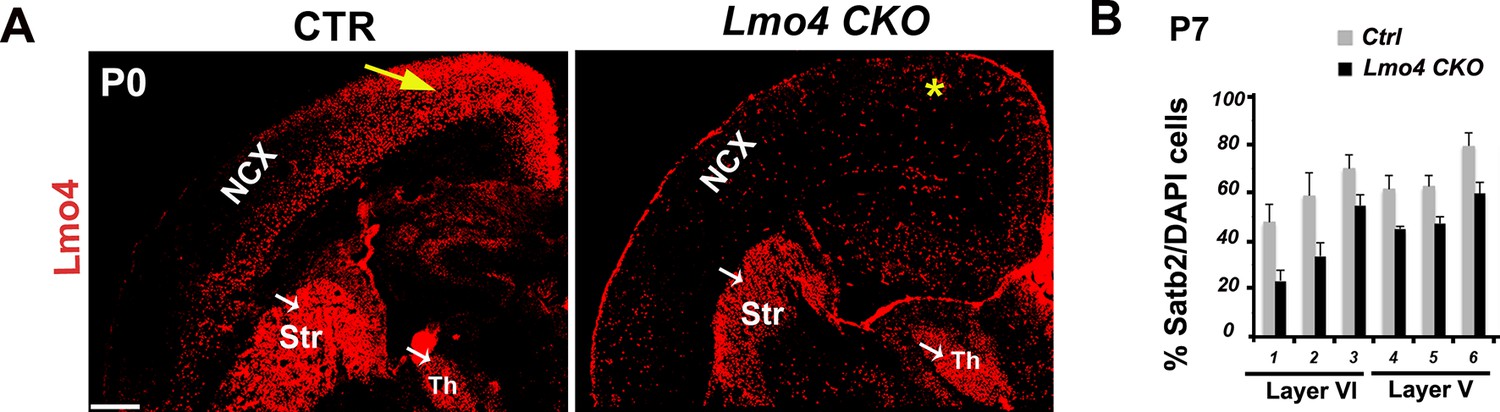
(A). Coronal sections of pS regions from controls and Lmo4 CKO (Lmo4 flox/floxEmx1Cre)P0 brains immunolabeled for Lmo4. Yellow arrow and asterisk indicate expression and absence of Lmo4 in the neocortex (NCX), respectively. White arrows indicate maintenance of Lmo4 expression in the striatum (Str) and thalamus (Th) in both genotypes. (B). Quantification and laminar distribution of the total number of Satb2+ cells show no significant changes in Lmo4 CKO S1 cortices compared to control ones at P7. Data are represented as means ± SEM. SEM, standard error of the mean. Scale bar: A, 600 µm.
Figure 5
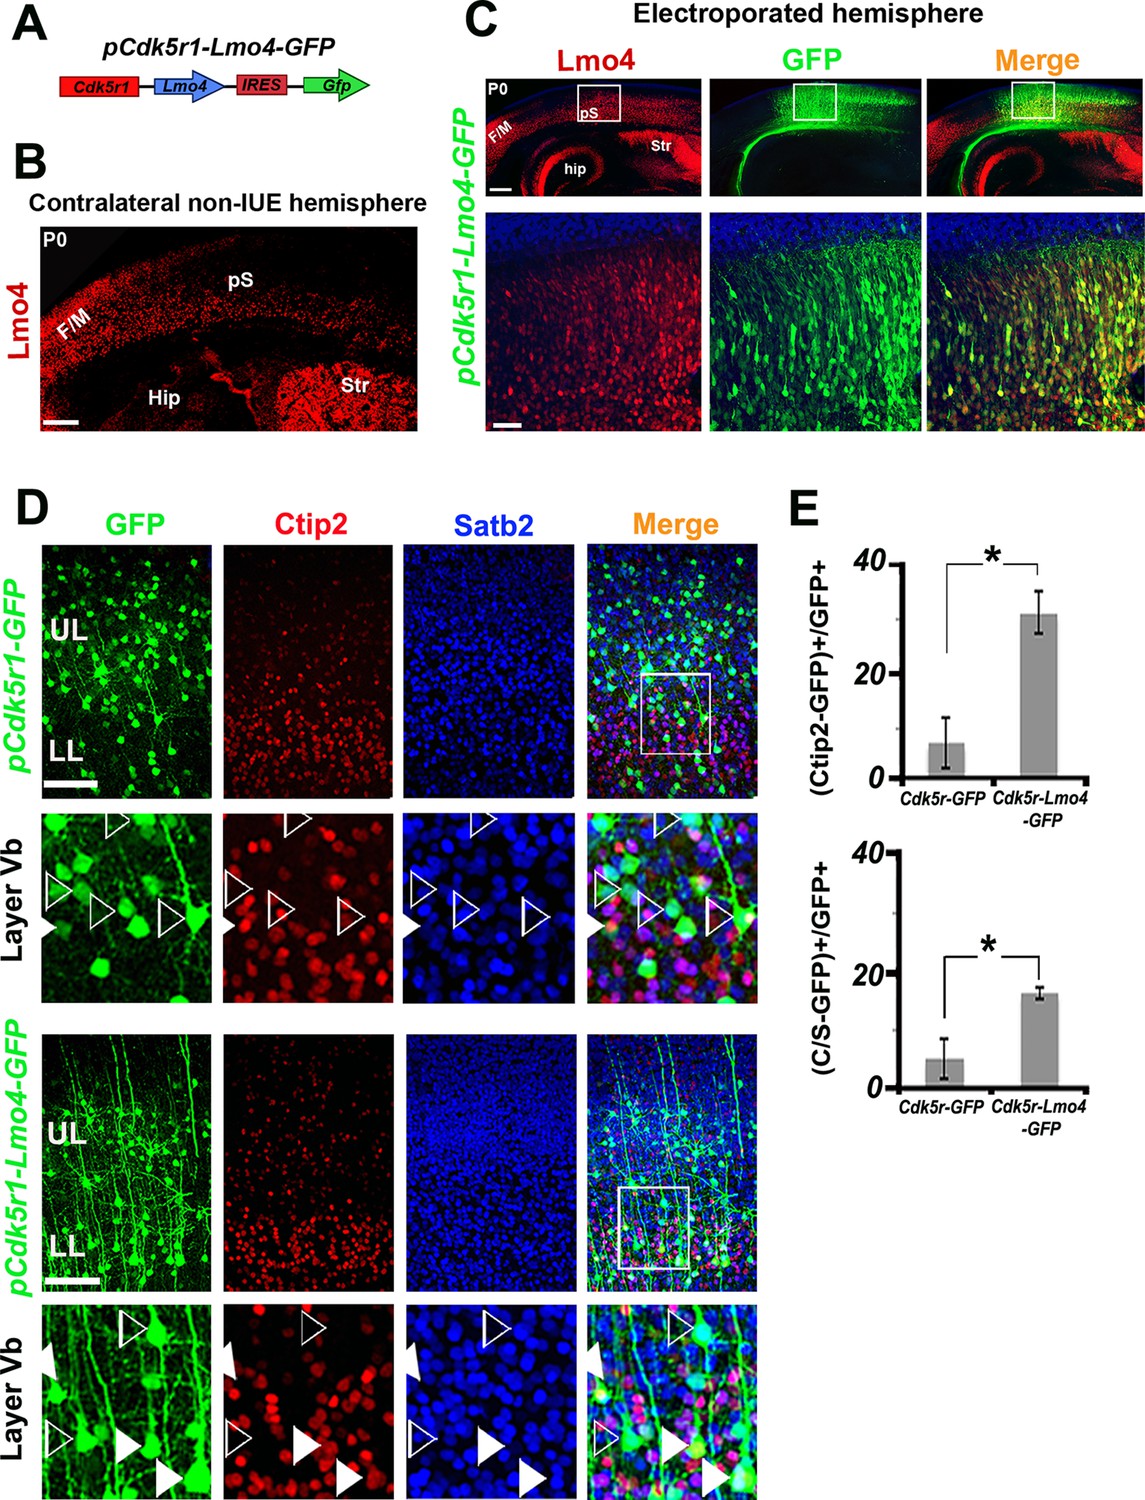
Lmo4 overexpression increases the number of Ctip2+ and C/S+ neurons in lower layers.
(A). Schematic representation of the vector used to overexpress Lmo4 in postmitotic neurons. (B). Immunostaining for Lmo4 on a coronal section of the contralateral (non-electroporated) hemisphere of P0 electroporated brains. (C). Coronal sections of a pCdk5r1-Lmo4-IRES-GFP electroporated E13.5 hemisphere immunolabeled for Lmo4 and GFP at P0. Bottom squared panels represent high-magnification views of boxes depicted in upper panels. (D). Immunostaining for Satb2, Ctip2, and GFP on coronal sections from P7 S1 cortices electroporated at E13.5 with pCdk5r1-IRES-GFP (on the top) or pCdk5r1-Lmo4-IRES-GFP (on the bottom). Squared panels represent high-magnification views of boxes depicted in top panels. Filled arrowheads indicate double C/S+ GFP+ cells, whereas empty arrowheads indicate GFP+ cells not expressing Ctip2. (E). Quantification of Ctip2+/GFP+ cells on the total number of GFP+ cells (on the top), and of (C/S+)/GFP+ cells on the total number of GFP+ cells (on the bottom) in layer V of electroporated brains. Data are represented as means ± SEM. *p≤0.05. (IUE) In utero electroporated; (Hip) hippocampus; (F/M) frontal motor area; (pS) prospective somatosensory area; SEM, standard error of the mean. Scale bars: B,C 300 µm; C, high magnification: 50 µm, D, 100 μm.
Figure 6 with 2 supplements

Increase of Lmo4- and double C/S-expressing neurons in the motorized somatosensory cortex of Nr2f1 CKO brains.
(A). Whole-mount in situ hybridization for Lmo4 (top panels) and Lmo4 immunofluorescence on coronal sections from the prospective somatosensory (pS) cortex (bottom panels) of P0 control and Nr2f1 CKO brains. (B). Quantification and layer distribution of Lmo4+ neurons in pS of P0 control and Nr2f1 CKO brains. (C). Coronal sections from the pS of P0 control and Nr2f1 CKO brains immunolabeled for Ctip2 and Satb2. Bottom squared panels represent high-magnification views of layer V neurons in boxes depicted in top panels. Arrowheads indicate C/S+ neurons. (D). Quantification of Ctip2+ and C/S+ neurons in the pS of P0 control and Nr2f1 CKO brains as a percentage of the total number of cells (DAPI+) or of Satb2+ neurons. (E). Coronal sections of S1 from controls and Nr2f1 CKO P7 brains retrogradely-labeled in the pontine region and in the cervical spinal cord. (F). Immunofluorescence for Satb2 and Ctip2 on P7 Nr2f1 CKO S1 retrogradely-labeled cortices. Filled arrowheads in high-magnification views indicate retrogradely-labeled subcerebral projection neurons (SCPNs) double positive for Satb2 and Ctip2, whereas empty arrowheads indicate retrogradely-labeled SCPNs positive for Ctip2. (G). Quantification of Ctip2+ and C/S+ retrogradelylabeled SCPNs on the total number of labeled PNs in layers Va, Vb, and VIa of Nr2f1 CKO brains. F/M, frontal motor area; pS, prospective primary somatosensory area; pV, prospective primary visual area; CSpPN, corticospinal projection neurons. UL, upper layers; VI, layer VI. Data are represented as means ± SEM. *p≤0.05, **p≤0.01, ***p≤0.001. SEM, standard error of the mean. Scale bars: A, 1 mm; lower panel A, C, 100 μm, E, F, 200 μm; high-magnification views in F, 50 µm.
Figure 6—figure supplement 1
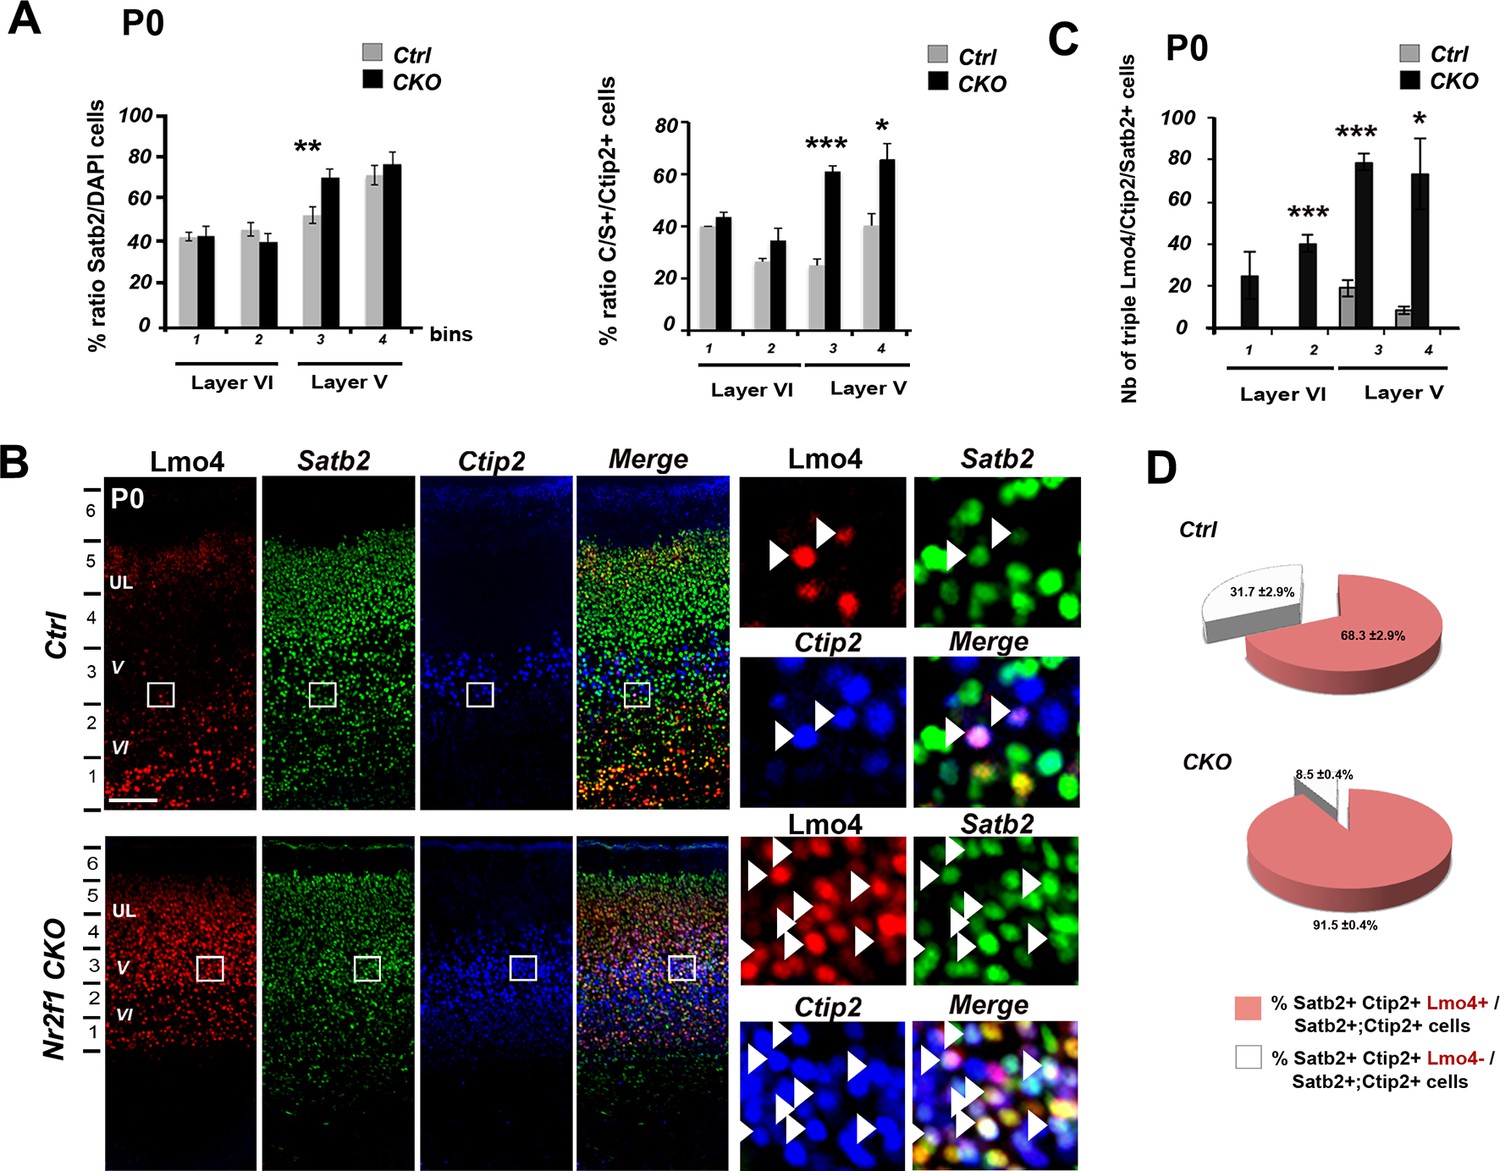
Increase of double Ctip2/Satb2+ and triple Lmo4/Ctip2/Satb2+ neurons in the motorized Nr2f1 CKO somatosensory cortex.
(A). Quantification and layers V and VI distribution of the total population of single Satb2+ cells (left) and of double C/S+ cells on the total of Ctip2+ neurons (right) in P0 control (Ctrl) and Nr2f1 CKO (CKO) pS cortices. (B). Triple immunostaining for Lmo4/Ctip2/Satb2 on P0 control and Nr2f1 CKO pS coronal sections;on the right, high-magnification views of the boxes depicted in left panels. Arrowheads indicate triple Lmo4+/(C/S+) neurons. (C). Distribution of triple Lmo4+/(C/S+) neurons in layers V and VI of pS in controls and mutant brains. The quantity of neurons for each layer was indicated as an absolute number counted in a 600-μm wide region of P0 control and Nr2f1 CKO cortices. (D). Pie charts representing the percentage of Lmo4+/(C/S+) neurons on the total of C/S+ neurons in the pS of P0 control and Nr2f1 CKO brains. Data are represented as means ± SEM. *p≤0.05, **p≤0.01, ***p≤0.001. SEM, standard error of the mean. Scale bars: B, 100 μm.
Figure 6—figure supplement 2
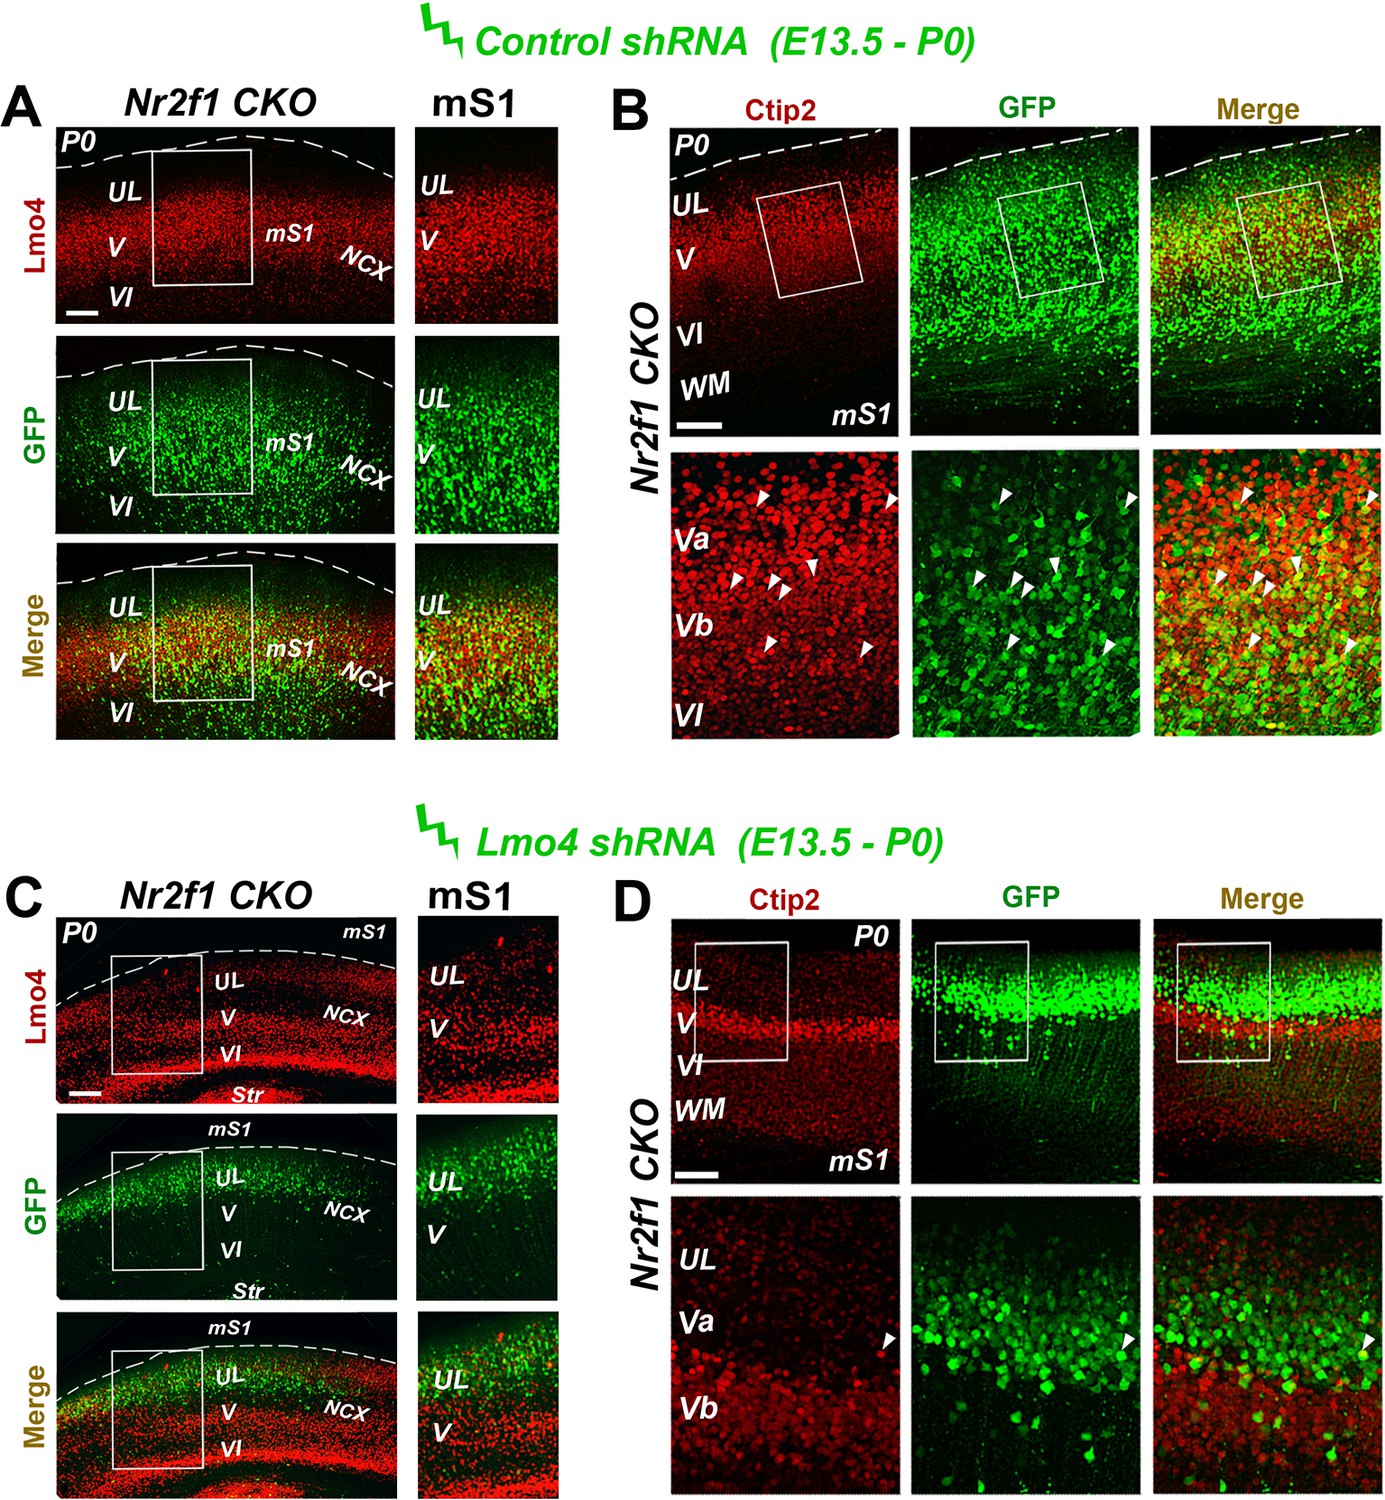
Decrease of Ctip2 expression in the motorized Nr2f1 CKO somatosensory cortex after Lmo4 downregulation.
(A, C) Immunostaining for Lmo4 and GFP on the motorized somatosensory cortex (mS1) of P0 Nr2f1 CKO mice electroporated at E13.5 with a control shRNA (A) or Lmo4 shRNA (C). To the right, details of boxes depicted in left panels. (B, D) On the top, coronal sections from the mS1 cortex of P0 Nr2f1 CKO mice electroporated at E13.5 with a control shRNA (B) or Lmo4 shRNA (D) immunolabeled for Ctip2 and GFP. On the bottom, high-magnification views of boxes depicted on top panels. Arrowheads indicate GFP cells electroporated with the control shRNA or Lmo4 shRNA expressing Ctip2. UL, upper layer neurons; Str, striatum; WM, white matter; mS1, motorized somatosensory cortex; NCX, neocortex. Scale bars: (A-D), 100 μm.
Figure 7
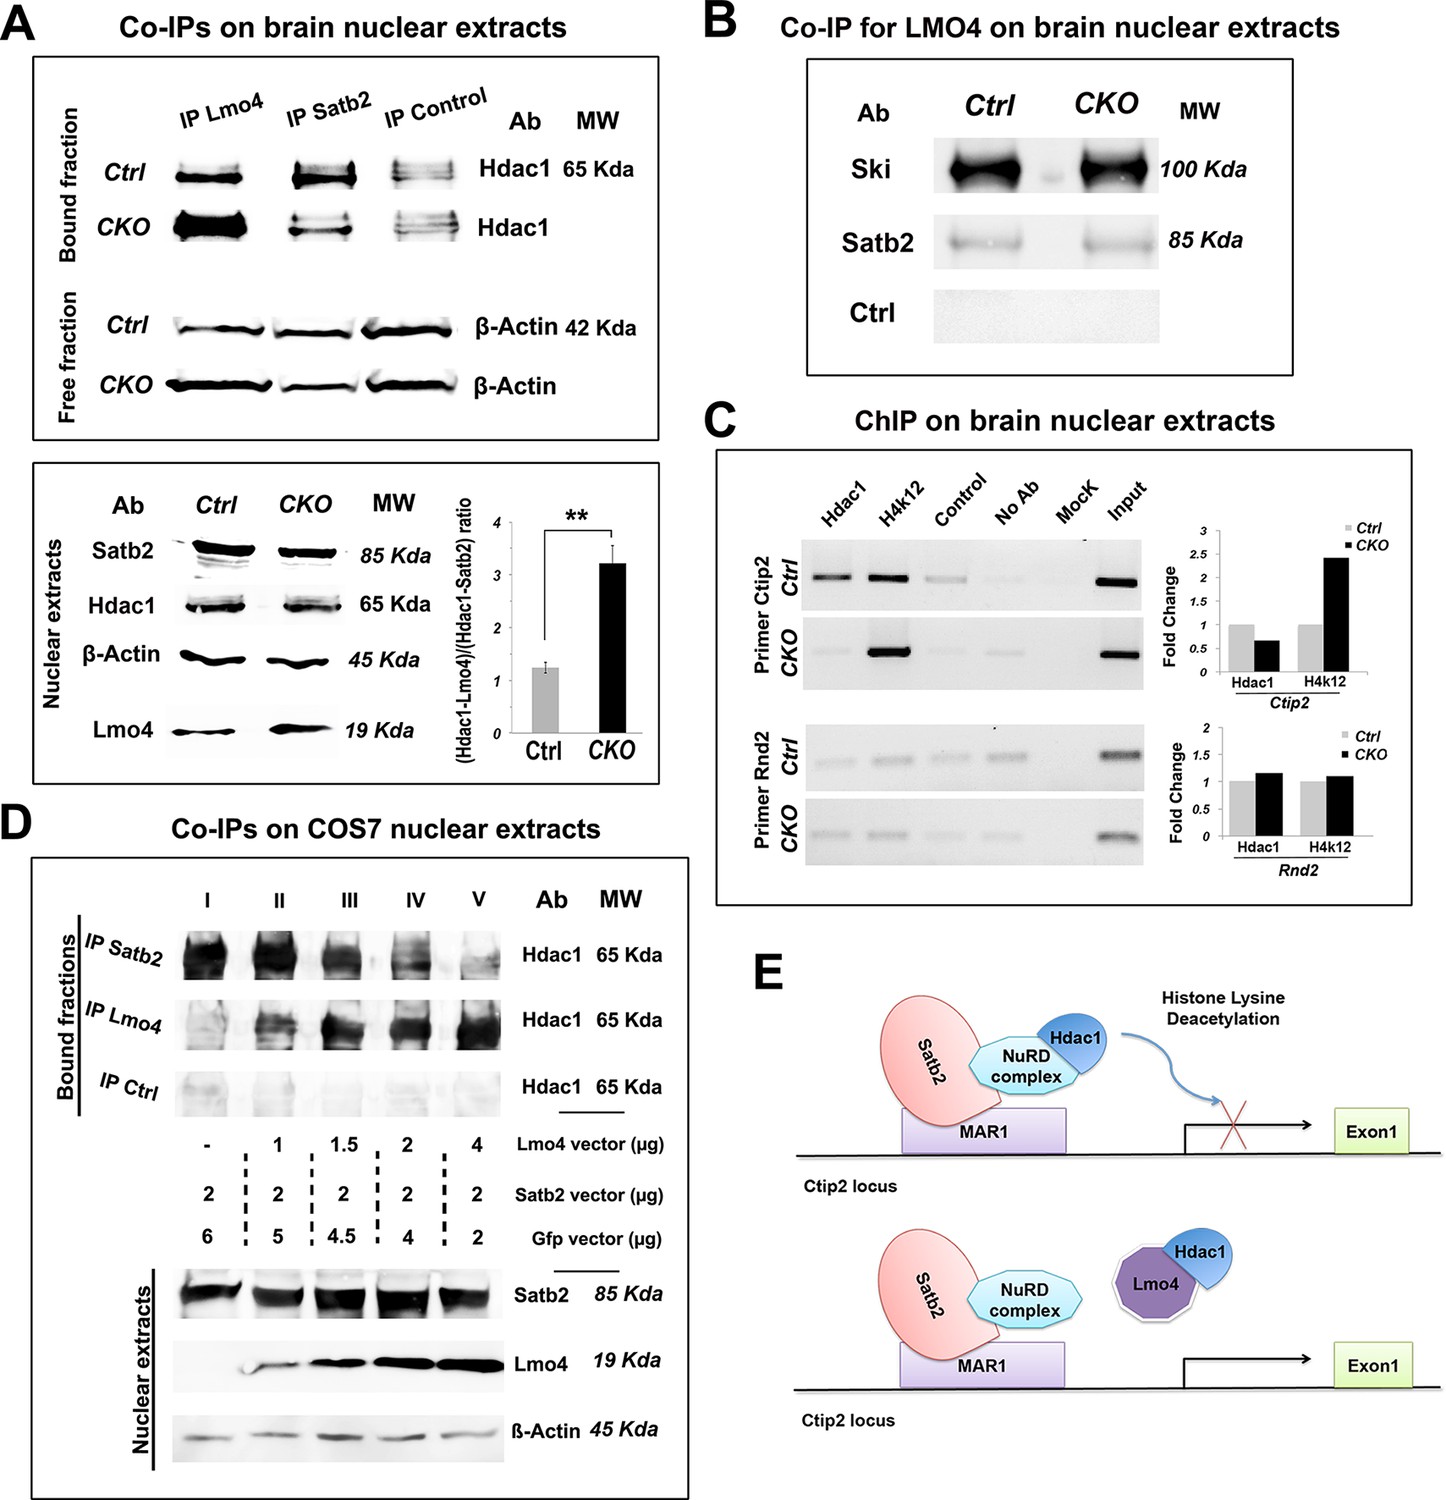
Lmo4 interacts with Hdac1 and prevents its binding to the Ctip2 locus.
(A). On the top, Western blot on nuclear extracts from controls and Nr2f1 CKO P1 cortices immunoprecipitated with antibodies specific for Lmo4 (IP Lmo4), Satb2 (IP Satb2), or an unrelated epitope (IP control). IP fractions were analyzed using an antibody against Hdac1, whereas the corresponding input fractions were analyzed with an antibody specific for β-actin. On the bottom-left, Western blot on nuclear extracts from controls and Nr2f1 CKO P1 cortices for Satb2, Hdac1, Lmo4, and β-actin. To the right, ratio between Hdac1-Lmo4 and Hdac1-Satb2 complexes immunoprecipitated from control and Nr2f1 CKO extracts. (B). Western blot performed on nuclear extracts from controls and Nr2f1 CKO P1 cortices immunoprecipitated with specific antibody for Lmo4. IP fractions were analyzed using an antibody against Ski, Satb2 or an unrelated epitope (control). (C). On the left, semi-quantitative PCR performed on Chromatin-immunoprecipitation (ChIP) samples from controls and Nr2f1 CKO P1 cortices. The assay was performed using antibodies against Hdac1, the anti-Histone H4 (acetyl K12) (H4K12) and primers amplifying a MAR1 sequence on Ctip2 and Rnd2 loci. On the right, QPCR performed on ChIP samples from controls and Nr2f1 CKO cortices. (D). On the top, Western blot on nuclear extracts from COS7 cells transfected with an equal amount of Satb2- and an increasing amount of Lmo4-expressing vectors and immunoprecipitated with antibodies specific for Satb2 (IP Satb2), Lmo4 (IP Lmo4), or an unrelated epitope (IP control). IP fractions were analyzed using an antibody against Hdac1. On the bottom, Western blot on nuclear extracts from the transfected COS7 cells with specific antibodies for Satb2, Lmo4, and β-actin showing increase of Lmo4 and similar Satb2 and β-actin protein levels. (E). Schematic model of the putative mechanism by which Lmo4 de-represses Ctip2 expression. . **p≤0.01. MAR1: Matrix attachment region 1; NuRD complex: Nucleosome Remodeling and Deacetylase complex.
Figure 8
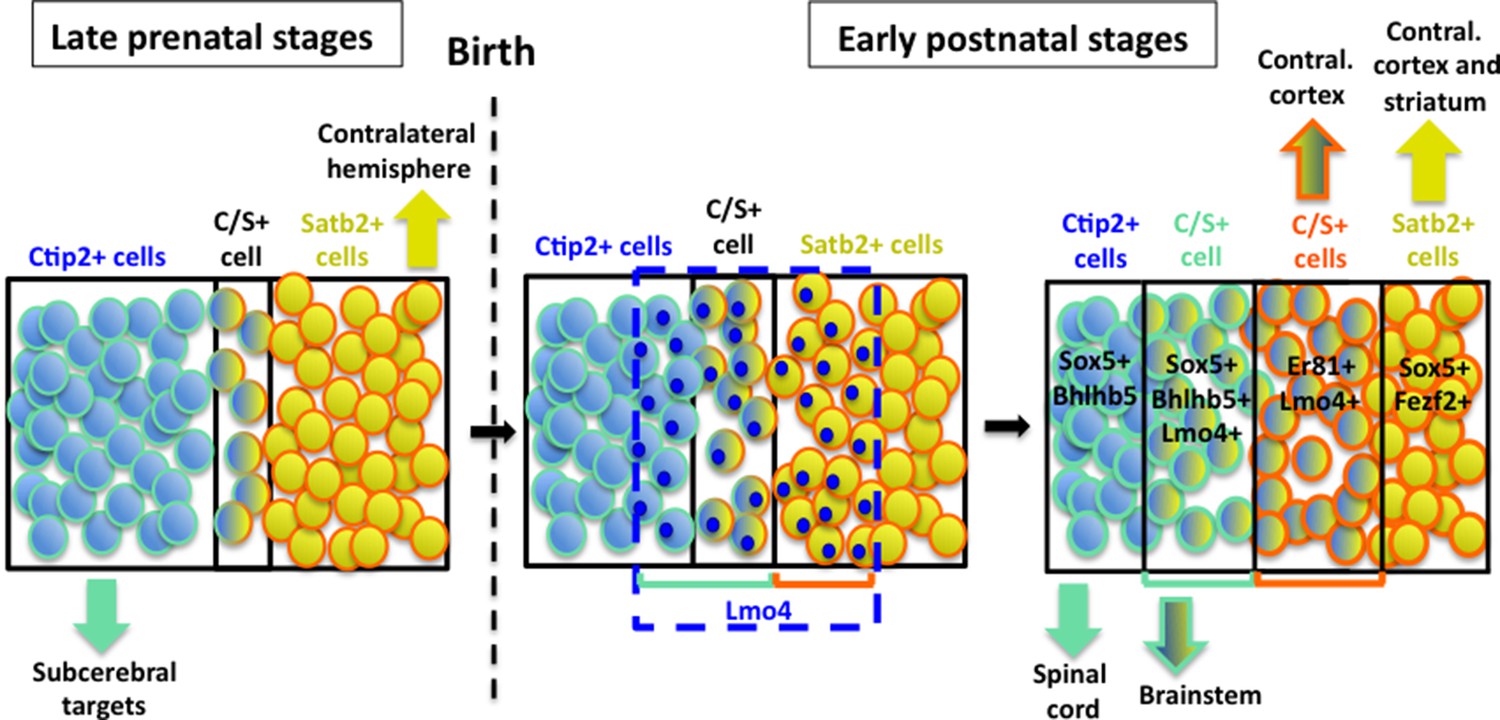
Hypothetical model of layer V neuronal subtype refinement.
After birth, Lmo4 expression progressively increases in Satb2+ and in Ctip2+ cells of S1 cortex. Lmo4 de-represses Ctip2 expression in Satb2+ cells and probably Satb2 in Ctip2+ cells. According to the different dynamics leading to the refinement of distinct C/S+ subclasses, these cells will project either to subcerebral or to contralateral targets. Vertically oriented arrows indicate connectivity at postnatal stages. The blue dashed line and blue circles in different cells delimit territories of Lmo4 expression. Blue marine circles surrounding cells depict subcerebral projection neuron (SCPN) subpopulations, whereas orange ones delineate callosal neuron (CPN) subgroups. Black lines delimit different neuronal populations of the somatosensory cortex.
Download links
A two-part list of links to download the article, or parts of the article, in various formats.
Downloads (link to download the article as PDF)
Open citations (links to open the citations from this article in various online reference manager services)
Cite this article (links to download the citations from this article in formats compatible with various reference manager tools)
Area-specific development of distinct projection neuron subclasses is regulated by postnatal epigenetic modifications
eLife 5:e09531.
https://doi.org/10.7554/eLife.09531


