Chromatin dynamics and the role of G9a in gene regulation and enhancer silencing during early mouse development
- University of Cambridge, United Kingdom
Figures
Figure 1
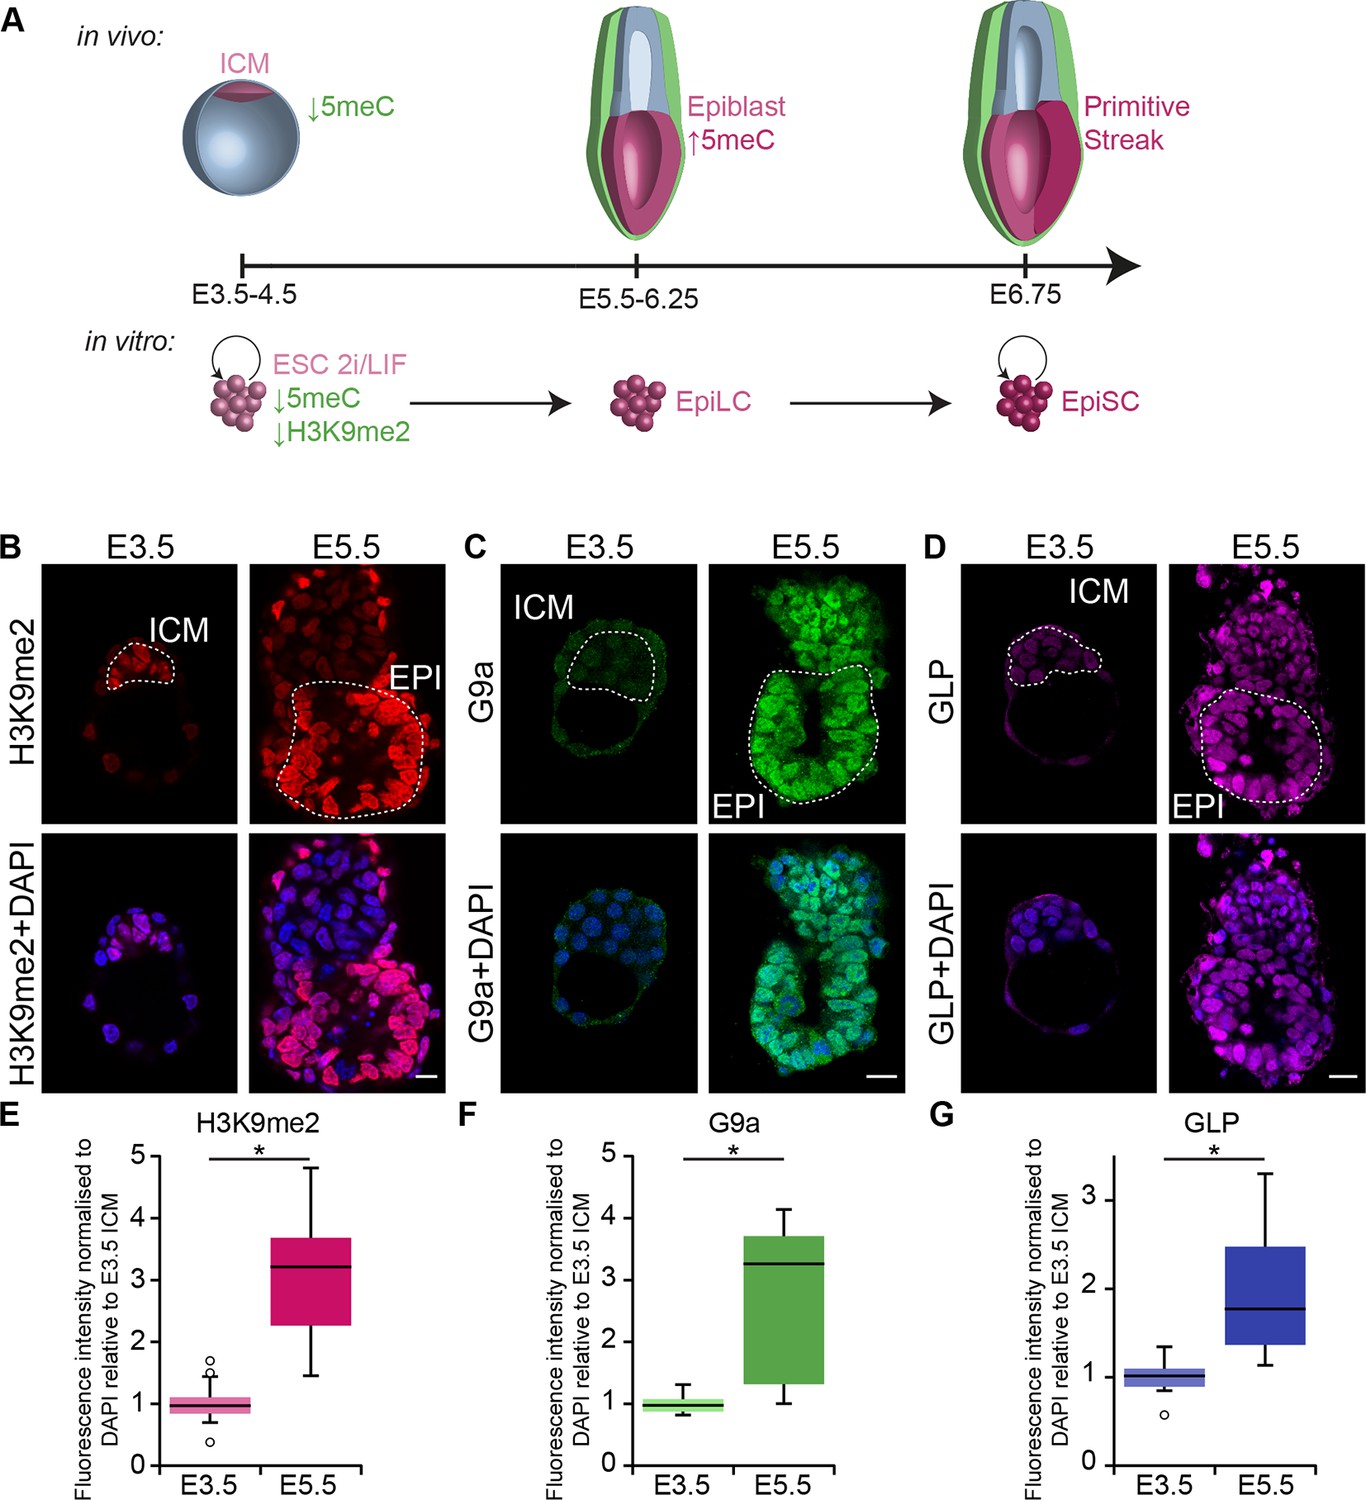
G9a-dependent programming occurs at implantation.
(A) Schematic of early mouse development and their in vitro equivalents. Genome-wide DNA demethylation after fertilisation leads to an epigenetic basal state with low 5meC in ICM of blastocysts. Shortly after implantation, the epiblast cells undergo epigenetic programming, which includes de novo DNA methylation. By E6.25, the epiblast is primed for somatic development, while being competent for germline specification. Gastrulation follows at E6.75. Naïve ESCs, primed EpiLCs and EpiSCs represent different stages of in vivo development. ESCs grown in 2i/LIF medium resemble the ICM, while EpiLCs, induced from ESCs after 48 h in response to FGF2 and Activin A, are equivalent to epiblast. Their prolonged culture results in EpiSCs, which are reminiscent of the anterior primitive streak (Kojima et al., 2014). (B–D) Whole-mount IF staining for H3K9me2 (B), G9a (C) and GLP (D) in E3.5 and E5.5 embryos. Dotted line shows the ICM, and the EPI. It is noteworthy that a single confocal plane is shown to maintain original IF intensity. For anti-G9a staining of E5.5 embryo, visceral endoderm was removed to reduce the background signal (scale bar = 20 μm). (E–G) Box plots showing IF signal quantification for H3K9me2 (E), G9a (F) and GLP (G). Data shows IF intensity normaliseormalized to DAPI for individual ICM or epiblast cells. At least 3 embryos and 20 cells were quantified for each time point. (*p<0.05 in Wilcoxon rank sum test). DAPI: 4',6-diamidino-2-phenylindole; EPI: epiblast; EpiLCs: epiblast-like cells; ESCs: embryonic stem cells; FGF2: fibroblast growth factor 2; GLP: G9a-like protein; ICM: inner cell mass; IF: immunofluorescence; 2i/LIF: two-inhibitor/leukemia inhibitory factor.
Figure 2 with 3 supplements
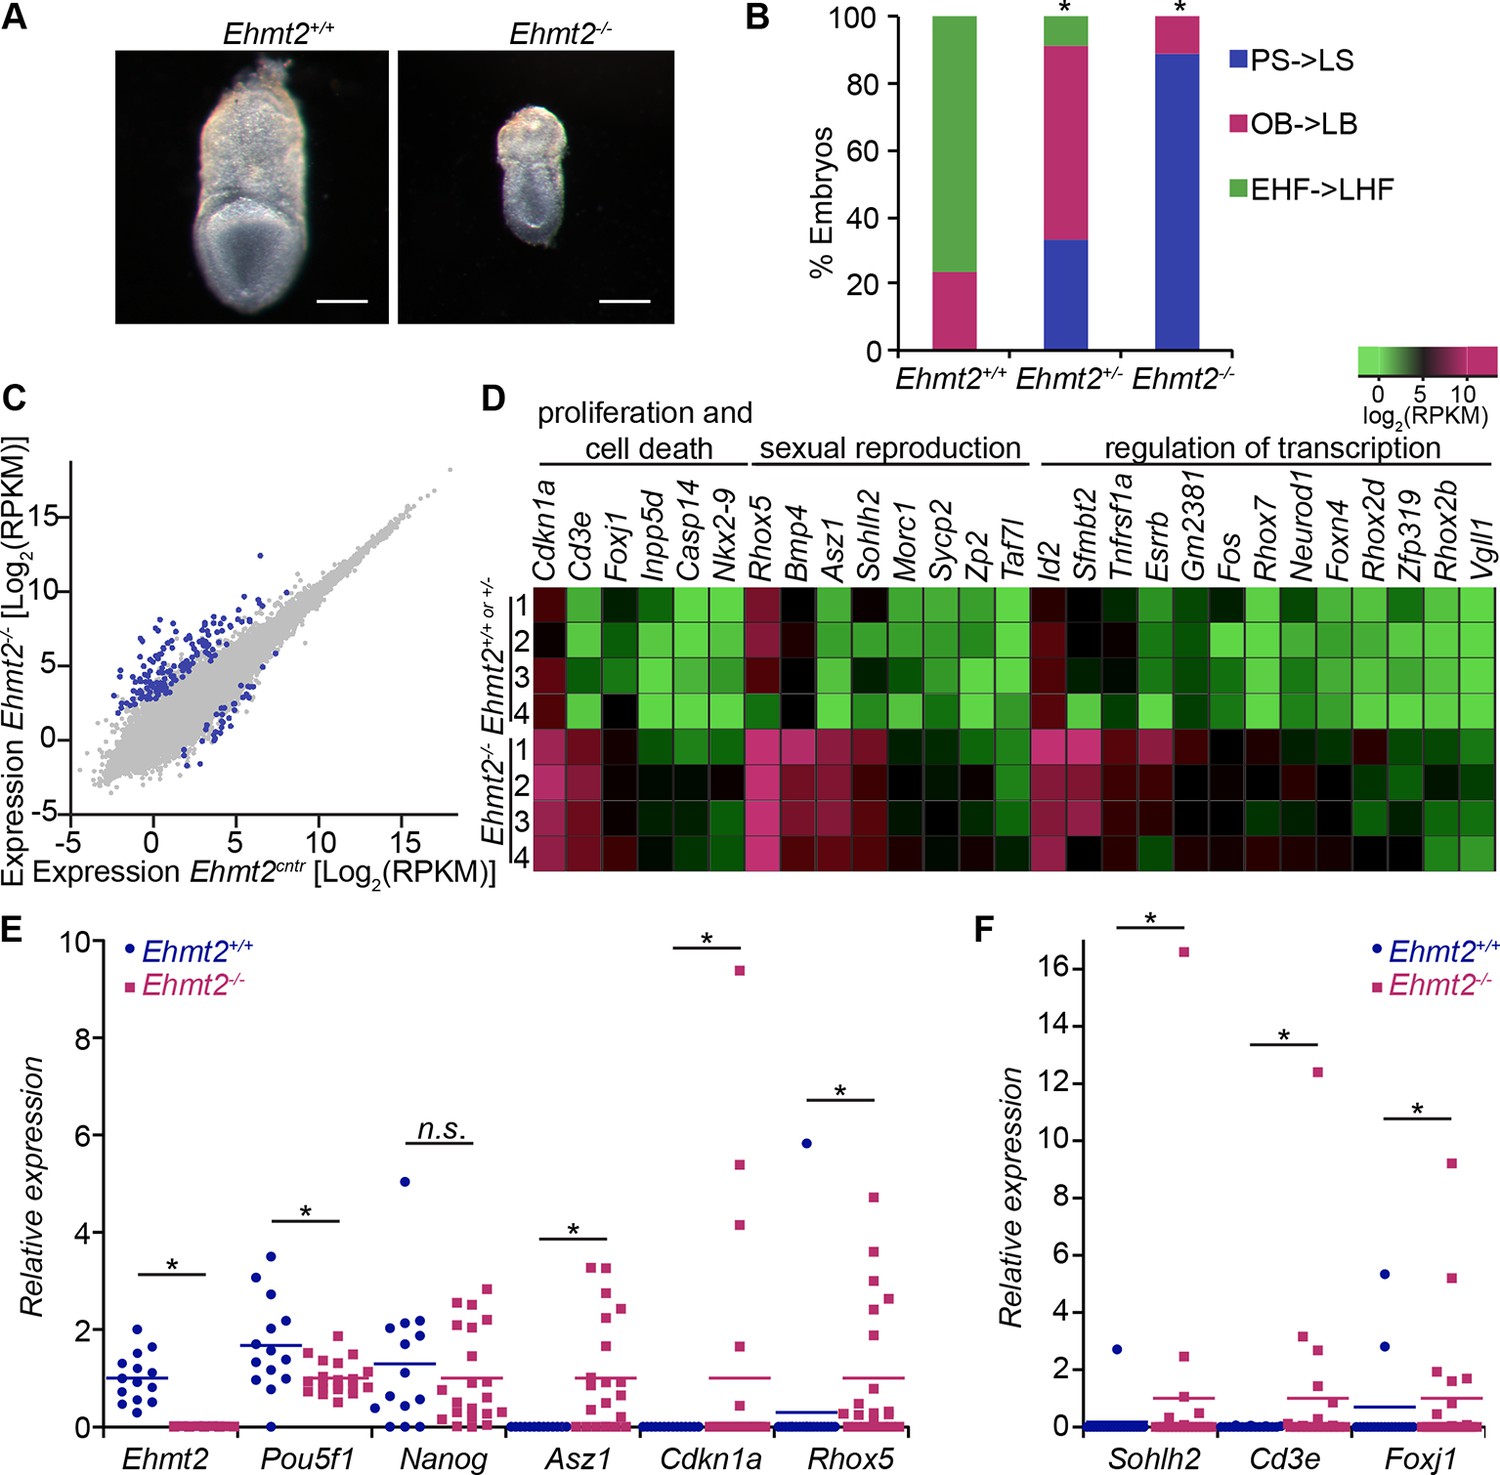
G9a represses germline and proliferation-related genes in the postimplantation epiblast.
(A,B) bright-field images of Ehmt2+/+and Ehmt2−/− embryos at E7.5 (A) (scale bar = 0.1 mm). At least nine embryos of each type were staged (B) (*Chi2 test p-value= <0.05). (C) Scatter plot showing transcript expression levels in Ehmt2+/+or +/− and Ehmt2−/− E6.25 epiblast. Blue points are differentially expressed genes (Log2RPKM>1, p-value<0.05, Log2(FC)>1.4). Shown is the geometric average from four biological replicates. (D) Heatmap showing expression of selected genes from enriched GO categories. (E,F) Single-cell RT-qPCR validation of RNA-seq performed on individual epiblast cells isolated from E6.25 Ehmt2+/+ or Ehmt2−/− embryos (minimum 2 embryos and 14 cells). Dot plots show levels of Ehmt2, pluripotency (Nanog, Pou5f1), germline (Asz1, Rhox5, Sohlh2) and proliferation regulators (Cdkn1a, Cd3e, Foxj1). Expression is normalised to Arbp and relative to average in Ehmt2−/− and for Ehmt2 relative to Ehmt2+/+. Statistical significance was calculated using Wilcoxon rank sum test for Pou5f1 and Nanog, where majority of WT and KO cells show detectable expression. For remaining genes a Chi2 test was used. (*p-value<0.05). Also see Figure 2—source data 1–4 and Figure 2—figure supplement 1–3. LHF: late head fold; EHF: early head fold; LB: late allantoic bud; OB: no allantoic bud; LS: late streak; PS: pre-streak. RT-qPCR: real-time quantitative polymerase chain reaction; RNA-seq: RNA sequencing; WT: wild-type: KO: knockout; GO: gene ontology; FC: fold change.
-
Figure 2—source data 1
List of differentially expressed genes in E6.25 Ehmt2−/− epiblast from RNA-seq analysis data is based on four individual Ehmt2−/− and control (Ehmt2+/+ or Ehmt2+/−) epiblasts.
Differentially expressed genes were identified using a minimum Log2(FC)>1.4 and maximum Fisher combined test of p-value<0.05. In the upregulated sample, expression was 1<log (RPKM). RNA-seq: RNA sequencing; RPKM: Reads Per Kilobase of transcript per Million mapped reads; FC: fold change.
- https://doi.org/10.7554/eLife.09571.005
-
Figure 2—source data 2
List of enriched GO terms in genes upregulated in E6.25 Ehmt2−/− epiblast GO term enrichment for biological processes was calculated using DAVID software with minimum five genes in a category and EASE p-value<0.05.
EASE: Expression Analysis Systematic Explorer; GO: gene ontology.
- https://doi.org/10.7554/eLife.09571.006
-
Figure 2—source data 3
List of differentially expressed genes in E6.25 Ezh2−/−epiblast from RNA-seq analysis data is based on 3 individual Ezh2−/− epiblasts and 3 individual control (Ezh2+/+ or Ezh2+/−) epiblasts.
Differentially expressed genes were identified using a minimum Log2(FC)>1.4 and maximum Fisher combined test of p-value<0.05. In the upregulated sample, expression was 1<log(RPKM). RNA-seq: RNA sequencing; RPKM: Reads Per Kilobase of transcript per Million mapped reads; FC: fold change.
- https://doi.org/10.7554/eLife.09571.007
-
Figure 2—source data 4
List of enriched GO terms in genes upregulated in E6.25 Ezh2−/− epiblast GO term enrichment for biological processes was calculated using DAVID software with minimum five genes in a category and EASE p-value<0.05.
EASE: Expression Analysis Systematic Explorer; GO: gene ontology.
- https://doi.org/10.7554/eLife.09571.008
Figure 2—figure supplement 1

Epigenetic programming by G9a in postimplantation epiblast.
(A) Cryosection IF of E6.25 Ehmt2+/+ and Ehmt2−/− embryos stained with antibodies raised against G9a and H3K9me2. Scale bar = 20 μm. (B) Top 10 enriched GO terms in genes upregulated in Ehmt2−/− E6.25 embryos. (C,D) Whole-mount IF of E6.5 Ehmt2+/+ and Ehmt2−/− embryos (C) stained with antibodies raised against cleaved Caspase 3 and Ki67, markers of apoptosis and proliferation, respectively. White arrows show Ki67 negative cells. Scale bar = 20 μm. Shown is maximum projection from 5 z-stacks. (D) Bar plot showing the number of apoptotic cells (cleaved Caspase 3 positive) and non-proliferative cells (Ki67 negative and Caspase 3 negative) dependent on the genotype. Data are represented as mean (± SEM) from five control and five KO embryos. (*Student’s t-test p-value< 0.05). Also see Figure 2—source data 1 and 2. GO: gene ontology; H3K9me2: histone H3 lysine 9 dimethylation; IF: immunofluorescence; SEM: standard error of the mean; KO, knockout.
Figure 2—figure supplement 2
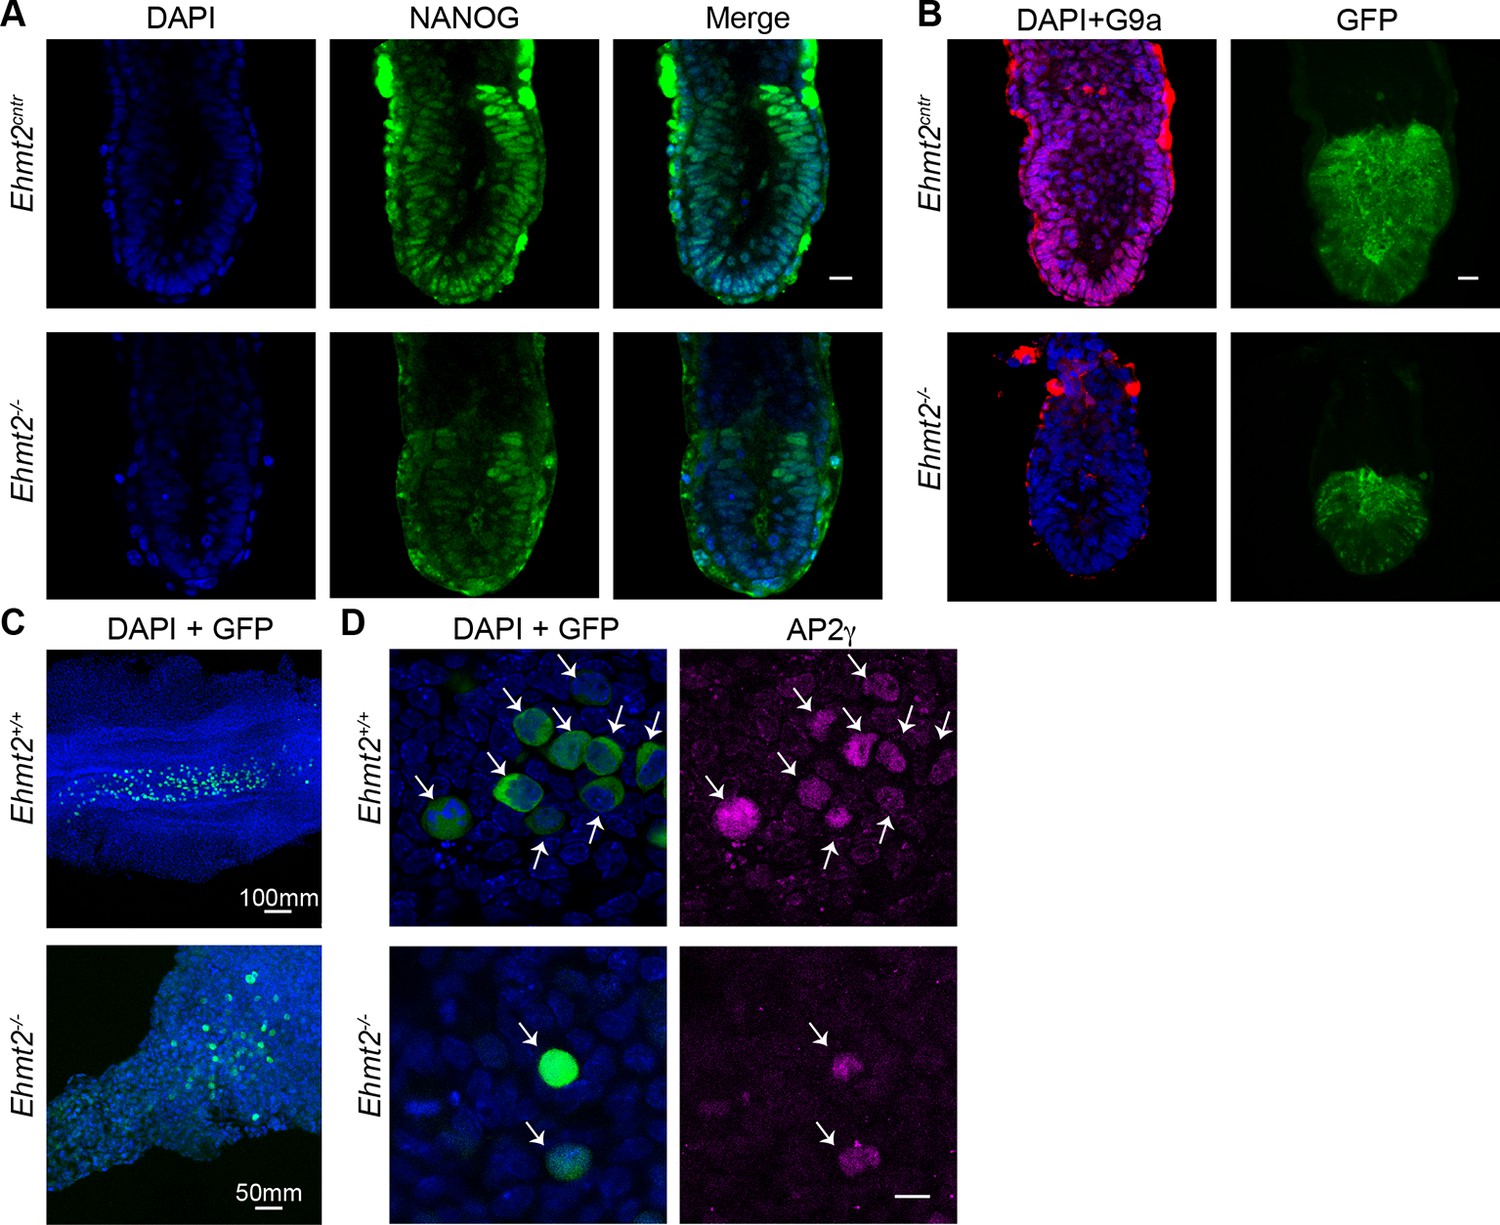
Loss of G9a does not affect the exit from pluripotency and germline specification.
(A,B) Whole-mount IF of E6.5 GGOF Ehmt2+/+ and Ehmt2−/− embryos stained with antibodies raised against Nanog (A), GFP and G9a (B). Shown is a sum of an equal number of z-stacks. Scale bar 20 = μm. (C,D) Whole-mount IF of E8.5 Ehmt2+/+ and Ehmt2−/− embryos stained with antibodies raised against GFP and AP2γ (D). GFP is expressed under GGOF reporter, which marks nascent PGCs. The different size of the Ehmt2+/+ and Ehmt2−/− embryos are noteworthy. Higher magnification images reveal that E8.5 PGCs show upregulation of a germline marker gene AP2γ (D) irrespective of the genotype. Scale bar 10 = μm. GGOF: ΔPE-Pou5f1-EGFP; GFP: green fluorescent protein; IF: immunofluorescence; PGCs: primordial germ cells.
Figure 2—figure supplement 3
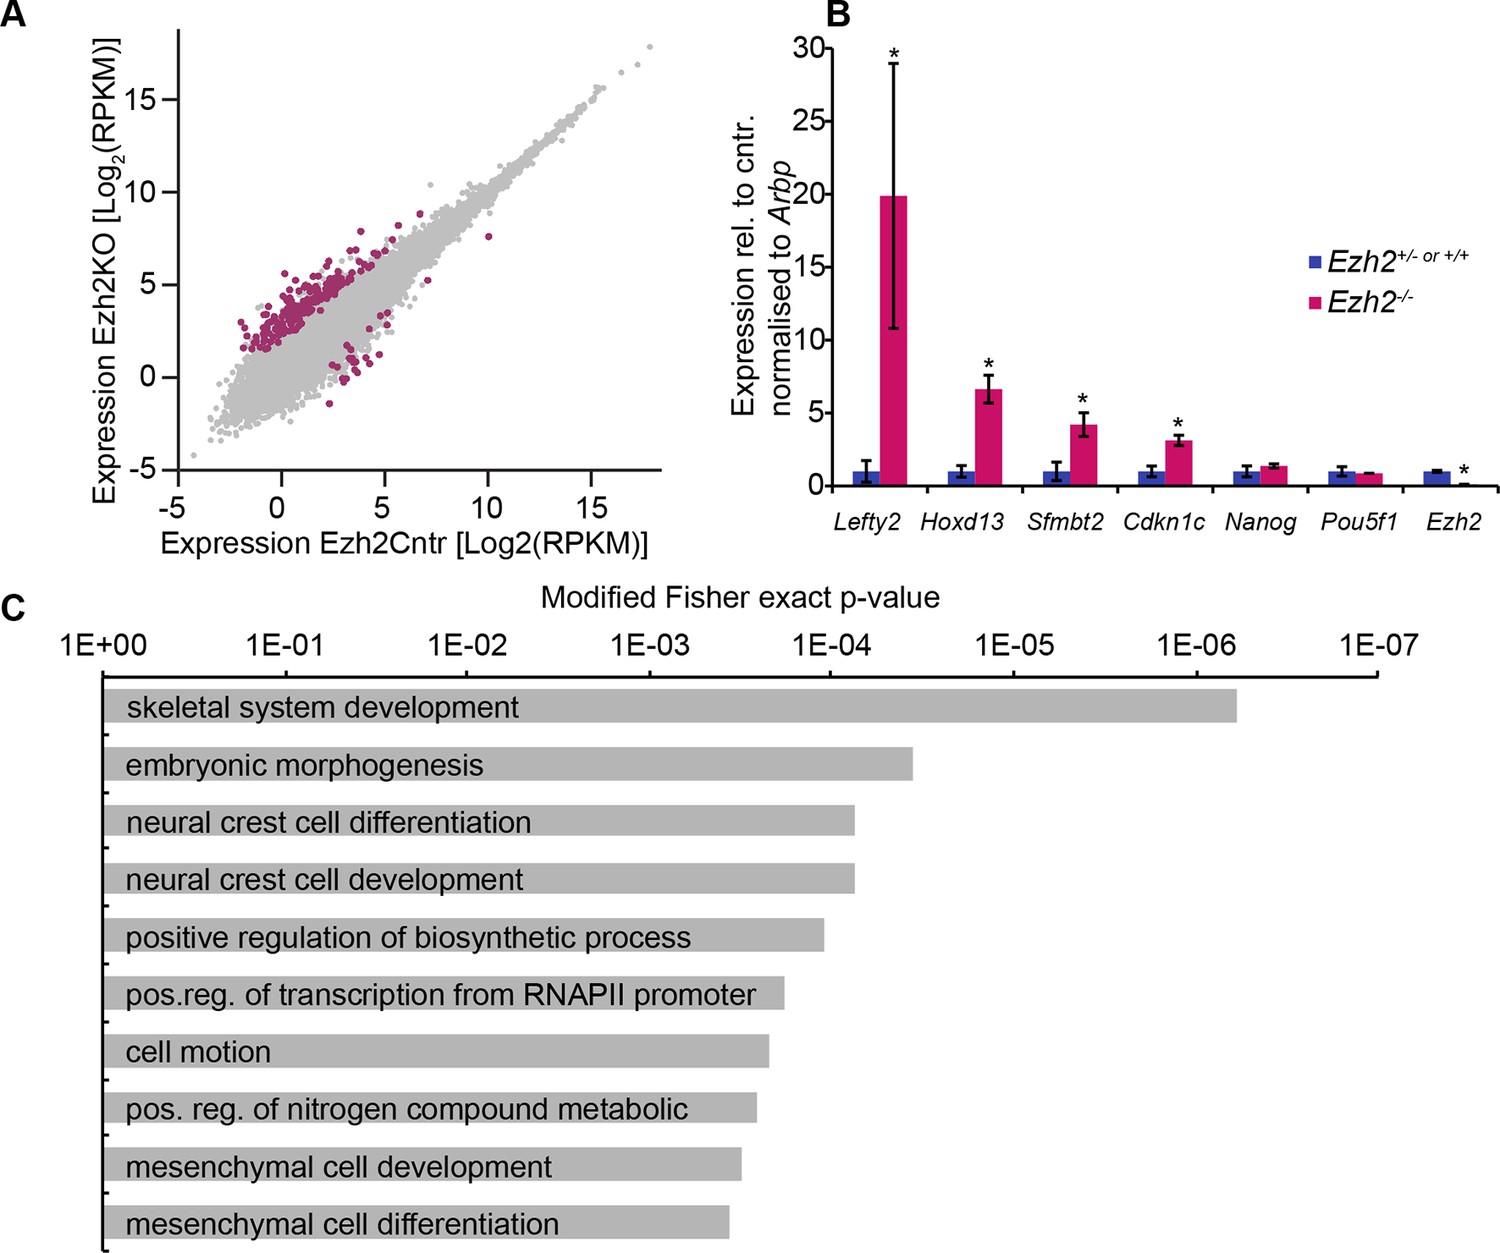
EZH2 represses multiple developmental regulators in vivo.
(A) Scatter plot showing transcript expression levels in Ezh2−/− versus Ezh2cntr E6.25 epiblast. Red points are differentially expressed genes (Log2RPKM>1, p-value<0.05, Log2(FC)>1.4). Shown is geometric average from three biological replicates. (B) RT-qPCR validation of RNA-seq at selected target genes. Data are represented as mean ( ± SEM) from three independent biological replicates (*Student’s t-test p-value< 0.05). (C) Top 10 enriched GO terms in genes upregulated in Ezh2−/− E6.25 embryos. Also see Figure 2—source data 3 and 4. GO: gene ontology; RT-qPCR: Real-time quantitative polymerase chain reaction; RNA-seq: RNA sequencing; SEM: standard error of the mean; FC: fold change.
Figure 3 with 3 supplements
In vivo lcChip-seq from E6.25 epiblast reveals distinct epigenetic state of primed pluripotent cells.
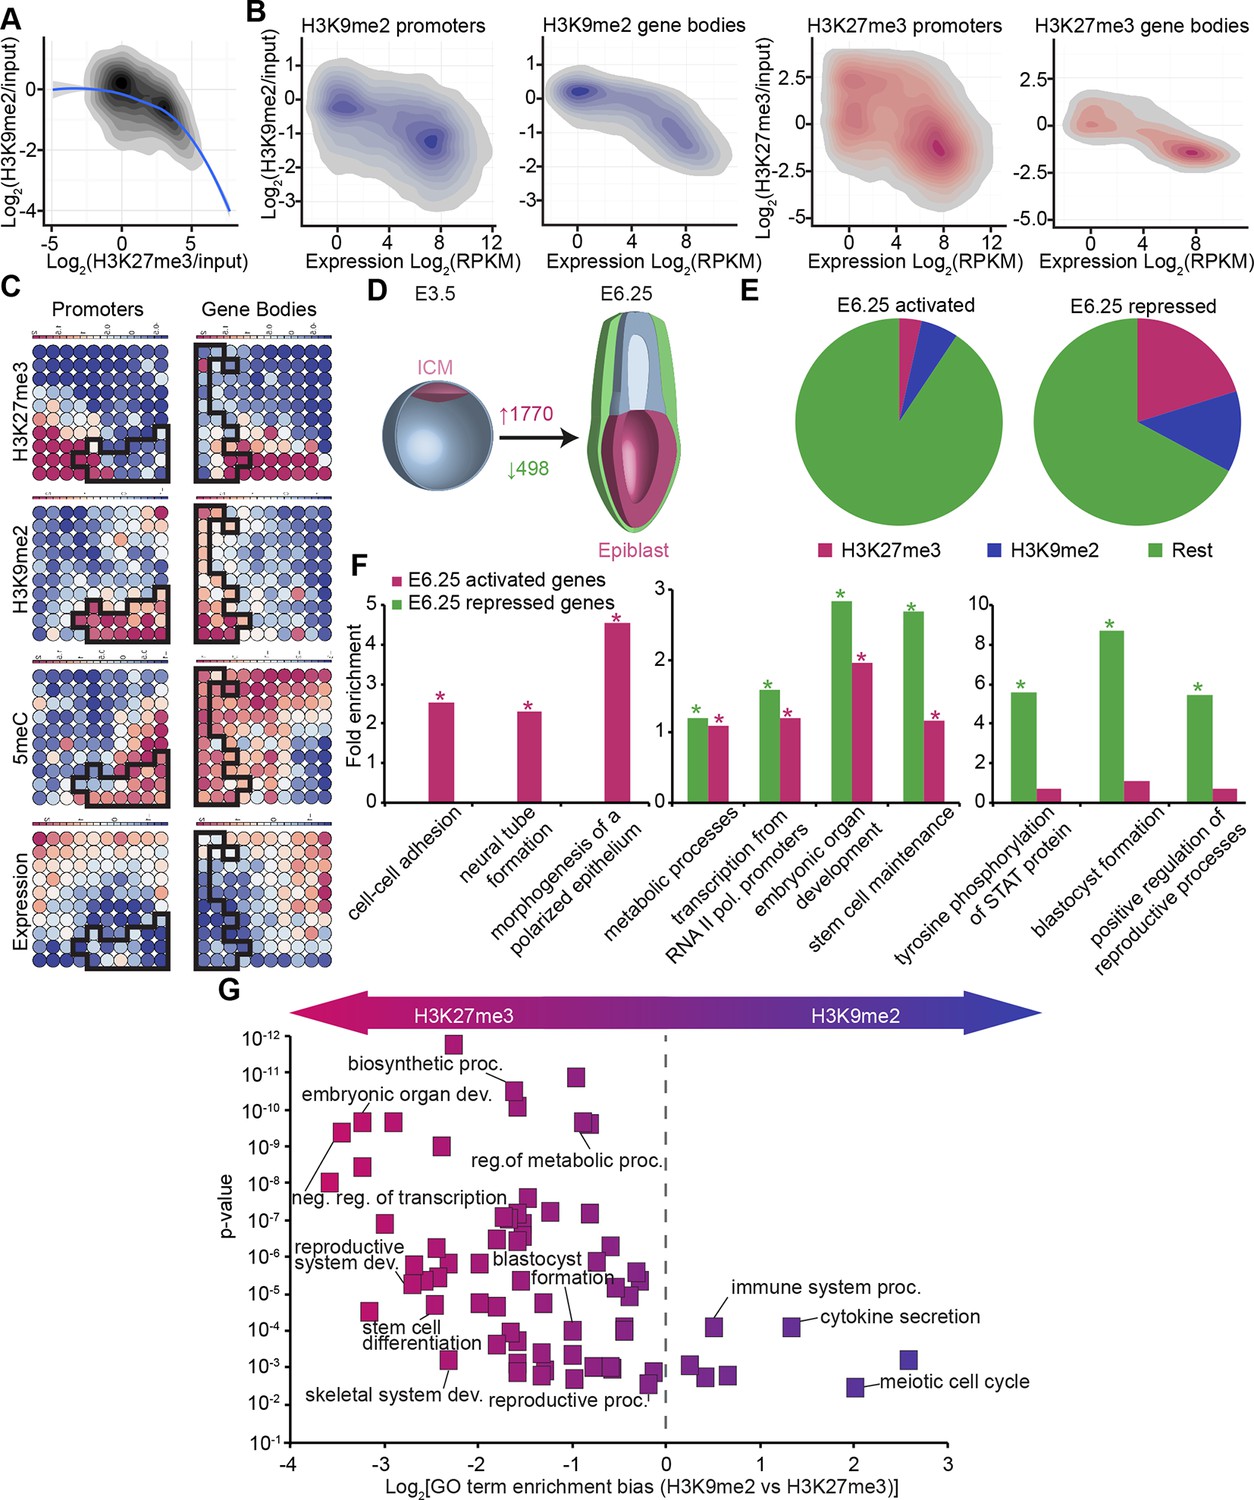
(A) Density contour plot showing the relationship between H3K9me2 and H3K27me3 enrichment. Shown are all promoters associated with genes repressed in the epiblast. (B) Density contour plots showing correlation between H3K9me2 (blue) and H3K27me3 (red) at promoters (left panels) and gene bodies (right panels), with transcriptional activity in epiblast. (C) Unbiased clustering of promoters (left panels) and gene bodies (right panels) based on their cumulative epigenetic and transcriptional signature in epiblast. Analysis was performed using self-organizing maps. Each circle on the map represents a set of regions with very similar modification and expression profiles; neighbouring circles on the map are also similar. Black line separates H3K9me2-enriched regions. Scale is in relative enrichment calculated by centring input-normalised RPKM (for ChIP), expression and DNA methylation and dividing by standard deviation. (D) Schematic of early mouse development showing numbers of genes becoming activated (red) and repressed (green) in E6.25 when compared with E3.5 ICM (Log2(RPKM)<4, p-value<0.05, Log2(FC) >1). (E) Pie charts showing proportion of genes repressed or activated in E6.25 with enrichment of H3K9me2 or H3K27me3 at promoter and/or gene body. Histone modification enrichment was classified using k-means. (F) Bar plots show fold enrichment of selected GO terms in genes repressed and activated in E6.25 epiblast compared with E3.5 ICM. * p-value<0.05 using Fisher test. (G) GO term enrichment analysis of genes repressed in E6.25 epiblast when compared with E3.5 ICM in relation to their histone methylation status. X axis shows the GO term enrichment bias between H3K9me2- and H3K27me3-marked genes (GO term fold enrichment in H3K9me2 marked genes vs. that in H3K27me3 enriched ones). Y axis is minimum Fisher p-value in the H3K9me2- or H3K27me3-marked genes. Complexity of enriched GO terms was reduced by removing terms with highly overlapping gene sets. Also see Figure 3—figure supplement 1–3. lcChIP-seq: low cell number chromatin immunoprecipitation with sequencing; H3K9me2: histone H3 lysine 9 dimethylation; H3K27me3: histone H3 lysine 27 trimethylation; RPKM: Reads Per Kilobase of transcript per Million mapped reads; FC: fold change; ICM: inner cell mass; GO: gene ontology.
Figure 3—figure supplement 1
LcChIP-seq on E6.25 epiblast.
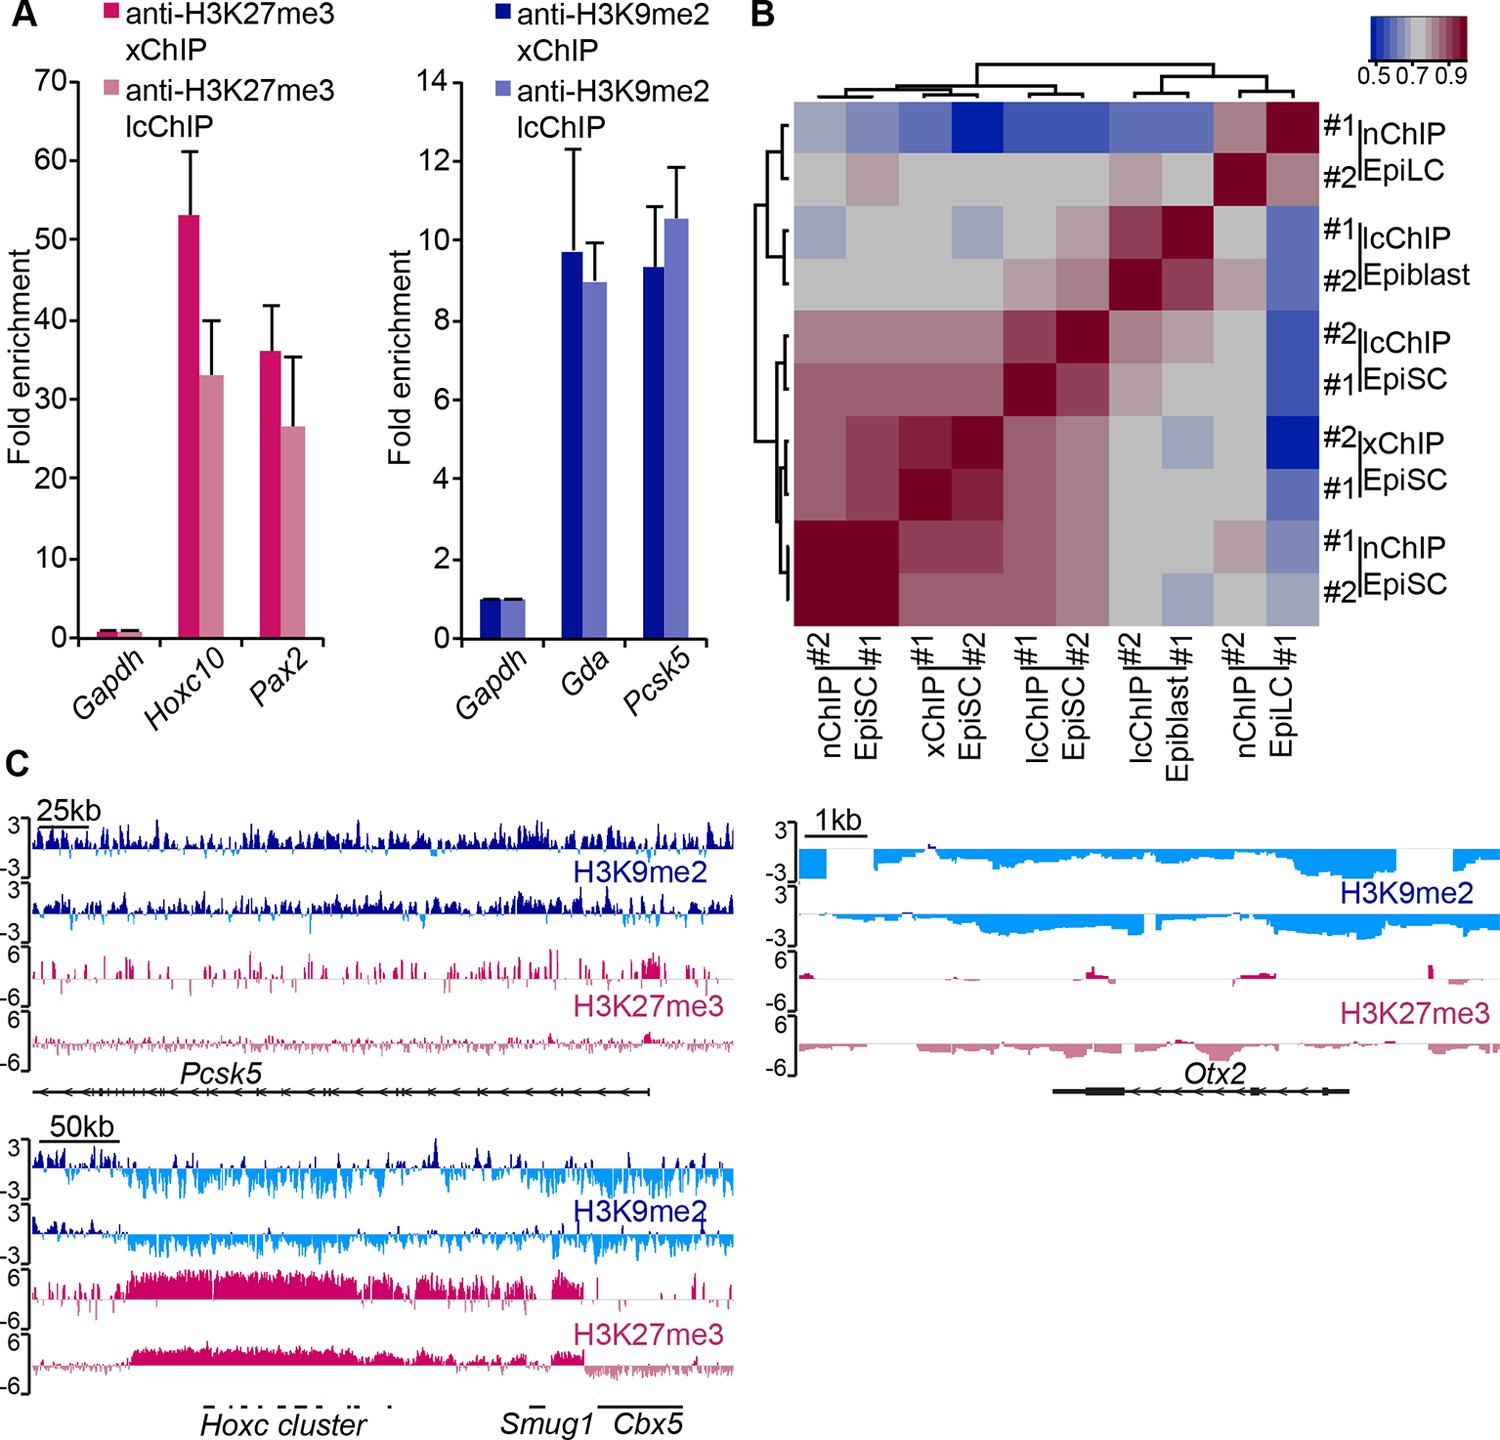
(A) Validation of lcChIP. bar plots comparing enrichment of H3K27me3 and H3K9me2 in EpiSCs detected using large scale (5–10 × 106 cells) xChIP or lcChIP. Data are represented as mean (± SEM) fold enrichment relative to Gapdh from at least two independent biological replicates. (B) Validation of lcChIP-seq. Heatmap of unbiased Spearman’s rho correlation of H3K27me3 levels at promoter elements showing that all EpiSC ChIP-seq samples cluster together independently of the technique used. (C) Genome browser tracks showing H3K27me3 (red) and H3K9me2 (blue) enrichment in two biological replicates of E6.25 epiblast lcChIP-seq. Hoxc cluster and Pcsk5 are control regions for enrichment of H3K27me3 and H3K9me2, respectively. Otx2 is a highly expressed gene in the epiblast. Data is shown as a sliding window (1 kb and 300 bp for H3K9me2 and H3K27me3, respectively) of enrichment over input: Log2(RPM ChIP/RPM input). lcChIP-seq: low cell number chromatin immunoprecipitation with sequencing; H3K9me2: histone H3 lysine 9 dimethylation; H3K27me3: histone H3 lysine 27 trimethylation; EpiSCs: epiblast stem cells; xChIP: fixed ChIP; SEM: standard error of the mean, RPM: reads per million mapped.
Figure 3—figure supplement 2
H3K9me2 and H3K27me3 correlate with distinct CpG and DNA methylation states.
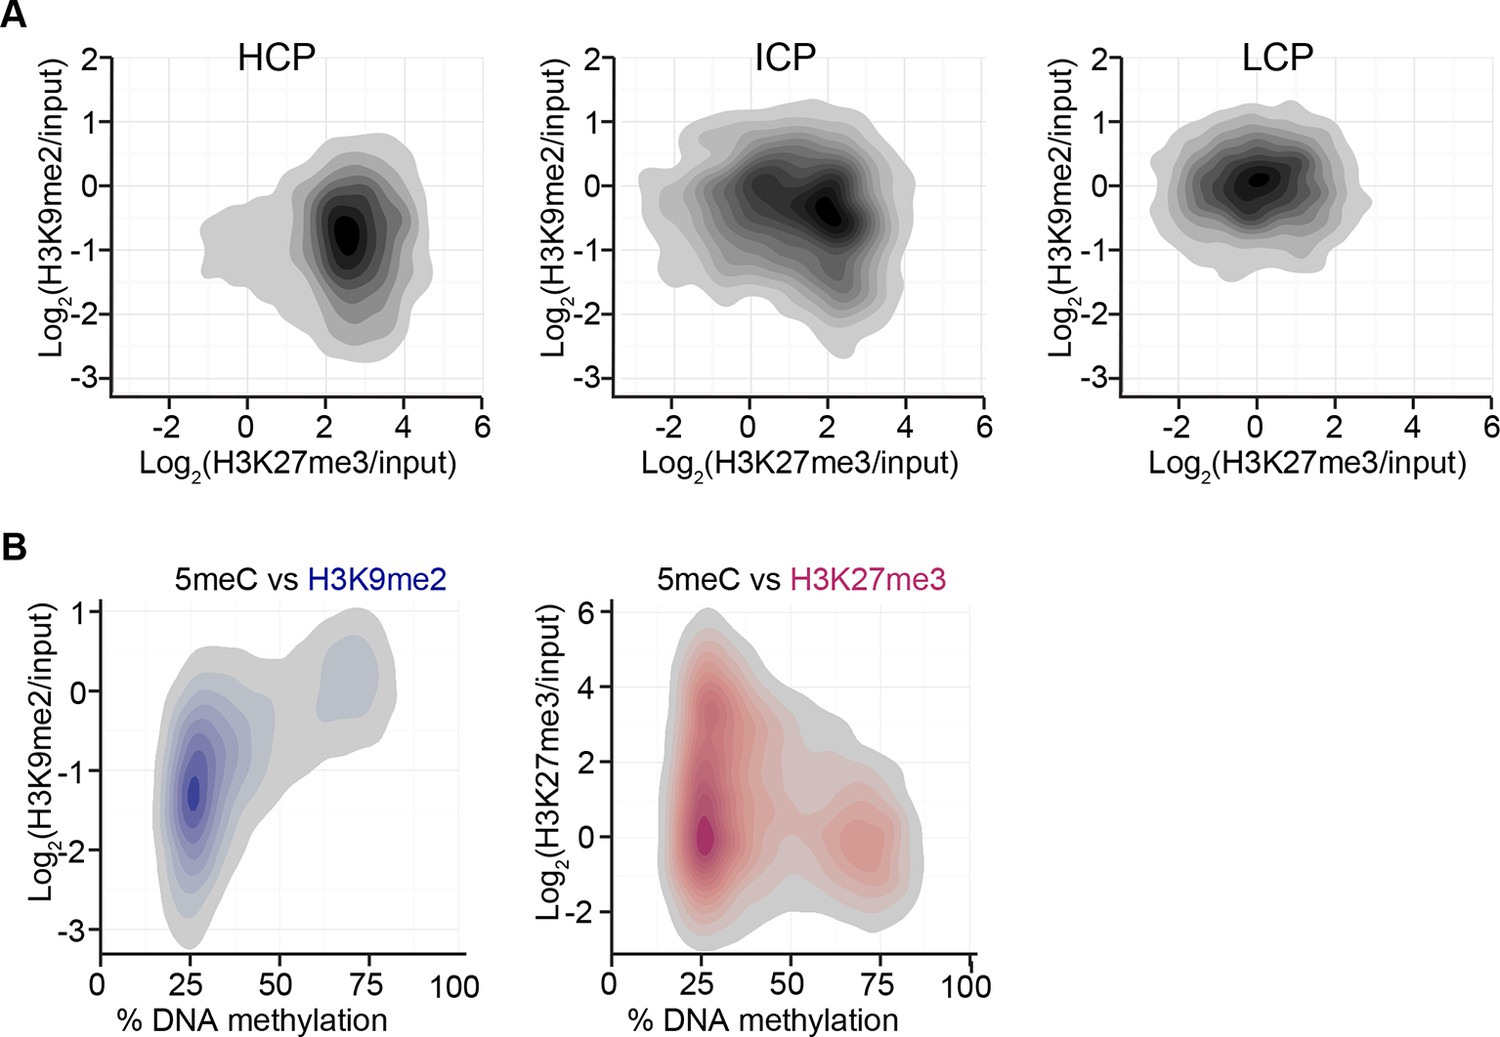
(A) Density contour plots showing H3K9me2 and H3K27me3 enrichment in E6.25 epiblast at promoters of HCP, ICP, and LCP. (B) Density contour plots showing correlation between levels of H3K9me2 (blue) or H3K27me3 (red) and DNA methylation at promoters in the epiblast. H3K9me2: histone H3 lysine 9 dimethylation; H3K27me3: histone H3 lysine 27 trimethylation; HCP: high CpG density; ICP: intermediate CpG density; LCP: low CpG density.
Figure 3—figure supplement 3
Accumulation of H3K9me2 or H3K27me3 at promoters of genes becoming repressed depends on CpG content.
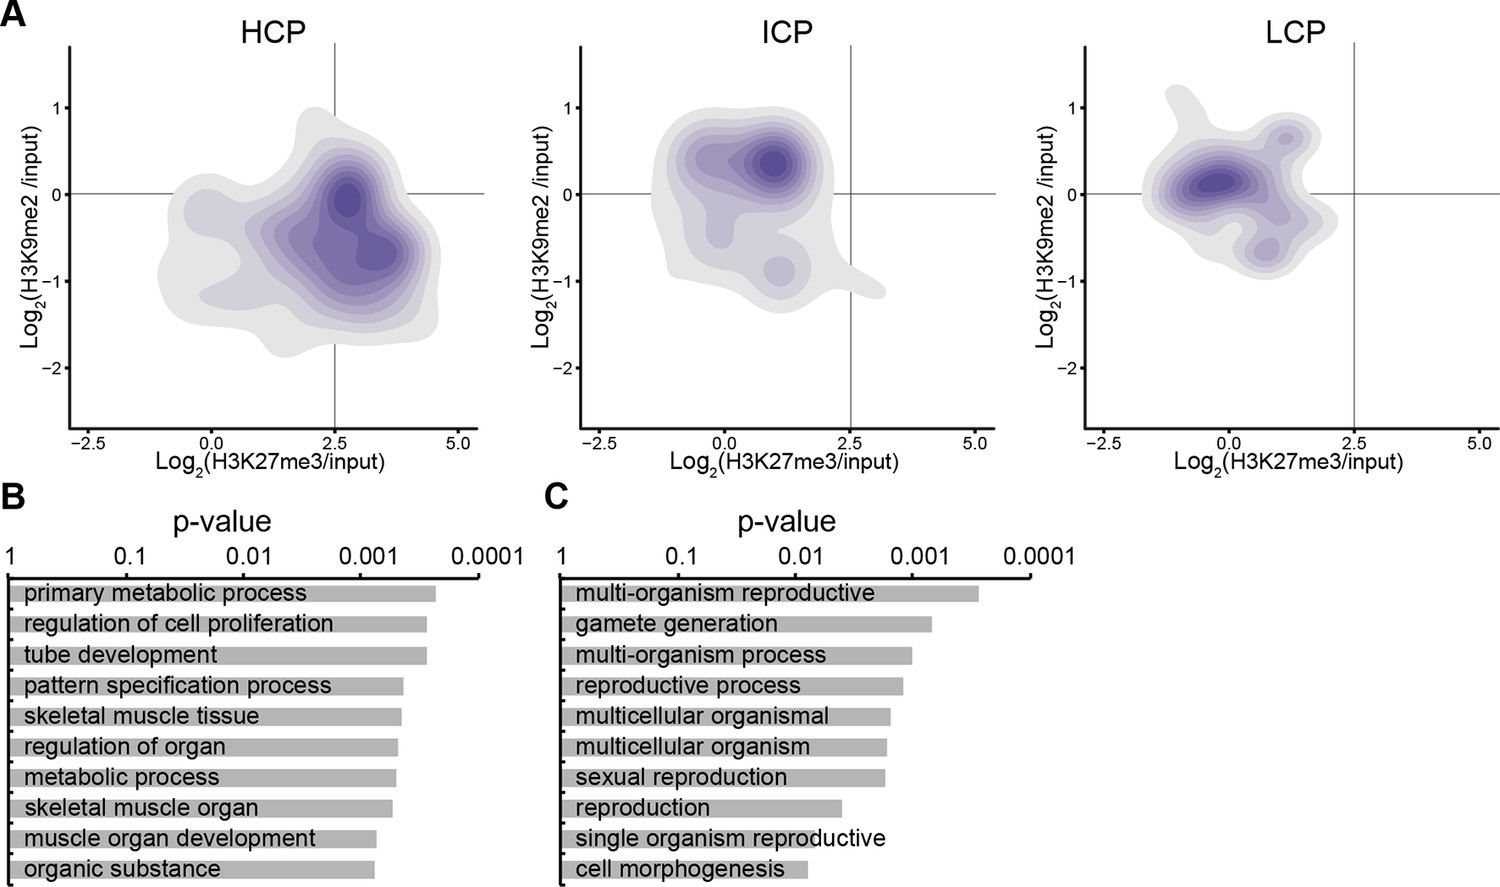
(A) Density contour plots showing H3K9me2 and H3K27me3 enrichment in E6.25 epiblast at promoters of HCP, ICP, and LCP. Shown are only promoters associated with genes becoming repressed in E6.25 epiblast when compared with E3.5 ICM (Log2(RPKM)<4, p-value<0.05, Log2(FC)>1). (B,C) Top 10 enriched GO terms in genes repressed in E6.25 epiblast when compared with E3.5 ICM and associated with HCP (B) and ICP (C) promoters. LCP promoter-associated genes did not show significant GO term enrichment. GO: gene ontology; H3K9me2: histone H3 lysine 9 dimethylation; H3K27me3: histone H3 lysine 27 trimethylation; HCP: high CpG density; ICP: intermediate CpG density; LCP: low CpG density; ICM: inner cell mass; FC: fold change; RPKM: Reads Per Kilobase of transcript per Million mapped reads.
Figure 4 with 1 supplement
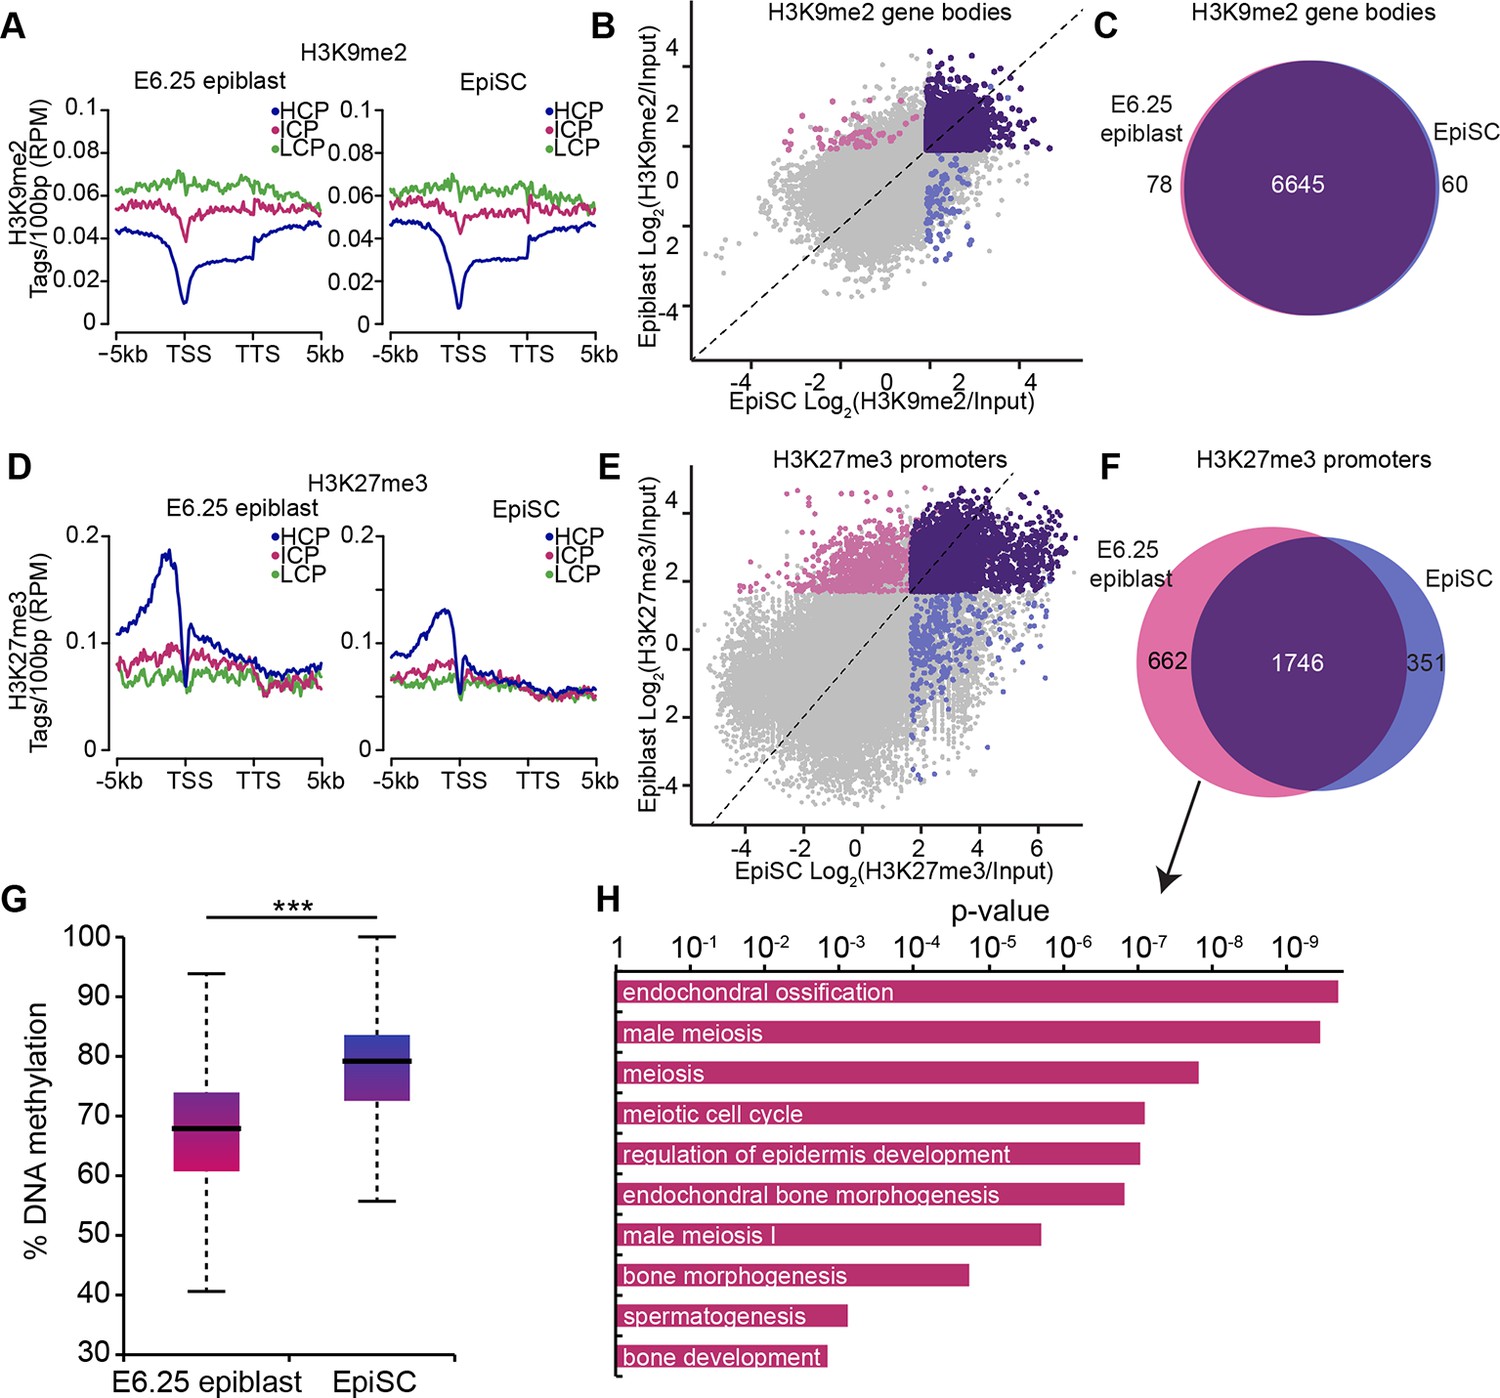
EpiSC show aberrant H3K27me3 distribution and DNA hypermethylation at germline genes.
(A,D) Distribution of H3K9me2 (A) and H3K27me3 (D) by metagene analysis in epiblast and EpiSCs. Genes were classified based on promoter CpG density. (Scale = base pairs.) (B,E) Scatter plots showing H3K9me2 (C) and H3K27me3 (D) enrichment at gene bodies and promoters, respectively, in EpiSC versus E6.25 epiblast. Regions were classified as marked in both samples (purple), epiblast (pink) or EpiSC only (blue). Classification was performed using k-means and EdgeR (pval<0.05, Log2(FC)>2). (C,F) Venn diagrams showing overlap of H3K9me2 (E) or H3K27me3 (F) enrichment between EpiSC and E6.25 epiblast. (G) Box plot showing global DNA methylation levels from WGBSeq in E6.5 epiblast and EpiSC. ***p-value<0.001 from Wilcoxon rank sum test. (H) Bar plot showing top 10 enriched GO terms in genes uniquely marked by H3K27me3 in the E6.25 epiblast. Also see Figure 4—figure supplement 1. HCP: high CpG density; ICP: intermediate CpG density; LCP: low CpG density; TSS: transcriptional start site; TTS: transcriptional termination site; EpiSCs: epiblast stem cells; H3K27me3: histone H3 lysine 27 trimethylation; H3K9me2: histone H3 lysine 9 dimethylation; FC: fold change; GO: gene ontology; WGBSeq: whole genome bisulfite sequencing.
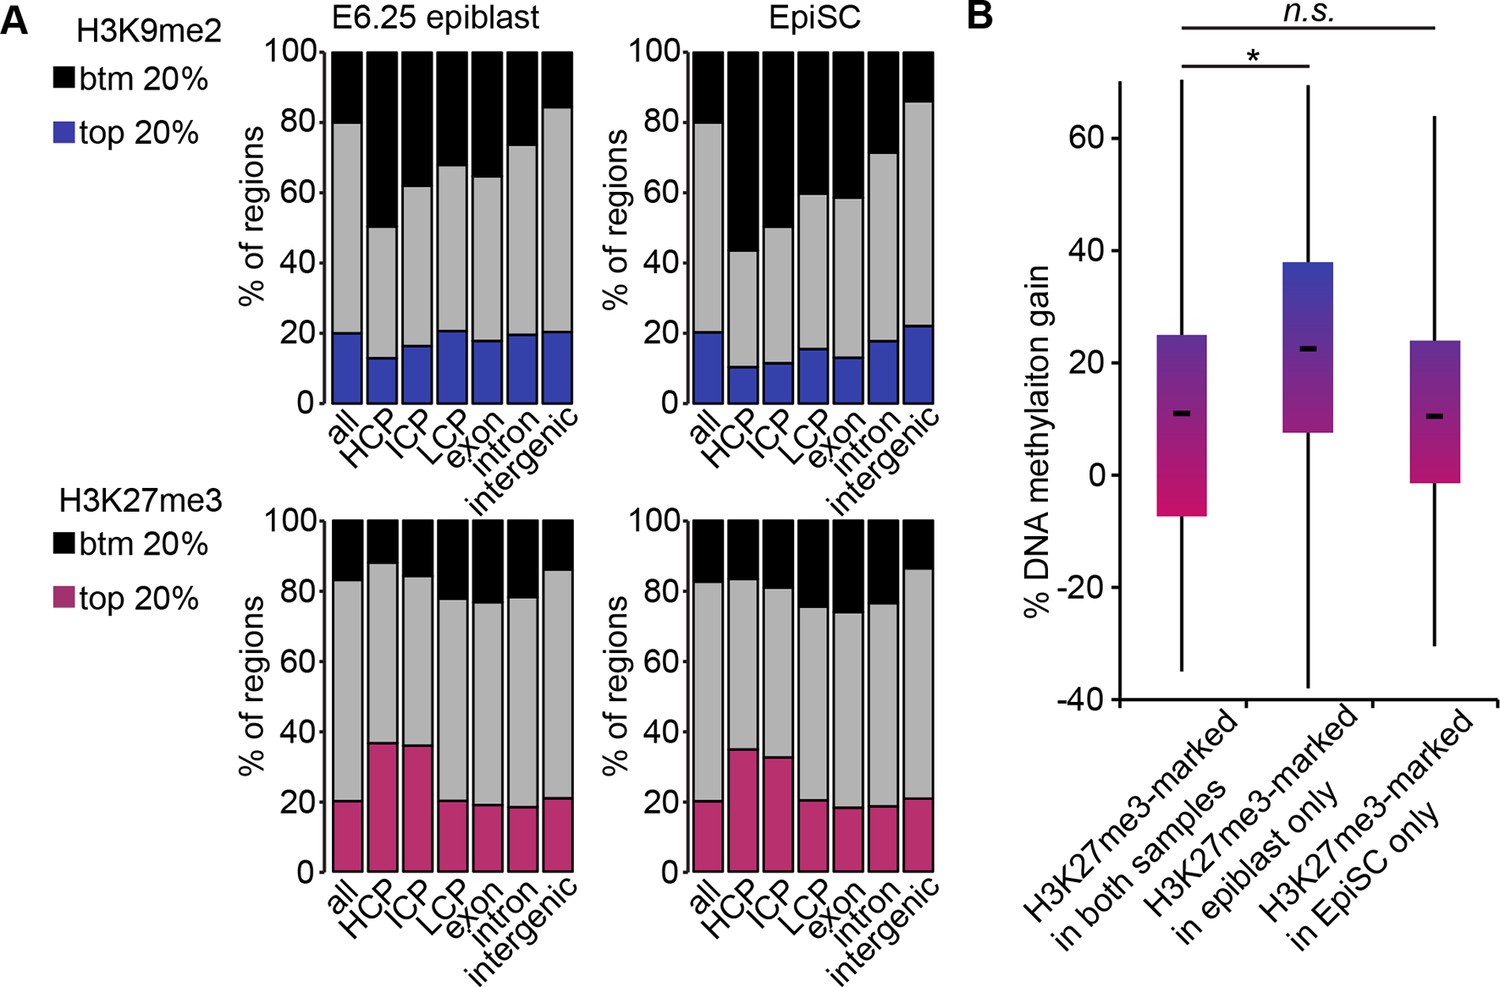
Figure 4—figure supplement 1
H3K9me2, H3K27me3 and DNA methylation dynamics between E6.25 epiblast and EpiSC.
(A) Bar plots showing distribution of H3K9me2 (top) and H3K27me3 (bottom) genome-wide. 1 kB tiles were calculated for all chromosomes with a 500 bp offset, and each tile was intersected with annotated genomic regions. For each tile, enrichment was calculated. Shown are top and bottom 20% of enriched tiles. (B) Box plots showing gain of DNA methylation in EpiSC compared with E6.25 epiblast at promoters. Promoters were classified based on differential enrichment for H3K27me3 in EpiSC and E6.25 epiblast. Significance was calculated using unpaired Wilcoxon rank sum test with continuity correction. *p-value<0.01. H3K27me3: histone H3 lysine 27 trimethylation; H3K9me2: histone H3 lysine 9 dimethylation; EpiSC: epiblast stem cell.
Figure 5 with 2 supplements
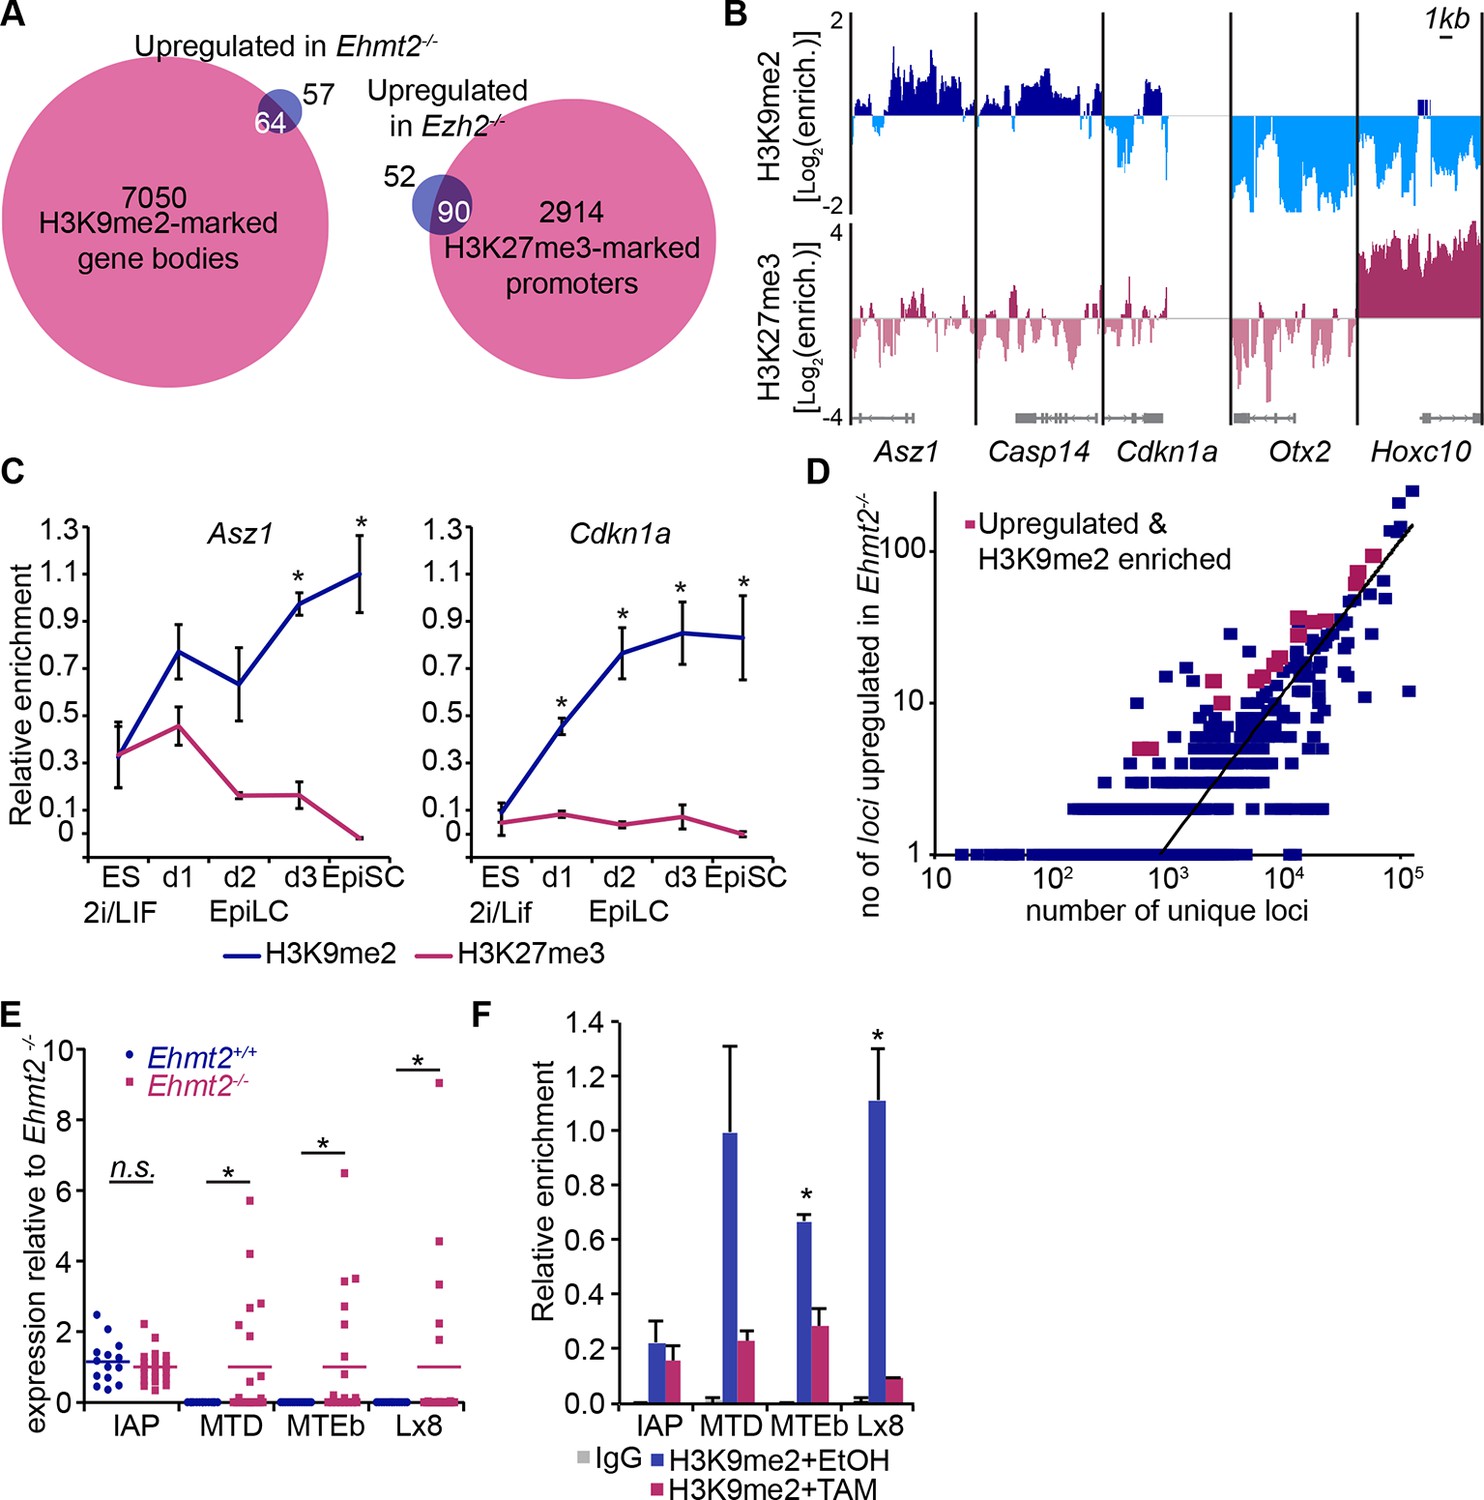
H3K9me2 and H3K27me3 are directly involved in repression of genes and transposable elements.
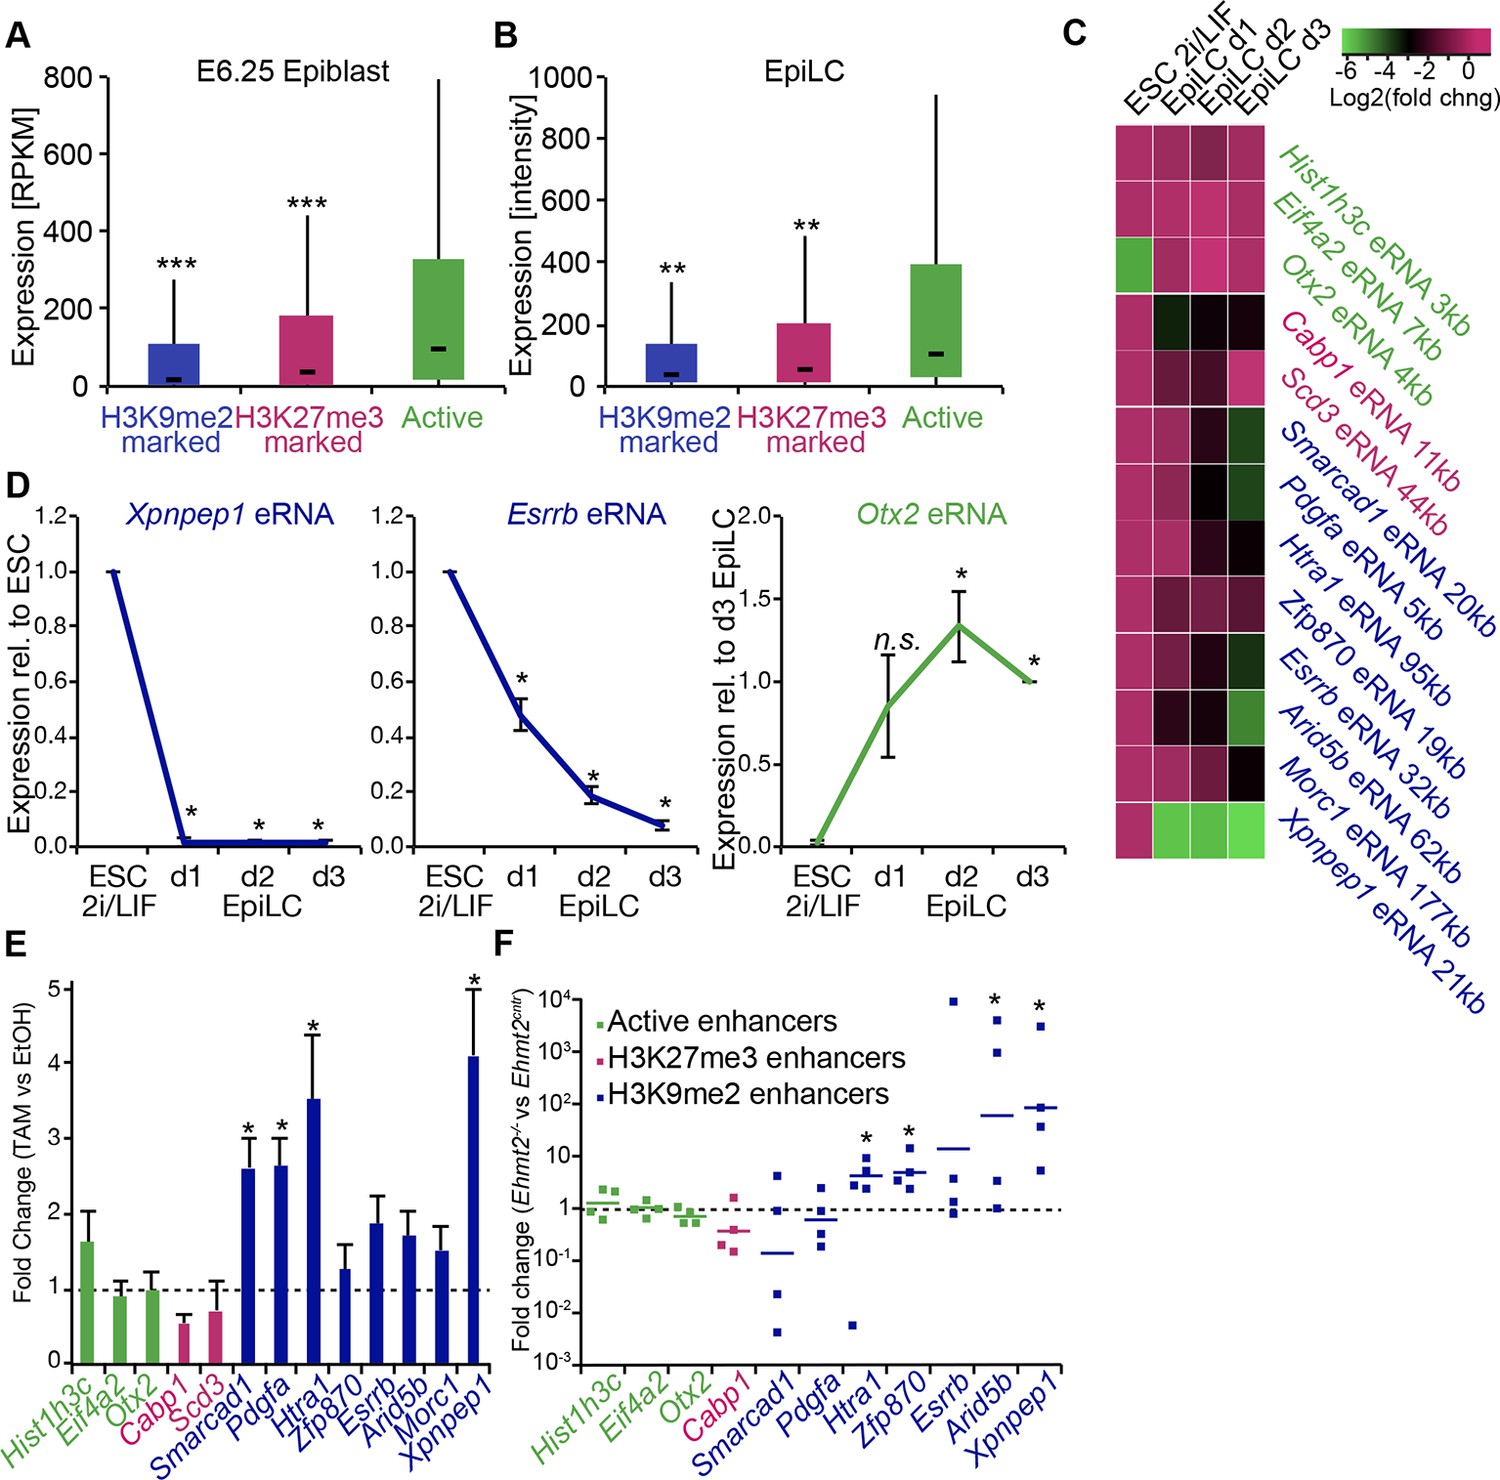
(A) Venn diagrams showing overlap between H3K27me3 enrichment at promoters (left panel) or H3K9me2 at gene bodies (right panel); genes upregulated in Ezh2−/− and Ehmt2−/− epiblasts are shown. The overlaps are statistically significant (p-value< 0.01 using Chi2 test). (B) Genome browser tracks showing H3K9me2 and H3K27me3 enrichment at genes that are: derepressed in Ehmt2−/− (Asz1, Casp14, Cdkn1a), active epiblast markers (Otx2), and PRC2 targets (Hoxc10). Data is shown as a sliding window (1kb and 300bp for H3K9me2 and H3K27me3, respectively) of enrichment over input: Log2(RPM ChIP/RPM Input). (C) lcChIP-qPCR validation for H3K9me2 and H3K27me3 at the promoter of Asz1 and gene body of Cdkn1a during EpiLC and EpiSC induction. Signal was scaled relative to average enrichment on negative (Gapdh: H3K9me2 and H3K27me3) and positive control regions (Pcsk5: H3K9me2, Hoxc10: H3K27me3). Data are represented as mean (± SEM) from three independent biological replicates (*Student’s t-test p-value<0.05 relative to 2i/LIF ESC sample). (D) Scatter plot showing correlation between the number of unique repeat loci in each subfamily with the number of loci upregulated in Ehmt2−/− E6.25 epiblast. Red points are subfamilies with significant H3K9me2 enrichment and increased proportion of upregulated loci. (E) Single cell RT-qPCR validation of repeat upregulation in individual E6.25 Ehmt2+/+ and Ehmt2−/−epiblast cells. Statistical significance was calculated using Wilcoxon rank sum test for IAP where the majority of WT and KO cells show detectable expression. For remaining repeats, a Chi2 test was used.(*p-value<0.05). (F) LcChIP-qPCR measuring H3K9me2 levels at selected repeat elements in Ehmt2F/− CreER+ve d2 EpiLCs treated with EtOH or TAM. Data are mean (± SD) from two independent biological replicates. (*Student’s t-test p-value<0.05 of EtOH compared with TAM treated sample). Also see Figure 5—figure supplement 1,2 and Figure 5—source data 1,2. H3K9me2: histone H3 lysine 9 dimethylation; H3K27me3: histone H3 lysine 27 trimethylation; EZH2: Enhancer of zeste homolog 2; ChIP: chromatin immunoprecipitation; EpiLCs: epiblast-like cells; EpiSCs: epiblast stem cells; SEM: standard error of the mean; TAM: tamoxifen; EtOH: ethanol; IAP: intracisternal A particle.
-
Figure 5—source data 1
List of promoters enriched for H3K27me3 in lcChIP-seq from E6.25 epiblast data is based on two biological replicates of lcChIP-seq.
Enrichment was called by k-means clustering.
- https://doi.org/10.7554/eLife.09571.019
-
Figure 5—source data 2
List of gene bodies enriched for H3K9me2 in lcChIP-seq from E6.25 epiblast Data is based on two biological replicates of lcChIP-seq.
Enrichment was called by k-means clustering.
- https://doi.org/10.7554/eLife.09571.020
Figure 5—figure supplement 1
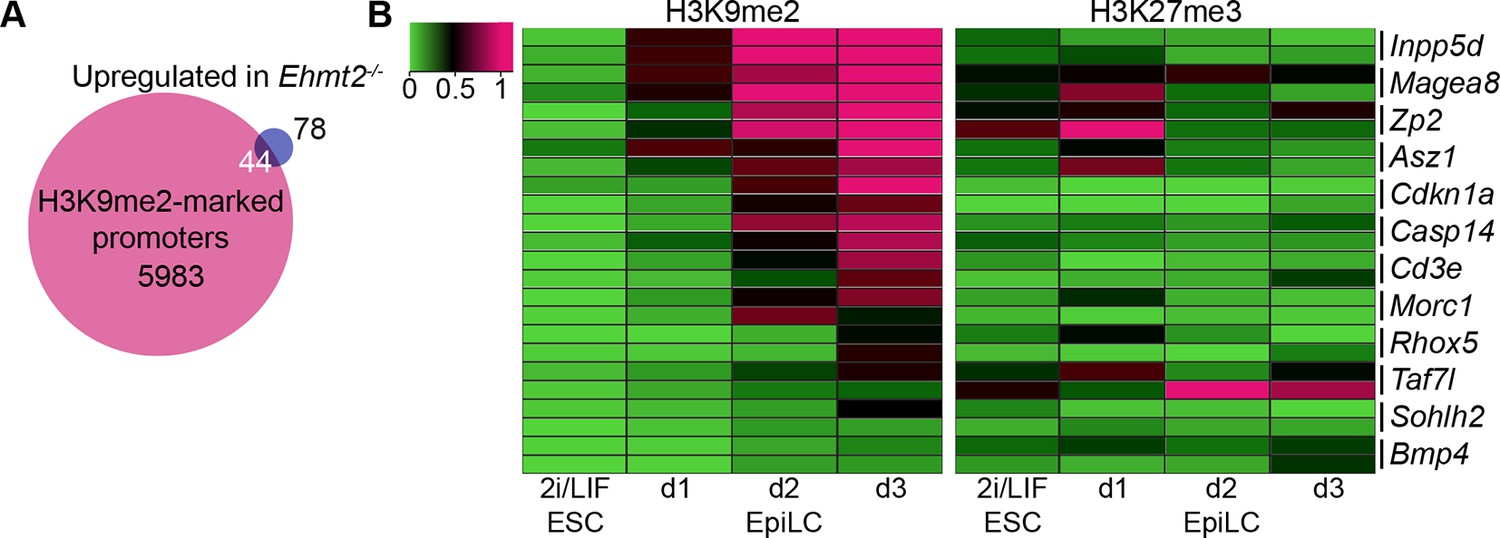
H3K9me2 accumulates at G9a-regulated promoters in the epiblast.
(A) Venn diagrams showing overlap between H3K9me2 enrichment at promoters and genes upregulated in Ehmt2−/− epiblasts. The overlaps are statistically significant (p-value<0.01 using Chi2 test). (B) Heatmap showing H3K9me2 and H3K27me3 enrichment at promoters of genes upregulated in Ehmt2−/−. Data shown is from two biological replicates of lcChIP-qPCR from 2i/LIF ESCs and day 1–3 EpiLCs. Scale is in relative enrichment normaliseormalized to a positive control region of Pcsk5 (for H3K9me2) and Hoxc10 (for H3K27me3).
Figure 5—figure supplement 2
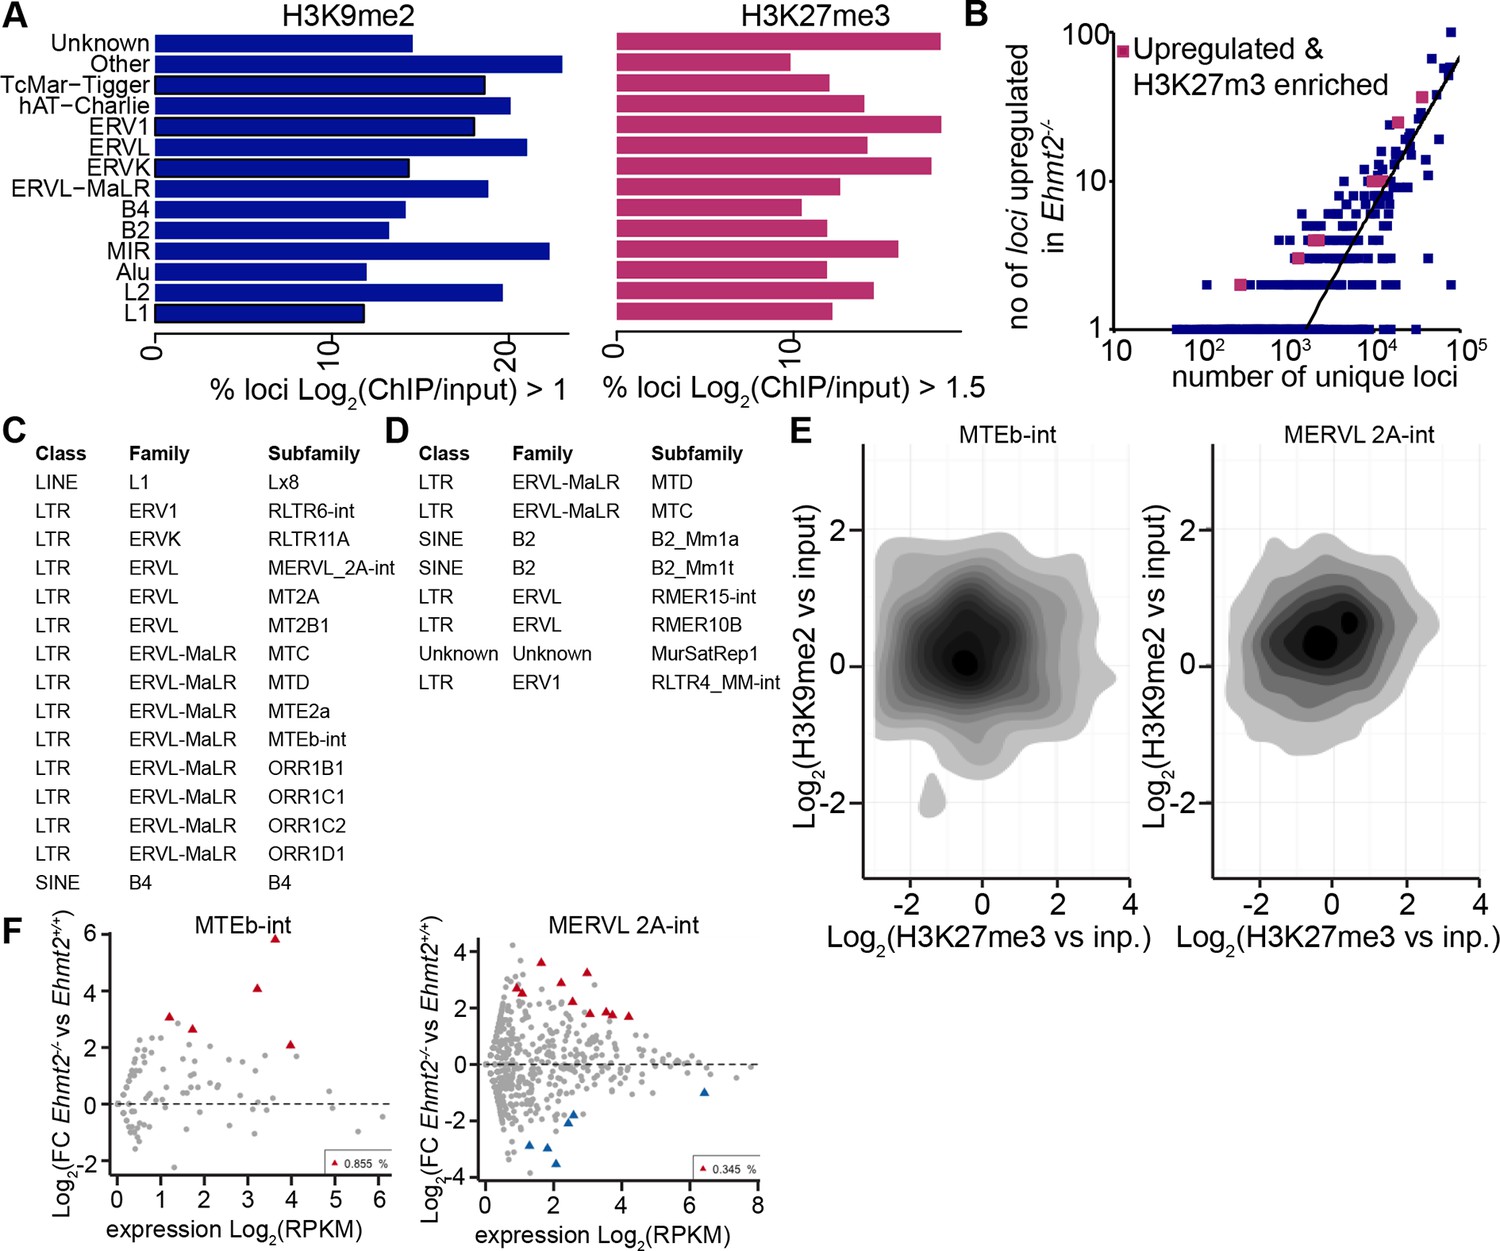
H3K9me2 accumulates at G9a-regulated repeat elements in the epiblast.
(A) Box plots showing fractions of unique loci significantly marked by H3K9me2 or H3K27me3 within classes of repeat elements. Shown is data from lcChIP-seq of E6.25 epiblast. (B) Scatter plot showing correlation between the number of unique repeat loci in each subfamily with the number of loci upregulated in Ezh2−/− E6.25 epiblast. Red points are subfamilies with significant H3K27me3 enrichment and increased proportion of upregulated loci. (C,D) Tables with subfamilies of repeat elements showing significantly increased proportion of unique loci marked by H3K9me2 (C) or H3K27me3 (D) and upregulated in Ehmt2−/− (C) or Ezh2−/−(D) E6.25 epiblast. (E) Density contour plots showing correlation between H3K9me2 and H3K27me3 enrichment at loci within two subclasses regulated by G9a. (F) Scatter plots FC in expression levels of unique loci in Ehmt2−/− versus Ehmt2+/+ E6.25 epiblast. Red triangles show loci that are significantly upregulated.
Figure 6 with 2 supplements
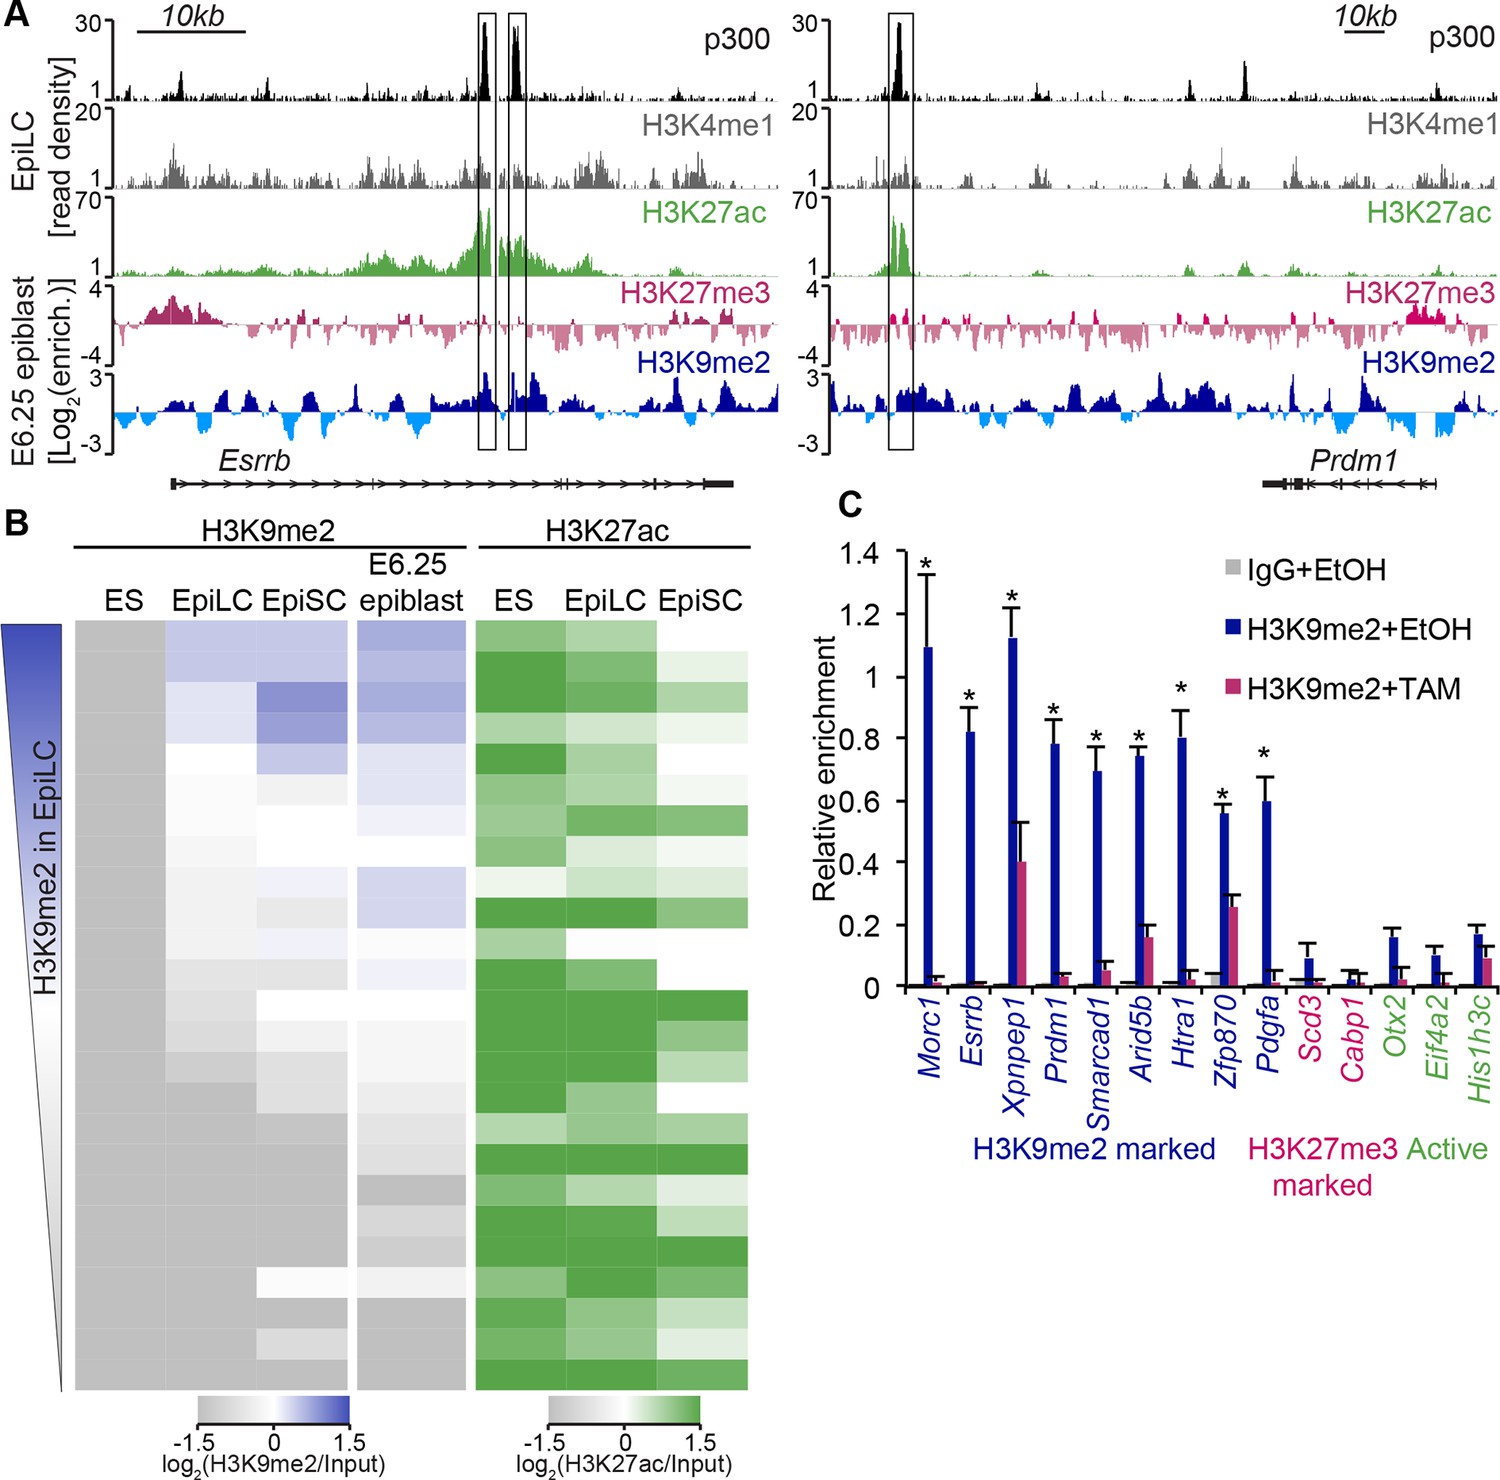
H3K9me2 marks enhancers undergoing inactivation during exit from naïve pluripotency.
(A) Genome browser tracks showing p300, H3K27ac, and H3K4me1 at inactive Esrrb and Prdm1 putative enhancers (black boxes) in day 2 EpiLCs (GSE56138) (Buecker et al., 2014). Bottom two tracks show H3K27me3 (red) and H3K9me2 (blue) enrichment in the E6.25 epiblast. Green and grey tracks show read density, while blue and red tracks show Log2 enrichment of ChIP sample over the input sample. (B) Heatmaps showing H3K9me2 and H3K27ac enrichment at enhancers active in ESCs grown in 2i/LIF. All ESC enhancers in 2i/LIF enriched for p300, H3K27ac and H3K4me1 were clustered using kohonen package based on H3K9me2 and H3K27ac. Individual classes were ranked based on H3K9me2 levels in EpiLCs. H3K27ac tracks were extracted from (GSE56138, GSE57409) (Buecker et al., 2014; Factor et al., 2014). (C) LcChIP-qPCR measuring H3K9me2 levels at putative enhancer elements in Ehmt2F/−CreER+ve d2 EpiLCs treated with EtOH or TAM. H3K9me2- (blue), H3K27me3- (red) marked, as well as active (green) regulatory elements are shown. Data are mean (± SD) from two independent biological replicates. (*Student’s t-test p-value<0.05 of EtOH compared with TAM treated sample). Also see Figure 6—figure supplement 1,2. H3K27ac: histone H3 lysine 27 acetylation; EpiLCs: epiblast-like cells; H3K27me3: histone H3 lysine 27 trimethylation; ChIP: chromatin immunoprecipitation; H3K9me2: histone H3 lysine 9 dimethylation; lcChIP-seq: low cell number chromatin immunoprecipitation with sequencing; TAM: tamoxifen; EtOH: ethanol; SD: standard deviation; ESCs: Embryonic stem cells.
Figure 6—figure supplement 1
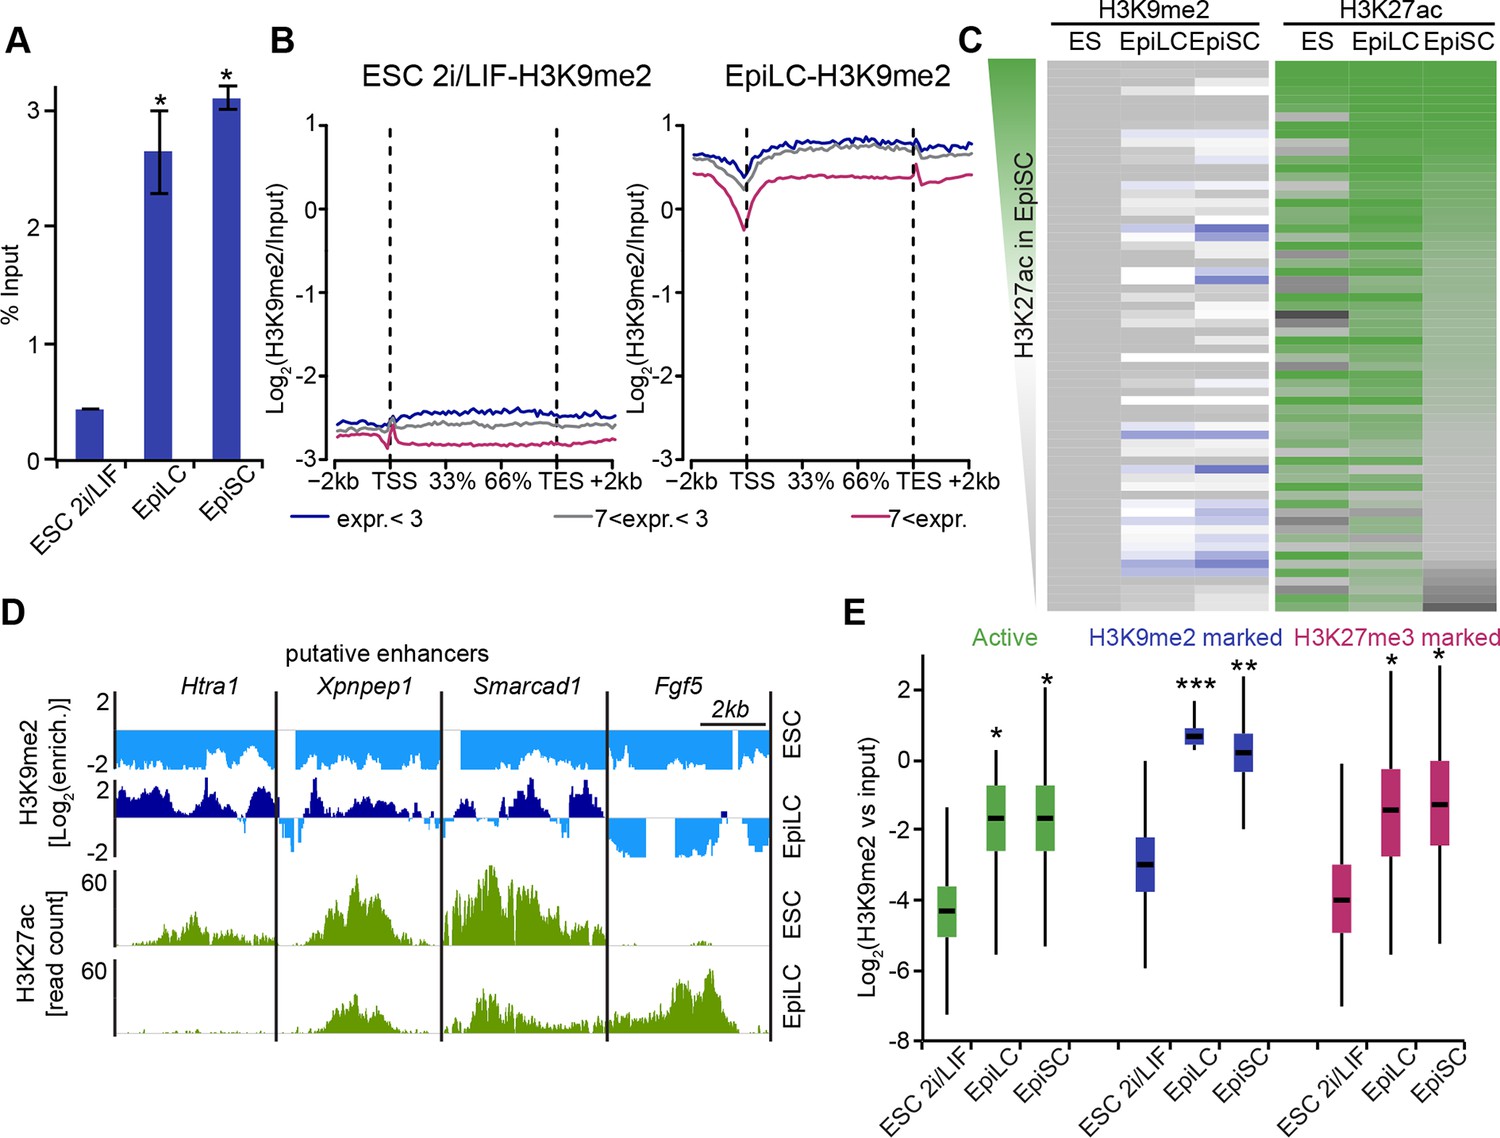
Genome-wide accumulation of H3K9me2 extends to multiple enhancer elements.
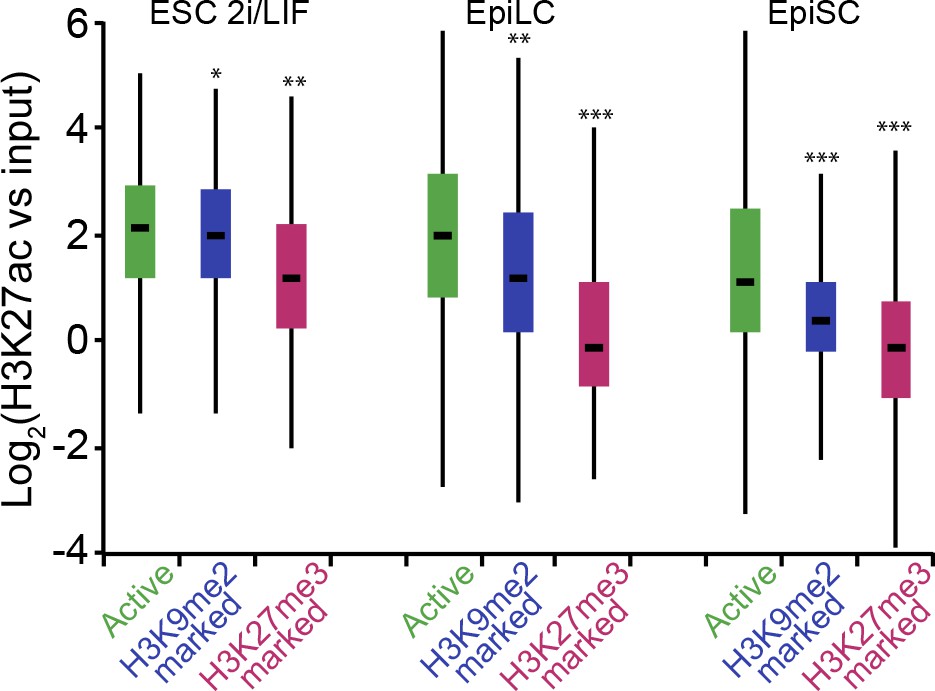
(A) Bar plot showing H3K9me2 levels in ESC, d2 EpiLC and EpiSC measured by quantifying total DNA in anti-H3K9me2 ChIP relative to the input sample. Shown is mean (± SD) from at least two independent biological replicates. (B) Enrichment of H3K9me2 in 2i/LIF ESCs and EpiLCs visualized with a metagene analysis. Genes were classified based expression level. Data is based on nChIP-seq scaled to absolute H3K9me2 levels (A). (C) Heatmap showing H3K9me2 and H3K27ac enrichment at all enhancers active in ESC, EpiLC and EpiSC. Individual enhancer elements were clustered and then sorted based on H3K27ac enrichment in EpiSC. (D) Genome browser tracks showing H3K9me2 (blue) and H3K27ac (green) putative enhancers in 2i/LIF ESC and d2 EpiLCs. H3K27ac tracks are from published datasets (Buecker et al., 2014). Green tracks show read density, while blue tracks show Log2 enrichment of ChIP over the input sample. (E) Box plots showing H3K9me2 levels at enhancers in 2i/LIF ESC, EpiLCs and EpiSCs. Significance was calculated using unpaired Wilcoxon rank sum test with continuity correction. Effect size: *r≤0.10; **0.10<r≤0.15; ***r>0.15.
Figure 6—figure supplement 2
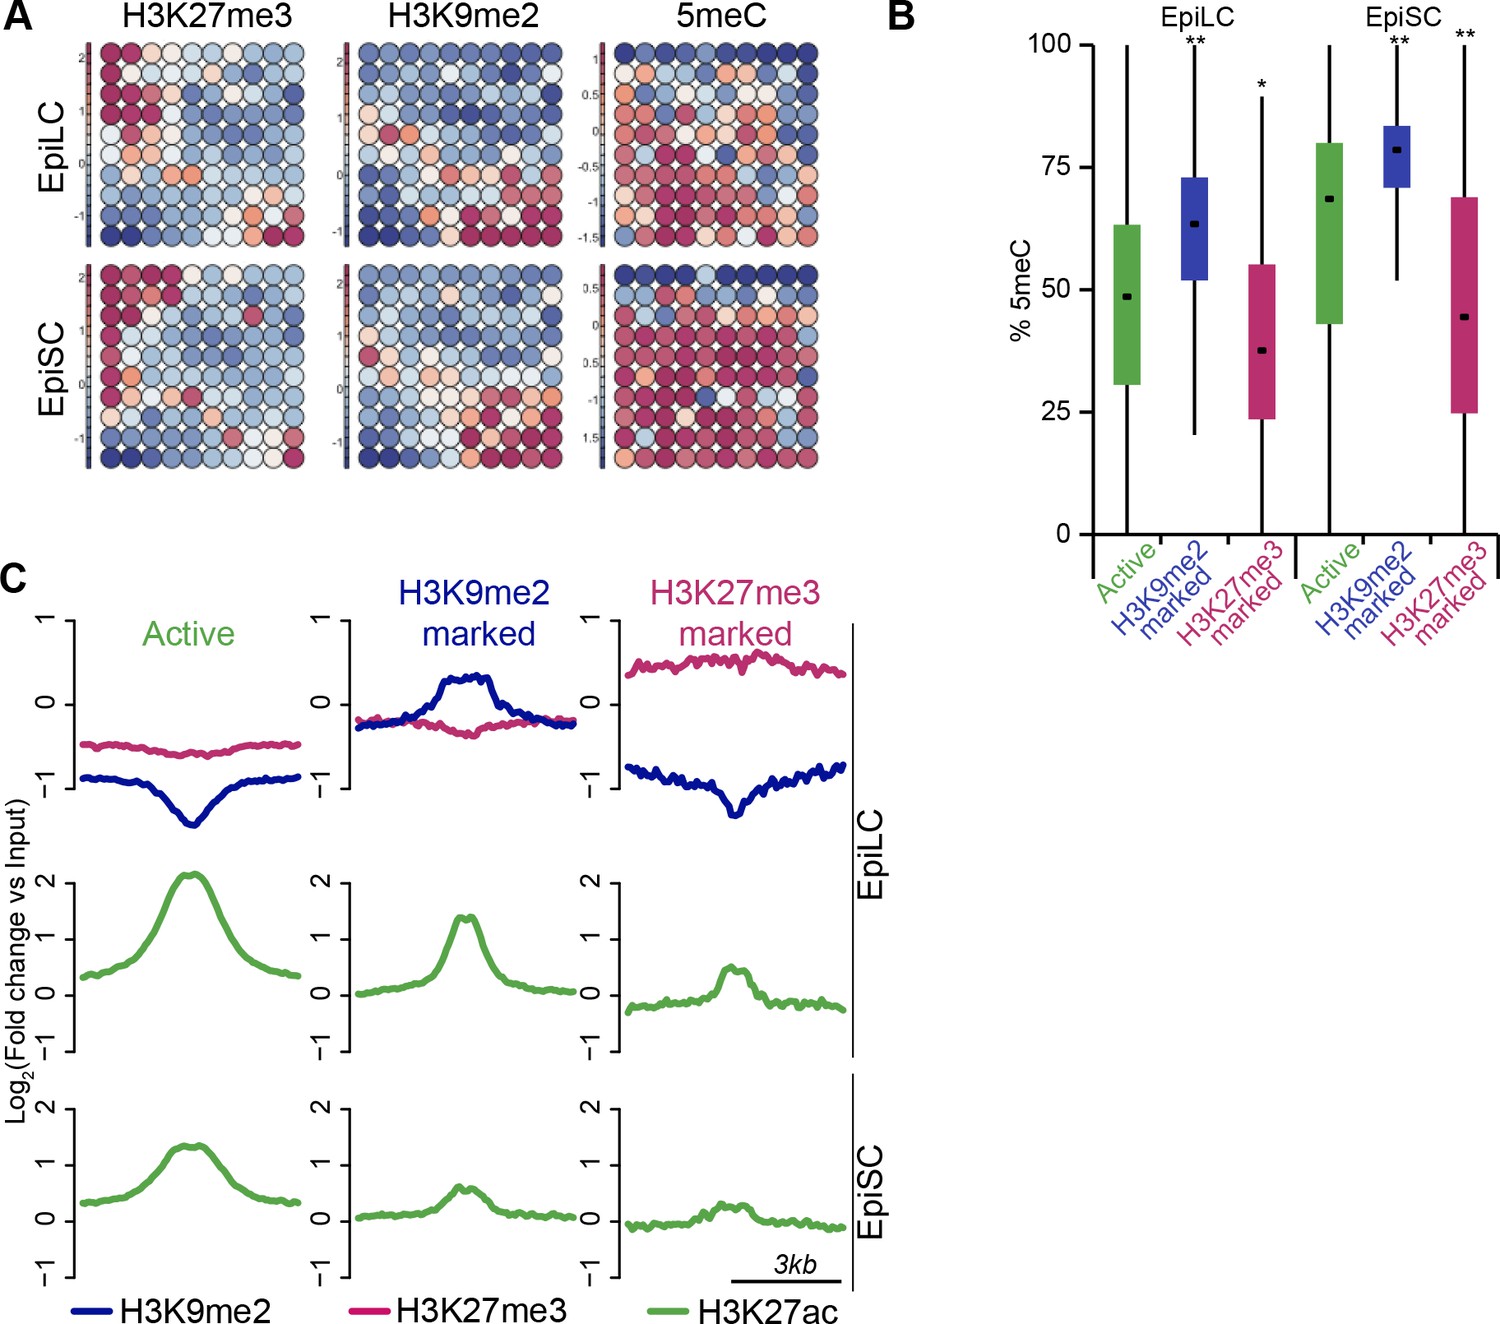
H3K9me2 marks a distinct set of enhancers.
(A) Unbiased dynamics of ESC enhancers upon exit from naïve pluripotency. Classification was performed using self-organizing maps. Some enhancers become inactivated via acquisition of H3K27me3 or H3K9me2. Each of these modes is associated with distinct DNA methylation levels. (B) Box plots showing DNA methylation levels at enhancers in EpiLCs and EpiSCs. Significance was calculated using unpaired Wilcoxon rank sum test with continuity correction. Effect size: *r≤0.10; **0.10<r≤0.15; ***r>0.15. (C) Chromatin profiles over enhancers in EpiLC and EpiSC. Active ESC enhancers (p300, H3K4me1 and H3K27ac enriched) were classified using k-means clustering based on H3K9me2 and H3K27me3 enrichment in EpiLCs.
Figure 7 with 1 supplement

H3K9me2 spreading to enhancers results in transient coenrichment with H3K27ac.
(A) Density contour plots showing correlation between H3K27ac enrichments at enhancers in 2i/LIF ESCs versus EpiLC (left panels) or 2i/LIF ESCs versus EpiSC (right panels). Green panels show all regulatory elements active in 2i/LIF ESCs (p300, H3K4me2 and H3K27ac enrichment), while blue panels show only the subset that becomes enriched with H3K9me2 in EpiLCs. (B) lcChIP-qPCR results measuring levels of H3K9me2, H3K27me3 and H3K27ac at putative Prdm1 and Esrrb enhancers. Samples were collected during EpiLC and EpiSC induction. Signal was scaled relative to average enrichment on negative (Pcsk5: H3K27ac, Gapdh: H3K9me2 and H3K27me3) and positive control regions (Pcsk5: H3K9me2, Gpr20: H3K27ac, Hoxc10: H3K27me3). Data are represented as mean ( ± SEM) from three independent biological replicates (*Student’s t-test p-value<0.05 relative to 2i/LIF ESC sample). (C) Sequential ChIP-qPCR performed Ehmt2F− CreER+ve d2 EpiLCs treated with EtOH or TAM. Upper panel shows samples precipitated first with anti-H3K9me2 antibody and later H3K27ac. Bottom panel shows results from an inverse experiment. Samples were scaled to a positive (Gpr20) control region. Data are mean (± SD) from two independent biological replicates. (*Student’s t-test p-value<0.05) (D) LcChIP-qPCR measuring enrichment of H3K27ac at selected enhancers in EtOH- or TAM-treated Ehmt2F/− CreER+ve d2 EpiLCs. H3K9me2-marked (blue) and control H3K27me3-poised or active regions are presented. Data are mean (± SD) from two independent biological replicates. (*Student’s t-test p-value<0.05). Also see Figure 7—figure supplement 1. H3K27ac: histone H3 lysine 27 acetylation; 2i/LIF: two-inhibitor/leukemia inhibitory factor; EpiLCs: epiblast-like cells; EpiSCs: epiblast stem cells; lcChIP-seq: low cell number chromatin immunoprecipitation with sequencing; H3K9me2: histone H3 lysine 9 dimethylation; H3K27me3: histone H3 lysine 27 trimethylation; SEM: standard error of the mean; ESCs: Embryonic stem cells; TAM: tamoxifen; EtOH: ethanol; SD: standard deviation.
Figure 7—figure supplement 1
H3K9me2-marked enhancers retain some H3K27ac in EpiLCs.
Box plots showing H3K27ac levels at enhancers in 2i/LIF ESC, EpiLCs and EpiSCs. Significance was calculated using unpaired Wilcoxon rank sum test with continuity correction. Effect size: *r≤0.10; **0.10<r≤0.15; ***r> 0.15.
Figure 8 with 1 supplement
G9a promotes transcriptional inactivation of enhancers.
(A,B) Box plots showing transcript levels of genes in epiblast (A) and EpiLCs (B), which lie in proximity of H3K9me2- or H3K27me3-marked enhancers. All comparisons are statistically significant (p<0.05). The effect size relative to active set is shown in the graphs: *r≤0.10; **0.10<r≤0.15; ***r>0.15 calculated using Wilcoxon rank sum test. For analysis of EpiLCs, a published microarray experiment was used (GSE30056) (Hayashi et al., 2011). (C,D) RT-qPCR for eRNAs at selected H3K9me2-marked (blue) and control (red: H3K27me3 enriched, green: active) enhancers shown as line plots (D) and summarized in a heatmap (C). Data are represented as mean ( ± SEM) from three independent biological replicates. Samples are normalised to ESC 2i/LIF sample with the exception of Otx2, which is normalised to d3 EpiLCs. (*Student’s t-test p-value<0.05) (E) FC of eRNA expression in Ehmt2F/− CreER+ve d2 EpiLCs treated with TAM relative to EtOH control. Transcripts are originating from H3K9me2- (blue), H3K27me3-marked (red) or active (green) loci. Data are presented as mean (± SEM) from three independent biological replicates. (*Student’s t-test p-value <0.05) (F) FC of eRNA expression in individual Ehmt2−/− E6.25 epiblasts normalised to Ehmt2+/+ littermates. Lines show geometric means. (*p<0.05 Wilcoxon rank sum test). Also see Figure 8—figure supplement 1. EpiLCs: epiblast-like cells; H3K9me2: histone H3 lysine 9 dimethylation; H3K27me3: histone H3 lysine 27 trimethylation; RT-qPCR: real-time quantitative polymerase chain reaction; eRNA: enhancer RNA; ESCs: Embryonic stem cells; TAM: tamoxifen; EtOH: ethanol.
Figure 8—figure supplement 1
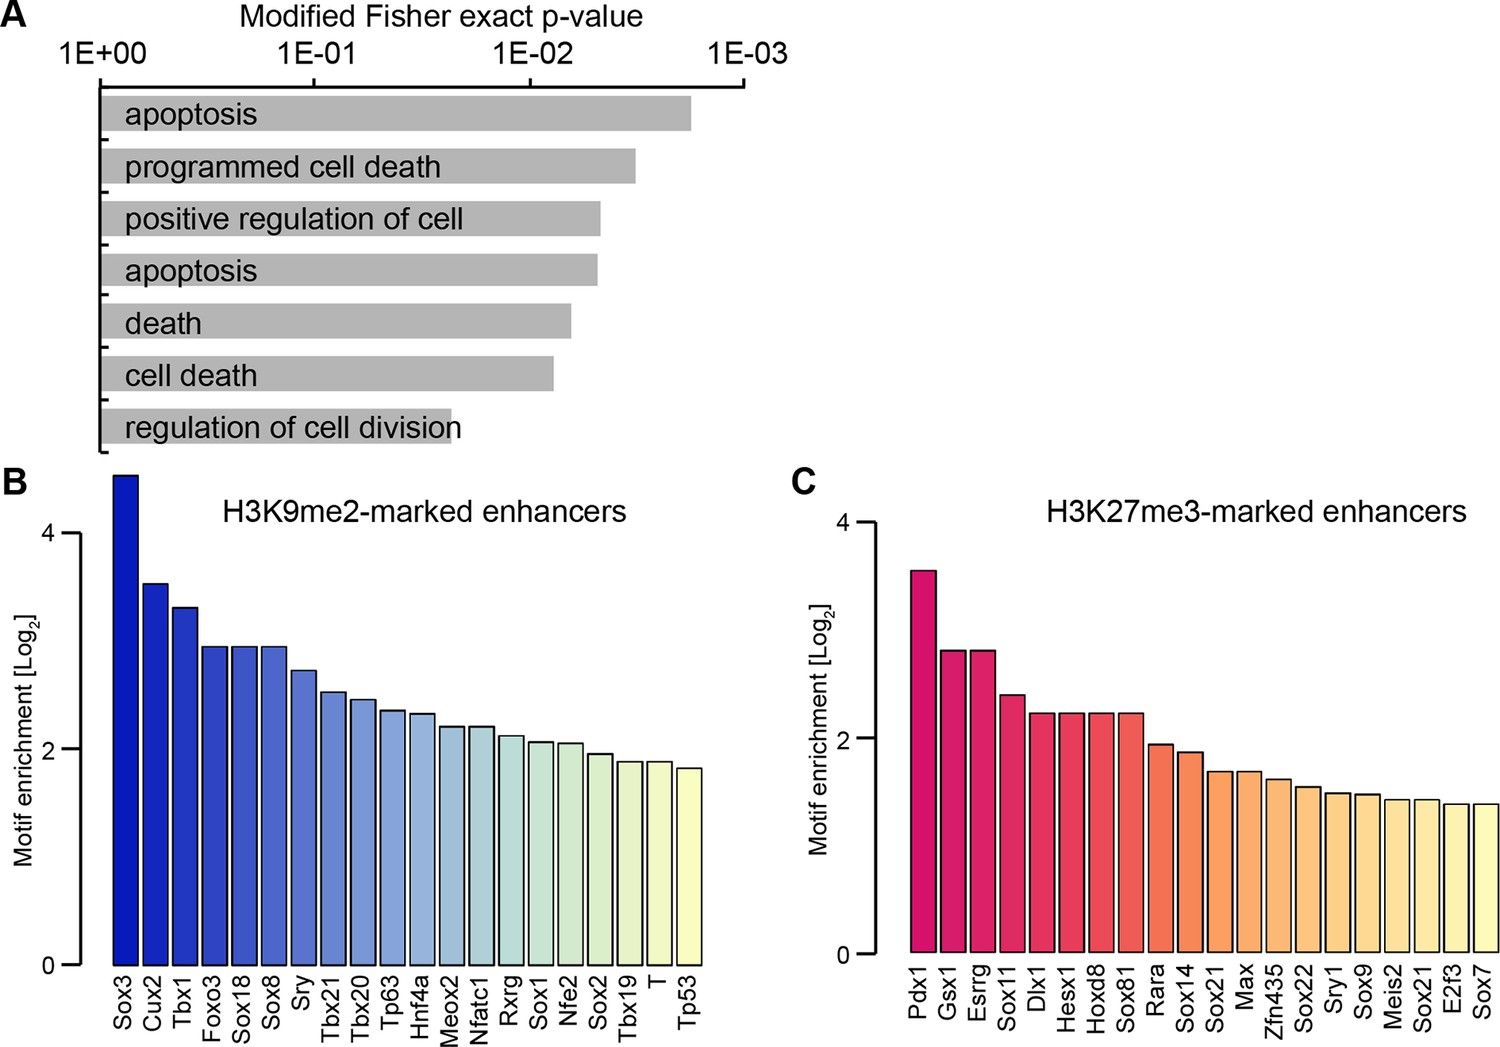
H3K9me2 enriched enhancers are preferentially linked to the p53 pathway.
(A) Selected enriched GO terms in H3K9me2-marked enhancers. (B,C) Bar plots showing top 20 enriched motifs in H3K9me2- (B) or H3K27me3- (C) marked enhancers. Source data file legends
Figure 9
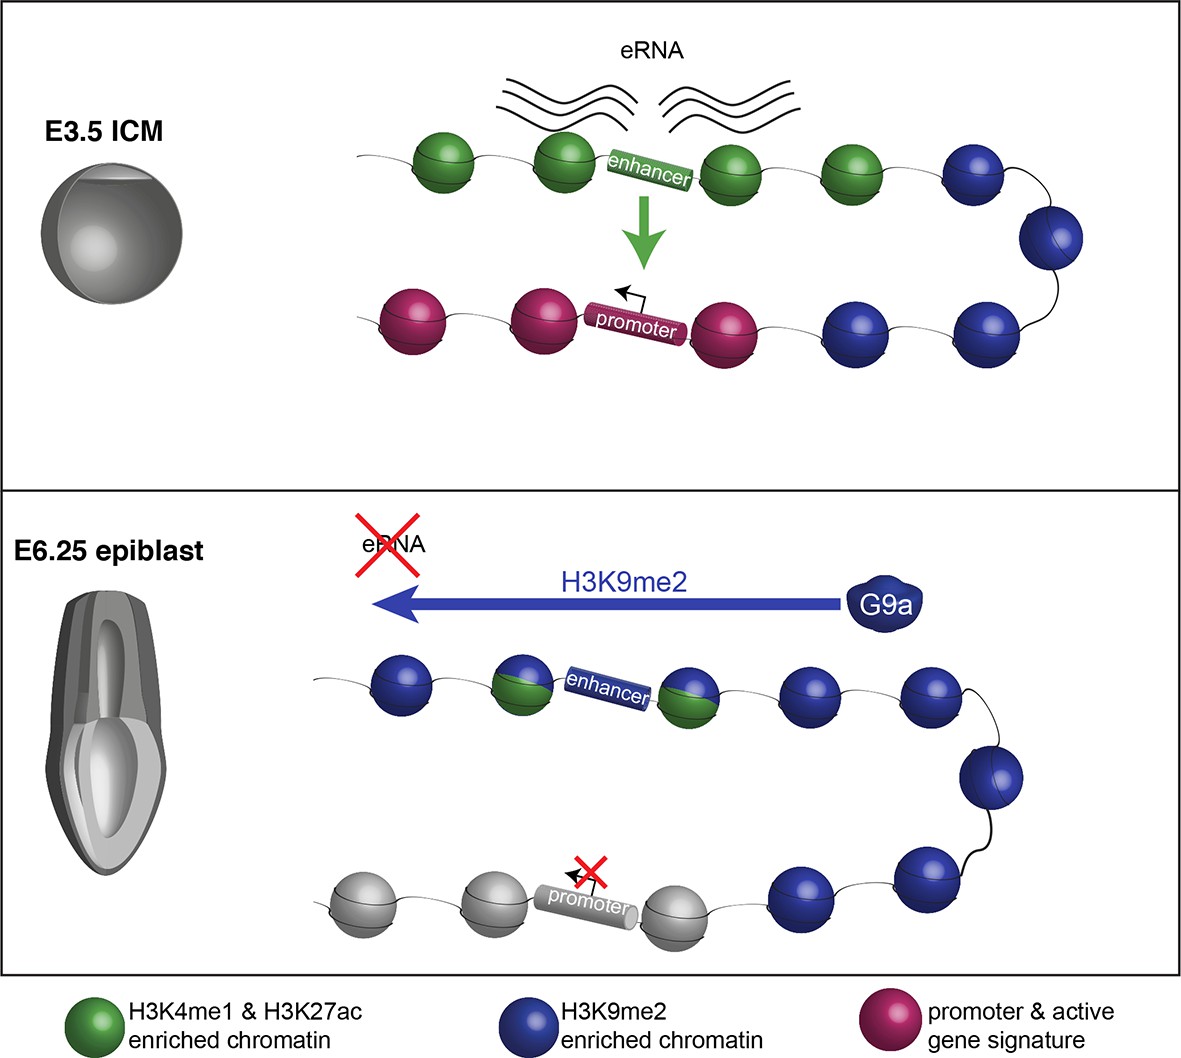
Proposed model for G9a-mediated enhancer inactivation.
Distal regulatory elements active in ICM are typically associated with H3K4me1 and H3K27ac enrichment (green) as well as eRNA expression. Such elements activate promoters (purple) to increase gene transcription. Following implantation, the majority of enhancers undergo inactivation. In many cases, this process is aided by spreading of G9a-dependent H3K9me2 enrichment domains. Despite retaining H3K27ac and H3K4me1 enrichment, these enhancers typically loose eRNA expression.
Author response image 1
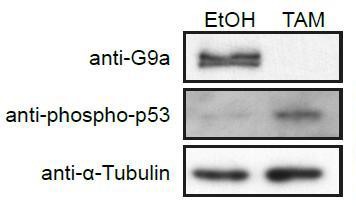
Western Blot of d2 G9aF/- CreER+ve EpiLCs treated with ethanol (EtOH) or tamoxifen (TAM).
Membranes were probed with anti-G9a, anti-phopho-p53 and anti-aTubuline antibodies.
Author response image 2

Bar plot showing changes in expression levels of genes nearest to analysed enhancers in G9acntrand G9a-/- E6.25 epiblast.
Data was extracted from RNAseq experiment. Shown are average Log2(Fold change) (+/- SEM). * pvalue<0.05 using Wilcoxon rank-sum test
Author response image 3
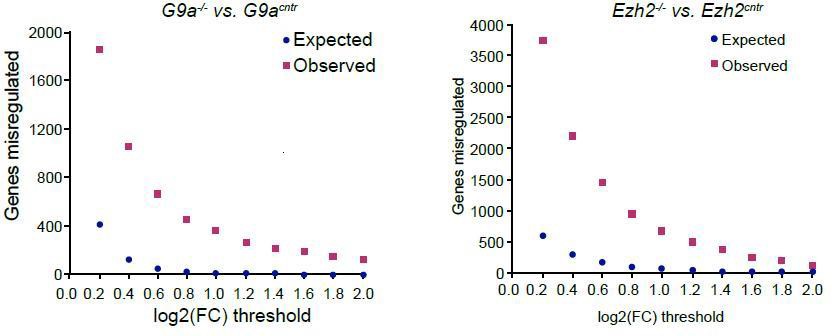
Plot showing background (expected) and observed number of transcripts reaching specific fold change (FC) deregulation thresholds.
Expected values were estimated based on variability of gene expression between G9acntr or Ezh2cntr RNAseq samples. Observed dataset are genes reaching FC threshold in G9a-/- or Ezh2-/- RNAseq samples. The ration of observed vs expected reaches 0.01 value only at log2(FC)>1.4.
Author response image 4
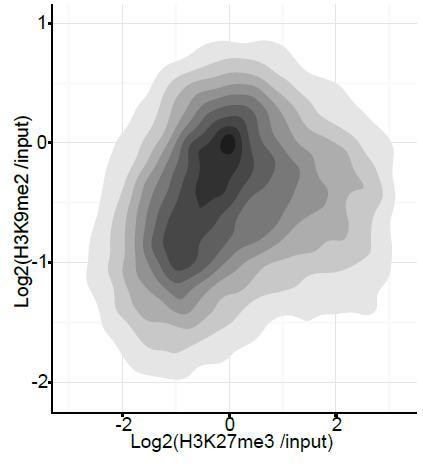
Density contour plots showing correlation between H3K27me3 and H3K9me2 enrichments at all promoters in E6.25 epiblast.
https://doi.org/10.7554/eLife.09571.035
Author response image 5
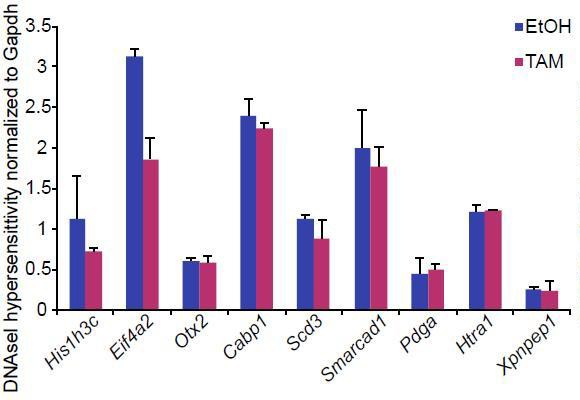
Bar plot showing DNAseI hypersensitivity of selected enhancers in d2 G9aF/- CreER+ve EpiLCs treated with ethanol and tamoxifen.
Shown is average from two independent biological repeats (+/- StDev).
Procedure was performed as previously described (John et al., 2013)
Additional files
-
Supplementary file 1
List of primers used in this study.
- https://doi.org/10.7554/eLife.09571.031
Download links
A two-part list of links to download the article, or parts of the article, in various formats.
Downloads (link to download the article as PDF)
Open citations (links to open the citations from this article in various online reference manager services)
Cite this article (links to download the citations from this article in formats compatible with various reference manager tools)
Chromatin dynamics and the role of G9a in gene regulation and enhancer silencing during early mouse development
eLife 4:e09571.
https://doi.org/10.7554/eLife.09571


