Evolutionary adaptation after crippling cell polarization follows reproducible trajectories
- Harvard University, United States
Figures
Figure 1 with 1 supplement
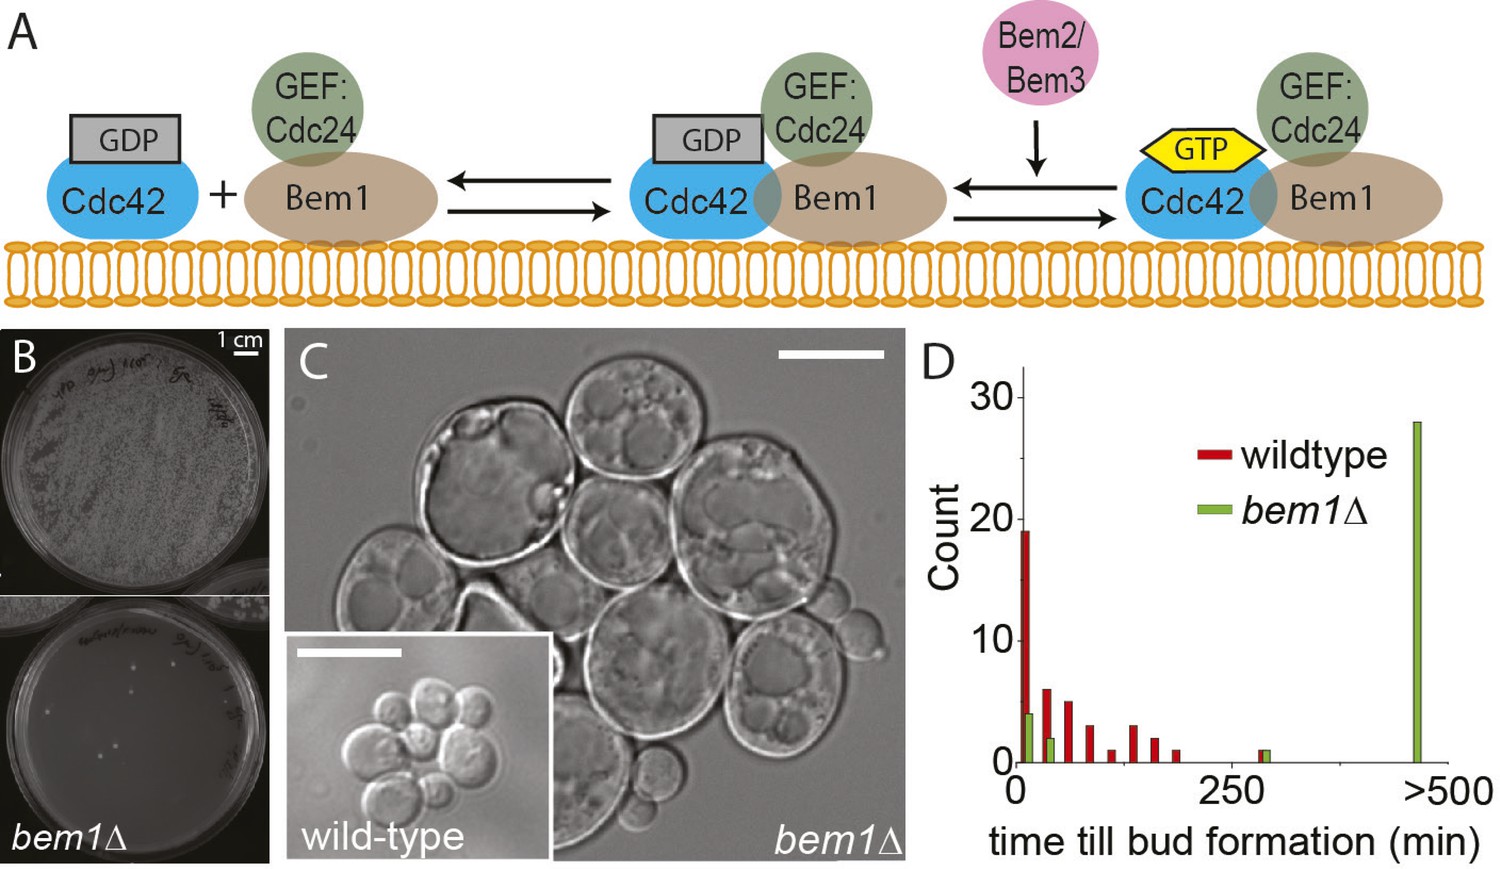
BEM1 is an important polarity gene.
(A) Cartoon showing the components of the machinery for cell polarization relevant for this work. (B) Images of two plates where 105 wild-type (left) vs 105 bem1∆ spores were plated. (C) Differential interference contrast (DIC) images of bem1∆ and wild-type cells that grew from a single spore, showing that bem1∆ cells do not polarize effectively and therefore grow very large compared to wild type. Scale bar indicates 20 µm. (D) Histograms of the time between cytokinesis and bud formation for bem1∆ and wild-type cells that were born after germination from spores.
Figure 1—figure supplement 1
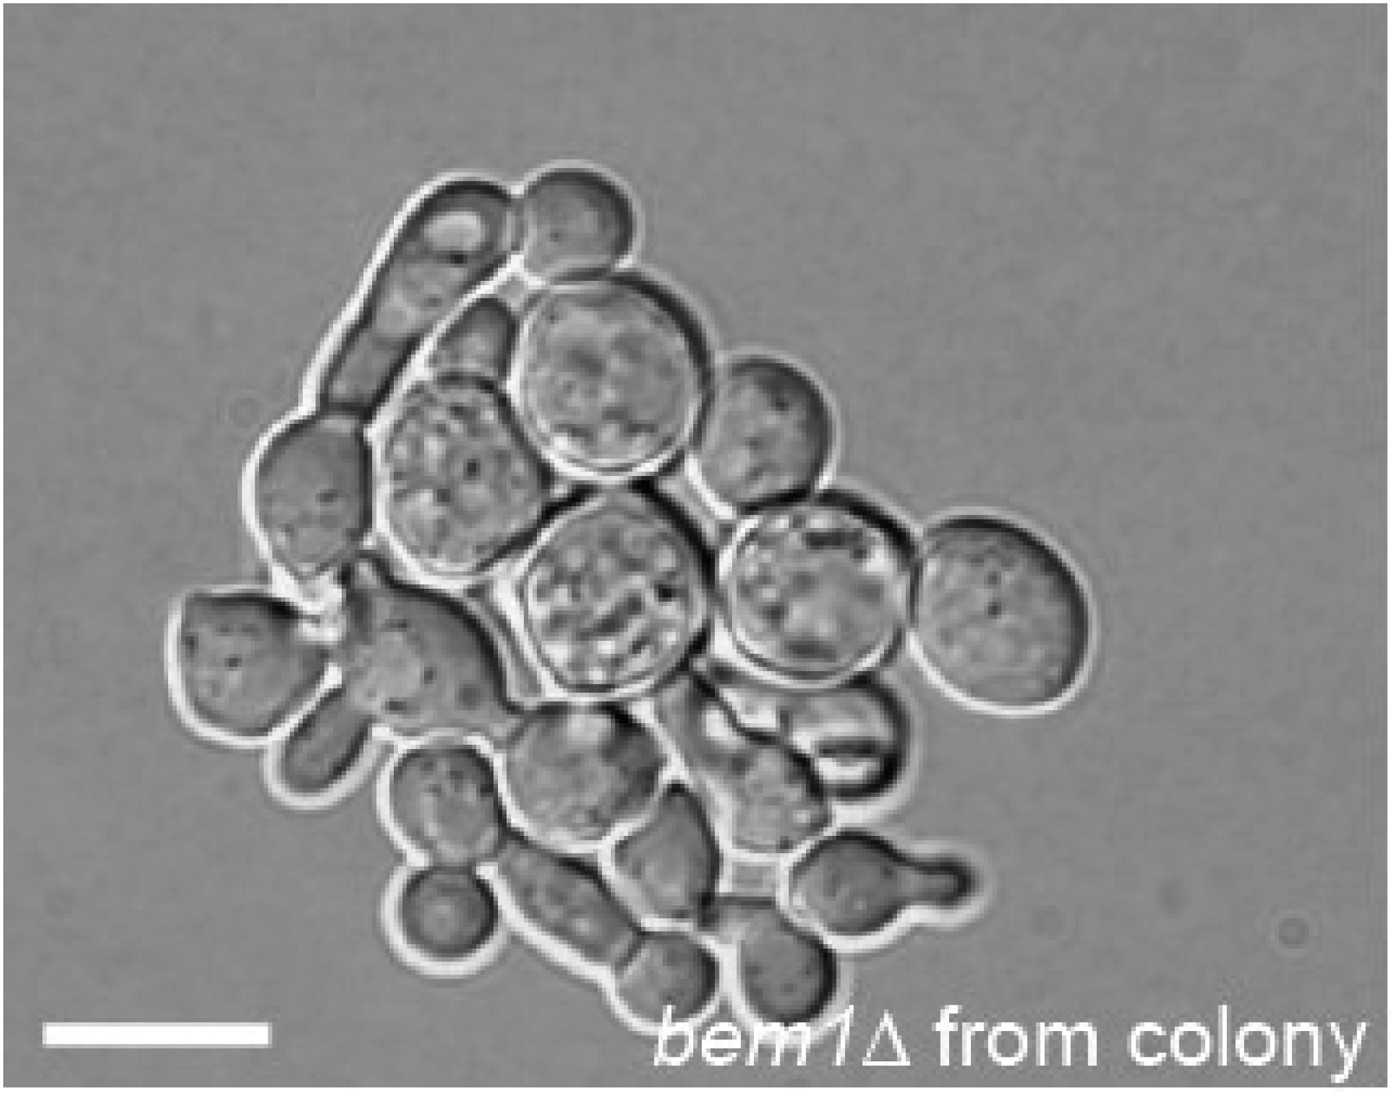
DIC microscopy image of a microcolony that grew from a single bem1∆ cell that was taken from the colony that was used to start the experimental evolution experiment of the A-lines.
Scale bar indicates 20 µm.
Figure 2 with 1 supplement
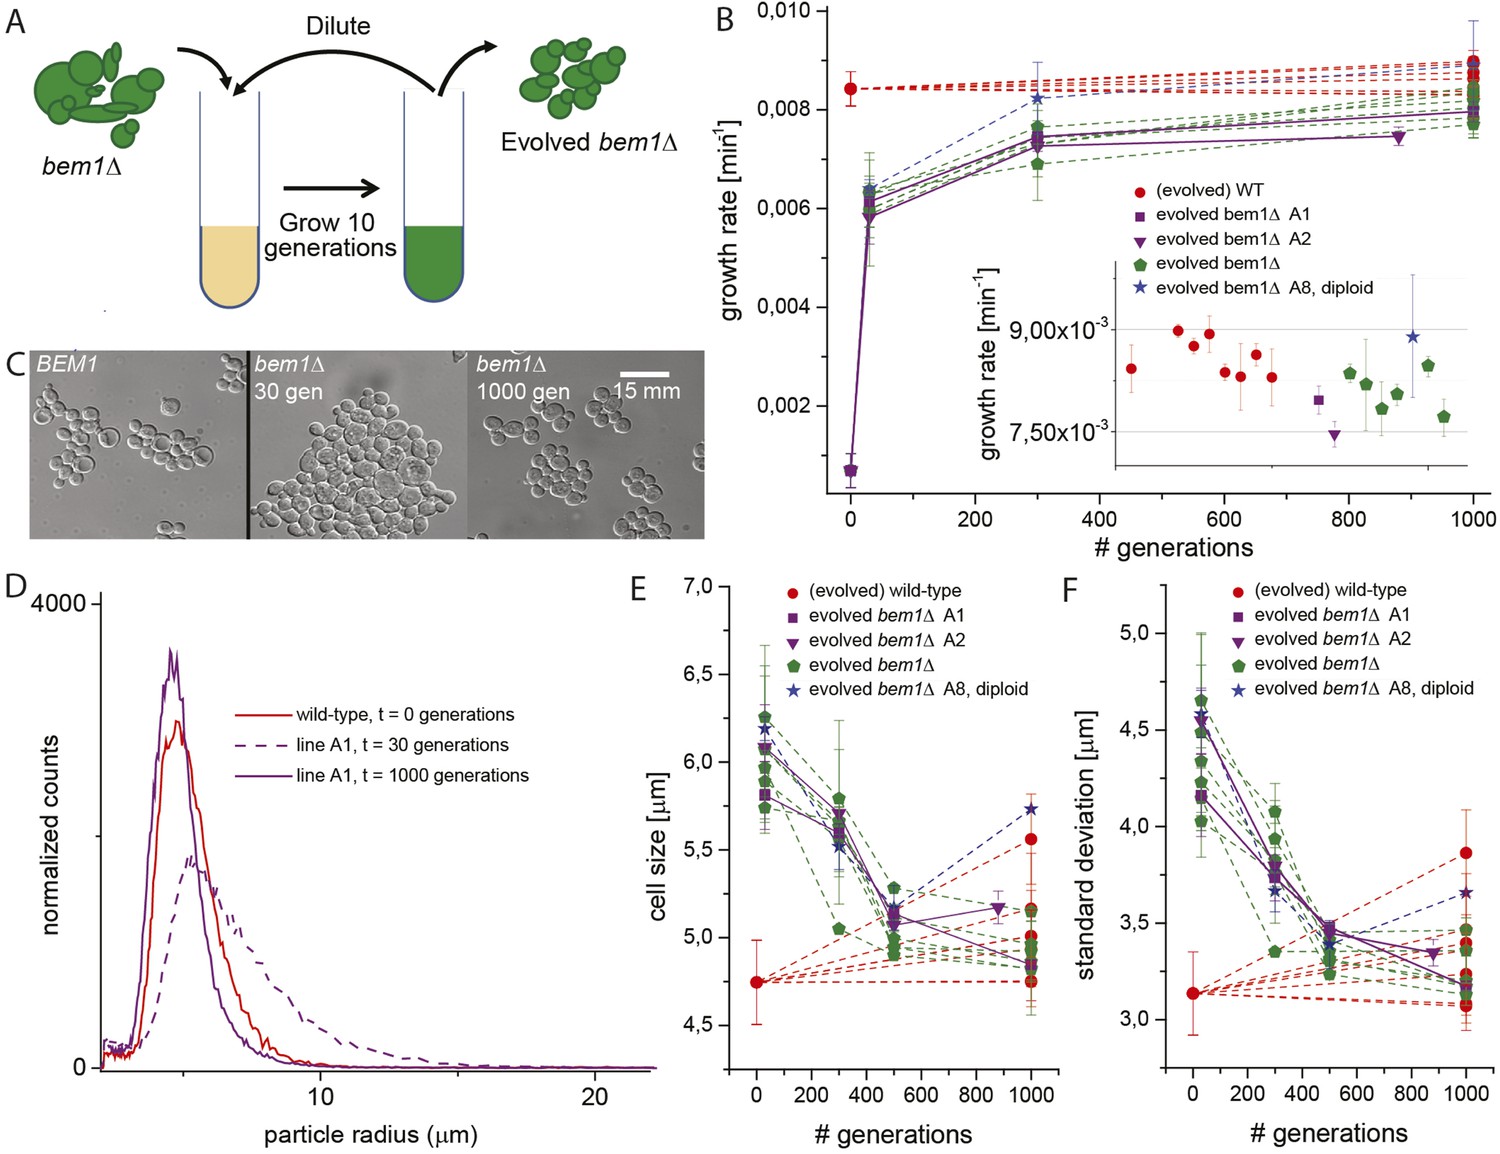
Experimental evolution experiments reveal that bem1∆ cells can adapt to wild-type growth rate and cell shape in 1000 generations.
(A) Cartoon of experimental evolution of bem1∆ and wild-type for 1000 generations by 100 cycles of serial dilution. (B) The log phase growth rate in bulk was measured for several time points (in number of generations) of the evolution experiment, for different bem1∆ (A1–10) and wild-type lines. The insert shows that the growth rates of bem1∆ cells are close to, but in aggregate significantly lower (t-test, p-value < 1e−5) than the growth rate of wild-type cells at the end of the evolution experiment. (C) DIC images of wild-type cells (left) and bem1∆ cells from line A1 at 30 (middle) and 1000 generations (right), showing changes in cell sizes within and between populations. (D) Cell size distribution for wild-type cells (red) and bem1∆ cells from line A1 at 30 (dashed, purple) and 1000 generations (solid, purple). These data are fitted to a log normal distribution to find the mode (peak location) and standard deviation. Subsequently, the mode (E) and standard deviation (F) are plotted for several time points of the evolution experiment for bem1∆ (A1–10) and wild-type lines. Note that the mode and standard deviation significantly increased in one of the wild-type lines due to increased clumping (Figure 2—figure supplement 1). The error bars indicate SD between independent experiments.
Figure 2—figure supplement 1
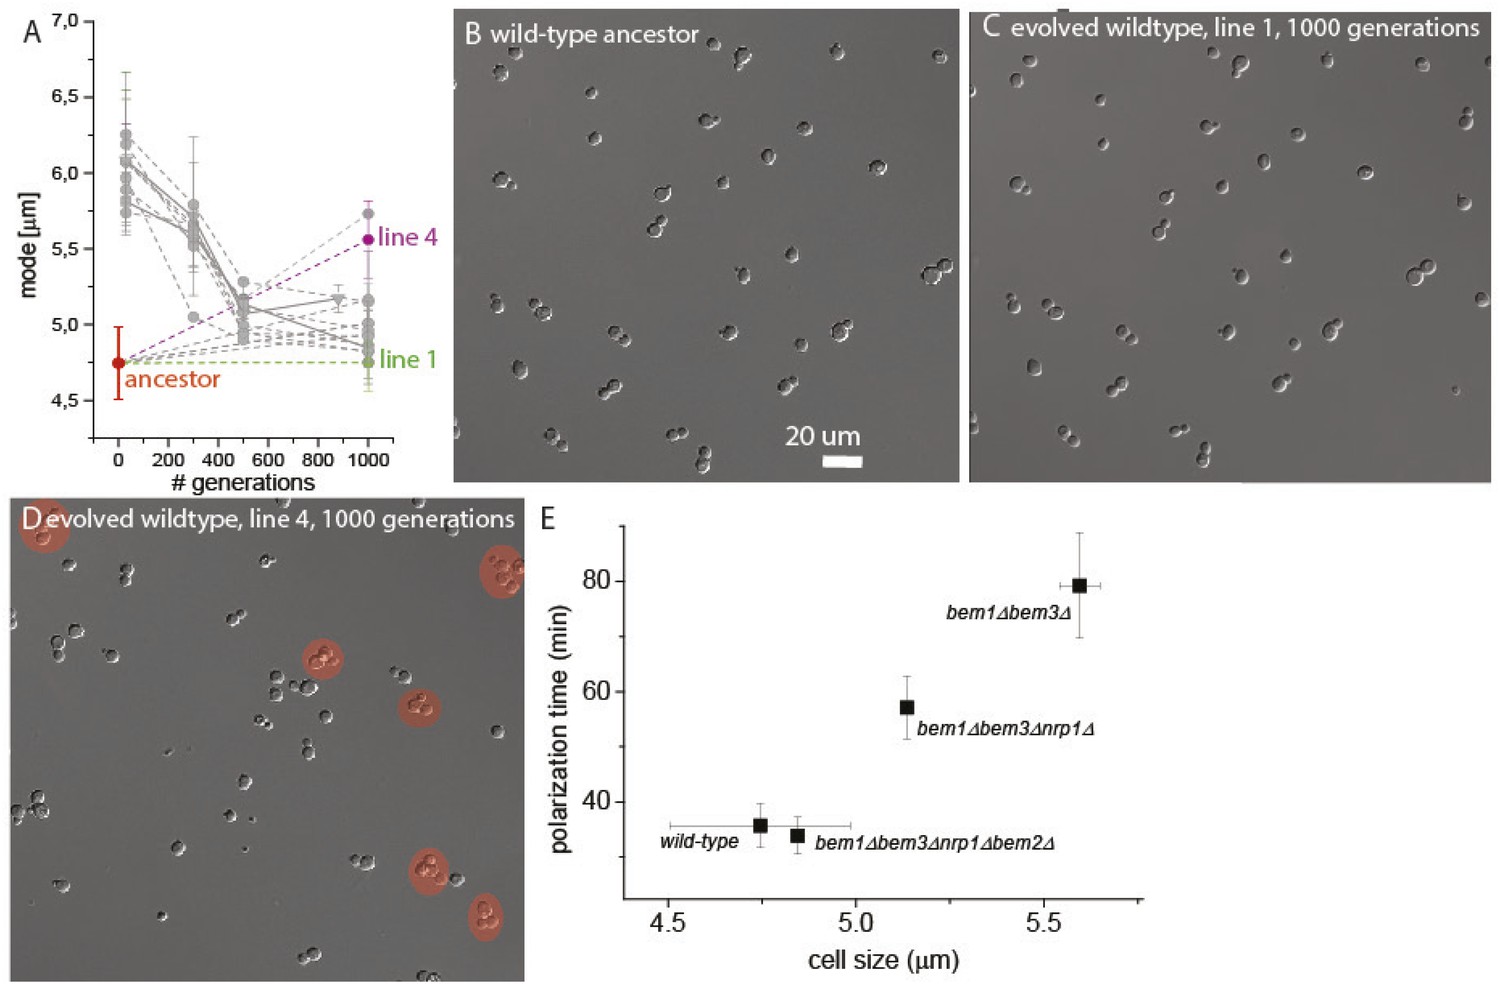
Variable clumpiness in the evolved wild-type lines.
(A) Data as in Figure 2E, where the mode is plotted for several time points of the evolution experiment for bem1∆ (A1–10) and wild-type lines. The ancestor (red) as well evolved line 1 (green) and 4 (purple) are highlighted. From the ancestor (B) as well as line 1 (C) and 4 (D) at 1000 generations, cells are imaged in log-phase with DIC microscopy, to visualize clumpiness. The red circles mark clumps of cells with three or more cells. (E) Data from Figure 2, Figure 3, and Figure 4 are combined to show that cell size is a reasonable approximation for polarization time. The mode of the cell size for wild type and line A1 is plotted at 30, 500, and 1000 generations on the x-axis. These time points represent mutants that subsequently dominate the population (Figure 3B), 30 gen ≈ bem1Δ bem3Δ, 500 gen ≈ bem1Δ bem3Δ nrp1Δ, 1000 gen ≈ bem1 Δbem3 Δnrp1 bem2Δ. We recreated these mutants in the presence of a polarity marker to measure polarization times (Figure 4), which is plotted on the Y axis. The plot indeed suggests a linear relation between cell size and polarization time. For details on polarization time measurements and the reconstruction see Figure 4 and the Supplementary information.
Figure 3 with 1 supplement

Three mutations produce adaptation to deletion of BEM1.
(A) Locations of the mutations in the three genes that were mutated at least three times. The purple color indicates different functional domains in the genes. The three genes and locations of the mutations are drawn roughly to scale. (B) For bem1∆ line A1 and A2 the fraction of the mutant vs the wild-type allele in the population is plotted against the number of generations in the evolution experiment. (C) We sporulated a diploid yeast strain (BEM1/bem1∆::KanMx, BEM3/bem3∆::Nat, NRP1/nrp1∆::HphMx and BEM2/bem2∆::LEU2), to obtain all different combinations of mutations. Subsequently, we spotted those spores on plates (insert) and measured for every genotype, the percentage of macroscopic colonies forming spores (the error bar is the statistical error) as well as the average radius of those colonies (the error bar is the standard deviation). (D) The log phase growth rate in bulk (the error bar is the standard deviation) is measured for the reconstructed intermediates of bem1∆ cells in line A1 and A2 (dark blue). The red line indicates the effect of the three adaptive mutations in a wild-type background. For comparison, the purple dots and line indicate the difference between the growth rates of the evolved lines A1 (faster) and A2 (slower) at the end of the evolution experiment. (E) Hypercube where the genotype is depicted by the location and the color in the quadrant. The different paths on the hypercube represent all the different trajectories between any two genotypes within this genotype space. The area of the square represents the growth rate of that genotype, as indicated by the gray scale bar square. The outer-cube represents all BEM1 lines, which are in our evolutionary experiment inaccessible, because the BEM1 gene was completely removed from the genome, however, these data are included to reveal the relative change in BEM1 dependence in different genetic backgrounds.
Figure 3—figure supplement 1
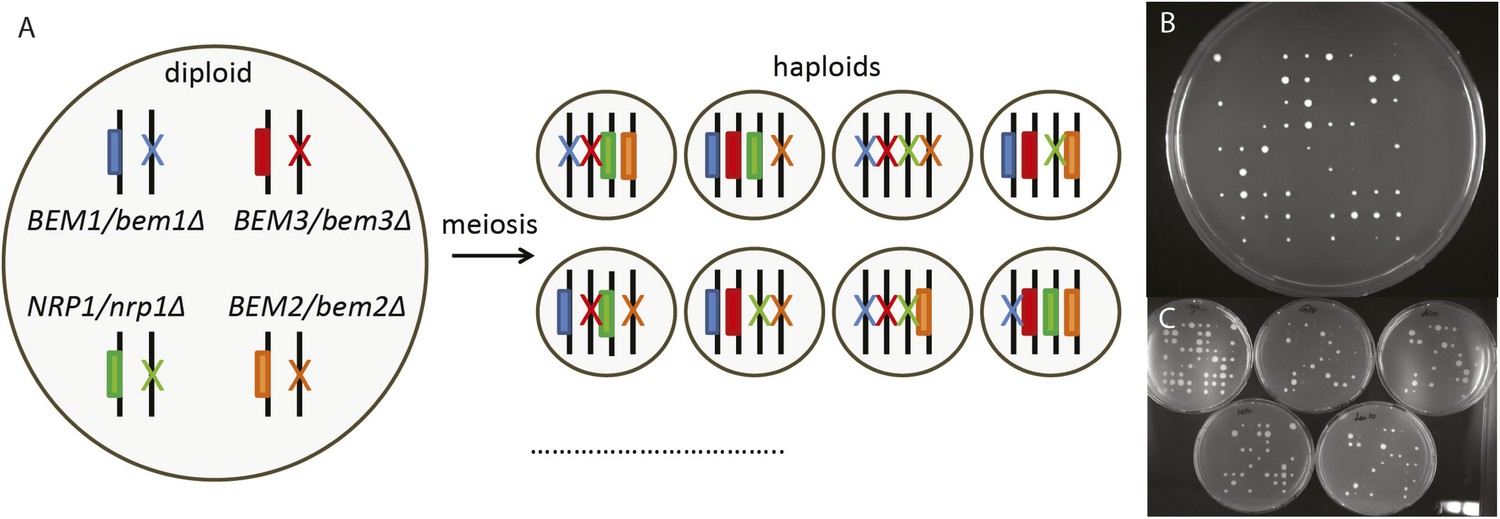
Reconstructing the evolutionary trajectory.
(A) Cartoon showing how sporulation of a heterozygous diploid results in haploids with all the different combinations of gene knock outs. Only eight of the sixteen genotypes are shown. (B) Image of a plate where we spotted individual spores from the heterozygous diploid. We measured the colony size from 810 spores deposited on 10 plates in a 9 × 9 grid using automated image analysis. Afterwards we determined the genotype of the spores by replica plating them to different selective media as shown in (C), which allowed us to calculate the percentage of surviving colonies by diving the number of observed spores by the number of expected spores (50 per genotype). Afterwards, we took cells with different genotypes from these plates to measure their growth rate in log-phase in liquid media, as well as for microscopic analysis (Figure 4).
Figure 4
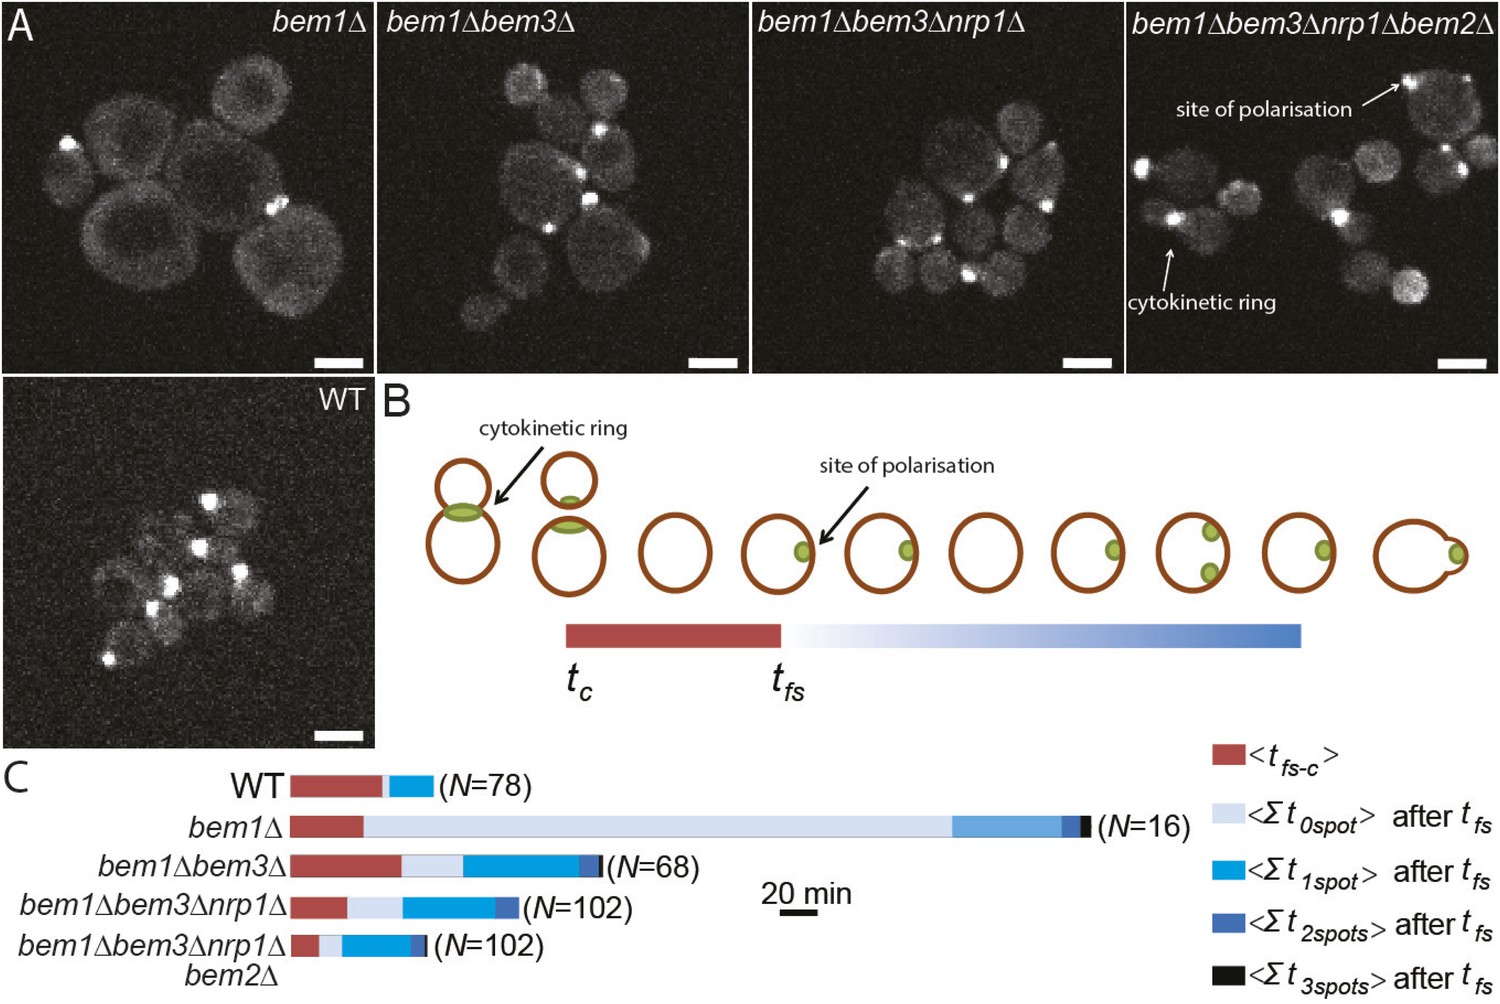
Three adaptive mutations change polarization dynamics to re-establish efficient polarization.
(A) Z-projections of spinning disk fluorescence microscopy images of Spa2-Citrine, which marks the site of polarization as well as the cytokinetic ring, in yeast cells at different reconstructed stages of the evolution. The scale bar indicates 10 µm. (B) Cartoon explaining our analysis of polarization dynamics. For the indicated number of mother cells (N), we average (1) the time (tfs − c) between cytokinesis (tc) and the moment that the first polarity spot appears (tfs), indicated in red, and (2) the total time per cell cycle, after tfs, when cells contained zero, one, two, or three polarity spots (for details see Supplementary materials). The different times are combined in a horizontal bar plot (C) where the length of the bars indicates the average time in minutes.
Videos
Video 1
DIC microscopy video of germinating spores (time step is 3 min) growing in a micro fabricated channel with constant media supply.
The spore in the bottom-left is wild-type and the spore in the top-right is bem1∆. The video plays at 2520× real time and the time stamps show hh:mm.
Video 2
DIC microscopy video of a microcolony that grew from an individual bem1∆ spore (time step is 3 min) in a micro-fabricated channel with constant media supply.
Both very large cells, which often lyse, and small, fast dividing cells can be observed. The video plays at 2520× real time and the time stamps show hh:mm.
Video 3
DIC microscopy video of a microcolony that grew from an individual bem1∆ cell, taken from the same colony that was used for the large evolution experiment (A lines).
The colony was grown on an agar pad to provide constant culturing conditions (time step is 2 min). The video plays at 2520× real time and the time stamps show hh:mm.
Video 4
Spinning disk confocal fluorescence microscopy video of Spa2-Citrine in wild-type cells.
For every image, the cells were exposed for 200 ms with a 488 laser (the time step is 2 min). The video shows a time series of maximum projections of seven z-stacks (z-step is 1 µm). For Videos 4–8, the image size and the intensity values are kept constant. The cells are grown in a micro-fabricated channel with constant media supply. As cells divide, Spa2 concentrates at the bud neck and the single fluorescent focus splits into two with both mother and daughter cells inheriting localized Spa2. In mothers this spot often becomes the site where buds emerge, but in daughters, who spend longer in G1, the spot typically disappears and later reappears, at a different site, just before the next bud emerges. The video plays at 2520× real time and the time stamps show hh:mm.
Video 5
Cell polarization in bem1∆ cells.
Conditions are identical to Video 4; however, the cells in the video are bem1∆. Note the much slower cell cycles, the appearance and disappearance of Spa2 spots that do not give rise to budding, including one site of Spa2 accumulation that persists for most of the video, but does not lead to a bud emerging. Cells rarely show two simultaneous strong Spa2 spots. The video plays at 2520× real time and the time stamps show hh:mm.
Video 6
Cell polarization in bem1∆ bem3∆ cells.
Conditions are identical to Video 4; however, the cells in the video are bem1∆ bem3∆ double mutants. Note the frequent presence of two competing spots of localized Spa2. The video plays at 2520× real time and the time stamps show hh:mm.
Video 7
Cell polarization in bem1∆ bem3∆ nrp1∆ cells.
Conditions are identical to Video 4; however, the cells in the video are bem1∆ bem3∆ nrp1∆ triple mutants. Competition between competing Spa2 spots is resolved more quickly than in bem1∆ bem3∆ cells. The video plays at 2520× real time and the time stamps show hh:mm.
Video 8
Cell polarization in bem1∆ bem3∆ nrp1∆ bem2∆ cells.
Conditions are identical to Video 4; however, the cells in the video are bem1∆ bem2∆ bem3∆ nrp1∆ quadruple mutants. Although these cells bud at similar sizes and rates as BEM1 cells, some cells show prolonged presence of two or more Spa2 spots and mothers rarely produce their next bud close to the site of its predecessor. The video plays at 2520× real time and the time stamps show hh:mm.
Additional files
-
Supplementary file 1
Mutations in the evolved lines.
- https://doi.org/10.7554/eLife.09638.018
-
Supplementary file 2
Yeast strains.
- https://doi.org/10.7554/eLife.09638.019
Download links
A two-part list of links to download the article, or parts of the article, in various formats.
Downloads (link to download the article as PDF)
Open citations (links to open the citations from this article in various online reference manager services)
Cite this article (links to download the citations from this article in formats compatible with various reference manager tools)
Evolutionary adaptation after crippling cell polarization follows reproducible trajectories
eLife 4:e09638.
https://doi.org/10.7554/eLife.09638


