Human observers have optimal introspective access to perceptual processes even for visually masked stimuli
- University of California, Los Angeles, United States
Figures
Figure 1
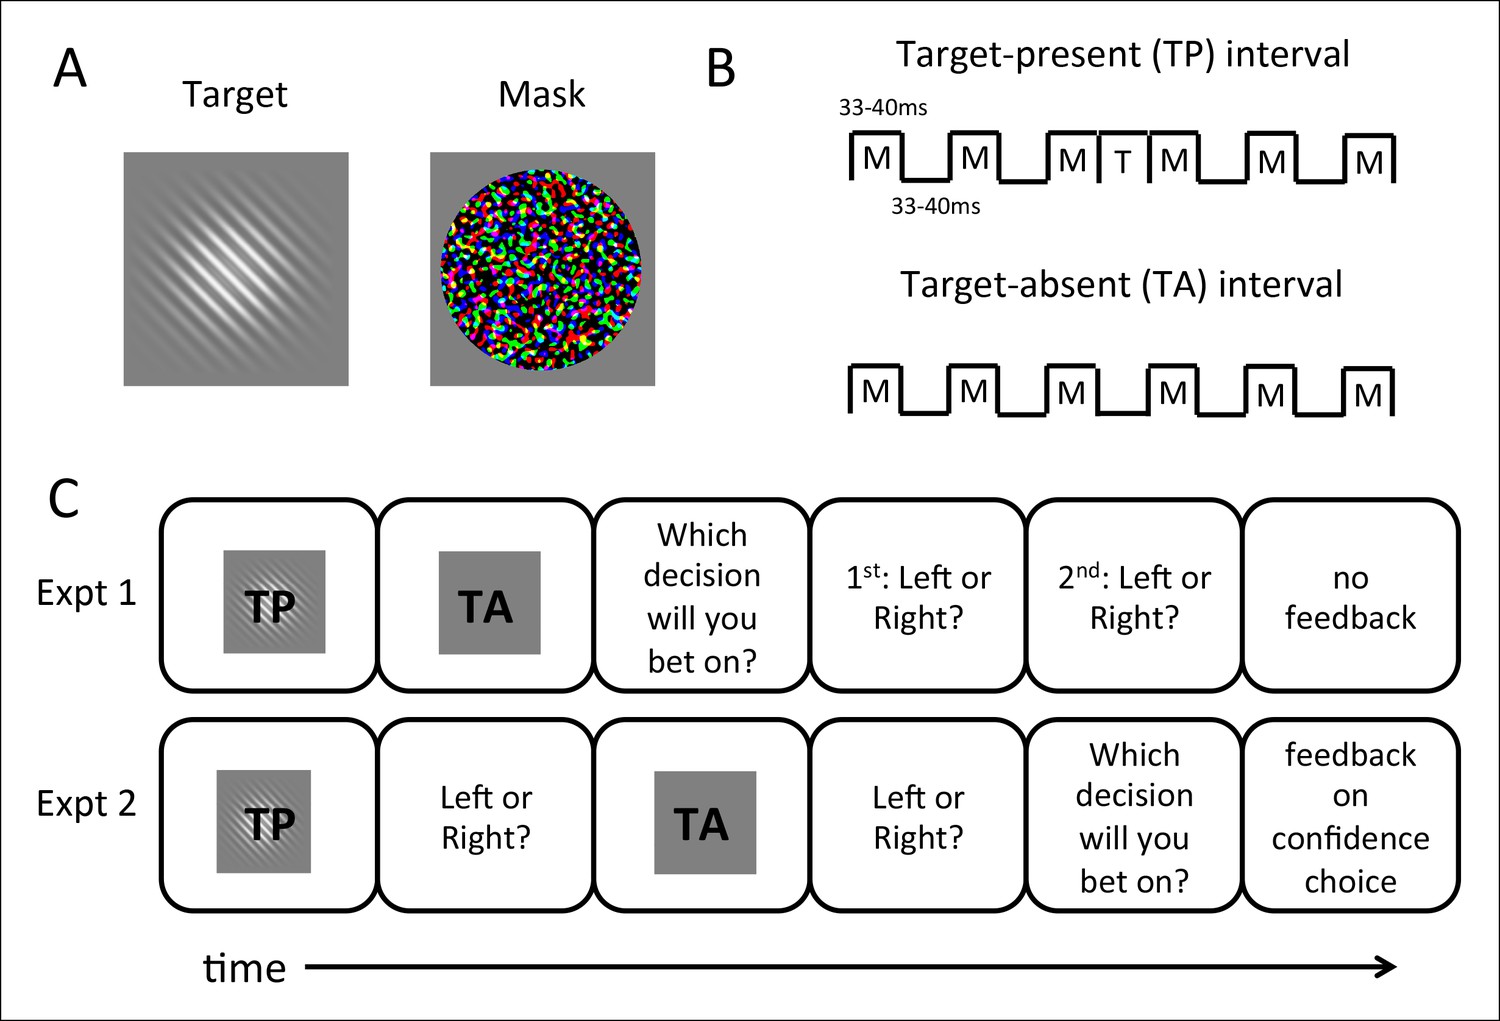
Stimuli and procedures for the 2IFC confidence-rating task.
(A) Targets consisted of oriented (45° left- or right-tilted from vertical) Gabor patches presented at multiple near-threshold contrast levels; masks consisted of bandpass-noise filtered random RGB values (see Materials and methods). (B) Each trial consists of two intervals of discrimination in which the target stimulus (T) was forward- and backward-masked (M). Gabor patch targets were presented only in target-present (TP) intervals; in target-absent (TA) intervals, the target was replaced with blank frames. Otherwise timings of stimuli were matched between the two intervals. (C) Experimental tasks. Experiment 1 required subjects to bet on which discrimination they felt more confident before they indicated their orientation discrimination choices (left or right tilt of the Gabor) sequentially for both intervals. Shown is an example trial in which TP is presented before TA; in the experiment this order varied randomly from trial to trial. In Experiment 2, subjects bet on the more confident interval after the discriminations, and feedback was given. (See Materials and methods for more details.)
Figure 2
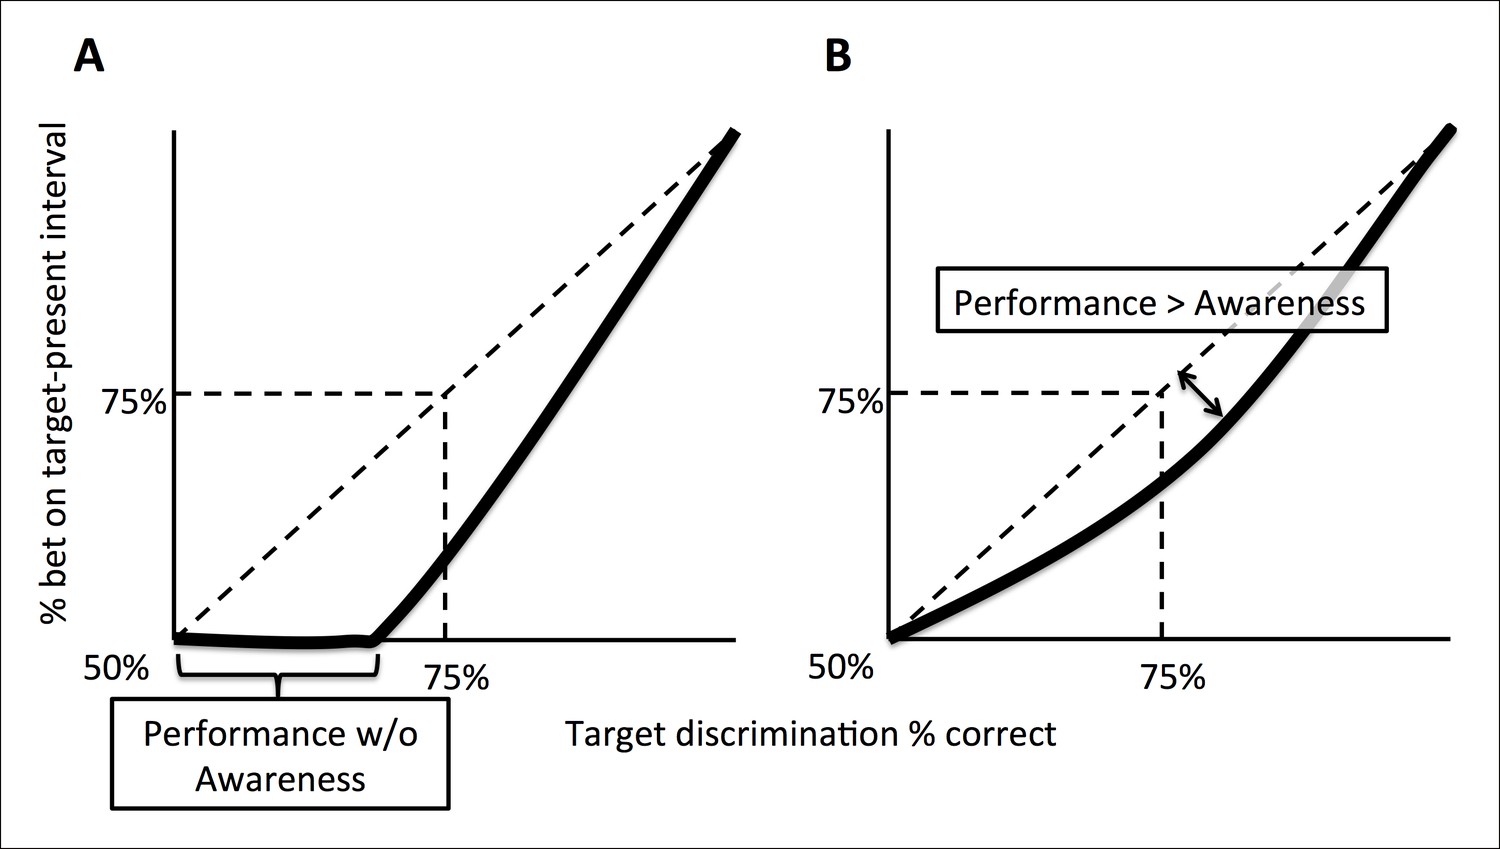
Schematic explanation of predictions of the experiments.
(A) A ‘Performance without Awareness’ pattern of behavior, in which subjects are able to discriminate the target above chance while betting on the target-present interval at chance. (B) A ‘Performance > Awareness’ pattern of behavior, in which subjects are less able to bet on their discrimination decisions than they are able to correctly discriminate the target. In both (A) and (B), the diagonal dashed line indicates where rate of betting on the target-present interval equals objective discrimination performance.
Figure 3
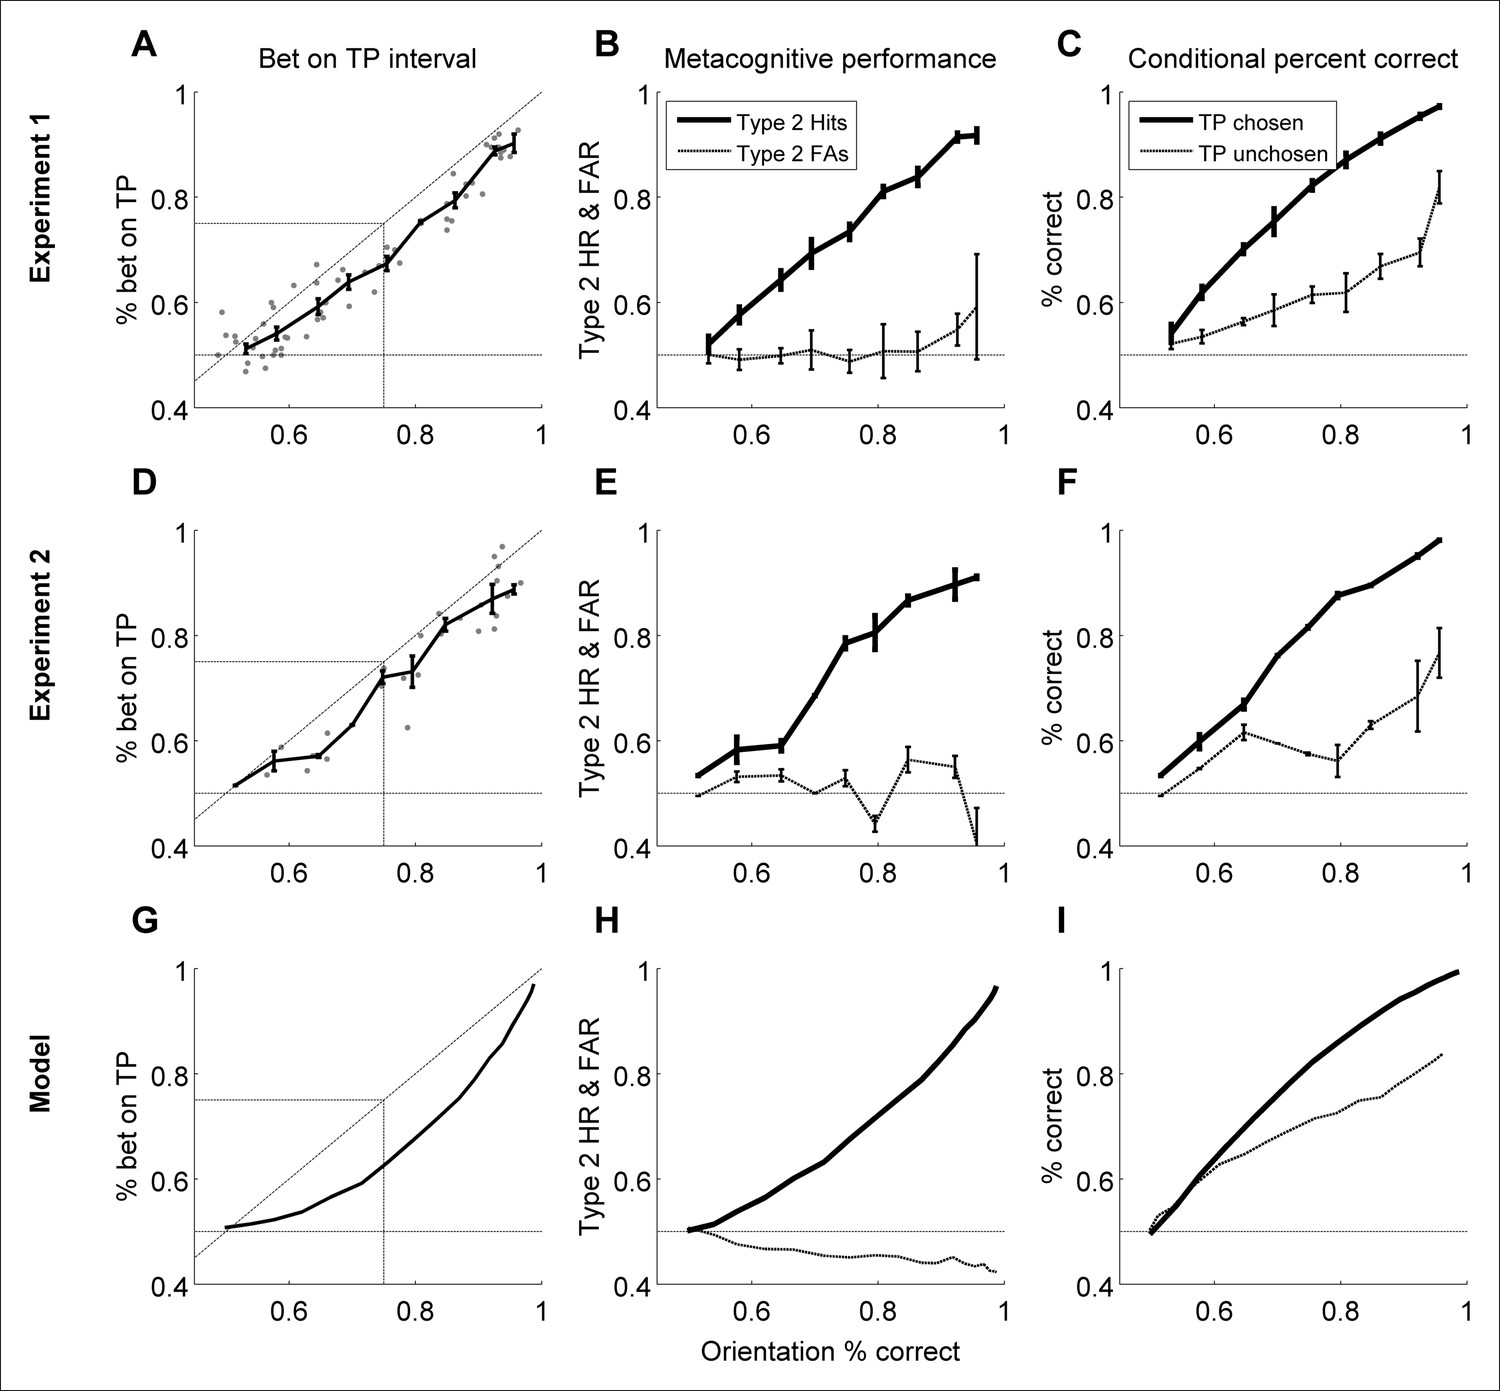
Group-level results of behavioral experiments (rows 1 and 2), presented in comparison to the predictions of the Bayesian ideal observer model (row 3; see Materials and methods - Computational Model).
In both experiments, human observers displayed no evidence of Performance without Awareness, but appeared to demonstrate Performance > Awareness (panels A and D). However, the ideal observer model also demonstrated such behavior (panel G), indicating that it is not suboptimal at all but arises from the 2IFC nature of the confidence task (see Bayesian Ideal Observer Model results section and Figure 2 caption for explanation). Horizontal gray lines in panels A, D, and G indicate chance-level betting (50%) on the target-present (TP) interval. Panels B, E, and H show rising Type 2 hit rate (‘HR’; when subjects bet on a correct orientation discrimination choice) but relatively flat Type 2 false alarm rate (‘FAR’; when subjects bet on an incorrect orientation discrimination choice), and panels C, F, and I show higher orientation discrimination accuracy when the target-present (TP) interval is bet on; these patterns suggest that human subjects and the Bayesian ideal observer were rating confidence via assessing their probability of correctly discriminating orientation, rather than target presence versus absence only. The model demonstrates good explanatory power for the data across all participants (mean proportion of variance accounted for by the model, R2 = 0.565). Error bars for behavioral data indicate the standard error of the mean across subjects with data in each bin.
Figure 4
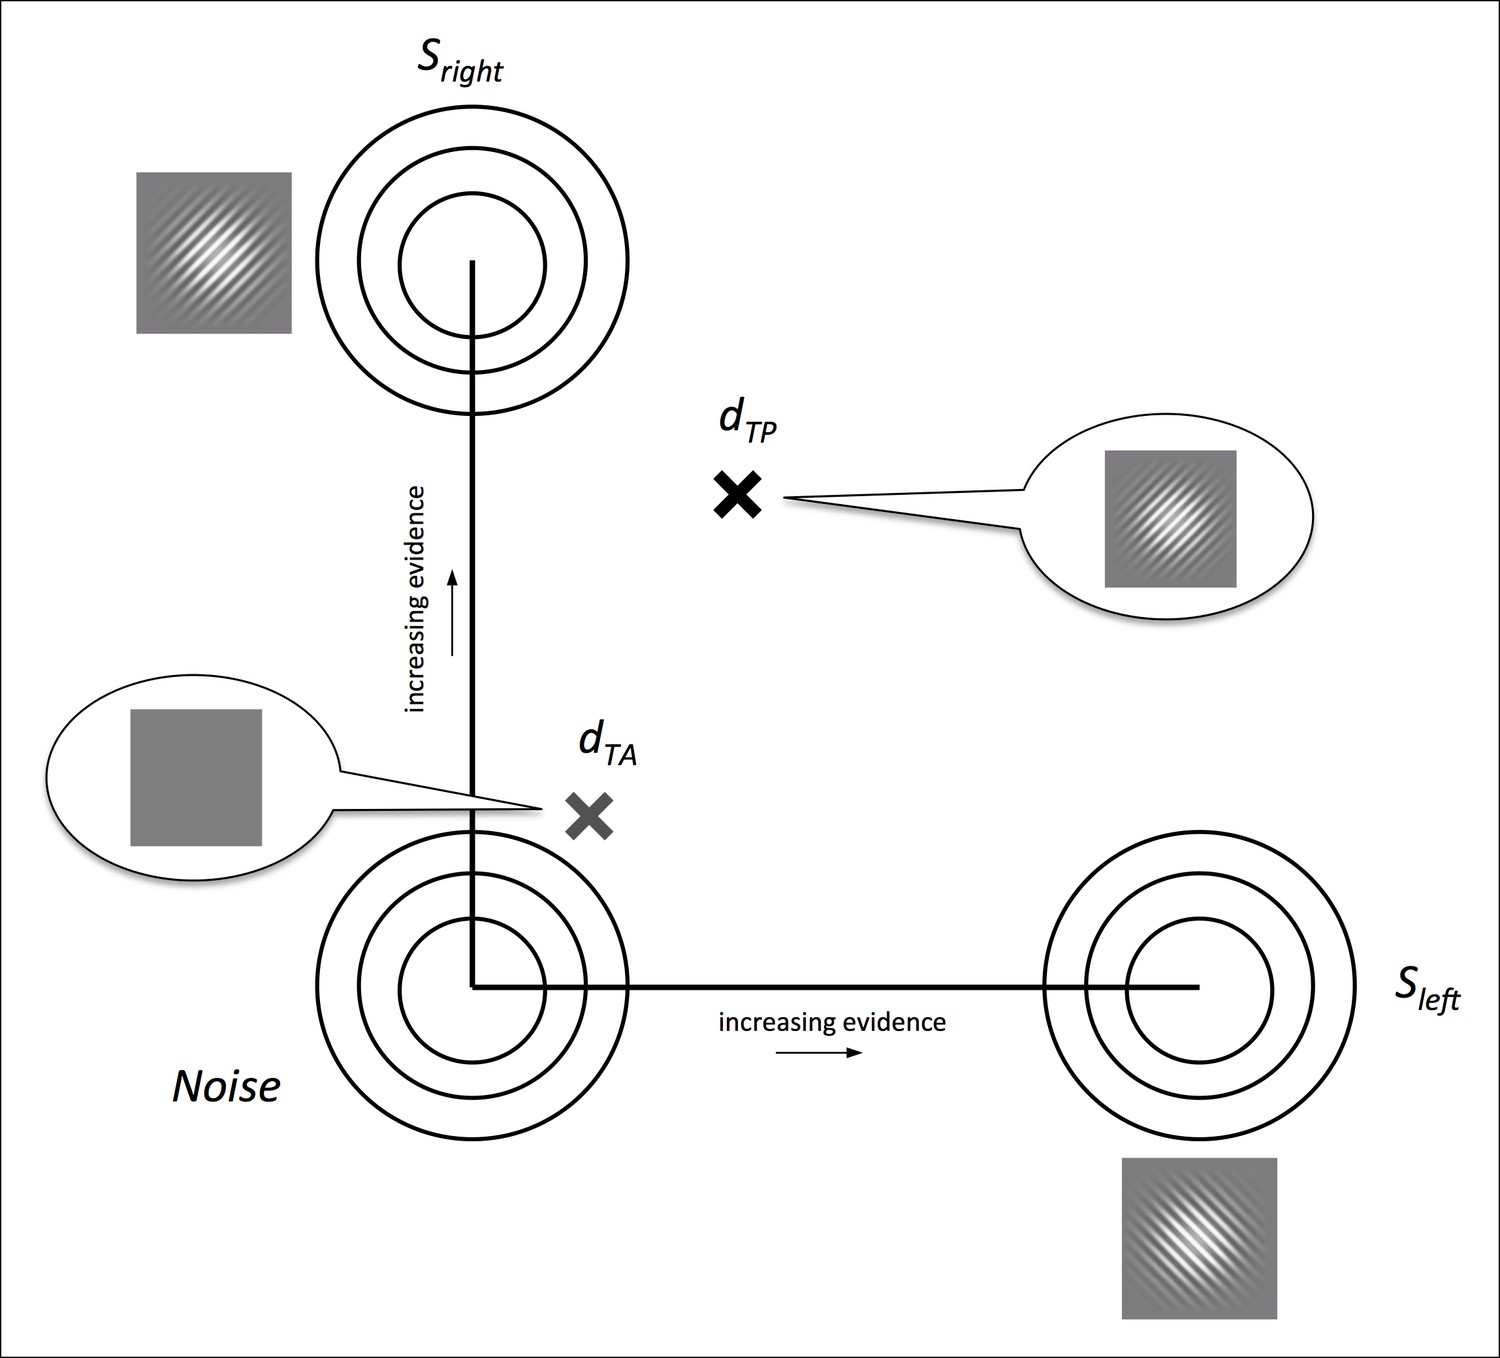
Illustration of the Bayesian ideal observer’s 2-dimensional representation space, following standard 2-dimensional signal detection theory (King and Dehaene, 2014; Macmillan and Creelman, 2004).
(a) Distributions Sleft and Sright lie on orthogonal axes cleft and cright representing left- and right-tilted targets, respectively, and the noise distribution lies at the origin. On each simulated trial, the model ‘sees’ two samples, one drawn from a source distribution Si to represent the target-present interval (dTP) and the other from the noise distribution to represent the target-absent interval (dTA). It marginalizes across all contrast evidence levels to guess the orientations of both samples according to the posterior probabilities of left- and right-tilted sources. Then, it compares the posterior probabilities of the chosen orientations in each interval to select the interval with higher confidence (p(correct)) (see Materials and methods - Bayesian ideal observer model).
Figure 5
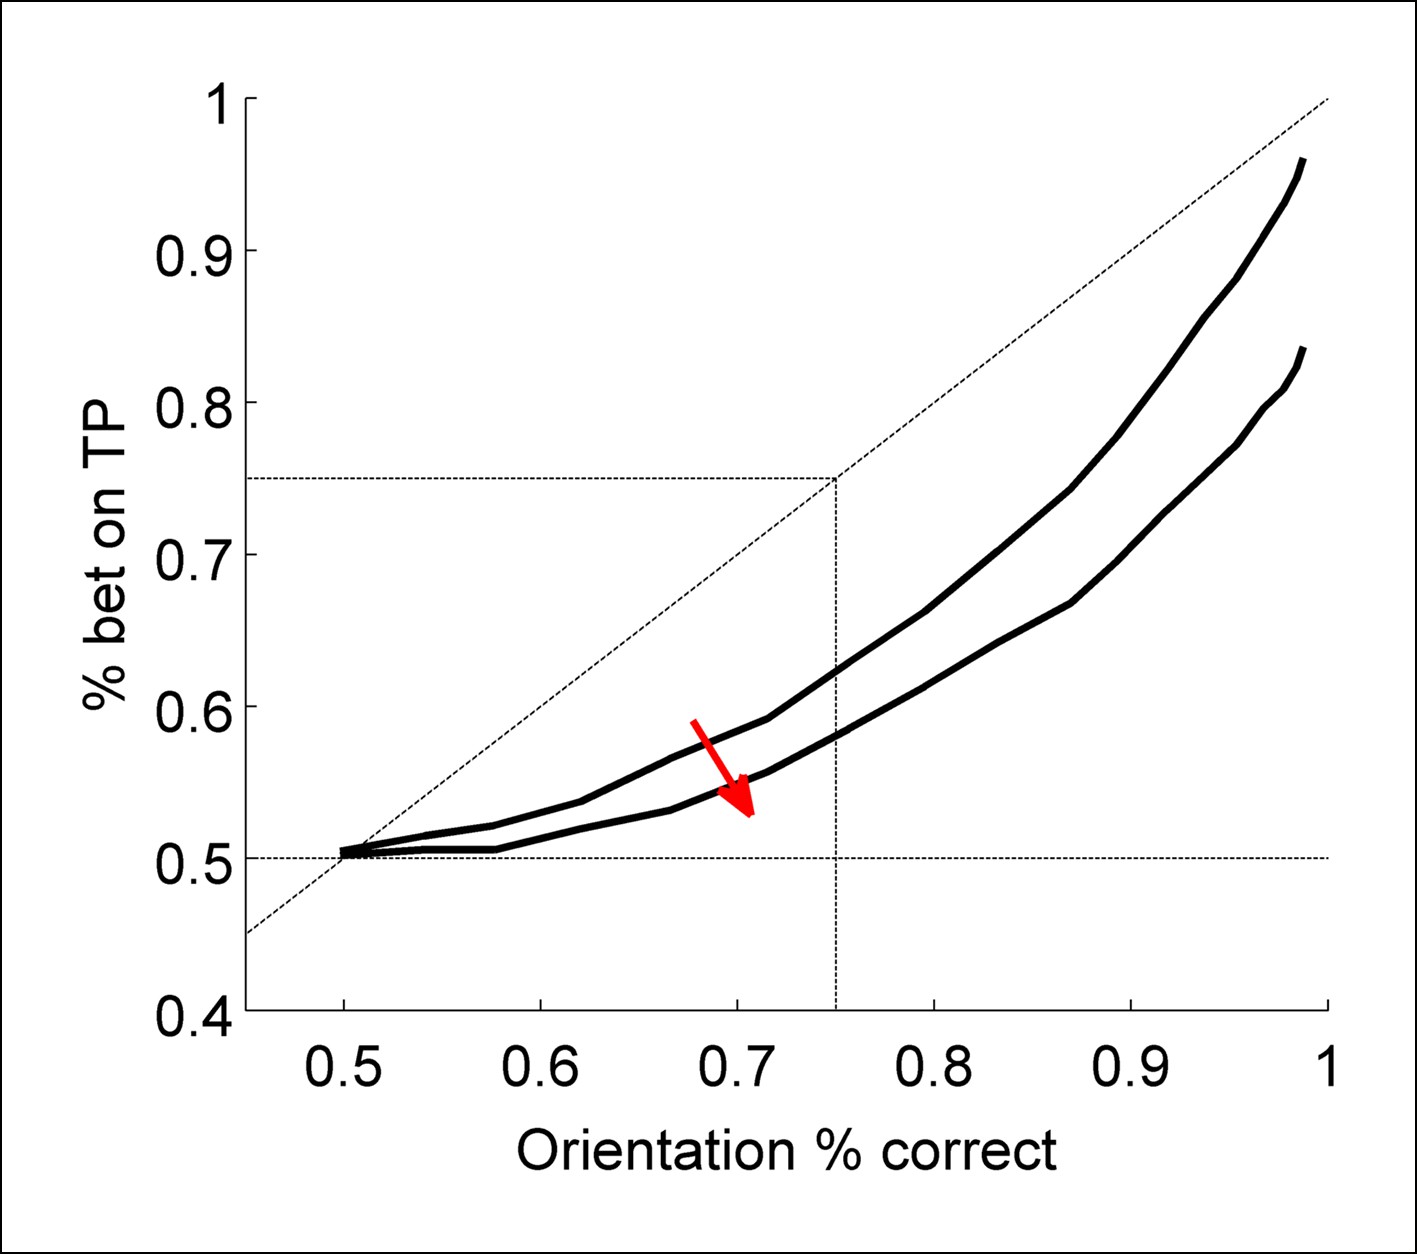
Illustration of increasing values for σd on the appearance of Performance without Awareness behavior, used to evaluate the possibility that human participants may have exhibited Performance without Awareness.
Increasing σd values resulted in increasingly poor R2 values (see Results), indicating that the ideal observer (which displays no performance without awareness) produces the best fit to human data.
Appendix 1—Figure 1
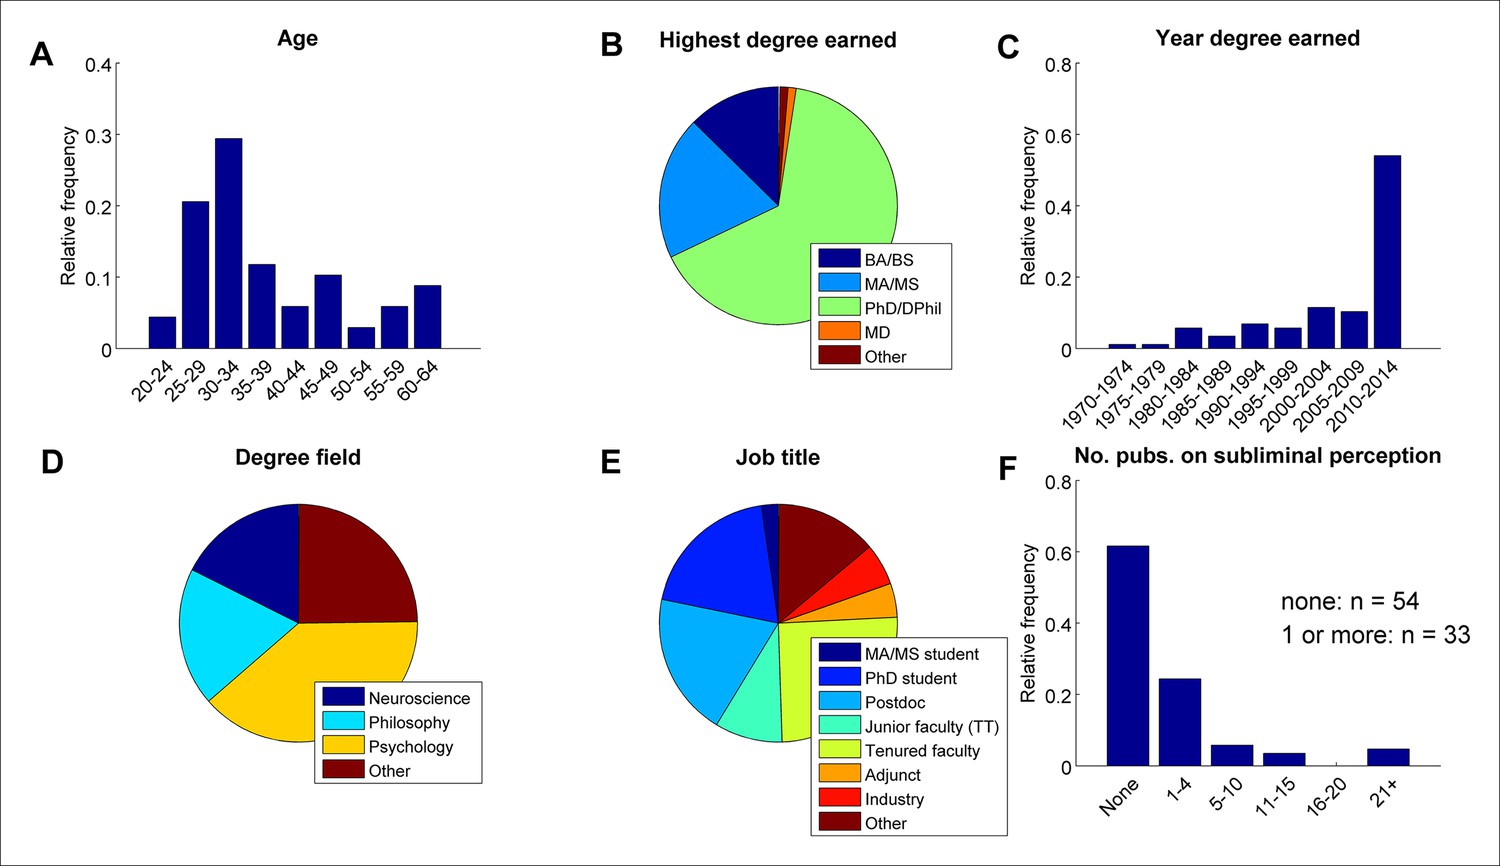
Demographics of survey respondents (n = 87).
https://doi.org/10.7554/eLife.09651.010
Appendix 1—Figure 2
Answers to the three survey questions of interest.
(A) Most respondents reported believing that some forms of subliminal perception exists (Q1), and that specifically the subjective threshold for conscious awareness is above the objective threshold for direct discrimination (Q2). However, most respondents also reported that they did not think this phenomenon (Q2) had been convincingly demonstrated in the literature (Q3). (B) The pattern of results was similar for the subset of respondents who had at least one relevant publication.
Appendix 2—Figure 1
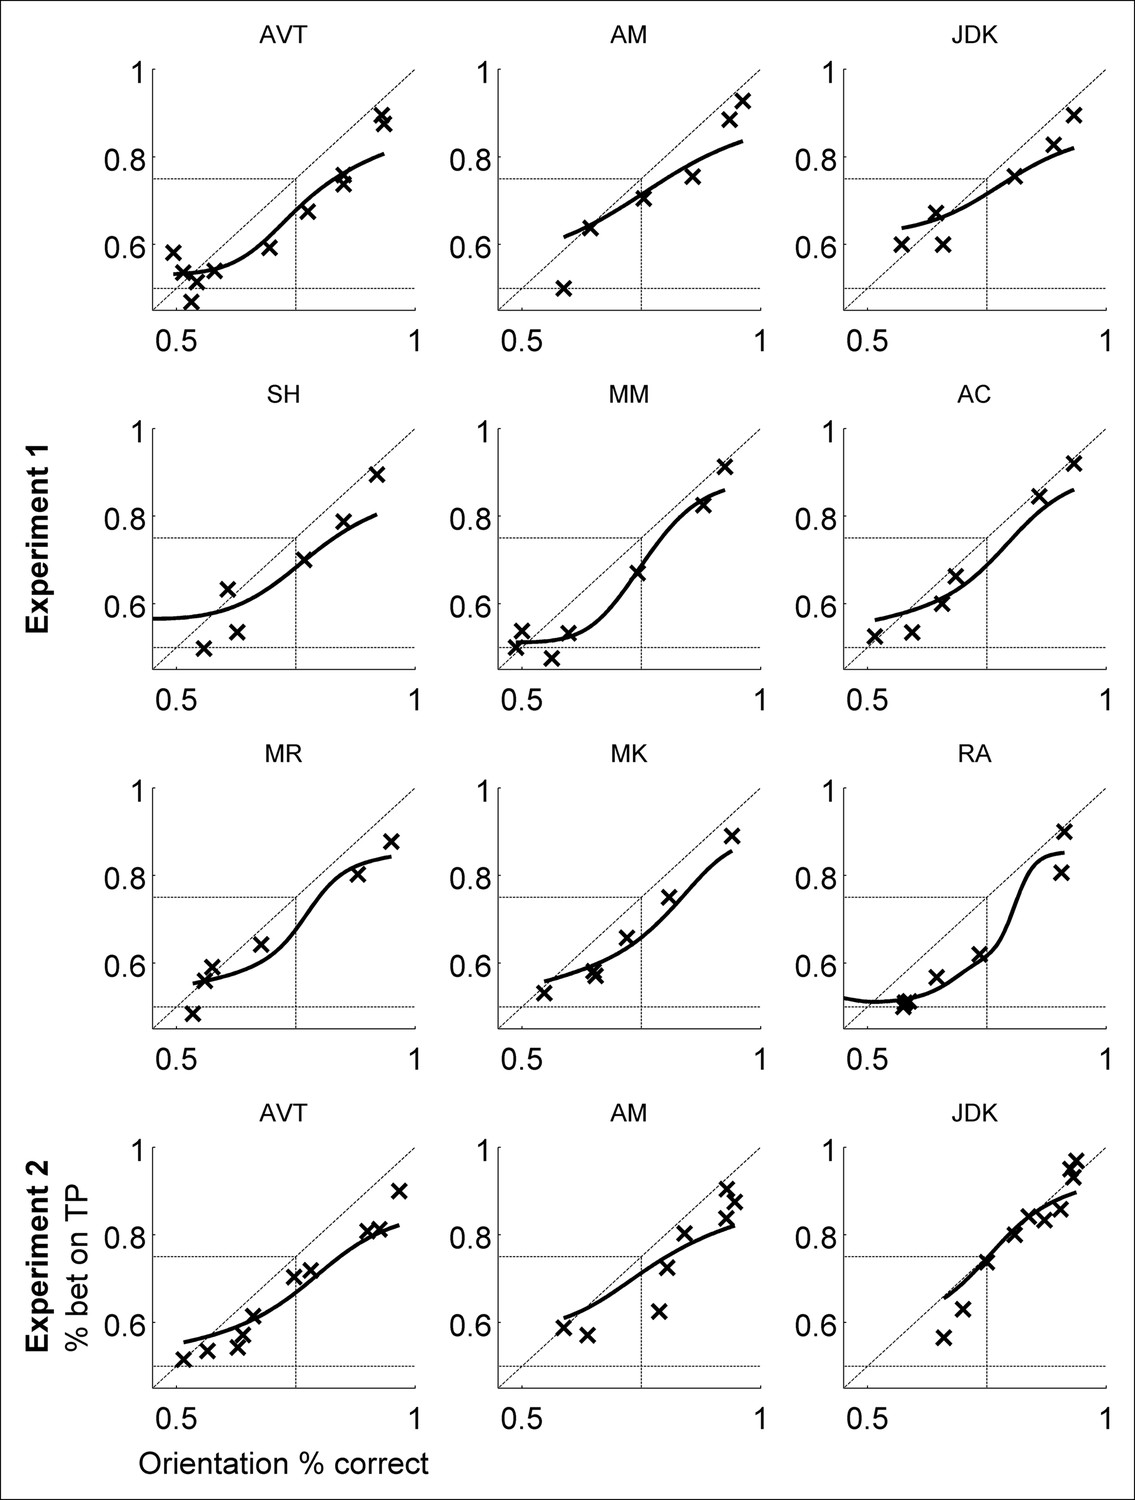
Individual subjects’ data for percent betting on target-present (TP) interval as a function of orientation discrimination percent correct.
Individual subjects’ data closely resembles grouped data: all subjects exhibited Performance > Awareness, but no subjects exhibited Performance without Awareness. The same three subjects participated in both Experiments 1 and 2.
Appendix 2—Figure 2
Individual subjects’ data for Type 2 hit rate (T2HR) and Type 2 false alarm rate (T2FAR).
Individual subjects’ data closely resembles grouped data. The same three subjects participated in both Experiments 1 and 2.
Appendix 2—Figure 3
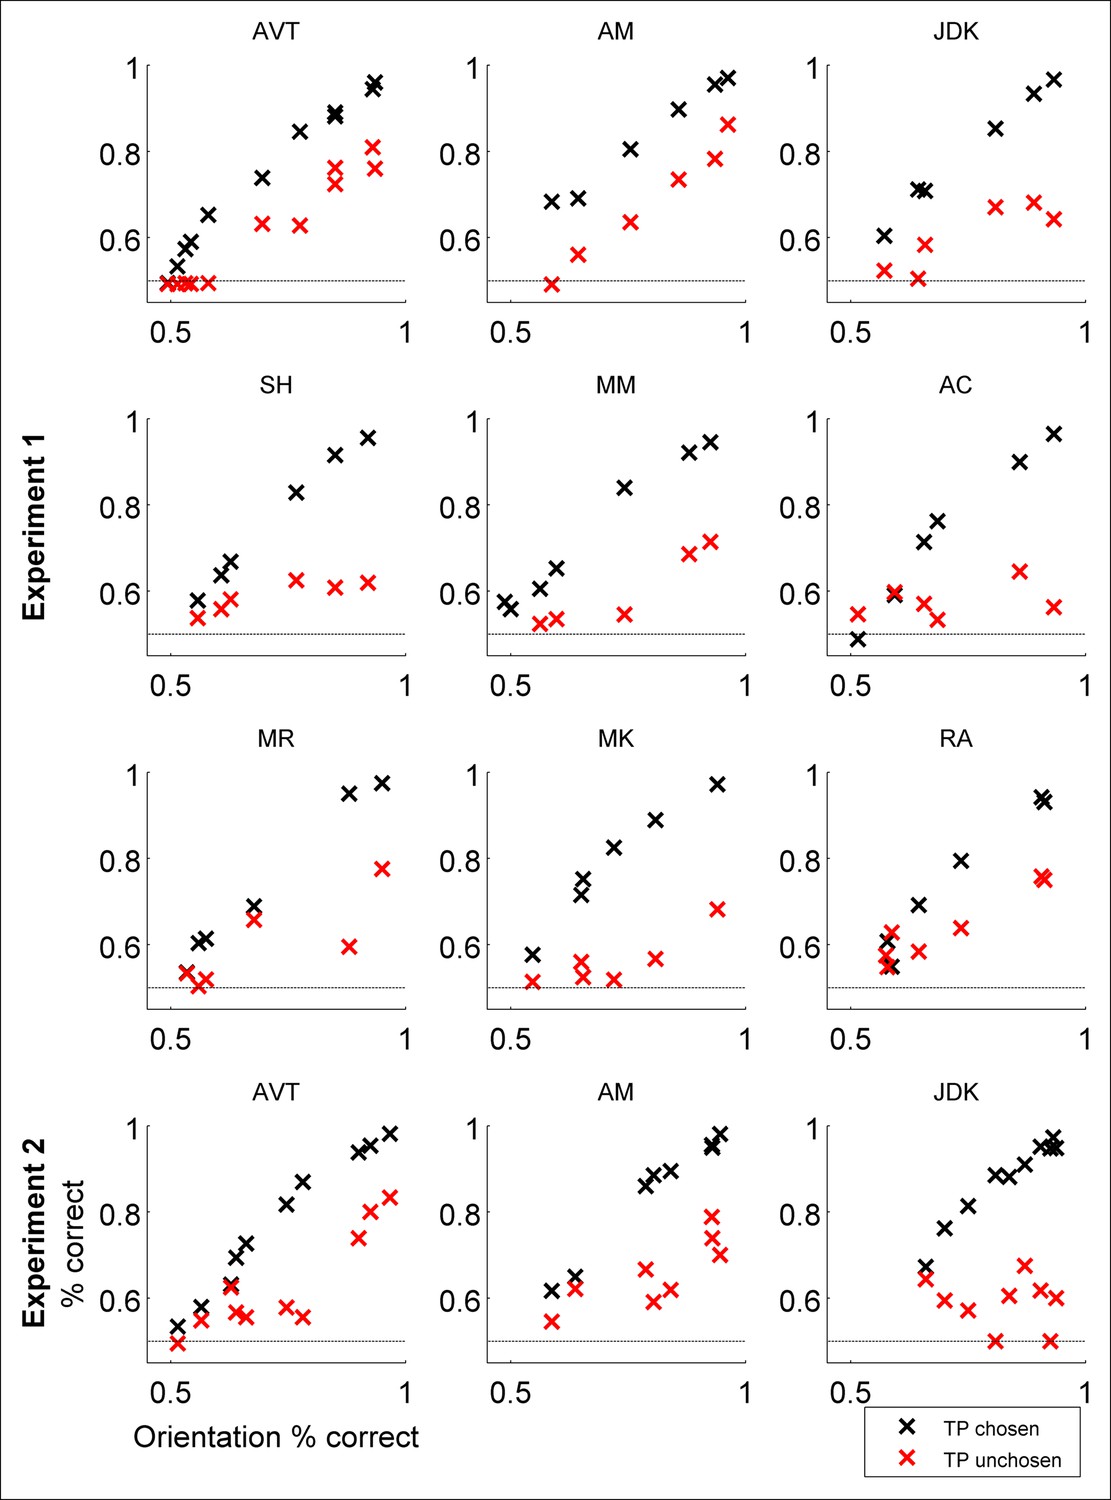
Individual subjects’ data for percent correct orientation discrimination conditional on having chosen to bet on the target-present (TP) interval or not.
Individual subjects’ data closely resembles grouped data.
The same three subjects participated in both Experiments 1 and 2.
Appendix 3—Figure 1

Results of control experiment.
Psychometric functions were fitted as in Experiments 1 and 2 (see Materials and methods — Statistical analyses).Group data is representative of individual subjects’ responses (left panel versus right three panels). As before, subjects displayed behavior inconsistent with Performance without Awareness. If anything, participants were able to bet on the target-present interval more often when the interval judgment was one of detection rather than Type 2 or metacognitive assessment of the correctness of the Type 1 discrimination. However, this should not be taken to indicate ‘supra-optimal’ behavior with reference to the ideal observer model of confidence, as the task here is not confidence but a task akin to 2IFC detection, meaning it would require a different computational analysis for assessment of optimality.
Appendix 4—Figure 1
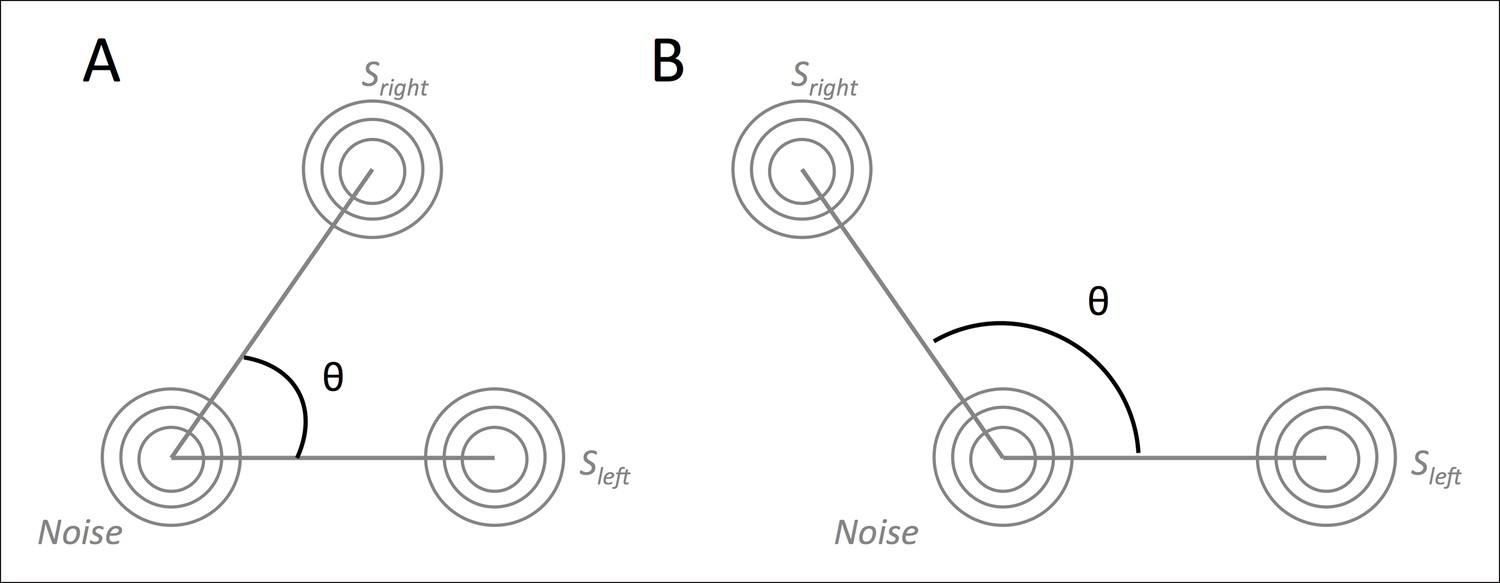
Graphical intuition of correlated stimuli (A) and anti-correlated stimuli (B).
https://doi.org/10.7554/eLife.09651.017
Appendix 5—Figure 1
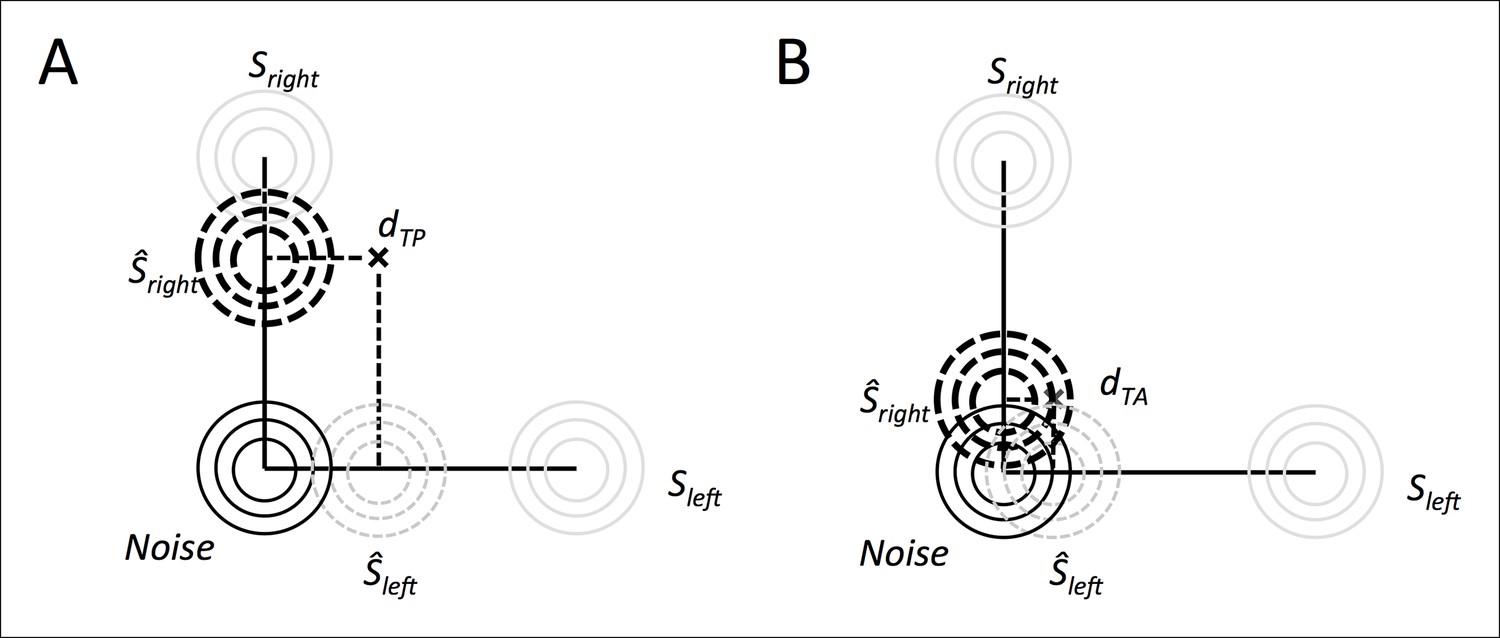
Illustration of the hierarchical inference process.
The observer first makes a best guess about the most likely contrast to have given rise to the evidence it is seeing, and then uses that inferred contrast evidence level to conduct the rest of the inference process. It does this for both the target-present interval (A) and the target-absent interval (B).
Appendix 5—Figure 2
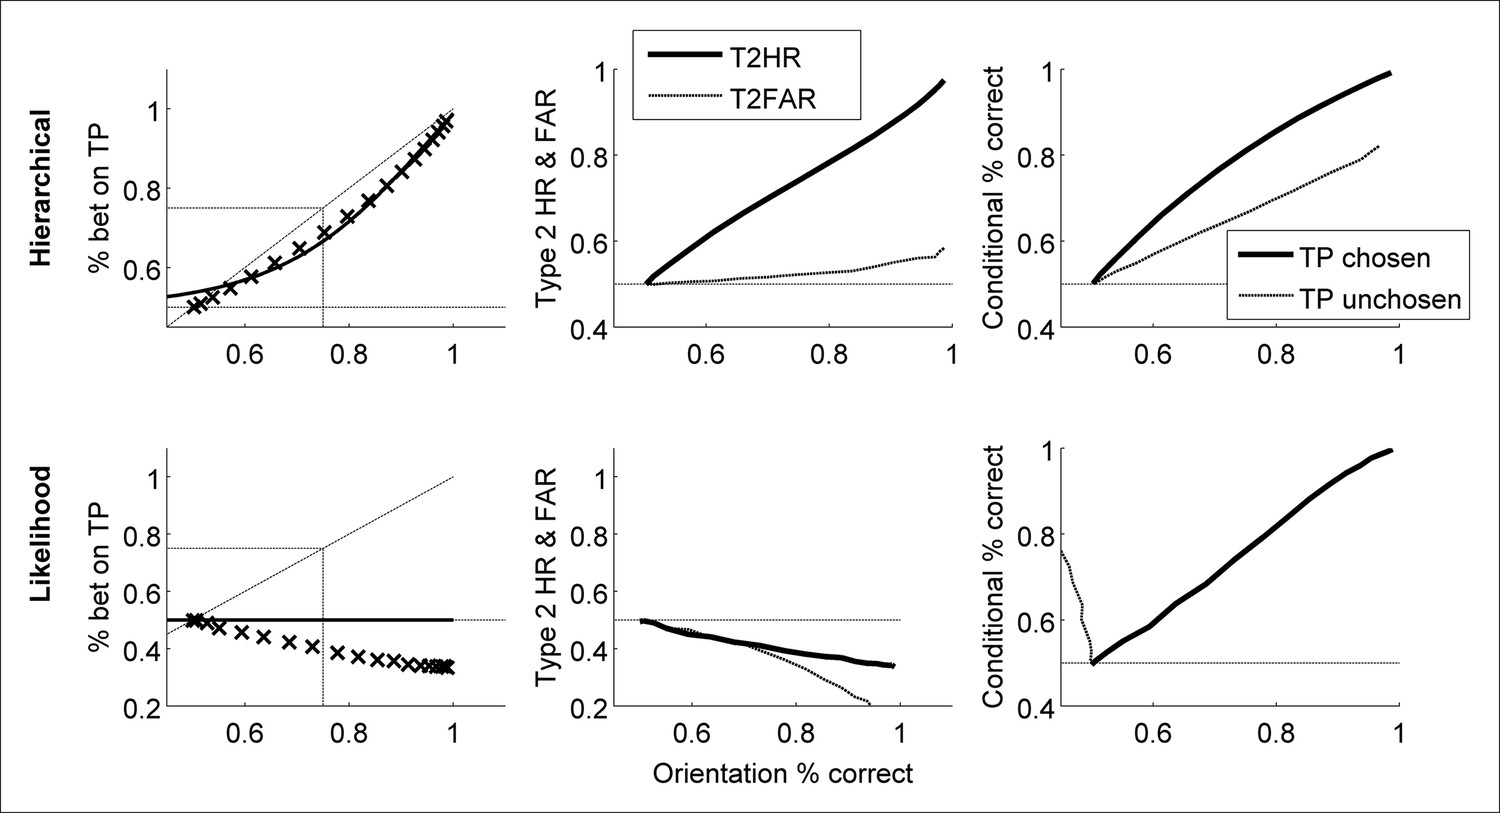
Sample of predicted behavior from Alternative Models 1 (Heuristic - hierarchical Inference) and 2 (Heuristic - likelihood comparison) (at θ = 90º; see above).
While the hierarchical observer produces behavior similar to the ideal observer, the likelihood comparison strategy does not.
Tables
Table 1
Individual values, means, standard deviations, and p-values for t-tests showing that Performance > Awareness occurs across both experiments. Results from Experiment 2 show that the pattern does not change with different question order or feedback.
| Expt | Subject | p(choose TP interval) at p(correct) = 0.75 | |
|---|---|---|---|
| 1 | 1 | AVT | 0.676 |
| 2 | AM | 0.714 | |
| 3 | JDK | 0.716 | |
| 4 | SH | 0.682 | |
| 5 | MM | 0.684 | |
| 6 | AC | 0.685 | |
| 7 | MR | 0.674 | |
| 8 | MK | 0.658 | |
| 9 | RA | 0.619 | |
| 2 | 1 | AVT | 0.666 |
| 2 | AM | 0.713 | |
| 3 | JDK | 0.746 | |
| Mean (σ) | 0.686 (0.033) | ||
| t(11) | 6.718 | ||
| p | 0.00003 | ||
Table 2
R2 values quantifying goodness of fit for ideal observer (σd = 0) and three alternative decisional noise magnitudes (σd >0) which cause increasing degrees of Performance without Awareness. Decisional noise greater than 0 – i.e., increased level of Performance without Awareness – causes a drop in goodness of fit between model and human data. See Methods and Appendix 4 for more details.
| Expt | Subject | Decisional noise σd | ||||
|---|---|---|---|---|---|---|
| 0 (Ideal observer) | 0.1 | 0.2 | 0.3 | |||
| 1 | 1 | 0.465 | 0.459 | 0.456 | 0.447 | |
| 2 | 0.580 | 0.578 | 0.565 | 0.544 | ||
| 3 | 0.470 | 0.464 | 0.448 | 0.428 | ||
| 4 | 0.396 | 0.392 | 0.381 | 0.363 | ||
| 5 | 0.649 | 0.655 | 0.645 | 0.628 | ||
| 6 | 0.480 | 0.473 | 0.458 | 0.434 | ||
| 7 | 0.453 | 0.452 | 0.444 | 0.427 | ||
| 8 | 0.602 | 0.595 | 0.583 | 0.563 | ||
| 9 | 0.503 | 0.509 | 0.512 | 0.504 | ||
| 2 | 1 | 0.624 | 0.624 | 0.622 | 0.612 | |
| 2 | 0.783 | 0.780 | 0.775 | 0.766 | ||
| 3 | 0.777 | 0.778 | 0.767 | 0.753 | ||
| Mean R2 (σ) | 0.565 (0.126) | 0.563 (0.128) | 0.555 (0.129) | 0.539 (0.131) | ||
Appendix 2–Table 1
Mean value of criterion for each subject, demonstrating that subjects did not display biases to say ‘left’ versus ‘right’ in the orientation discrimination task.
| Experiment | Subject | c |
|---|---|---|
| 1 | 1 | 0.047 |
| 2 | 0.074 | |
| 3 | -0.039 | |
| 4 | -0.029 | |
| 5 | -0.013 | |
| 6 | -0.030 | |
| 7 | 0.0267 | |
| 8 | -0.039 | |
| 9 | 0.003 | |
| 2 | 1 | 0.229 |
| 2 | 0.004 | |
| 3 | 0.035 | |
| Mean (σ) | 0.022 | |
| t(11) | 1.04 | |
| p | 0.3215 | |
Download links
A two-part list of links to download the article, or parts of the article, in various formats.
Downloads (link to download the article as PDF)
Open citations (links to open the citations from this article in various online reference manager services)
Cite this article (links to download the citations from this article in formats compatible with various reference manager tools)
Human observers have optimal introspective access to perceptual processes even for visually masked stimuli
eLife 4:e09651.
https://doi.org/10.7554/eLife.09651


